


- Optimization of process parameters in underwater friction stir welding of AA8011-SiC composites using mcdm techniques
V. Vimalaa,*, B. Ashok Kumarb, N. Viswanathanc and S. Mayakannand
aAssistant Professor, Department of Robotics and Automation, Erode Sengunthar Engineering College, Perundurai, Tamilnadu, India - 638057
bProfessor, Department of Mechanical Engineering, Nandha Engineering College, Perundurai, Erode, Tamilnadu, India – 638052
cAssistant Professor, Department of Mechanical Engineering, Nandha College of Technology, Perundurai, Erode, Tamilnadu, India – 638052
dAssociate Professor, Department of Mechanical Engineering, Rathinam Technical Campus, Coimbatore, Tamilnadu, India – 641021This article is an open access article distributed under the terms of the Creative Commons Attribution Non-Commercial License (http://creativecommons.org/licenses/by-nc/4.0) which permits unrestricted non-commercial use, distribution, and reproduction in any medium, provided the original work is properly cited.
This study focuses on optimizing the underwater friction stir welding (UFSW) process parameters for AA8011 reinforced with 5 wt% silicon carbide (SiC) particles. The primary goal is to enhance the mechanical properties of the weld joints by systematically investigating the influence of rotating speed (A), traverse speed (B), and tool pin profile (C). The experimental setup utilized a Taguchi L9 orthogonal array, and optimization was performed using multi-criteria decision-making (MCDM) techniques, specifically MEthod based on the Removal Effects of Criteria (MEREC) and Measurement of Alternatives and Ranking according to COmpromise Solution (MARCOS). Mechanical properties such as tensile strength (TS), hardness (HV), and impact strength (IS) were evaluated alongside microstructural analysis. The ideal welding parameters—1000 rpm rotational speed, 20 mm/s travel speed, and hexagonal tool pin—were determined using MCDM approaches (MEREC and MARCOS), resulting in a maximum tensile strength of 108.88 MPa, hardness value of 98, and impact strength of 10 J. ANOVA indicated that the tool profile was the most significant factor, accounting for 81.44% of the joint quality, followed by rotational speed at 13.19% and traverse speed at 4.69%. Microstructural analysis revealed enhanced grain refinement and uniform material flow under optimal conditions, contributing to the improved mechanical performance. The findings underscore the critical role of parameter optimization in achieving high- performance weld joints and demonstrate the effectiveness of UFSW for producing durable and reliable composite materials. These insights provide a valuable foundation for advancing welding practices in aerospace, marine, and automotive industries.
Keywords: Underwater friction stir welding, Tool profiles, MEREC, Tensile strength, Hardness.
Underwater friction stir welding (UFSW) is an advanced variation of the conventional friction stir welding (FSW) technique, where welding is conducted in a submerged environment. This technique entails the rotation of a non-consumable tool that produces frictional heat to plastically bend and join metal workpieces, especially aluminum alloys, without causing them to melt. Conducting FSW underwater enhances cooling rates, allowing for better control over the heat-affected zone, which minimizes thermal distortion, residual stress, and defects in the weld joint. UFSW is particularly advantageous for welding temperature-sensitive materials, as it results in improved mechanical properties, refined grain structure, and increased weld strength, making it ideal for high- performance applications in aerospace, marine, and automation industries.
The dissimilar joints were made from AA6082 and AA8011 aluminum alloys, joined initially through FSW and further processed underwater using cylindrical threaded (TP1) and triangular fluted (TP2) pin profiles for microstructural and mechanical enhancements [1]. The AA6082 and AA8011 aluminum alloys were joined using TIG welding before undergoing underwater multi-pass friction stir processing (MFSP), with water reserved at atmospheric temperature to refine grains and adjust mechanical properties [2]. The optimized FSW settings for AA2219 and AA2014 resulted in elevated TS, yield strength, and elongation, characterized by finer grains and enhanced bonding in the stir zone, while micro-hardness was comparable to that of the parent material on the retreating side. SEM analysis showed mixed ductile-brittle fracture, and EDS and XRD confirmed copper-rich GP zones and Al₂Cu intermetallic phases [3]. The FSW process on AA6061-T6 produced weld joints with 91.3% joint efficiency, optimizing tensile and hardness strengths. The rotational and traverse speeds were significant parameters, enhancing the quality criteria at a 99% confidence level [4]. For AA5083 alloy, TS and HV were found to rise with rotating speeds from 1000 to 1400 rpm and traversal speeds from 30 to 40 mm/min. ANOVA analysis indicated the major impact of these factors on the joint's mechanical characteristics [5]. The research examined the influence of tool rotational velocity and intermetallic compounds in AZ91C Mg–AA6061 Al alloy joints produced using friction stir welding (FSW). This mechanical interlocking enhanced tensile strength. The joint attained a maximum tensile strength of 242 MPa, representing 78% of the TS of the AA6061 aluminum parent metal (310 MPa) [6]. This study utilized various tool rotational speeds (800–1600 rpm) to weld AZ80A-Mg and AA6061-Al alloys by FSW. A RS of 1200 rpm yielded optimum conditions, facilitating dynamic recrystallization and fine- grained microstructures in the stir zone. The joint manufactured at 1200 rpm demonstrated a TS of 224 MPa, equating to approximately 77.78% of the AZ80A TS and 72.26% of the AA6061 TS. The fractures exhibited brittleness, characterized by rift-like patterns, commonly found in the thermo-mechanically impacted zone and nugget zone, where structures had amalgamated [7].
WEDM was used to optimize surface roughness in an A413 aluminum composite reinforced with magnesium. The random forest regressor technique yielded a minimal surface roughness of 0.229 µm at 10.5 wt% magnesium with appropriate WEDM parameters at 6 A current, 115 µs pulse duration, 60 µs pulse interval, and 8 N wire tension [8]. WCEDM was studied for improving surface texture in AA8011 aluminum composites reinforced with varying ZrO₂ content. Utilizing a Taguchi L16 orthogonal array, it was determined that reinforcement, pulse current, pulse-on time (Ton), pulse-off time (Toff) of 5 wt% ZrO₂, 6 A, 110 µs and 50 µs, respectively, effectively eliminated surface roughness. ANOVA results indicated that reinforcement percentage was the most significant factor affecting surface roughness [9]. WEDM factors were enhanced for machining SiC-TiO₂- LM25 Al alloy composite, focusing on cutting speed (CS). Using an L9 orthogonal array, it was found that 8 h ageing, 2 µs Ton, and 2 mm/s wire feed rate (WFR) yielded maximum CS, with ANOVA showing ageing duration as the most impact factor, followed by WFR and Ton. [10]. The FSP technique was functional to AA6082-AA8011 TIG-weld joints under normal and submerged conditions, showing significant grain refinement and increased tensile strength in submerged FSP. Submerged joints had improved ductility and microhardness, with ductile failure mode observed in all specimens [11]. Multiple-pass FSP on AA8011–AA6082 joints was performed under normal and submerged conditions. Submerged FSP achieved 67.72% finer grain structure, resulting in a 3.2% increase in ultimate tensile strength and higher hardness compared to normal FSP joints [12].
To mitigate corrosion in aluminum alloys for automotive and maritime applications, AA6061 and AA8011 FSW joints were exposed to salt spray and immersion testing in acidic and alkaline solutions. The findings demonstrated that the weld zone exhibited superior corrosion resistance relative to the base metals, especially in saline environments [13]. ANOVA analysis in this study determined the influence and contribution of processing factors on mechanical characteristics assisting in the optimizing of FSW parameters for AA6061 and AA8011 joints [14]. ANOVA combined with Taguchi’s design, identified weld speed as the most significant factor affecting mechanical properties for alloy combinations AA7475+AA8011 and AA8011+AZ31B, guiding parameter optimization in FSW. The square pin profile provided effective stirring and produced a high tensile strength of 181 MPa at optimized parameters: 1100 rpm (A) and 60 mm/min
(B) welding speed for AA5052/AA6061 dissimilar alloy joints [16]. The comparative study showed that A is a critical factor, particularly for cylindrical and square tool profiles, in achieving optimal tensile strength in AA8011 and AZ31B alloy joints [17]. Studied FSW of dissimilar aluminum alloys AA5754 and AA6061, optimizing process parameters for improved mechanical properties. ANOVA and RSM were used to identify optimum criteria for maximal tensile properties and hardness [18]. Investigated friction welding (FSW) of LM25 aluminum alloy reinforced with varying percentages of zirconium dioxide (ZrO₂) using stir casting. Mechanical tests showed improved tensile, hardness, compression, and impact strength with increasing ZrO₂ content. Microstructural analysis using SEM confirmed enhanced weldability and strength in the welded zone.
The study proposed a robot selection process for Vietnamese welding enterprises using two MCDM method, each combined with two MEREC variants. MEREC was applied to assess the impact of adding or removing criteria on the ranking stability, ensuring a consistent ranking order without alternative shuffle [20]. In selecting the optimal welding robot among seven models, the study applied MARCOS and PSI methods, using MEREC alongside EQUAL, ROC, and RS methods to calculate criteria weights.
MEREC provided an effective basis for evaluating the influence of each criterion, confirming the stability of the best robot choice (MA3120) across all ranking methods [21]. In optimizing the WAAM-CMT process for SS308L stainless steel, the MARCOS method, integrated with fuzzy AHP, was used to evaluate the optimum settings for processing factors, highlighting the significance of weld speed, current, and flow rate of gas on multiple mechanical characteristics [22]. In order to optimize resistance spot welding parameters for dissimilar lap joints of 50HS stainless steel and AA1200, MARCOS-based Taguchi methods were implemented. The welding current was the most important factor influencing diameter of nugget and tensile-shear strength, as evidenced by the results of the following experiments [23]. COMSOL modeling of AA7075-T6 alloy FSW found maximum heat generation with a square tool pin due to maximum shoulder contact, while hexagon and pentagon profiles showed varied temperature and strain effects [24]. The RSM-MDE method optimized FSW parameters for maximum tensile strength, with a hexagon-tapered profile, A of 1417 rpm, and B of 60 mm/min, achieving a TS of 294.84 MPa [25]. VaNSAS optimization for FSW of SSM ADC12 aluminum found a hexagon tool pin profile, 2200 rpm (A), and 108.34 mm/min (B) yielded a TS 3.67% higher than the RSM parameters [26]. A square tool profile at 750 rpm rotating speed with a 5 kN axial load achieved a high Tensile strength, Hardness of 124.3 MPa and 98.11HV in AA6061 with 9 wt.% SiC composites [27]. Several optimization techniques and decision making techniques are used for the determination of optimal process parameters while machining [15, 19, 28, 35, 36].
This research addresses research gaps by employing the MEREC and MARCOS methodologies for parameter optimization, specifically investigating the impact of hexagonal tool pin profiles on welding performance. Although previous studies have examined alternative tool geometries, there is a lack of study on the comparative efficacy of different profiles utilizing recent multi-criteria decision-making (MCDM) methodologies. This study systematically assesses hexagonal, square, and conical tool pin shapes in the UFSW process, utilizing H13 tool material to improve weld quality. The optimization technique evaluates critical input elements (A, B, and C) to attain enhanced welding strength. Subsequent to the friction stir welding process, the welded material is subjected to precise machining via a WEDM machine, ensuring adherence to ASTM requirements for tensile, impact, and hardness evaluations. A cross-sectional incision is made at the welded region of the AA8011 composite for microstructural examination. This study's findings enhance welding operations in aerospace, marine, and automotive sectors through enhancing tool pin profiles to increase mechanical qualities and weld integrity.
Materials
AA8011 is an aluminum alloy extensively utilized in applications necessitating corrosion resistance, including packaging, heat exchangers, and automotive components. It largely consists of aluminum, supplemented with iron and silicon, providing an excellent strength- to-weight ratio and formability. Submerged friction stir processing exhibited improved grain refinement, tensile strength, and microhardness relative to FSW, demonstrating superior performance compared to AA6063 and FSW joints, although inferior strength compared to AA6082. Table 1 displays the chemical composition of AA8011.
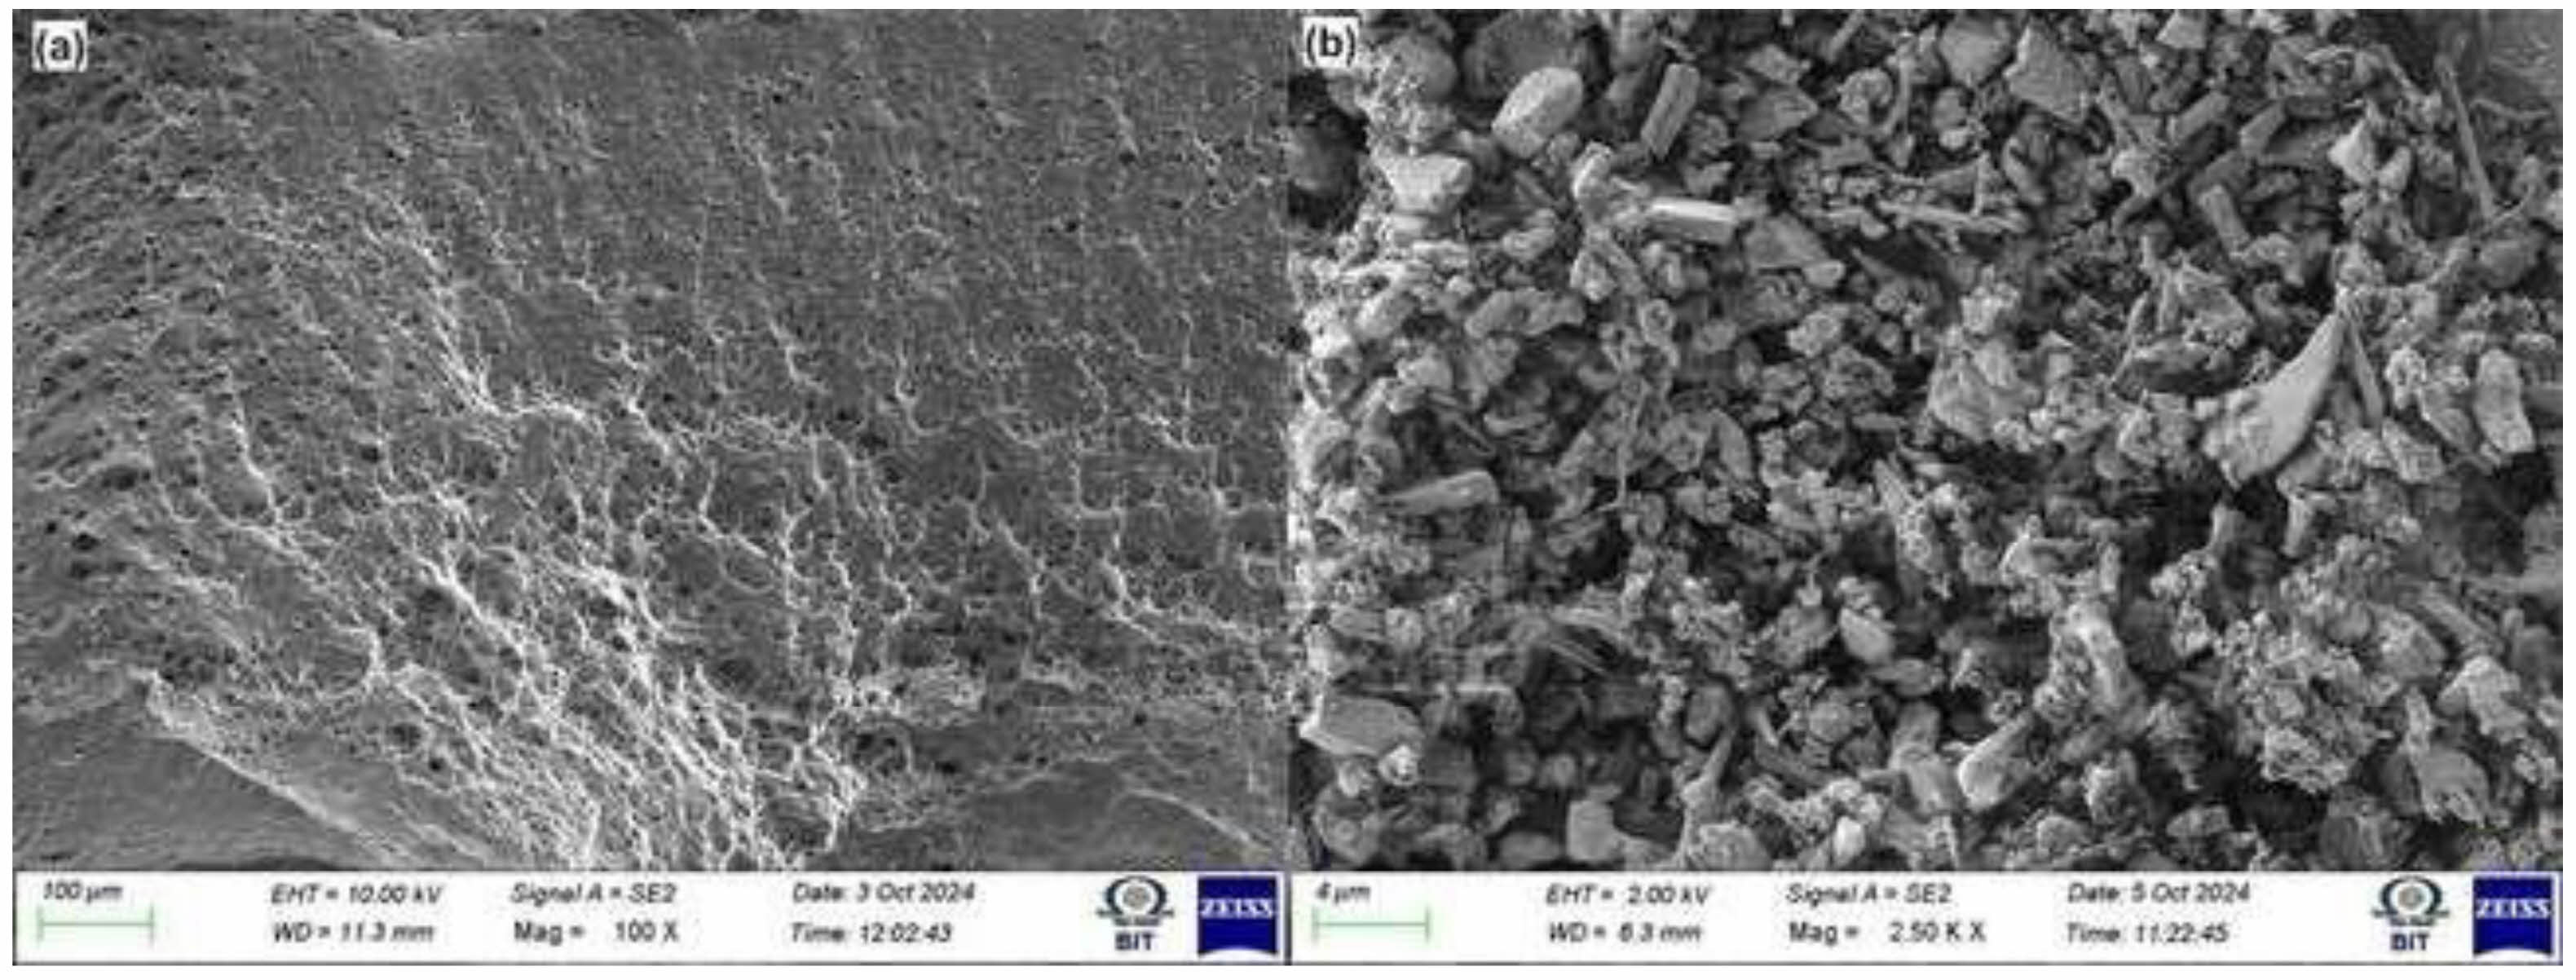
Silicon carbide (SiC) outperforms other reinforcing particles in AA8011 composites under UFSW by offering superior hardness, higher thermal conductivity, better strength-to- weight ratio, enhanced grain refinement, improved corrosion resistance, and cost-effective high performance, making it ideal for demanding applications compared to alternatives like alumina, tungsten carbide, or boron carbide. The selected 5% SiC for composite fabrication as it provides an optimal balance between enhanced mechanical properties (such as hardness and tensile strength) and process efficiency. This weight percentage ensures uniform dispersion within the matrix during the stir-casting process while minimizing issues like particle agglomeration or excessive tool wear. The study focused on optimizing welding parameters rather than varying SiC content. Including multiple weight percentages of SiC would have added experimental complexity and diverted attention from the primary objective of optimizing UFSW parameters for AA8011 composites. The stir-casting procedure was used to fabricate AA8011 matrix composites reinforced with SiC nanocomposites in an electric resistance muffle furnace. The typical diameter of the SiC particles was 400 mesh. The AA8011 and SiC nanoparticles were procured from Matrics enterprises, Kanyakumari, Tamil Nadu. Figure 1 shows the scanning electron microscopic images of AA8011 and SiC particles.
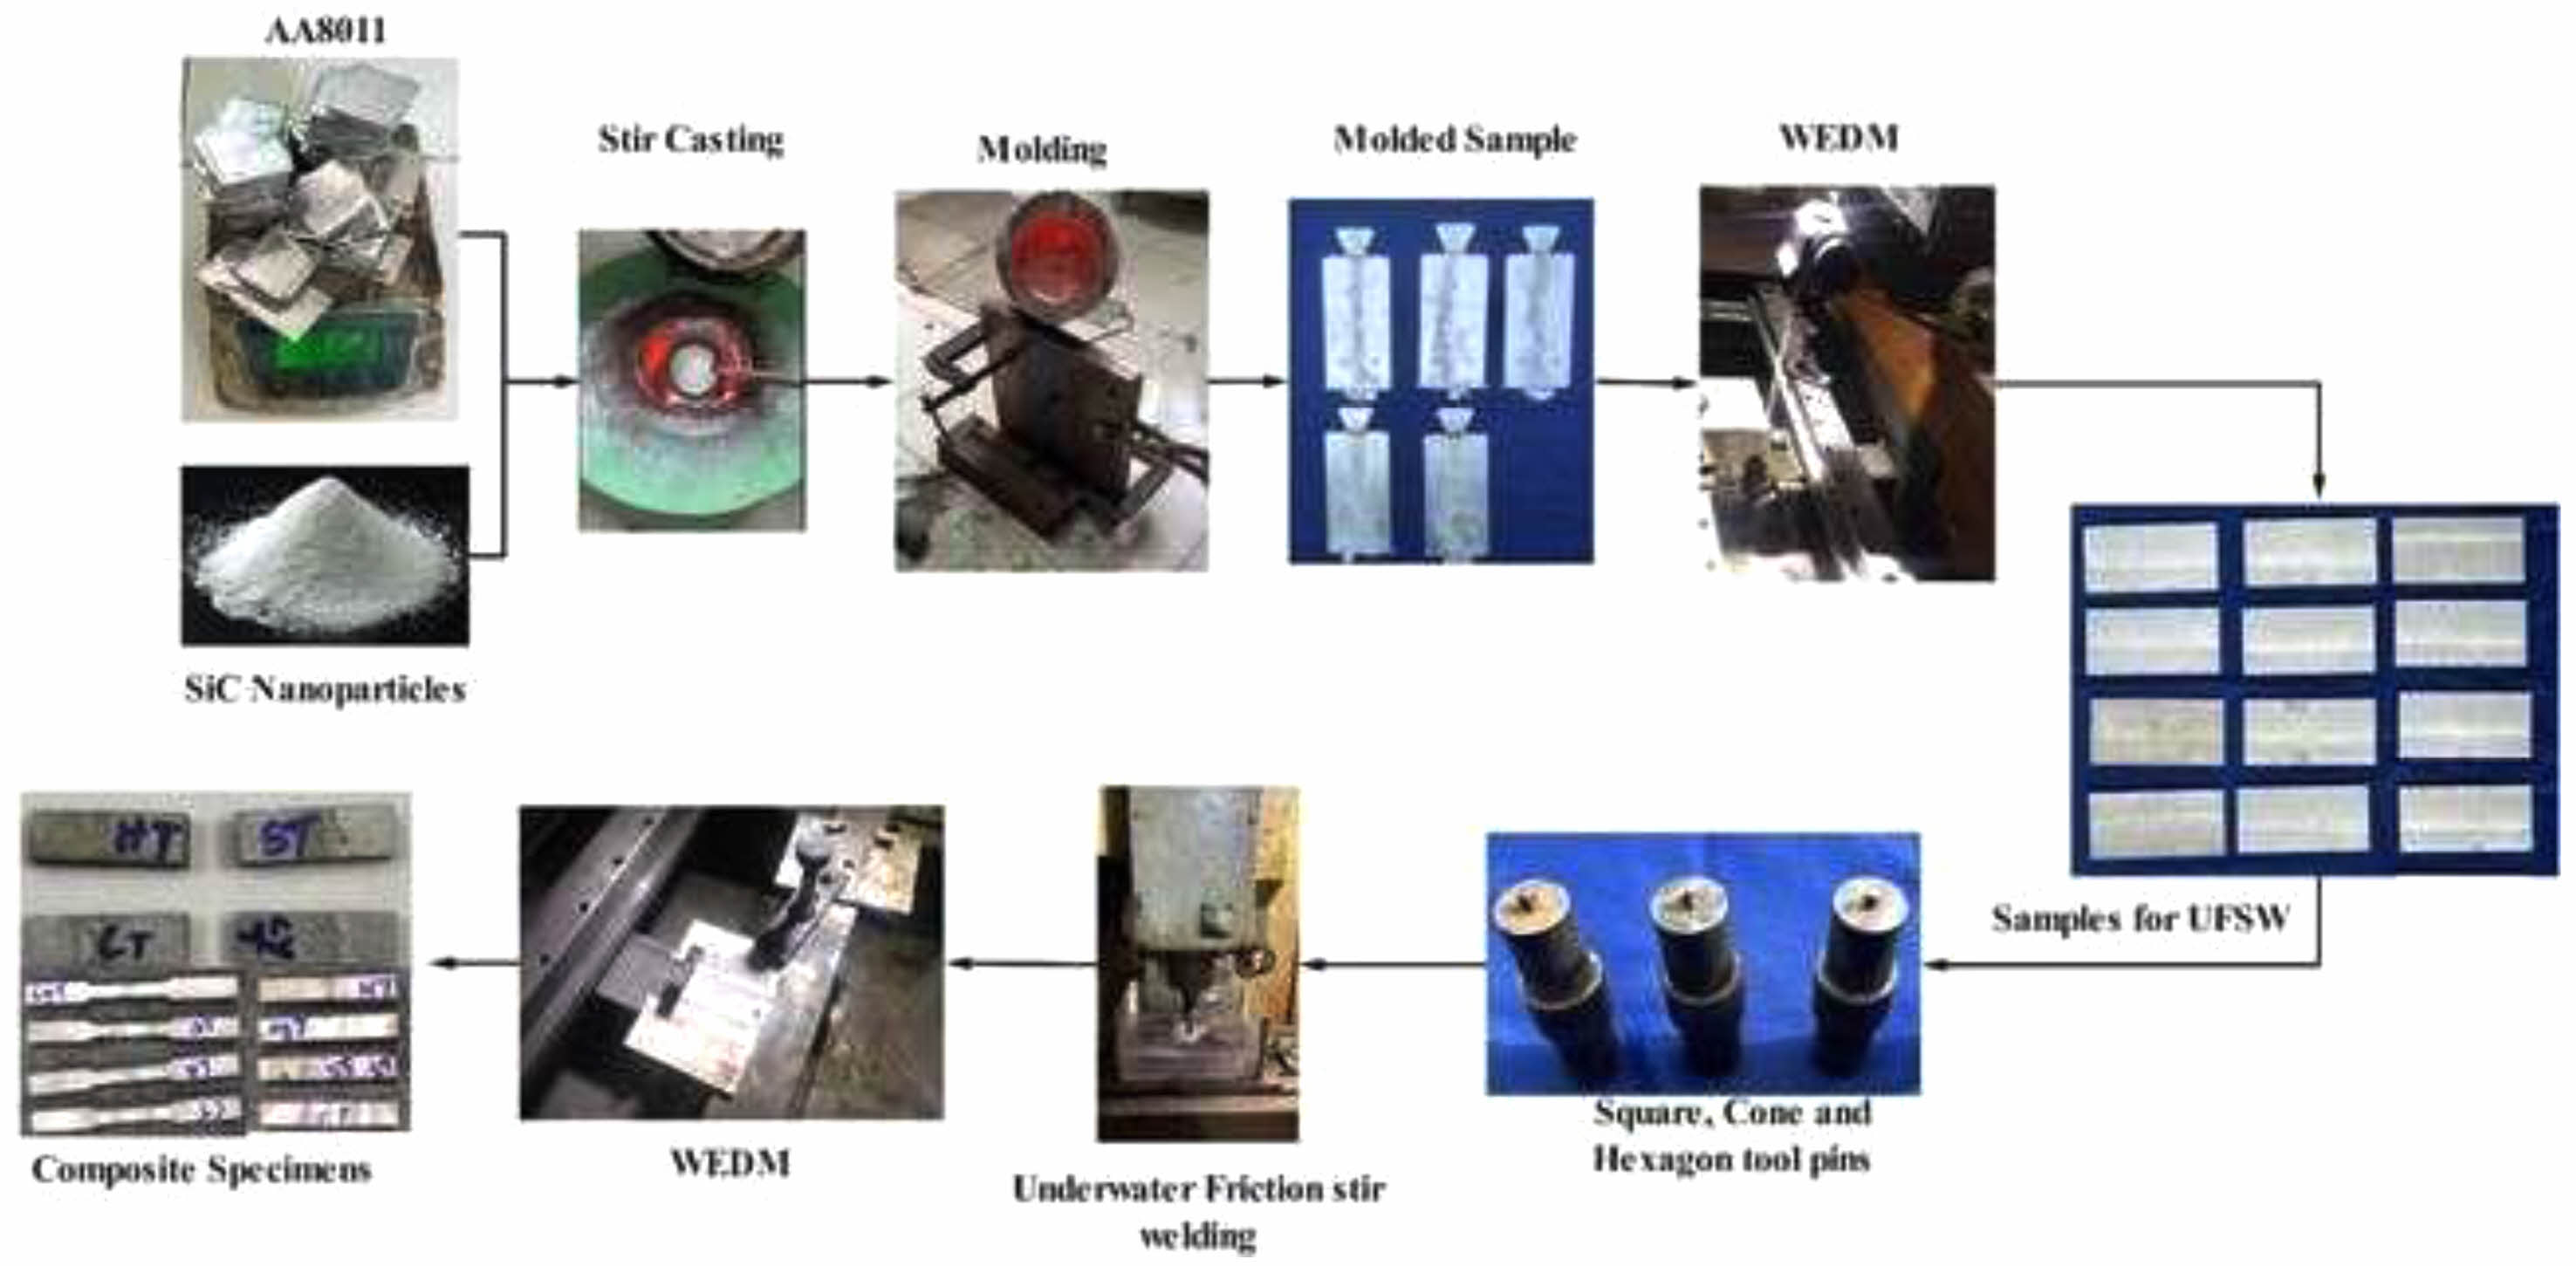
Figure 2 shows the fabrication process of composite sample. AA8011 strengthened with silicon carbide (SiC) nanoparticles composite by stir casting begins with the cutting of the AA8011 into small pieces. The alloy is melted in a crucible using a resistance furnace, maintaining a temperature of 720 °C. To ensure a high-quality melt, fluxes are added to remove impurities, and an inert gas such as argon is bubbled through the molten metal to eliminate dissolved hydrogen and reduce porosity. Simultaneously, SiC nanoparticles are preheated to 250 °C to remove moisture and improve their wettability with the molten aluminum (Fig. 2).
Once the matrix is fully melted and degassed, stirring is initiated using stainless steel stirrer, creating a vortex in the molten metal. The stirring process conducted at a speed of 300 rpm for 10 minutes to ensures uniform dispersion of the reinforcement. The preheated 5% SiC nanoparticles are gradually added into the vortex to prevent agglomeration and ensure homogeneous distribution within the matrix. The molten composite is then carefully poured into 300 mm 200 mm 5 mm mold.
The fabricated composite, initially molded into a rectangular plate was prepared for UFSW by cutting it into smaller specimens of dimensions 100 mm 50 mm 5 mm using Wire Electrical Discharge Machining (WEDM). The composite plate was firmly fixed on the WEDM machine, and the cutting parameters, including wire diameter (0.25 mm), feed rate, wire material (brass), and power settings, were optimized to suit the composite material.
Specification of H13 Tool
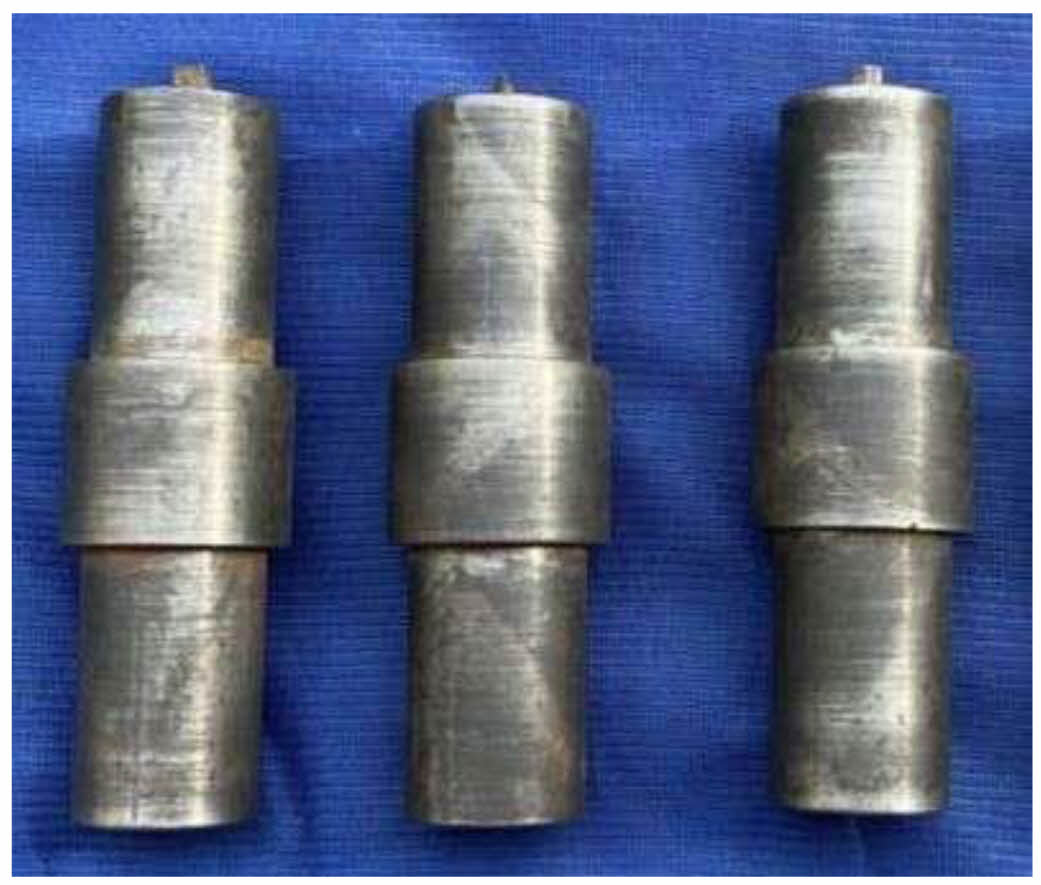
Table 2 illustrates the chemical composition of H13 tool steel. The UFSW procedure utilizes a surface-hardened tool composed of H13 steel. H13 tool steel was selected for its high thermal stability, wear resistance, and ductility, ensuring durability during high-speed operations. Its surface hardness minimizes tool deformation, contributing to consistent and effective material stirring during UFSW. Tool wear arises from the interaction between the workpiece and tool, particularly while the tool rotates at high speeds. The hardness of the H13 tool profile is enhanced by surface hardening, hence augmenting its wear resistance. A superior weld in the material is attained by the use of surface-hardened H13 steel. Square, hexagon, and cone are the tool profiles that are employed in this study. Fig. 3 shows the various tool pin profiles.
Process of Underwater Friction Stir Welding
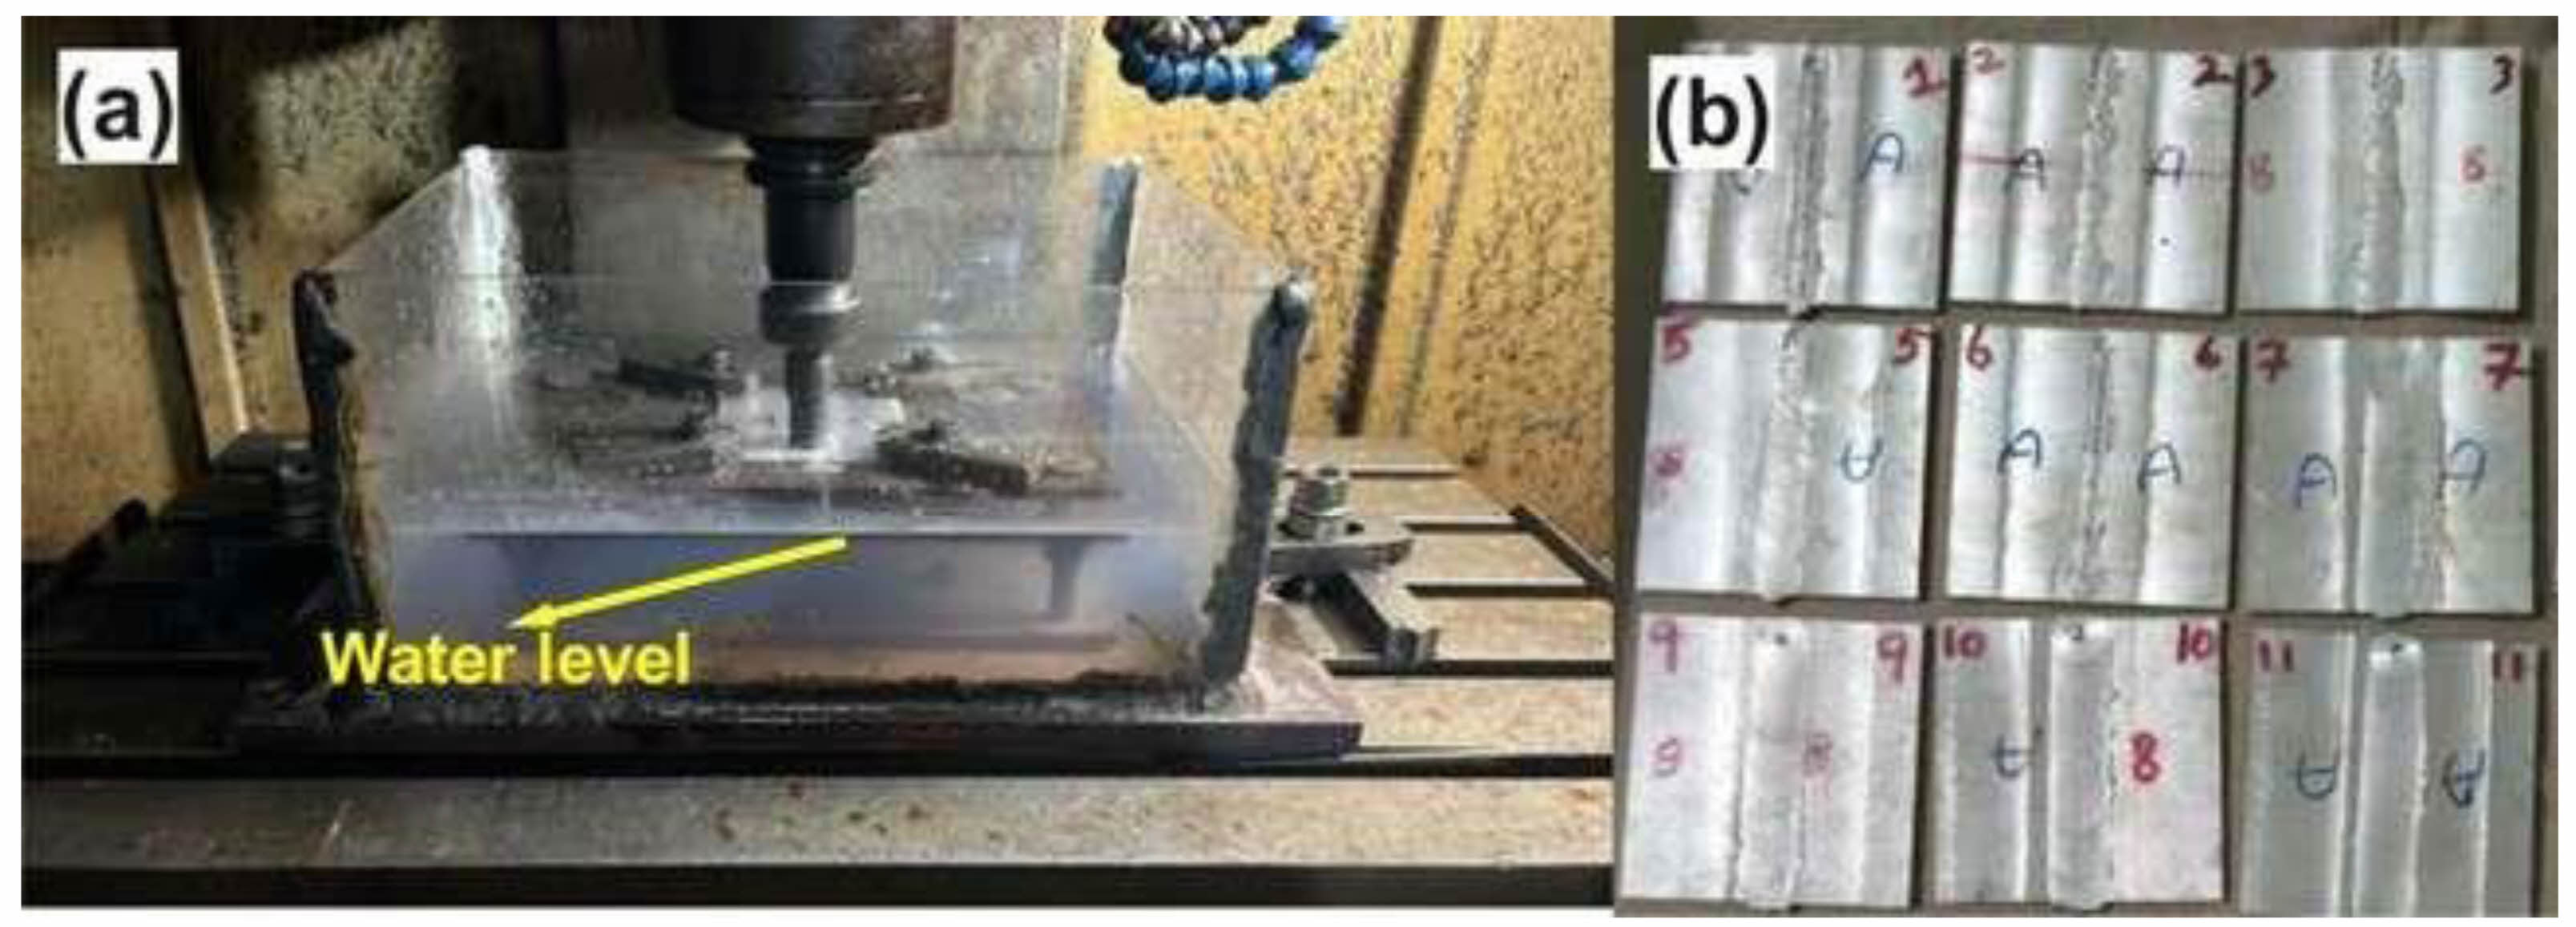
The prepared specimens (100 mm 50 mm 5 mm) were then subjected to UFSW, a process performed under a submerged environment to enhance thermal control and minimize the heat-affected zone (HAZ) (Fig. 4). The dimensions of the tank (fixture) utilized in the Underwater Friction Stir Welding (UFSW) method are 300 mm 300 mm, ensuring a regulated environment for the welding procedure. The tank holds 9 liters (9000 cm3) of water at a pressure of 981 Pa, essential for heat dissipation and thermal control during welding. The water regulates the temperature of the AA8011 plates, limiting excessive heat buildup and guaranteeing steady welding conditions. Furthermore, during UFSW, a pressure of 4 kN is exerted on the tool and plates, affecting material flow, heat generation, and weld quality. This pressure is crucial for providing adequate contact between the tool and the workpiece, facilitating appropriate material plasticization and the creation of defect-free welds. The interplay of tank dimensions, water volume, and applied pressure profoundly influences the cooling rate and mechanical characteristics of the welded joint. Four key welding parameters were carefully selected to optimize the welding process. Three different types of tool pins like cone, square, and hexagon were used in this work. The shoulder was made from 42CD4-treated medium-carbon steel, recognized for its excellent strength and toughness under heat and pressure. The tool pin, made of H13 steel was selected for its exceptional resistance to abrasion, ductility, hardness, and thermal stability, ensuring it remained intact under high heat and pressure during the welding process. To minimize defects in the welding zone and prevent material debris ejection, the FSW tool was angled at 1.5. This angle facilitated proper material flow under the tool’s arm, ensuring a seamless welding process. The design of the tool allowed for precise control over the axial force exerted during welding, further enhancing the quality of the weld.
The welded samples were prepared for mechanical testing by cutting it into standardized specimens as per ASTM guidelines using WEDM. The plate was securely mounted on the WEDM machine table, and the cutting process was programmed to produce test specimens in compliance with ASTM standards.
Analysis of Mechanical Properties
Samples for static tensile testing were prepared in accordance with the ASTM-E8M standard and were cut perpendicular to the weld joint line.
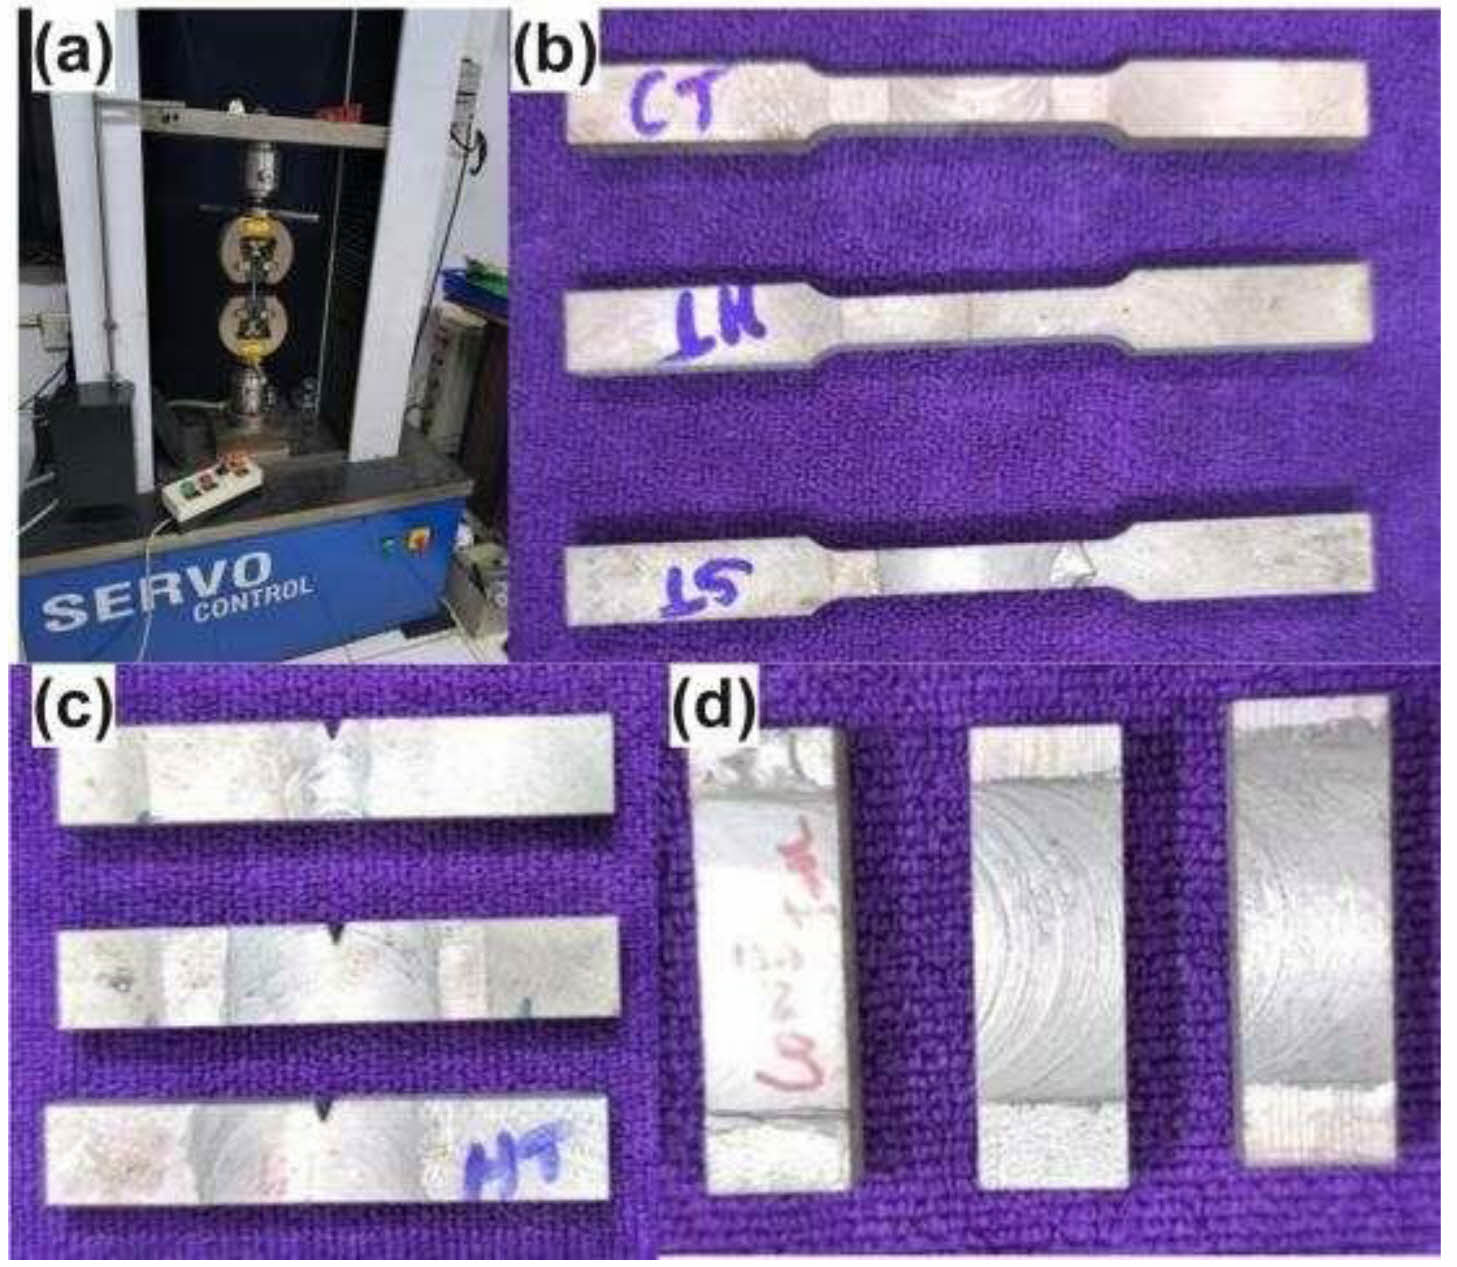
Testing was conducted on three samples for each welding factor. Optimum samples of specific parameter categories were chosen for comprehensive analysis. Fig. 5(a) shows the experimental arrangement of Universal testing machine and Fig. 5(b) shows the tensile test samples. Microhardness was assessed utilizing the FIE model VM50 VH tester. Hardness measurements were conducted at multiple sites on either side of the weld zone under a constant load of 0.8 kgf for a duration of 17 seconds. The authors selected a constant axial load to ensure uniform material flow and consistent heat generation during the welding process. Maintaining a constant load minimizes variations in the weld quality by ensuring stable penetration of the tool into the material and preventing defects like incomplete fusion or excessive flash. This approach helps achieve consistent mechanical properties and reduces experimental complexity, allowing the study to focus on optimizing other critical parameters such as rotational speed, traverse speed, and tool pin profile.
The hardness values were then classified as average microhardness. Fig. 5(c) shows the test specimen for microhardness. The composite specimen for microhardness is manufactured in accordance with the ASTM E92 Standard. The energy that a material absorbs prior to deformation and its capacity to withstand a rapid load are signified by its impact strength. The composite specimen for the impact strength test is created in compliance with the ASTM E23 Standard. The identical experiment is conducted on nine specimens, and the optimal value is documented. The composite is machined using EDM to meet the required dimensions according to ASTM requirements.
Microscopic Analysis
Microscopic examinations were facilitated by the proper preparation of materials utilizing metallographic preparation equipment. In preparation, the samples were cut perpendicular to the welding line by using WEDM, thereafter immersed in resin by hot insertion, and polished with 1200 grade sandpaper. The samples were etched using Kroll’s reagent, composed of 20 mL of water, 5 mL of nitric acid, 1 drop of hydrofluoric acid, and two drops of hydrochloric acid, with an etching duration of 15 seconds. Microscopic examinations were conducted to analyze the macrostructure of the acquired sample joints using a Celestron capture pro confocal laser microscope on a test stand.
The welding composite results in four distinct regions of Sample 8, as illustrated in Fig. 6. UFSW reduces the heat-affected zone compared to conventional welding, leading to stronger welds. The welding strength of AA8011 is determined by the welding factors for UFSW and the tool specifications. The tool pin profile used in this process impacts the material flow performance. The flow in this process is regulated by two mechanisms: the pin-generated flow and the shoulder-produced layer-by-layer flow. In general, the material transfer involves the retracting side (RS) and advancing side (AS). The transfer of material from the retraction side to the upper section of the AS, which is located on the surface, governs the material flow. Tool RPM and tool displacement are the two categories of tool velocities in the UFSW process. During this procedure, these constraints are considered.
Optimization
Taguchi Optimization
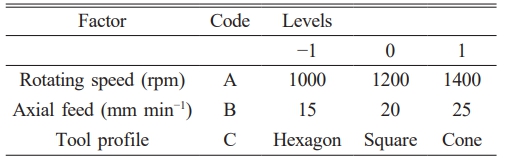
The Taguchi technique was employed to optimize the welding parameters. The primary variables, including the rotating speed (ranging from 1000 to 1400 rpm), the axial feed (ranging from 15 to 25 mm/min), and the tool profile (hexagonal, square, and cone), were manipulated at various levels. The Taguchi optimization technique was employed with nine trials to validate this experimentation, which involved three factors and three levels. This research intends to optimize the welding combinations. The minitab-20 program was utilized for the application. The elements and levels of the experimentation are displayed in Table 3.
In this context, ―i‖ represents the trial number, ―n‖ represents the number of results in the experiment, and yi represents the response for the ith trial.
The tilt angle of 1.5o and the axial load of 15 kN are maintained as constants. As determined by the Taguchi model design, Table 3 illustrates the most significant UFSW processing parameters that influence output result. A Taguchi experimental design is constructed with a total of nine experiments as shown in Table 4.
MEREC-MARCOS Optimization
The selected MEREC (Method based on the Removal Effects of Criteria) and MARCOS (Measurement of Alternatives and Ranking According to Compromise Solution) for optimization due to their robust multi-criteria decision-making capabilities. MEREC objectively evaluates the impact of removing criteria, ensuring accurate weight determination, while MARCOS ranks alternatives by considering both ideal and anti-ideal solutions. This combination allows for reliable identification of optimal welding parameters, enhancing the mechanical properties of AA8011 composites with computational simplicity and precision.
Method Based on the Removal Effects of Criteria (MEREC)
A technique for determining weights based on the implications of criterion elimination, distinguishing it from current methodologies that typically assess variance in alternative performance concerning criteria [29]. MEREC assesses the effects of eliminating criteria for weight allocation, in contrast to traditional methods. The procedure steps for weight evaluation using MEREC are outlined as follows:
Decision matrix. During this stage, a decision matrix is created to display the ratings or values of every possibility in relation to criteria. The elements that make up this matrix, which are represented by xij, must have values greater than zero. There needs to be a way to turn negative numbers in the decision matrix into positive ones. Consider this decision matrix as an example of an instance with n possibilities and m requirements:
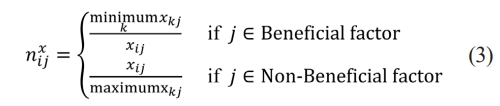
Normalization matrix (?). This phase utilizes fundamental linear normalization to modify the components of the matrix. The components of the normalized matrix are represented by nxiij.
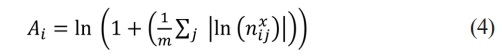
Evaluate the comprehensive performance of the substitutes, (Ai). To assess the overall performance of the alternatives, a log metric is employed with uniform criteria weightage. Based on the normalization values derived from the preceding phase, we can ascertain those lower values of (nxij) resulting in higher performance values (Ai). This computation employs the subsequent equation:
Evaluate the factor characteristics by excluding criteria. In this phase, we employ the logarithmic metric analogous to the preceding phase. The distinction between this step and Step 3 lies in the fact that the characteristics of the substitutes are assessed by individually excluding criteria. Consequently, we possess m sets of alternatives linked to m criterion. Let us designate by A' the whole characteristics of the ith substitute regarding the eradicate of the jth criteria. This formula is utilized for the computations in this step:
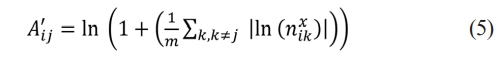
Calculate the sum of absolute deviations. Next, assess the removal impact of the jth criteria utilizing the data derived from Steps (iii) and (iv). Let Ej represent the impact of eliminating the jth criterion. Researchers may determine the values of Ej using the subsequent formula:

Ascertain the conclusive weightage of the criterion. Here, the objective weightage of each factor is determined by utilizing the effects of removal, denoted as (Ej), from prior step. In the subsequent text, wj denotes the weightage of the jth criteria. The subsequent formula is employed for the computation of wj [30]:
Measurement of Alternatives and Ranking According to Compromise Solution (MARCOS)
The MARCOS was proposed by authors [31] for the prioritization of healthcare suppliers. This is utilized to resolve diverse decision-making challenges owing to its simple computations.
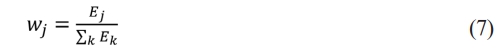
(vii) Decision matrix. The basic choice matrix
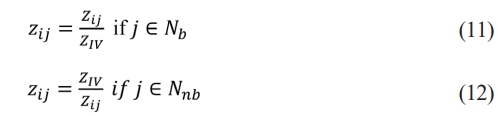
([zij]p×q), is augmented by including the anti-ideal value (AIV) and ideal value (IV), resulting in the following.
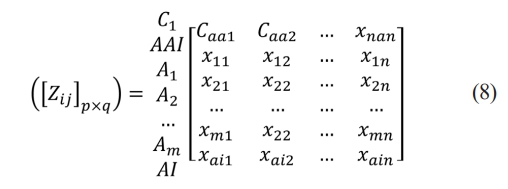
The IV and AIV are calculated using the subsequent equations.
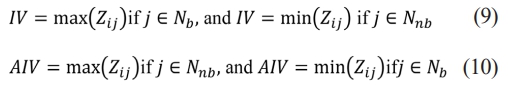
(viii) Normalization of matrix within the limits of 0 to 1 using the subsequent equations.
(ix) The weighted normalized decision matrix

(x) Computation of the summation of the weighted normalized matrix values utilizing the subsequent formula.

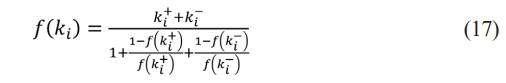
(xi) Assessment of the utility value of factors. The utility degrees for AIV and IV are calculated using the following formulae.
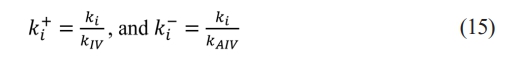
(xii) Regarding the AIV and IV, the utility functions are computed using the subsequent equations.
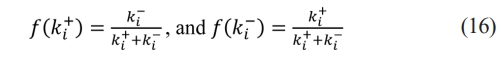
(xiii) The subsequent formula is employed to ascertain the ultimate utility function of alternatives.
(xiv) Evaluating ranking alternatives. The alternatives are prioritized from most favorable to least favorable based on declining values of (ki).
|
Fig. 1 SEM image of AA8011 and SiC particles. |
|
Fig. 2 Fabrication process of the composite specimens. |
|
Fig. 3 Types of tool profiles for UFSW (a) square, (b) Cone, and (c) hexagon. |
|
Fig. 4 (a) Experimental setup of underwater friction stir welding. (b) Welded samples. |
|
Fig. 5 (a) Universal testing machine and (b–d) test samples. |

|
Fig. 6 Macro-structure image of UFSW sample of different zone. |


Results on Tensile Testing
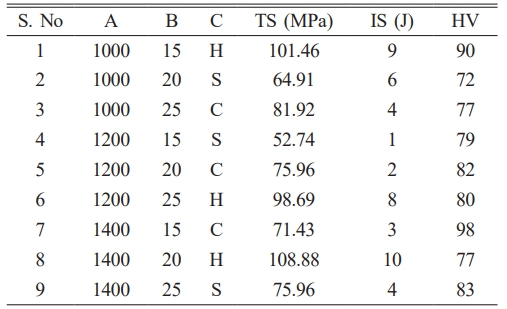
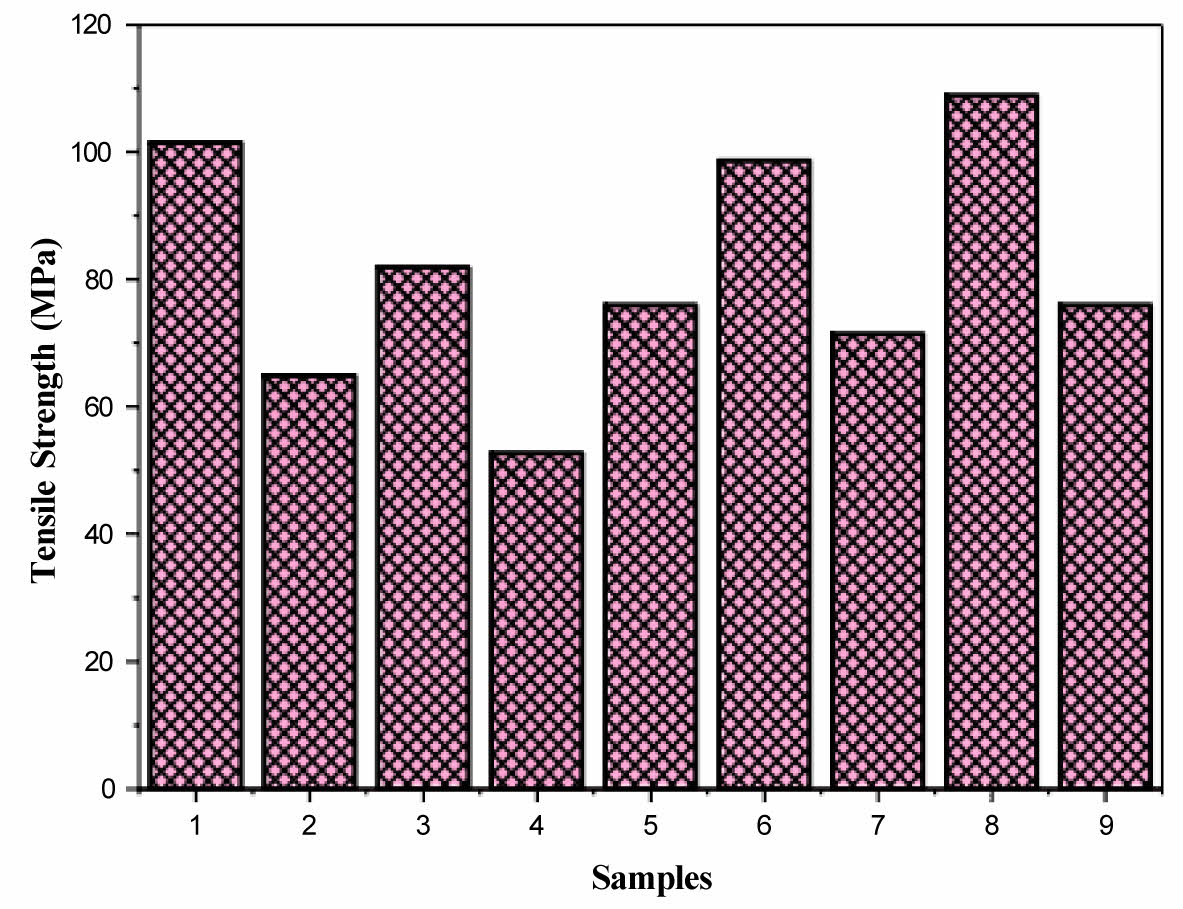
Figure 7 examines the tensile strength of nine samples under UFSW. In sample 8, employing a hexagonal tool profile for the UFSW process of A (1400 rpm) and B (20 mm/min), resulted in an enhanced TS of 108.88 MPa. Conversely, sample 4, utilizing a square profile with A (1200 rpm) and B (15 mm/min), respectively, attained a minimum tensile strength of 52.74 MPa, as depicted in Fig. 7. FSW of AA2219 alloy showed superior TS, HV, and corrosion behavior with a hexagon profile, optimized at 1214 rpm rotating speed, 63 mm/min weld speed, and 11 kN force [32].
Results on Hardness Test
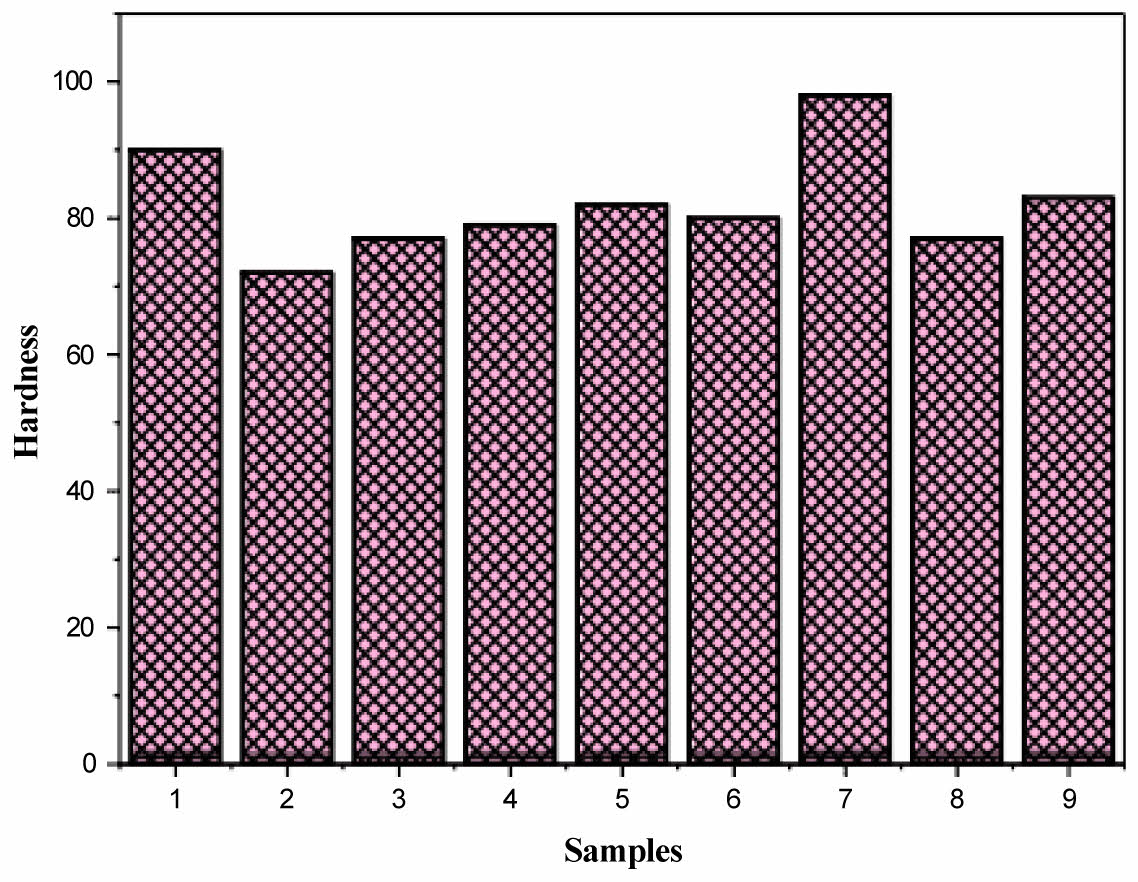
The hardness values for nine samples have been analyzed and evaluated as illustrated in figure 8. From the analysis sample 7, processed A (1400 rpm), B (15 mm/min) with a cone pin, demonstrates the maximal hardness of 98 HV. In contrast, sample 2, executed at A (1000 rpm) and B (20 mm/min), respectively, using a square pin, has the minimum hardness of 72 HV, as depicted in Fig. 8. A hexagonal pin profile at a rotational speed yielded optimal results with a TS of 54.889 MPa and HV of 280.89 BHN for FS welded joints of AA6063 and SS304, demonstrating strength advantages in aluminum and steel welding [33].
Results on Impact Strength
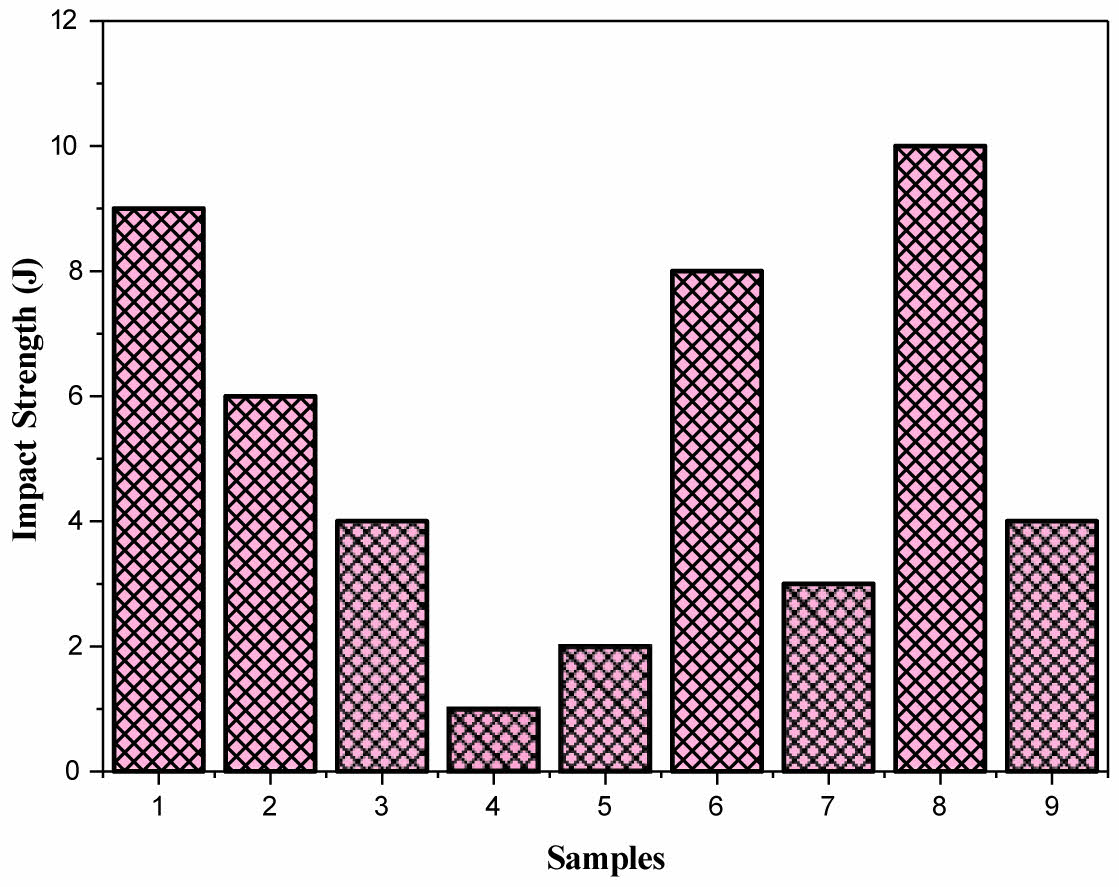
The graph displays the impact test (Charpy) outcomes for the nine specimens. Fig. 9 demonstrates that sample 8, characterized by a hexagonal tool shape at A of 1400 rpm and B of 20 mm/min, respectively achieves the highest impact value, whereas sample 4, with a square tool shape at A of 1200 rpm and B of 15 mm/min, respectively, shows the minimum impact value.
Microscopic Analysis
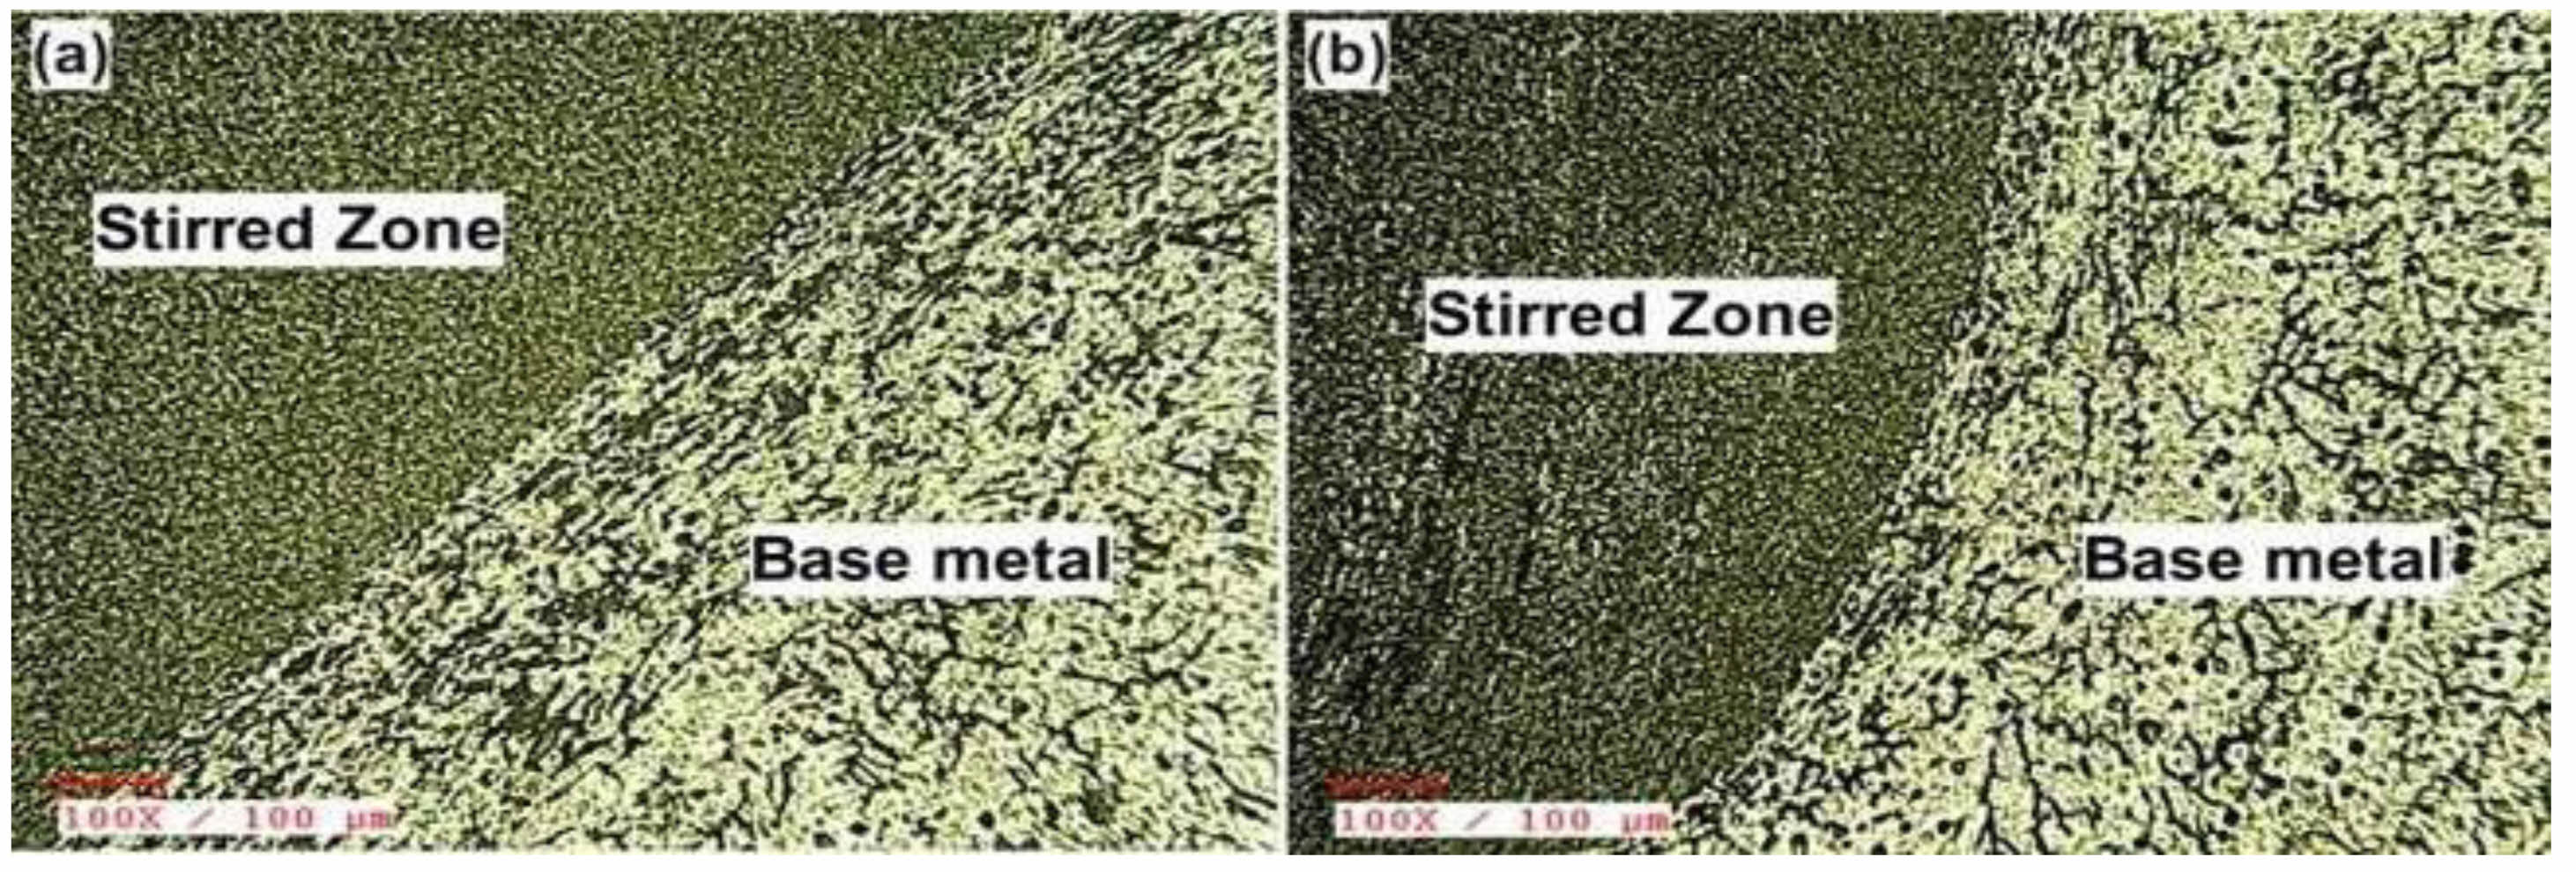
The microstructure analysis of AA 8011 reinforced composite sample was conducted through certain methods and procedures to acquire its microstructure. The material is cut into a 20 mm 10 mm 5 mm using EDM, and it is subsequently subjected to resin molding to facilitate the grinding procedure. The grinding procedure is employed to remove scratches from the material. The purpose of coarse polishing is to eliminate the damage that occurs during sectioning, whereas planar grinding is conducted to minimize the size of abrasive particulates and achieve a polished surface. To eliminate any scratches, the material is initially polished using 800-grit Emery paper on a grinding machine, which is consistently oriented at a 90 angle to get a superior finish. Following this procedure, the material is engraved for 20 seconds and subsequently rinsed with water. These techniques are utilized to obtain a unique microstructural representation of the AA8011 aluminum alloy. The microstructural pictures of samples 7 and 8 display the highest optimum value (Fig. 10).
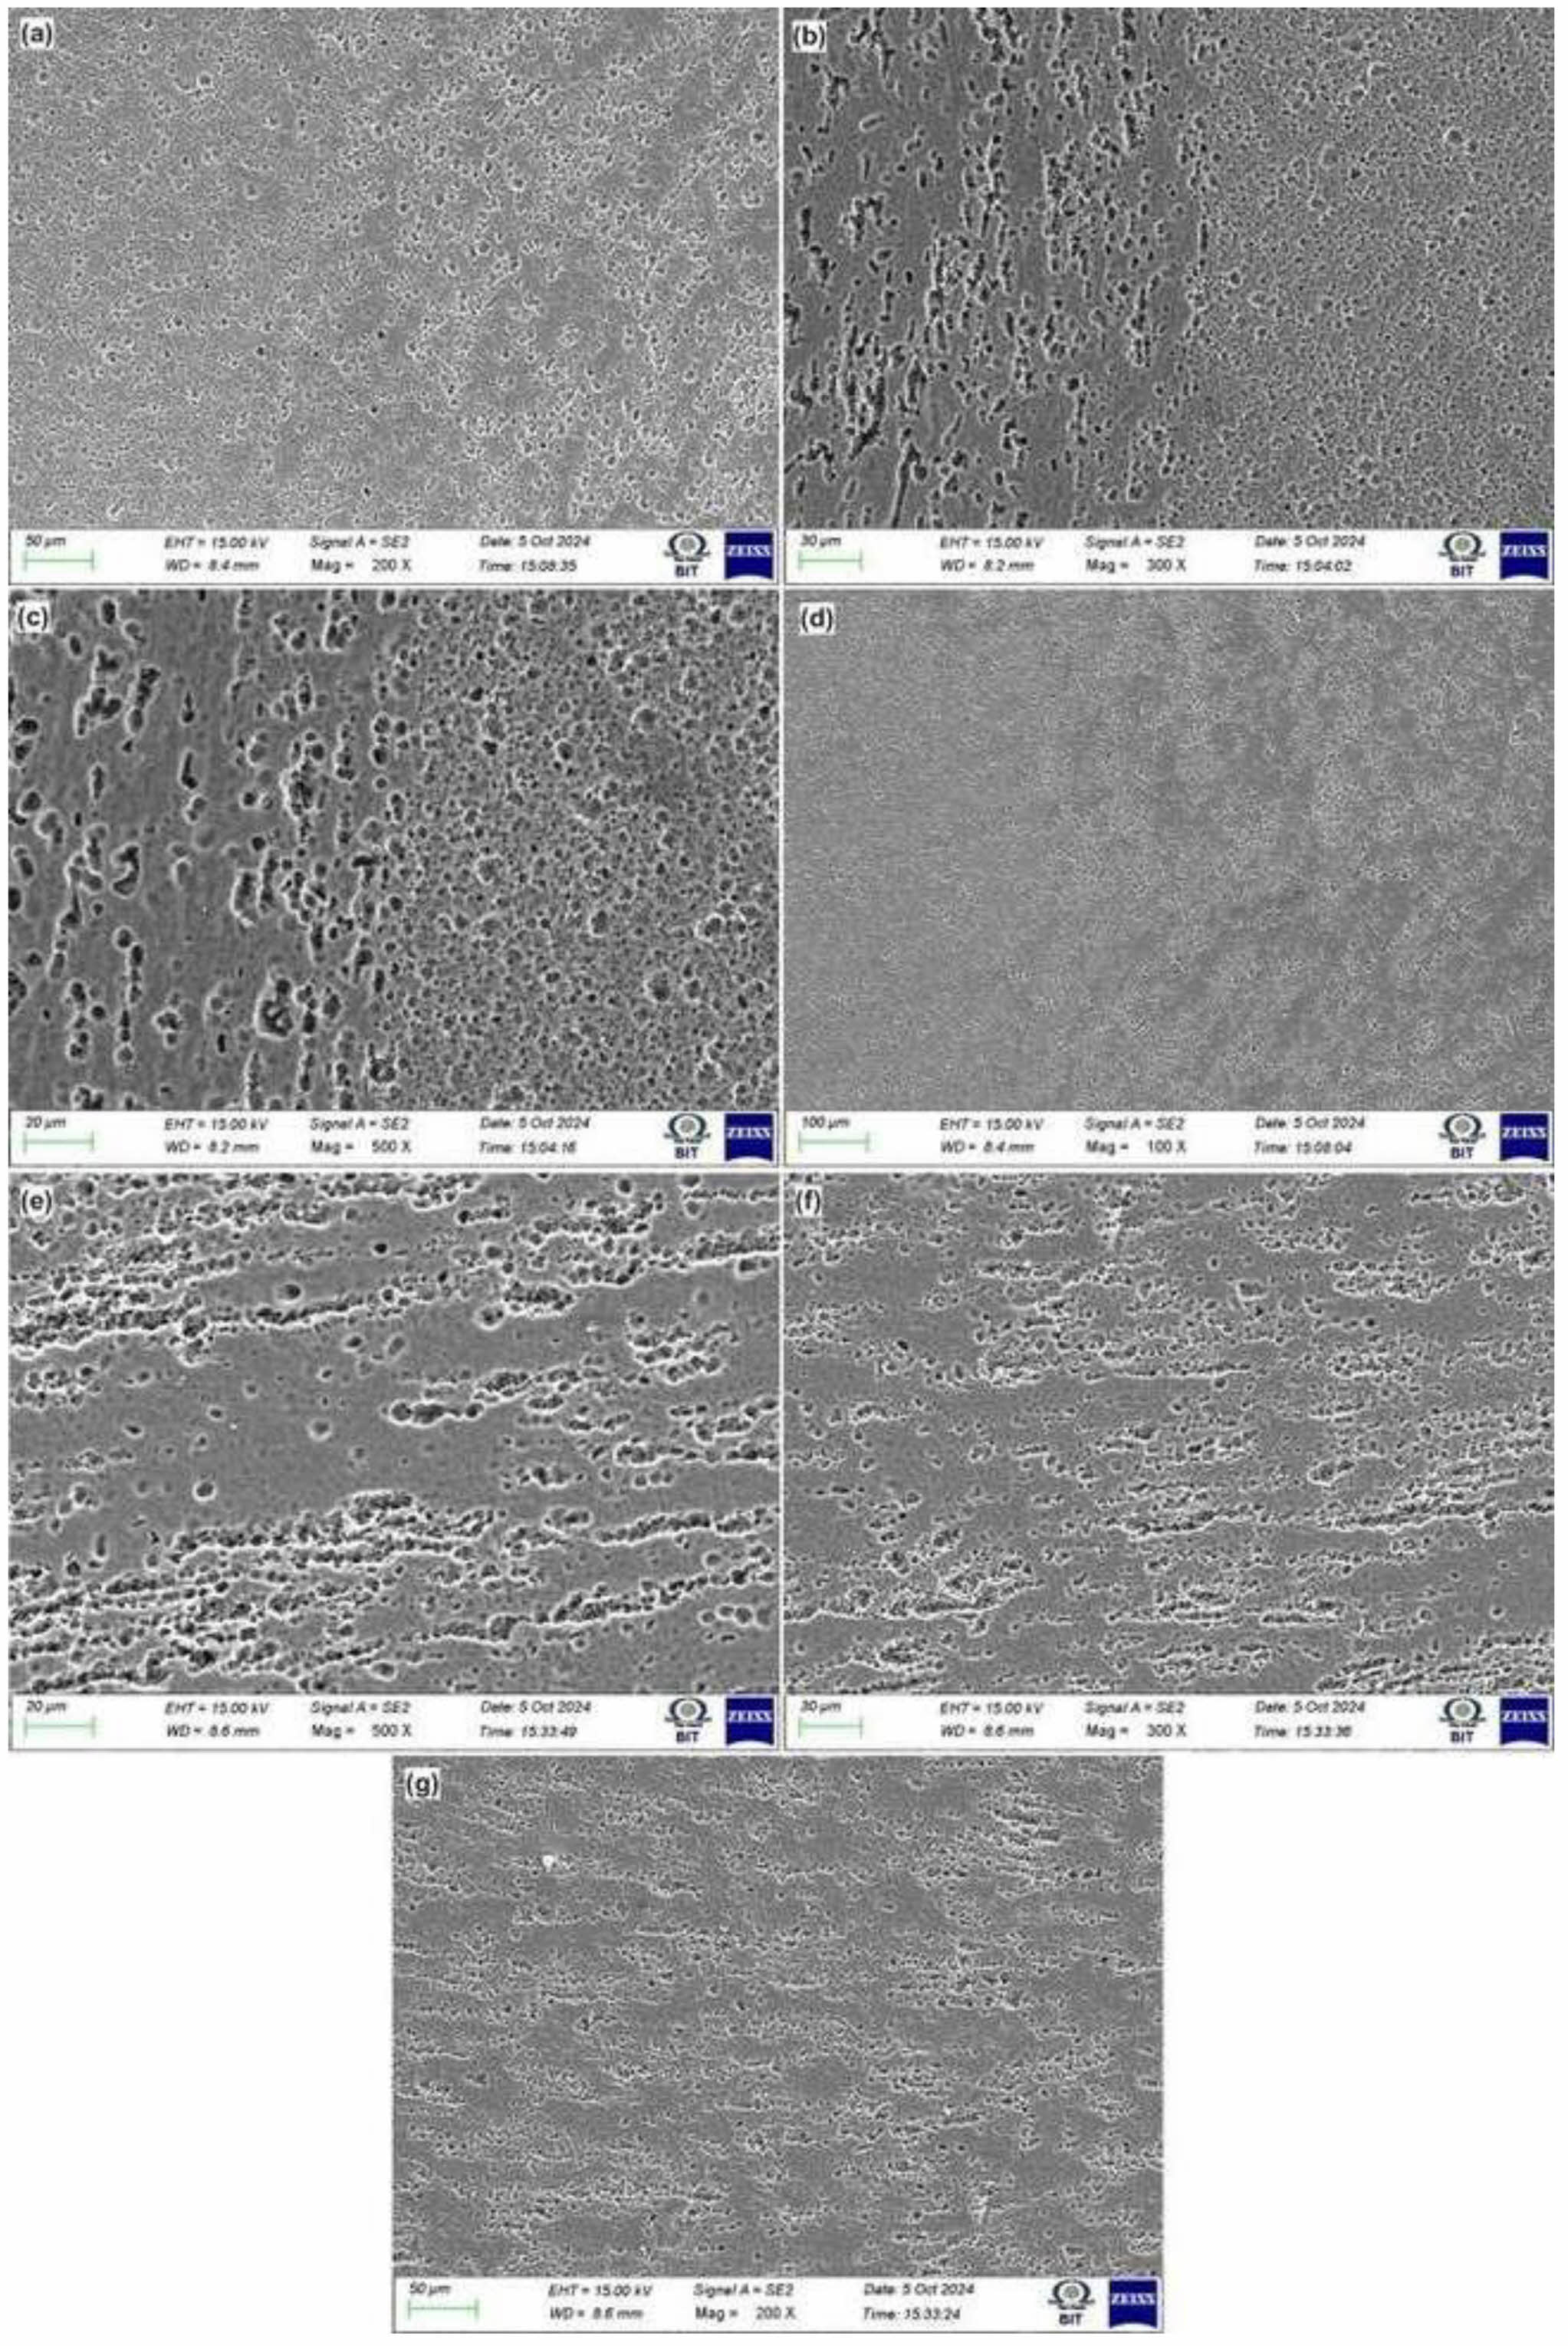
In Fig. 10, both samples exhibit distinct microstructural differences between the base metal (BM) and the stirred zone (SZ). The BM in both samples shows a coarse, dendritic structure typical of unprocessed material, while the SZ reveals fine, equiaxed grains resulting from dynamic recrystallization due to intense plastic deformation and frictional heating during processing. Sample 7 (Fig. 10a) displays a smoother and more gradual transition between the SZ and BM, indicating a more uniform thermal and mechanical effect, which may contribute to better fatigue resistance. In contrast, Sample 8 (Fig. 10b) has a more defined and deeper SZ, suggesting higher heat input or more intense stirring, which could enhance tensile strength and hardness due to improved grain refinement and homogeneity. These observations support the effectiveness of the processing technique in refining the grain structure and improving mechanical properties, while also highlighting the influence of process parameters on joint quality. The microstructure of the nine experiments was also evaluated on SEM. There are four different microstructures of underwater friction stir-welded samples. The SEM images of the stir zone are shown in Fig. 11. The analysis of the microstructure of the stir zone clearly indicates that the FSW welding in still air the cooling rate of the stir zone will be less so that refinement of grains at the stir zone is less. That is reflected in Figs. 11(a)–11(c). The grain refinement in experiment number Fig. 11(c) is more as shown in the figure. In the microstructure of the stir zone, when the cooling media was water, the rate of heat transfer increased in this zone so that grain refinement is more in Figs. 11(d)–11(f). The fineness of grains is maximum in experiment number 7, 8 and 9 as shown in Fig. 11. The SEM analysis was also performed for better analysis of microstructural analysis.
The scanning electron microscopy images predicted that more uniform stirring is done by uses of the coolant in the storage tank. The heat transfer in case of uses of water and coolant is more than the air. From Fig. 11, as the welding speed is increased from 1000 to 1200 rpm in all types of cooling media the flow of material in the stir zone becomes more predictive.
Results on Optimization Techniques
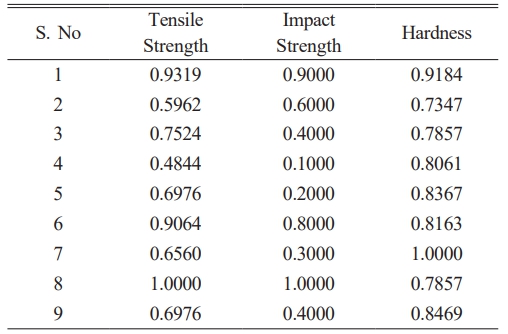
The novelty of this research lies in applying underwater friction stir welding (UFSW) to AA8011-SiC composites, leveraging advanced MCDM techniques (MEREC and MARCOS) to optimize welding parameters. The study uniquely evaluates hexagonal, square, and conical tool profiles, demonstrating the superiority of hexagonal profiles in enhancing mechanical properties. The TS, IS, and HV of the FSPed AA8011 surface composites were evaluated. Table 4 presents the mean values of the three measurements.
MEREC – MARCOS Optimization Result
Table 4 presents the A, B, and C values for each specimen as determined by the Taguchi L9 orthogonal design. The modification of processing factors and UFSW of AA8011composites substantially influences the outcomes. Initially, a suitable process parameter is determined to optimize the TS, IS, and HV of the joint, with the objective of producing flawless weld joints of exceptional quality.
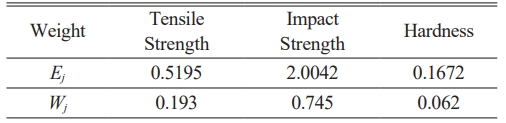
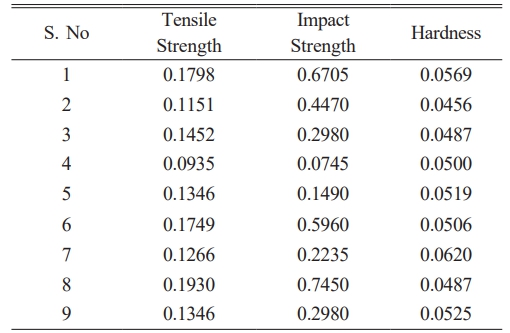
Table 4 displays the initial matrix of expert evaluations. Table 5 shows the obtained results from the MEREC calculation. Ej values are obtained from equation (5) and wj values are obtained from Equation (7), is the conclusive weightage of this technique.
The choice matrix is formulated subsequent to determining the optimum value (IV) and anti-optimum value (AIV) by Equation (10) and Equation (11). The organized decision matrix utilized in the MARCOS analysis for the designated alternatives and criteria is displayed in Table 5. As per MARCOS methodology detailed in Section 2.4, each value is normalized utilizing Equations (12) and (13). Table 6 presents the derived normalized decision matrix for the MARCOS investigation.
The weights presented in Table 5, derived from the MEREC method, are subsequently employed to construct the weighted decision matrix utilizing Equation (14). Table 7 displays the weighted decision matrix.
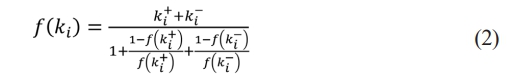
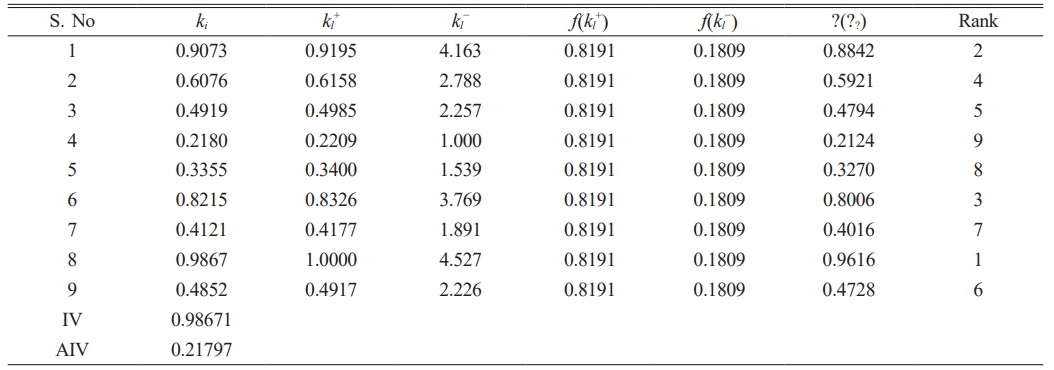
Subsequently, Equations (14) to (16) of the MARCOS technique are employed to derive the utility degrees (kl+, kl−) and utility functions ( f(kl+), f (kl−))of alternatives.
Subsequently, the ultimate utility function, ((ki)) for each option is ascertained using Equation (17). The findings of the MARCOS investigation are shown in Table 8.
The possibilities are ranked based on the acquired (ki) values. Table 8 illustrates that the aluminum composite alternatives can be organized in descending order as S8, S1, S6, S2, S3, S9, S7, S5, and S4. The composite S8, characterized by an A of 1400 rpm, a B of 20 mm/min, and a hexagonal tool profile, is determined to be the optimal selection based on the nine established criteria.
Identification of Optimal Parameters Using Taguchi Technique
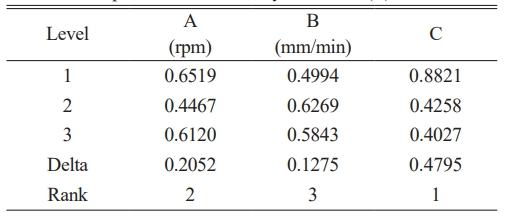
Evaluating the utility functions (ki) in multi-objective optimization against the best sequence (unity) is essential for identifying the optimal set of process variables and ranking the significance of every variable combination. The maximum (ki) value, close to one, signifies the optimal integration of response quality and process variables. Experiment number 8 (Table 8) exhibits the maximum (ki) value of 0.9616, indicating it as the ideal configuration of utility functions ( f(ki)) and their variables within the established experimental framework. This variable combination guarantees the optimal quality attributes of the weld joint generated by the UFSW process. The UFSW process variable values, derived from the average utility functions (ki), are computed and displayed in Table 7. The disparities (delta) between the maximal and minimal values of the factor levels signify the importance of the process factors in relation to the overall quality characteristic (ki). The tool profile significantly influences the quality characteristic, followed by the rotating speed and traverse speed of the welding tool. By analyzing utility
function values ( f(ki)) and employing main effects analysis, the ideal configuration of process factors, including A, B, and C, can be assessed to get the most favorable combination of quality attributes.
The "Larger-the-Better" criterion was selected for utility function values (ki) in Taguchi optimization because the study focused on maximizing key mechanical properties such as tensile strength, impact strength, and hardness. These properties directly correlate with the performance and reliability of the welded joints, and higher values indicate superior material behavior. By using this criterion, the optimization process ensured that the experimental parameters yielded the most favorable combination of mechanical properties for the UFSW of AA8011 composites. This approach aligns with the study's objective of achieving the best possible quality in weld joints.
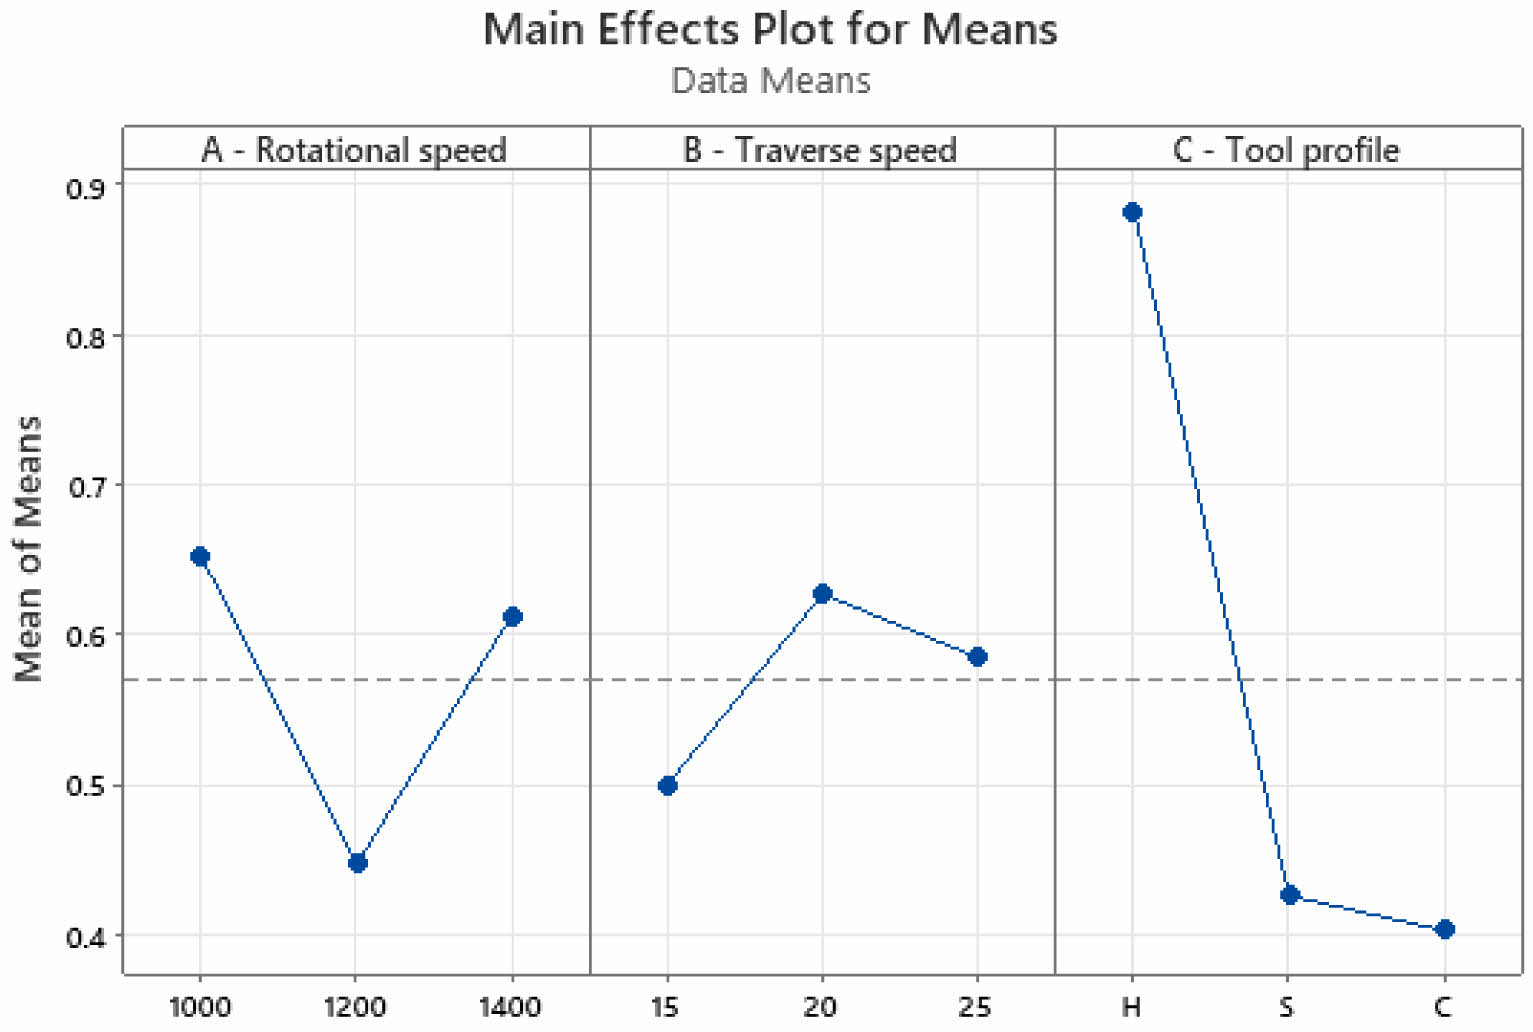
Table 8 presents the main effect of the process variables, as illustrated in Fig. 12, where the mean utility function values (ki) are displayed against the levels of the process factors. Analyzing Table 9 alongside the graphical depiction of the main effect plot facilitates the identification of the ideal combination of process variables. The ideal parameter combination is determined to be 1000 mm/s for rotating speed (A1), 20 rpm for traverse speed (B2), and Hexagon for tool pin profile (C1). An ANOVA is conducted to estimate the influence of the welding process variables on the aggregate welding responses.
ANOVA and Optimization
ANOVA is employed to determine the sources of variation in the function of objective. It can also be utilized to ascertain the impact of each variable on the process. To evaluate the impact of the welding variables on the resultant multi-objective (ki), the F-value, P-value, and contribution percentage metrics were utilized [34]. ANOVA results highlighted rotational speed as the dominant factor influencing hardness and impact strength in AA8011-H24 alloys, with optimal parameters achieved through a fuzzy-based response surface methodology.
Table 8 illustrates the contributions and relative importance of the process variables, ascertained using ANOVA of the dimensions without utility function values (ki). The tool profile is the paramount parameter, accounting for 81.44%. The rotational speed is 13.19%, whereas the traverse speed is 4.69%. The R is 99.32%, indicating that all process variables were significant at the 95% confidence level. Moreover, at the 95% confidence
level, with a P-value (refer to Table 8) below 0.05 for each process variable, it is evident that all the welding variables are significant. The model has an estimated R2 of 99.32% and an (adj)R2 of 97.28%, signifying a strong correlation between the experimental and predicted outcomes.
A numerical relationship can be established to ascertain the utility functions of the distinctive set of welding joints generated by the UFSW method, which is contingent upon the process parameters, following the ANOVA.

The chosen polynomial for all three parameters may be articulated as follows:
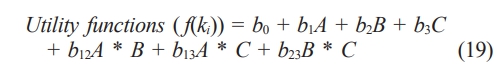
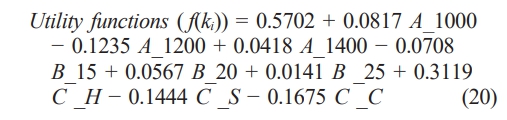
Where, b0 represents a constant; b (1, 2, and 3) denote the coefficients of the linear terms; while b (12, 13, and 23) signify the coefficients of the interaction terms, which are disregarded in this study. The subsequent first-order polynomial equation is obtained by analyzing the design matrix through multiple regression and calculating the average response values:
To assess the importance of the adjusted mean (Eq. 19) of the utility functions ( f(ki)), ANOVA was considered and detailed in Table 10. The model exhibits a highly significant
F-value, indicating its accurate depiction of the link between the variables and the objective function. The model's R2 is 99.32%, surpassing the Adj. R2 of 97.28%. This signifies a robust correlation between the projected values and the experimental results. Consequently, the constructed model is deemed appropriate and efficient in predicting the results within an acceptable error.
|
Fig. 7 Evaluation of TS of various samples from the experiment. |
|
Fig. 8 Hardness of various test samples. |
|
Fig. 9 Evaluation of impact strength of various test specimens. |
|
Fig. 10 A Microstructural image of sample 7 and sample 8. |
|
Fig. 11 SEM images of samples 1–9 of the stir zone. |
|
Fig. 12 Main effects plot for performance scores of alternatives (ki). |
|
Table 10 ANOVA for averages of the performance scores of alternatives (ki). |
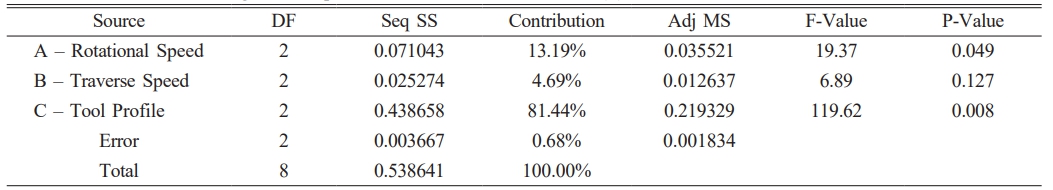
S = 0.0428196, R2 = 99.32, Adj.R2 = 97.28%, Pred. R2 = 86.21. |
This study employed the UFSW process on the AA8011 composites strengthened with 5 wt% SiC particles, to optimize welding parameters for improved mechanical qualities. A systematic methodology employing MCDM approaches, including MEREC and MARCOS, was utilized to vary and assess critical factors like rotating speed, traversal speed, and tool pin profile. Mechanical tests, including TS, HV, and IS, were performed on the welded samples, and optimization techniques were utilized to evaluate the most effective combination of factors. The results offer significant insights into attaining superior weld joints with enhanced mechanical performance by optimizing UFSW conditions for AA8011-SiC composites. According to the findings, the conclusions are as follows:
• Tensile Strength (TS): The maximum tensile strength of 108.88 MPa was achieved using a rotating speed of 1400 rpm, a traverse speed of 20 mm/min, and a hexagonal tool pin profile. This highlights the critical role of tool geometry in enhancing joint strength.
• Hardness (HV): The highest hardness value of 98 HV was recorded at a rotating speed of 1400 rpm, a traverse speed of 15 mm/min, and a cone tool pin profile, demonstrating the influence of lower traverse speed and specific pin shapes on hardness.
• Impact Strength (IS): The maximum impact strength of 10 J was achieved with the same parameters as the optimal tensile strength, emphasizing the hexagonal tool’s effectiveness in improving ductility and energy absorption.
• Optimization Results: The MARCOS optimization technique identified the most suitable combination of welding parameters as 1000 mm/s rotational speed, 20 mm/min traverse speed, and a hexagonal tool pin profile, yielding a maximum utility function value of 0.9616.
• ANOVA Analysis: Among the parameters, the tool pin profile contributed the most significantly to the mechanical performance of the welded joints (81.44%), followed by rotational speed (13.19%) and traverse speed (4.69%).
This research highlights that precise control of UFSW parameters, especially tool geometry, is paramount in enhancing the mechanical properties of welded AA8011 composites. The integration of MCDM techniques such as MEREC and MARCOS further ensures robust and reliable optimization for advanced industrial applications.
- 1. V. Msomi S. Mabuwa, O. Muribwathoho, and S.S. Motshwanedi, Mater. Today: Proc. 46 (2021) 638-644.
-

- 2. V. Msomi, S. Mabuwa, A. Merdji, O. Muribwathoho, and S.S. Motshwanedi, Mater. Today: Proc. 45 (2021) 5702-5705.
-
- 3. V. Rajagopal, D.K. Rajendran, and S. Muthukumaran, Indian J. Eng. Mater. Sci. 30 (2023) 766-779.
-
- 4. A. Asmare, R. Al-Sabur, and E. Messele, Metals (Basel) 10 (2020) 1-21
-
- 5. R. Saravana Kumar, T. Rajasekaran, S.D. Singh, S. Kumar, P. Mishra, P. Shrivastav, and S. Ravishankar, IOP Conf. Ser.: Mater. Sci. Eng. 912 (2020) 032029.
-
- 6. P.J. Lokesh Kumar, P. Sevvel, T.G. Loganathan, and D. Prakash, Mater. Res. Express 10 (2023) 026516.
-
- 7. P.J. Lokesh Kumar, P. Sevvel, and T.G. Loganathan, Pract. Metallogr. 60[5] (2023) 289-318.
-
- 8. M. Natarajan, S. Ramanathan, V. Chenrayan, and H.C. Ananda Murthy, Adv. Eng. Mater. 26[22] (2024) 2401739.
-
- 9. K. Senthamarai, S. Selvakumar, S. Kannan, and S.V. Alagarsamy, Surf. Rev. Lett. 31[3] (2024) 2450019.
-
- 10. S.P. Singh, D. E. Raja, D. Ananthapadmanaban, T. Sonar, and M. Ivanov, Int. J. Interact. Des. Manuf. 19 (2023) 37-46.
-
- 11. S. Mabuwa and V. Msomi, Mater. Res. Express 8[6] (2021) 066514.
-
- 12. S. Mabuwa and V. Msomi, Mater. Today: Proc. 45 (2021) 5400-5404.
-
- 13. R. Alfattani, M. Yunus, A.F. Mohamed, T. Alamro, and M. K. Hassan, Mater. 15[1] (2022) 260.
-
- 14. N. Sabarirajan and A.N. Sait, Mater. Test. 62[3] (2020) 317-328.
-
- 15. D. Aravindhkumar and R. Thirumalai, Mater. Res. Express 8[4] (2021) 046513.
-
- 16. S. Balamurugan, K. Jayakumar, and K. Subbaiah, Arab. J. Sci. Eng. 46 (2021) 11985-11998.
-
- 17. S. Dharmalingam, K. Lenin, and P.N. Krishnan, Mater. Today: Proc. 21 (2020) 523-526.
-
- 18. S.K. Manickam and I. Palanivel, Matéria (Rio J.) 29[4] (2024).
-
- 19. M. Sivaperumal, R. Thirumalai, S. Kannan, and K.S.S. Rao, J. Ceram. Process. 23[3] (2022) 404-408.
-
- 20. H.A. Bui and X.T. Nguyen, Int. J. Interact. Des. Manuf. 18 (2024) 1033-1052.
-
- 21. N.H. Son and T.T. Hieu, Eur. J. Enterp. Technol. 1 (2023) 66-72.
-
- 22. Y. Koli, S. Arora, S. Ahmad, N. Yuvaraj, and Z.A. Khan, J. Mater. Eng. Perform. 32[5] (2023) 2463-2475.
-
- 23. B.S. Kamilla, B.B. Sahoo, A. Barua, S. Jeet, K. Kumari, D.K. Bagal, B.P. Panda, in Lecture Notes in Mechanical Engineering (Springer Nature Singapore, 2023) 135-142.
- 24. R. Kesharwani, K.K. Jha, C. Sarkar, and M. Imam, Int. J. Mater. Res. 114[10-11] (2023) 861-871.
-
- 25. T. Srichok, R. Pitakaso, K. Sethanan, W. Sirirak, and P. Kwangmuang, Processes 8 (2020) 1080.
-
- 26. S. Chainarong, T. Srichok, R. Pitakaso, W. Sirirak, S. Khonjun, and R. Akararungruangku, Processes 9 (2021) 1805.
-
- 27. B.N. Venkatesha and M.S. Bhagyashekar, Procedia Eng. 97 (2014) 847-853.
-
- 28. R. Thirumalai, S. Karthick, and M. Giriraj, J. Ceram. Process Res. 23[2] (2022) 221-227.
-
- 29. M. Keshavarz-Ghorabaee, M. Amiri, E.K. Zavadskas, Z. Turskis, and J. Antucheviciene, Symmetry 13 (2021) 525.
-
- 30. A. Ulutaş, F. Balo, and A. Topal, Polymers 15 (2023) 1500.
-
- 31. Z. Stević, D. Pamučar, A. Puška, and P. Chatterjee, Comput. Ind. Eng. 140 (2020) 106231.
-
- 32. D.B. Naik, C.H.V. Rao, K.S. Rao, G.M. Reddy, and G. Rambabu, Int. J. Comput. Aided Eng. Technol. 17 (2022) 318-334.
-
- 33. P.L. Florence, K.S. Narayanaswamy, P.H.V.S. Talpa Sai, and S. Devara, Mater. Today: Proc. 46 (2021) 583-585.
-
- 34. S. Sridhar, R. Thirumalai, S. Nandhakumar, and S. Karthick, Chiang. Mai J Sci. 49[5] (2022) 1416-1427.
-
- 35. M. Kumar, S.K. Tamang, D. Devi, M. Dabi, and K.K. Prasadand R. Thirumalai, J. Ceram. Process Res. 23[3] (2022) 373-382.
-
- 36. Varalakshmi Penugonda, S. Sudhakar Babu, and B. Vijaya Kumar, J. Ceram. Process Res. 24[2] (2023) 250-256.
-
 This Article
-
2025; 26(3): 512-525
Published on Jun 30, 2025
- 10.36410/jcpr.2025.26.3.512
- Received on May 6, 2025
- Revised on May 28, 2025
- Accepted on Jun 2, 2025
Services
- Abstract
introduction
materials and methodology
results and discussion
conclusion
- References
- Full Text PDF
Shared
Correspondence to
- V. Vimala
-
Assistant Professor, Department of Robotics and Automation, Erode Sengunthar Engineering College, Perundurai, Tamilnadu, India - 638057
- E-mail: vvimala2025@gmail.com
Clean-Energy Research Institute(CRI), Hanyang University, 222, Wangsimni-ro, Seongdong-gu, Seoul, 04763, Korea
E-mail: jcpr@hanyang.ac.kr