


- Optimization of Heat Transfer Parameter in Fractal Tree Microchannel with Al2O3 Nano-Fluids Using Taguchi and GRA Method
E. Manikandana,*, K. Velmuruganb, G.G. Sozhamannanc, Balamuruga Mohan Raj.Gd and
V.S.K. VenkatachalapathyeaDepartment of Mechanical Engineering, Sri Manakula Vinayagar Engineering College, Puducherry - 605107, India
bDepartment of Mechanical Engineering, Sri Manakula Vinayagar Engineering College, Puducherry - 605107, India
cDepartment of Mechanical Engineering, Sri Manakula Vinayagar Engineering College, Puducherry - 605107, India
dDepartment of Mechatronics, Sri Manakula Vinayagar Engineering College, Puducherry - 605107, India
eDepartment of Mechanical Engineering, Sri Manakula Vinayagar Engineering College, Puducherry - 605107, IndiaThis article is an open access article distributed under the terms of the Creative Commons Attribution Non-Commercial License (http://creativecommons.org/licenses/by-nc/4.0) which permits unrestricted non-commercial use, distribution, and reproduction in any medium, provided the original work is properly cited.
Grey relational analysis of the multiple responses, including Reynolds number, Nusselt number, heat transfer (W), heat transfer coefficient (W/m2 K), and heat flux (W/m2), was done as part of experiments based on a Taguchi orthogonal array. The best parameter levels was calculated and selected based on GRA on basis of the Grey Relational Grade (GRG). An ANOVA has been used to identify factors that significantly contribute to the response based on grade. Experiments was conducted at the optimum predicted conditions (Al2O3) and the response was found as follows; Reynolds Number (592), Nusselt Number (2.5), Heat transfer (Q) (510), Flux (W/m2) (17.8) and Heat transfer Coefficient (W/m2 K) (394). The experimental value was found to be correlated with the predicted values of Reynolds number (610), Nusselt number (2.6), heat transfer (Q) (530), heat transfer coefficient (W/m2 K) (415), and heat flux (W/m2) (18.5), respectively. The experimental data were found to have an excellent knowledge under the recommended conditions. Our study is a preliminary step towards developing a substantially effective Al2O3-based base fluid to enhance the performance of the heat transfer process in a copper-based serpentine shape heat exchanger.
Keywords: Orthogonal array, Inorganic nanoparticle, Copper based heat exchanger, Grey relational analysis (GRA).
The phenomenon of superior thermal conductivity is a pivotal area in many power plant sectors. There is a pragmatic shift from the macroscale to nanoscale due to scientific and technological advancements. Nano systems involving inorganic nanoparticles and base fluids are consistently studied and developed to cater the current industrial needs. A significant amount of research being done on nanoparticles to improve thermal conductivity. Technically these nanoparticles enhance the thermal conductivity, viscosity, but these nanoparticles purely rely on synthesis process, nanoparticle morphology, concentration and dimensions, morphology of nanoparticle [1]. The heat exchanging capability and thermal performance of nanofluid based heat exchangers relies on multiple factors spanning from materials, process economics, and effective and safe disposal of used nanofluids in order to mitigate ecological deterioration, mandating the implementation of advance and cost-effective heat transfer enhancement techniques [2]. Literatures have reported that utilization of diverse nanofluids for enhancing performance in thermal applications in industrial sectors and it has received a lot of attention recently as a result of their excellent thermal properties such as effective and quick transfer of heat from lesser areas or across temperature disparities [3]. Thermophoresis, Brownian movement, increased surface-to-volume ratio, higher thermal conductivity, and other distinctive properties of nanofluids [4]. Choi and Eastman proposed the name “Nanofluid” from their investigation by blending nanoparticles in conventional base fluids [5], subsequently, since then there has been significant focus on developing nanoparticles based nanofluids over decades [6]. New technologies are established by exploring different Na towards creating robust, durable, lightweight, wear resistant, and with high thermal attributes, materials composite materials with a diverse range of industrial uses by exploring innovative techniques and materials. These composite materials have its own limitations with a great need for materials with properties with enhanced wear resistance, high specific strength, and stability at extreme temperatures over the past few decades.
Literatures have reported utilization of inorganic and organic nanoparticles in heat transfer materials such as Al2O3 [7], Fe3O4 [8], CuO [9], SiO2 [10]. TiO2 [11], diamond [12], grapheme [13], CNT [14], MWCNT [15], etc. Al2O3 based nanofluids has been investigated over decades for its efficient and effective heat transfer characteristics. Literatures have reported a plethora of scientific investigations on Al2O3 nanofluids over its unique thermophysical properties, but Al2O3 based nanofluids has its own limitations such as limited thermal conductivity upon increasing nanoparticle concentration, viscosity of the base fluid, pressure drop during operations. Despite manufacturing and production sectors employ various optimization techniques, each and every methodology/technique has its own limitations. To enhance the advantages of using Al2O3 nanofluids in the context of their overall effectiveness while taking into consideration the hydrodynamic and heat transfer behaviour of nanofluids, efforts are being made to establish optimal processing parameters and conditions to forecast the optimum.
Scientific fraternity is consistently exploring and working on optimization techniques to minimize the amount of trials in any operating procedures. Statistical techniques are effective towards determining the proportions of elements in a combined application and subsequently it assists to predict the interactions between various components and the desired result [16]. Many procedures, including the full factorial design [17], central composite design (CCD) [18], design of Box-Behnken [19], Plackett-Burman design [20] and Taguchi design [21] methods, are employed as the DoE method. In this study, Taguchi optimization and was carried out for optimizing multiple performance features such sonication time (minutes), nanoparticle concentration (wt%) and flow rate (mL/minute) [22] for heat transfer analysis of Al2O3 based nanofluid in the copper Fractal Tree Micro Channel. GRA methodology was employed for optimizing multiple response characteristics (Reynolds number [23], Nusselt number, Heat transfer (W), coefficient (W/m2K), and flux q (W/ m2), ANOVA [24] and test for confirmation was carried out to warrant and confirm the investigational outcomes.
Nanoparticle and Nanofluid synthesis
The chemicals and reagents for the study was of standard analytical grade. The Al2O3 nanoparticles was purchased from Nanoscience, Chennai. The Al2O3 nanoparticles were synthesized by the physical vapour deposition method.
Process parameters
Experimental setup
A detailed scientific experimental study was conducted to assess and decipher the efficacy of heat transfer phenomenon in a copper based Fractal Tree Micro Channel of diameter [25].
Convective rate of heat transfer performance was studied by circulating various concentrations of Al2O3 based nanofluids and at various flow rate. Al2O3 nanofluids are injected into the Fractal Tree Micro Channel circular heat sink from the container, and the real-time temperature and pressure during [26] at the inlet was recorded. The exit temperature at the exit of microtube was also recorded to quantify the rate of heat transferred by the nanofluids, after passing throughout the circular heat sink [27]. The presence of revolving fan to cool the nanofluids and the submersible pump’s speed alters the flow rate of the nanofluid supports to complete nanofluids circulation.
Taguchi optimization
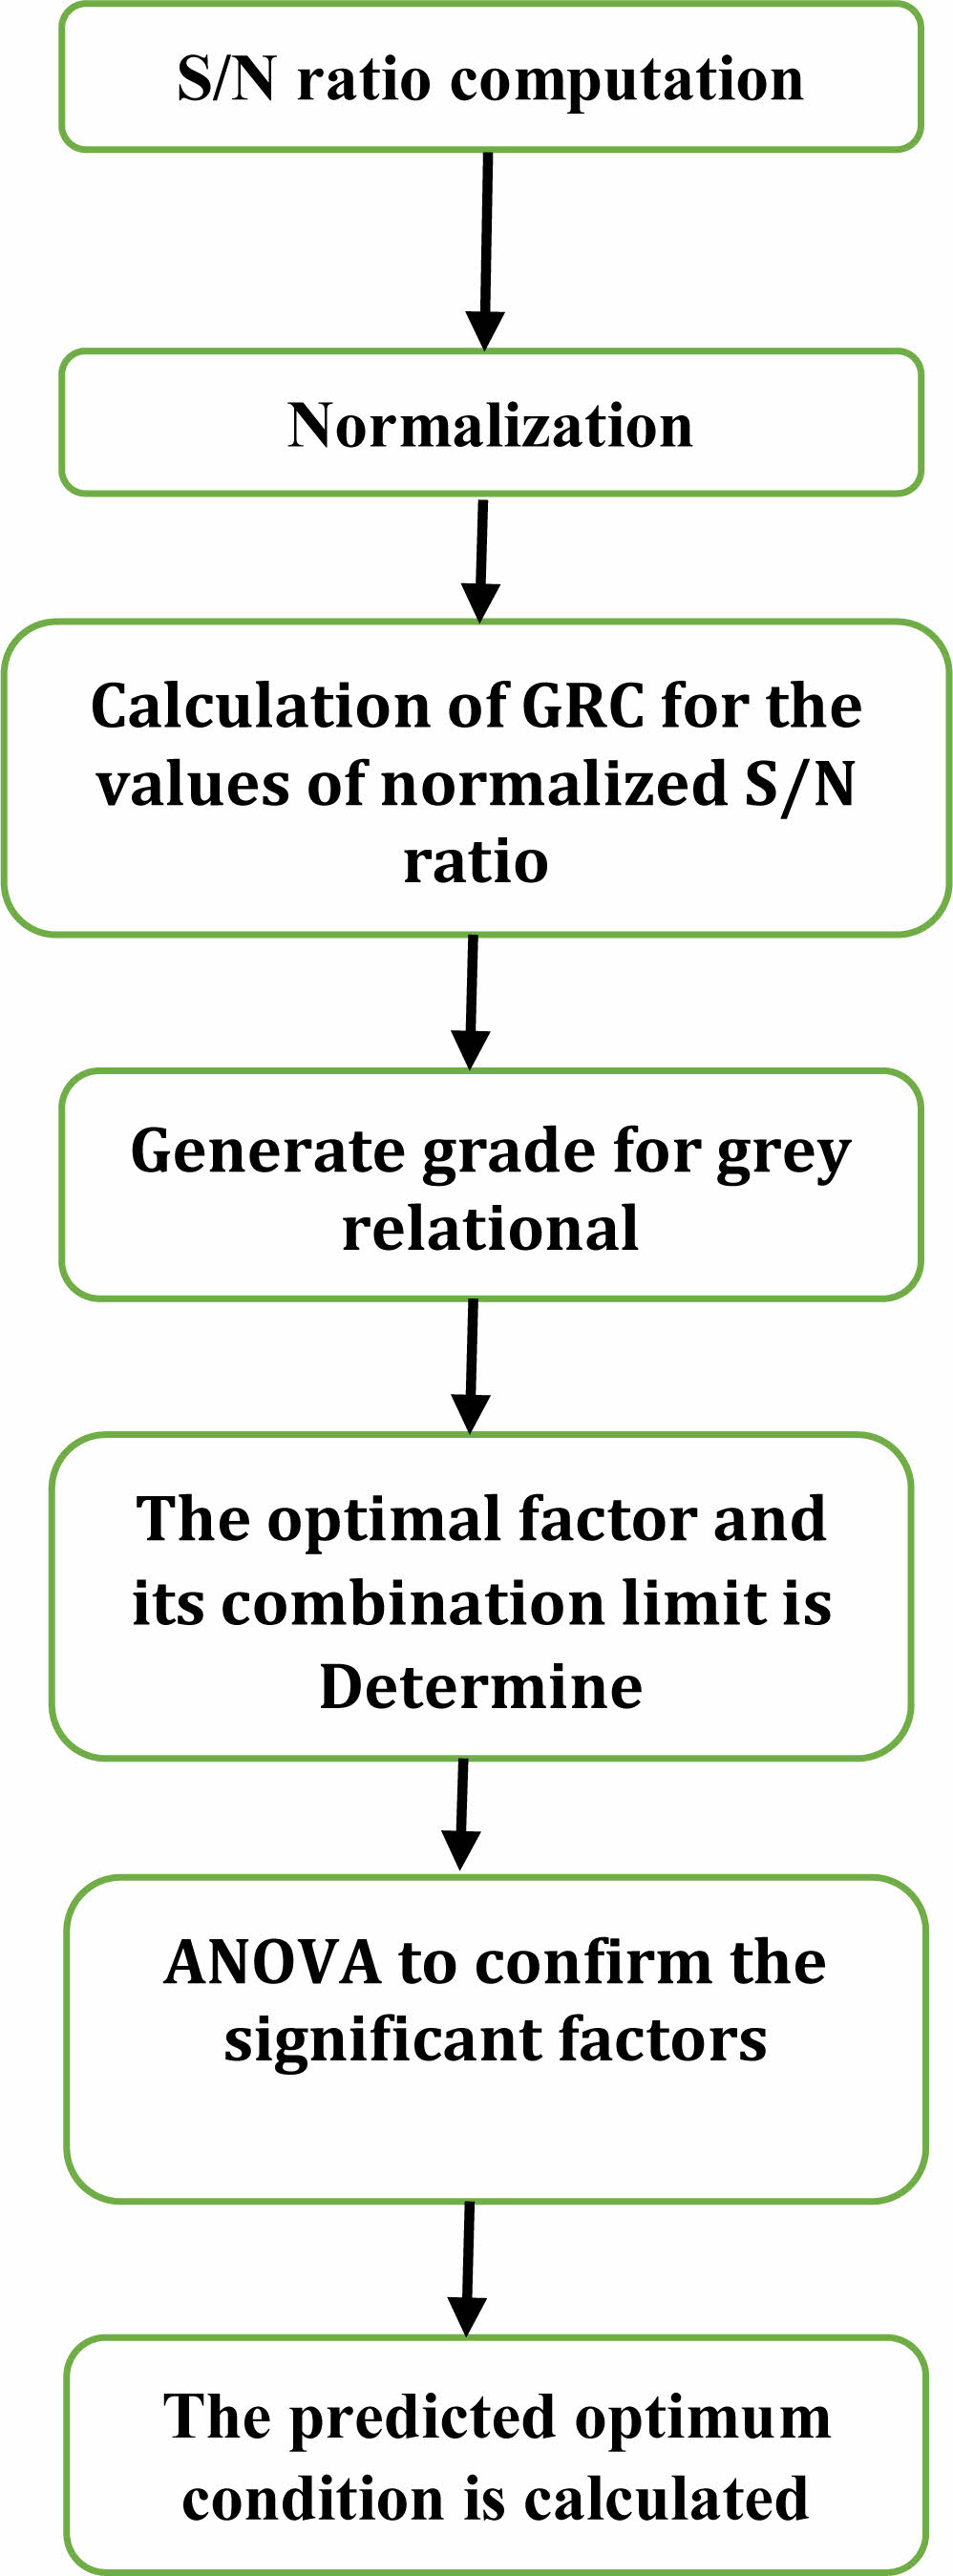
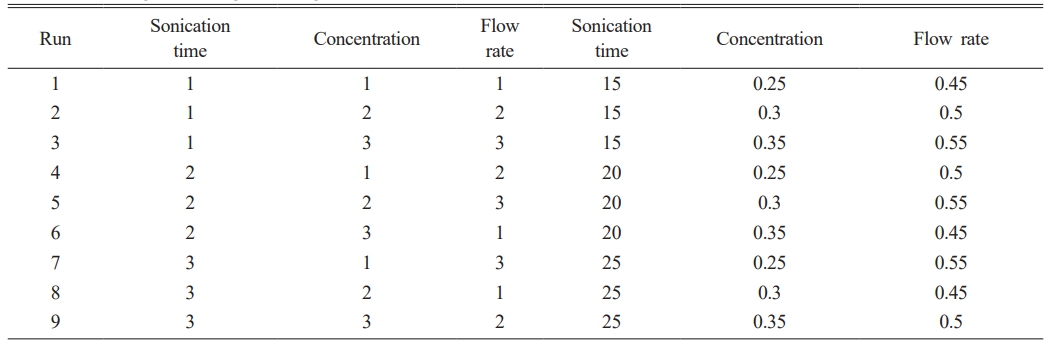
Three process variables such as sonication time (minutes), nanoparticle concentration (wt%) and flow rate (ml/minute) were selected for our optimization study. The process variables and its limits used in this investigation is represented in Table 1. The experiments are conducted using orthogonal array L9 as presented in Table 2. In this study, five responses were taken into consideration and the obtained response values after experiments was represented in Table 2. Optimization was conducted by calculating S/N ratio was calculated using larger the better is sought in-order to obtain maximization of the characteristic response, S/N ratio normalization, calculating GRC, subsequently GRA and graded. ANOVA was performed to identify the influencing variable and optimal conditions were predicted to perform test of confirmation [28]. Finally the test was carried out to warrant and confirm the experimental outcomes [29]. Fig. 1 represents the Taguchi optimization process.
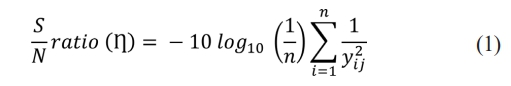
Step 1 S/N ratio calculation
In our study, optimization was conducted by calculating S/N ratio using larger the better is sought in-order to obtain maximization of the characteristic response using Eq. (1).
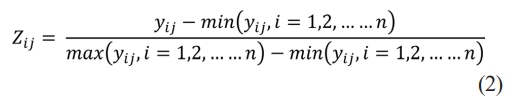
Step 2 Normalization
When data has to be scaled into a suitable range and distributed evenly for further analysis, normalisation is a transformation that is applied to a single input value. In order to utilise the variability and reduce the effect of utilising different data, yij is normalised as Zij (0≤Zij≤1) using the formula below. Eq. (2) was used for normalization of S/N values.
Step 3 Grey Relational Analysis
GRA method is used to convert each variable’s outcomes into a single grey relationship grade across all factors, subsequently this approach assist us to identify the most significant processing parameters from every trial with many outcomes. The minimal and maximal S/N ratios in Taguchi’s study were standardised and each calculation was given a weight. The derived grey relation grade corresponds to the most significant relationship grade for each sequence. For each trial, it was considered that ξ = 0.5. The quality of the machining operation might be affected by the grey relational grade; typically, the GR grade with high values was regarded to be the best relational grade across all. Additionally, a process will be closer to its ideal value if the grey relational grade is greater. Eq. (3) is used to obtain GRC.

Where, the no. of experimental data items n and the no. of responses are denoted by j=1,2...n; k=1,2...m. The reference sequence is yo(k), and the specific comparison sequence is denoted as (yo(k)=1, k=1,2...m); yj(k). The absolute value of difference is denoted as Δoj between yo(k) and yj(k). The smallest value Δmin of yj(k). Δmax is the largest value of yj(k) and ξ is the distinguishing coefficient.
Step 4 Grey relational grade calculation
Subsequent to GRA, the outcomes are used to calculate the GR grade (Eq. 4)
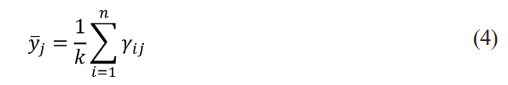
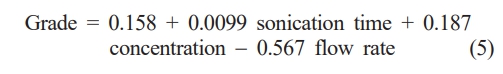
where yj is the GR grade for the j th experiment and the no. of performance characteristics is denoted by k. Eq. (5) represents the equation to calculate the grey relational grade.
Step 5 Optimal factor determination and its level combination
The better the product quality, the higher the grey relational grade; as a result, the factor influence may be evaluated using the grey relational grade, and the ideal level for each controllable factor can also be established.
Step 6 ANOVA Step
Step 7 Predict optimum condition.
|
Fig. 1 Taguchi optimization process. |
|
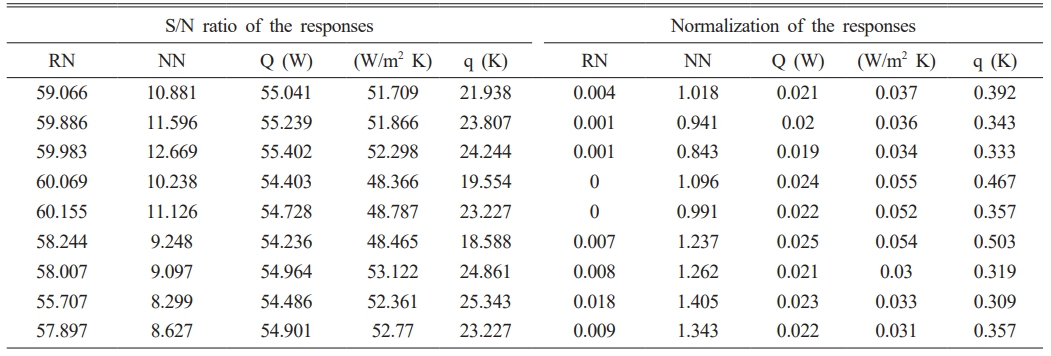
Table 2 The responses of the optimization experiments (Taguchi orthogonal design). |
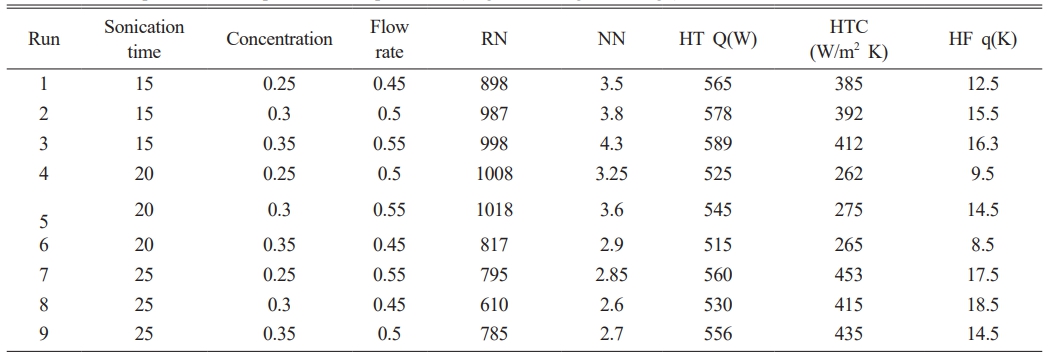
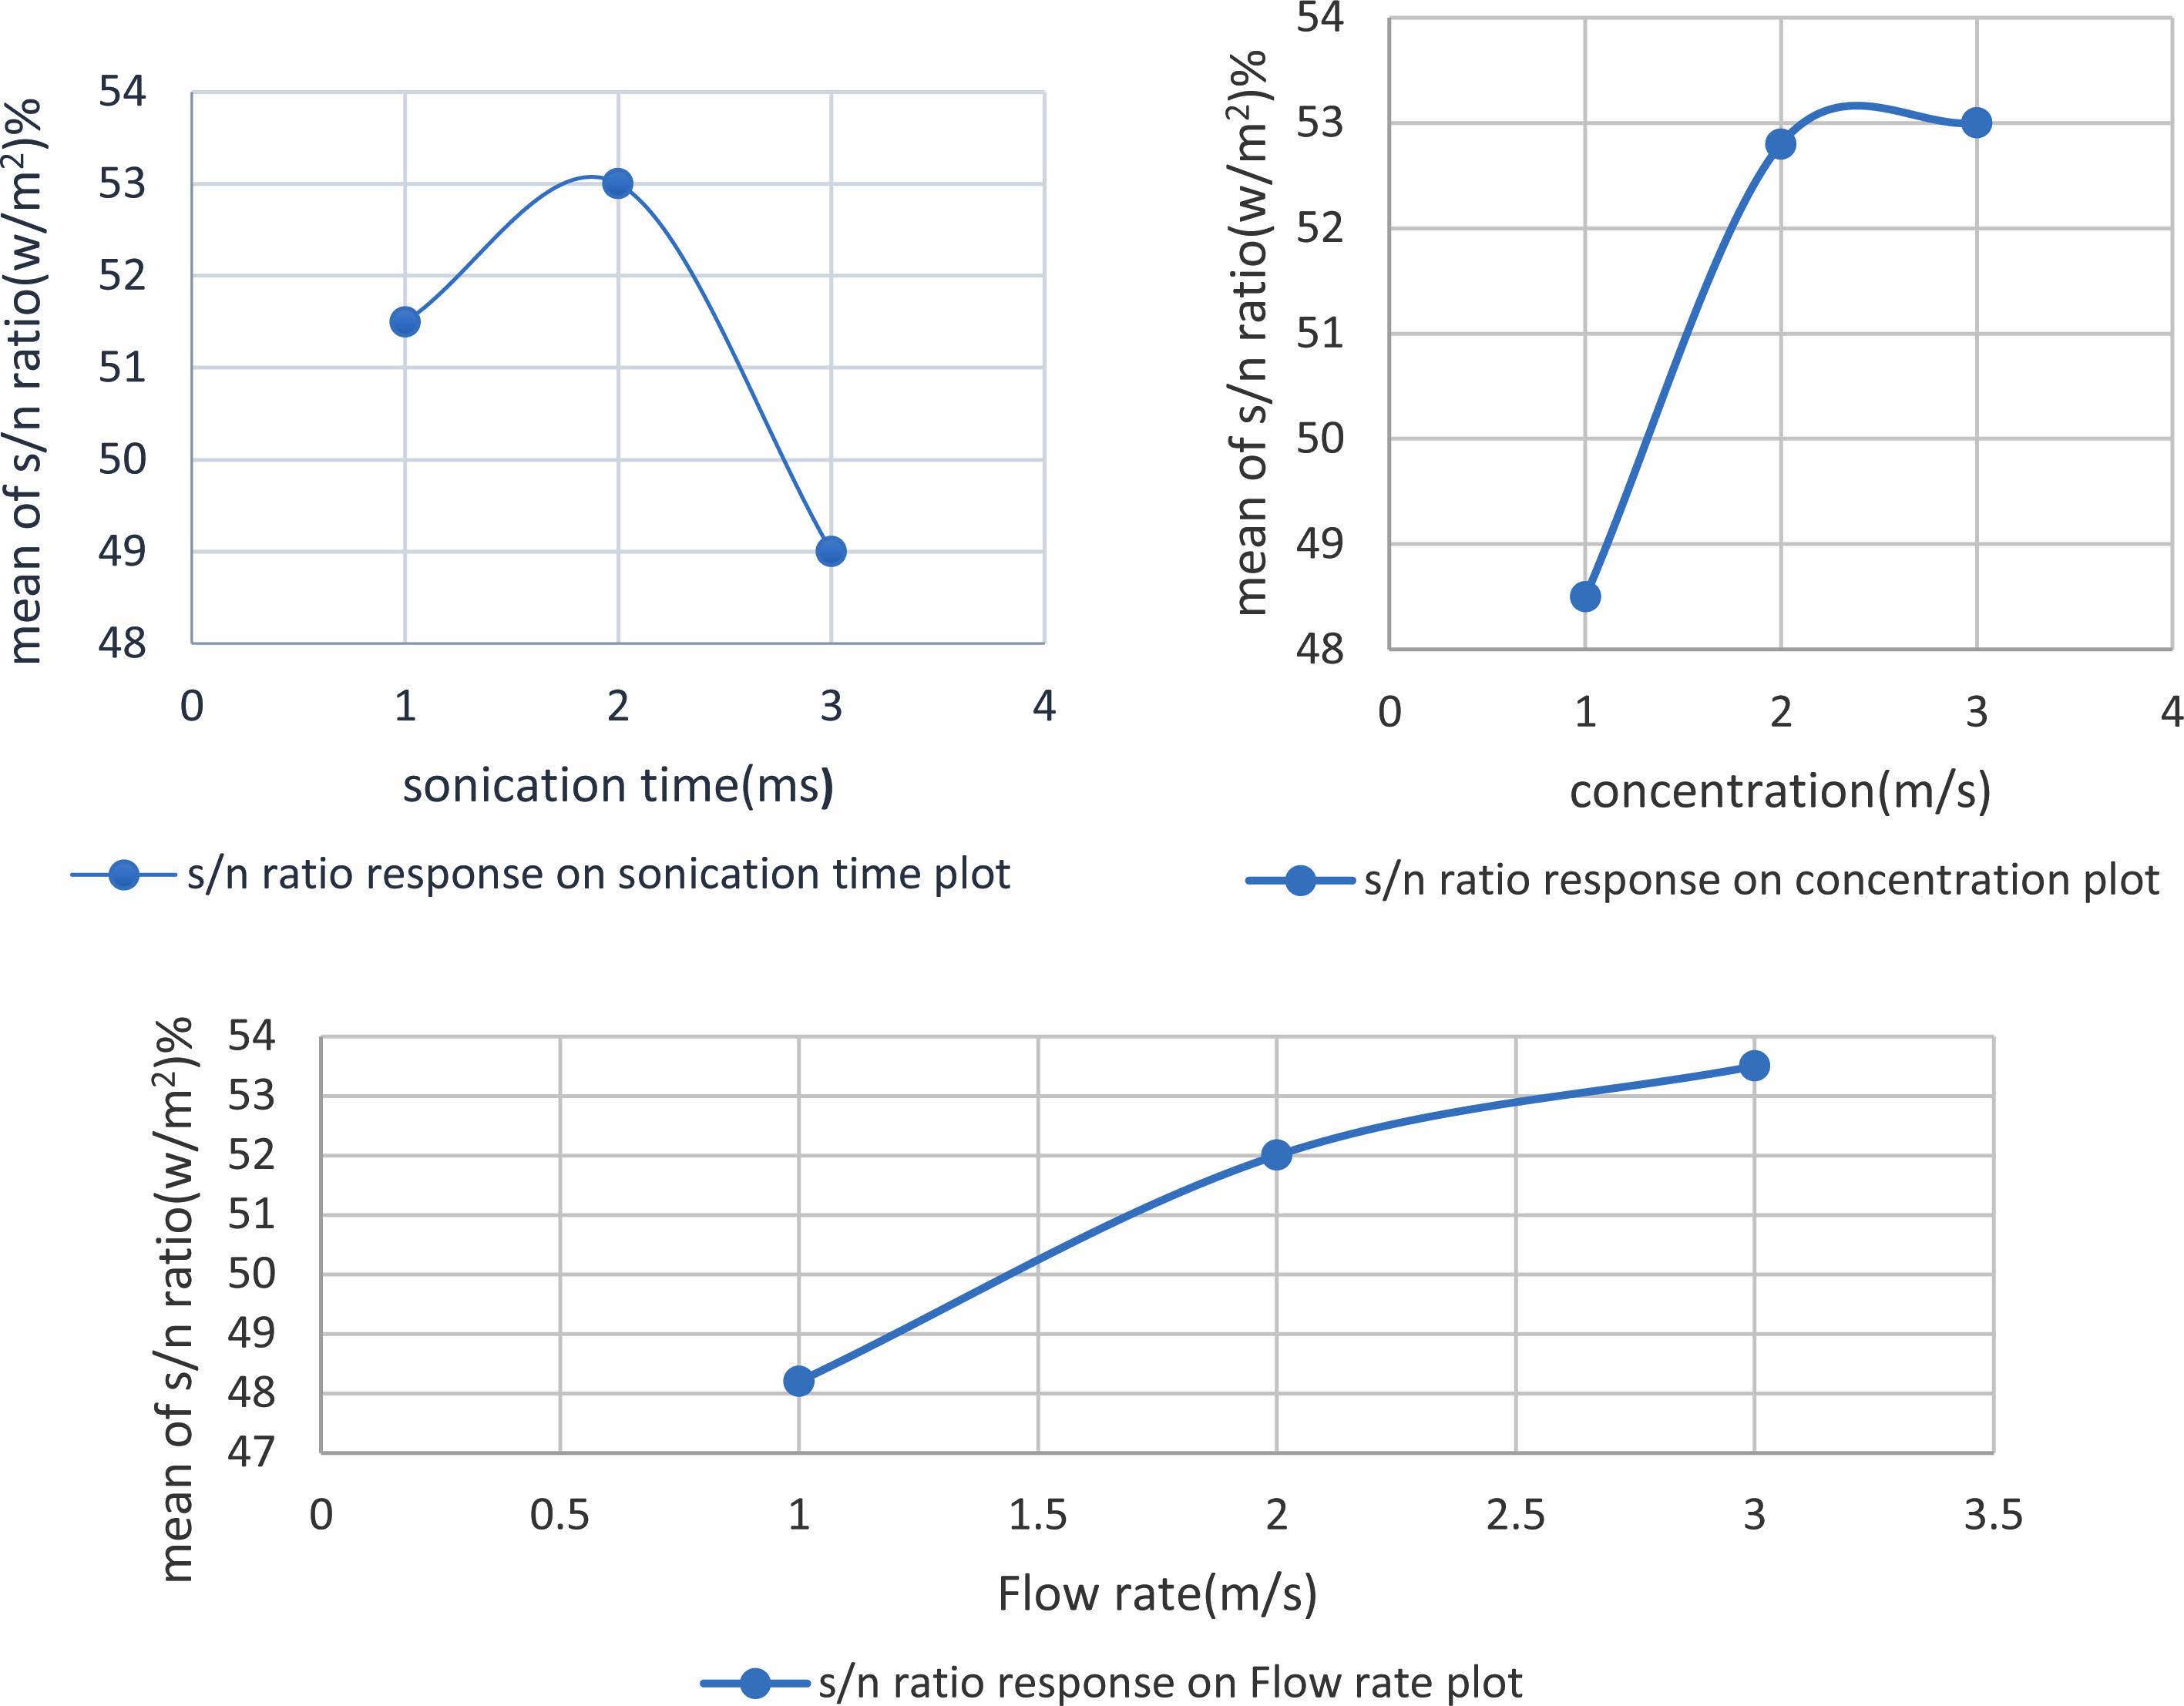
Taguchi optimization may be an effective and reliable method, for a process involves a high number of variables. The Taguchi approach allows for the identification of multiple sets of optimum levels for each response, permitting to optimize the process using better conditions. Table 2 represents the responses of obtained after experimental investigation (Reynolds number, Nusselt number, Heat transfer coefficient (HTC) (W/m2K), Transfer (W), and Heat flux q(W/m2)). Table 3, and Table 4 shows the S/N ratio and Normalization, GRC calculation, grade and rank of the response using larger the better. Fig. 2 and Fig. 3 represents the main effects plots of mean and S/N ratio of the responses based on grade analysis.
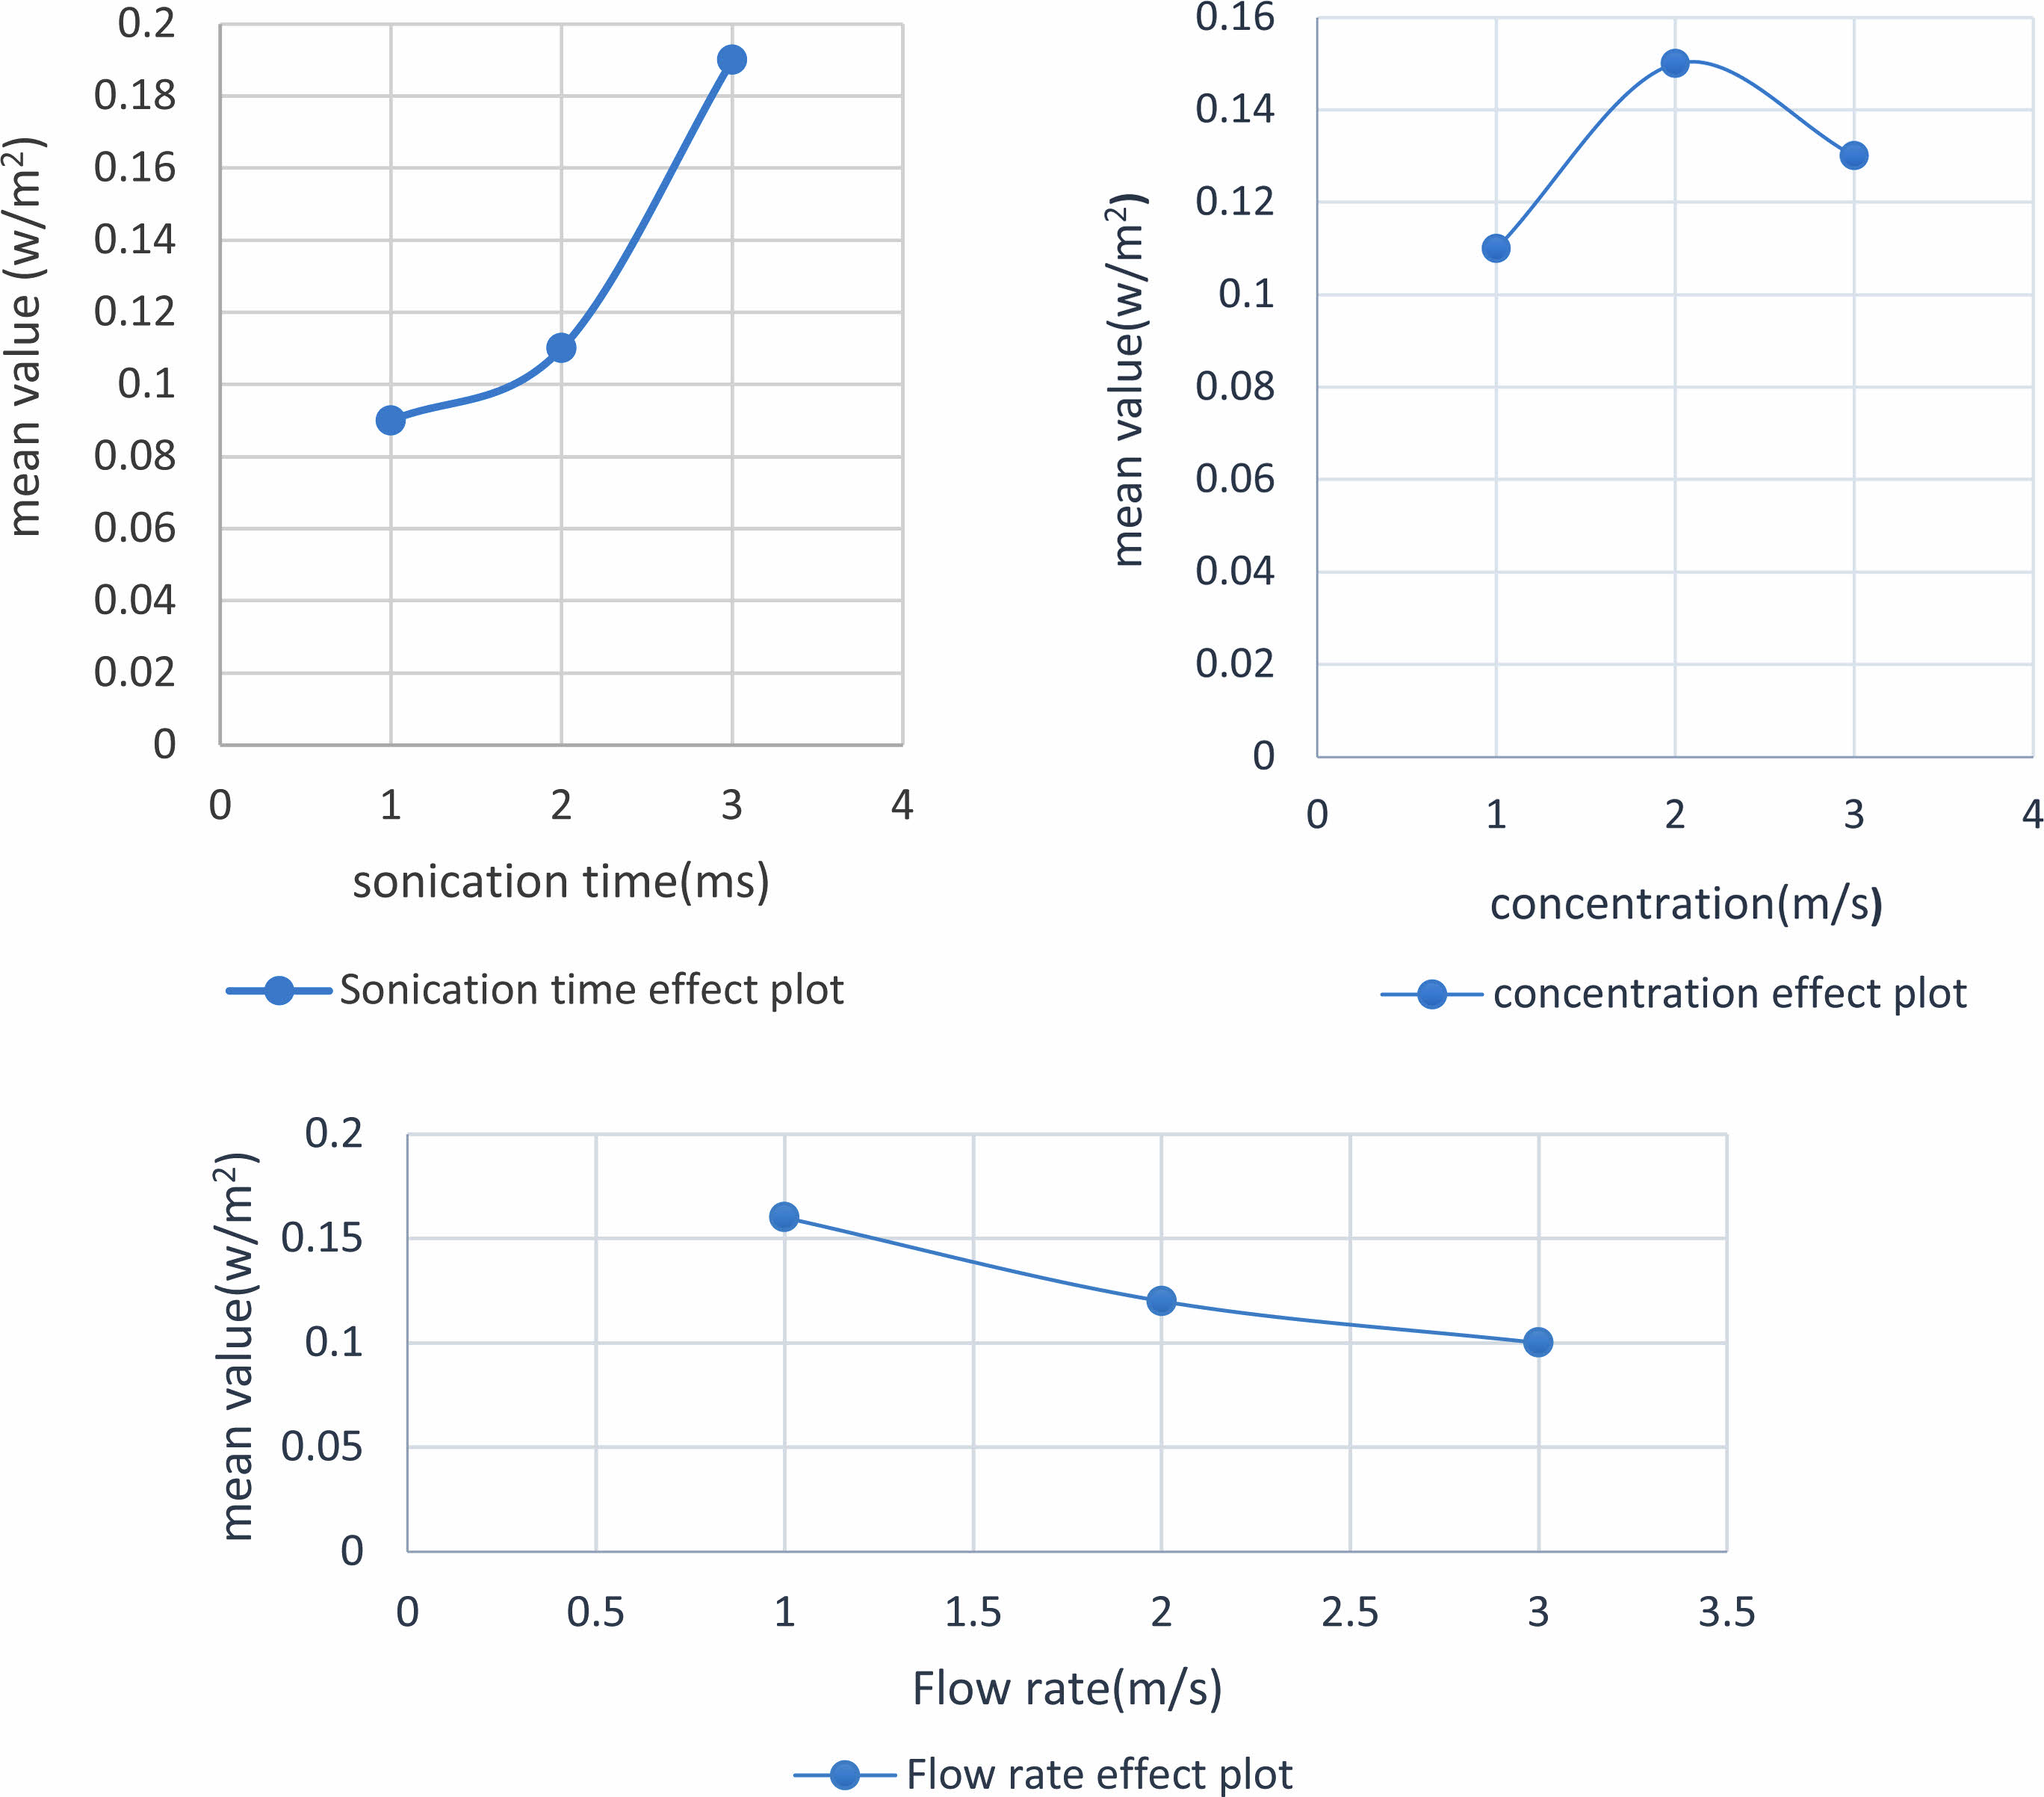
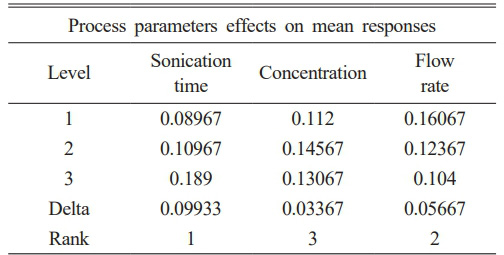
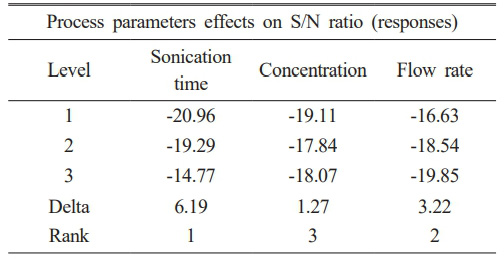
All the responses increase with increase in sonication time till level 3, while the response increases with concentration rise till level 2. The flow rate effect was found to be decrease with increase from level 1 to level 3. In order to determine the ideal parametric settings for any mechanical procedure, Taguchi’s SN ratio analysis is an effective tool. The properties of the statistics were represented using the SN ratio, which indicates the proportion of desirable to undesirable data. The data for mean and S/N ratio was found to follow the same pattern and the optimal predicted conditions were found to be level 3 (25 minutes of sonication time), level 2 (0.25% of nanofluid concentration) and level 1 (0.45% of flow rate of nanofluid). Increase in the sonication time to level 3 cause’s complete disaggregation of the nanoparticles, ultimately enhancing the thermal heat transfer properties. At optimum predicted conditions of Al2O3, yields highest Reynolds Number (610), Nusselt Number (2.6), Heat transfer (W) (530), Coefficient (W/m2 K) (415) and Flux (W/m2) (18.5) respectively. Literature reports that sonication time (incubation time) has a direct influence on the morphology, agglomeration characteristics, viscosity, pressure drop, heat transfer enhancement and thermal conductivity. Sonication time has a linear correlation with the number of individual nanoparticles. Moreover, beyond a certain sonication time, suspension thermal conductivity decreases, mandating the optimum range of the suspension . Thermodynamics and fluid dynamics are used to assess the effective viscosity of the nanoparticles in nano-dispersion base fluid while considering the impacts of nano-confinement, the interrelationships between nanoparticles and fluid, particle density, particle size, and its impacts on ecosystems, nanoparticle volume proportion, particle kinetics, the interfacial nanolayer, and volume fraction. Moreover, one of the most influencing factor dictating heat transfer behaviors of the nanofluids are the particle concentration and the flow conditions. The highest Reynolds Number (RN) (610), Nusselt Number (NN) (2.6), Heat transfer (W) (530), Coefficient (W/m2 K) (415) and Flux (K) (18.5) is achieved due to better nano-particle dispersion in the base fluid at longer sonication time, at lower concentration and average flow rate.
Moreover, it was established that the Reynolds and Nusselt number increased in parallel with a raise in the nanoparticle concentration in the nanofluid .Experimental data documented that increase in the thermal conductivity (Heat flow, heat transfer, and heat transfer coefficient), attributed at higher nanoparticle concentration increased. Increased kinetic momentum of the particles due to more particle collisions and Brownian motion at higher concentrations might contribute for the increase in thermal conductivity. Moreover, research has found that the viscosity of the nanofluid increases as the concentration of nanoparticles does as well .
Our results with respect to responses (Reynolds Number, Nusselt number, HTC) is correlated by the literatures reported Literature report that HTC and the NN has linear relation with RN.
The sonication time was found to be influencing parameter based on delta value for both the responses (Mean and S/N ratio). Fig. 2 and 3 represents the process parameters that mainly effects mean response and S/N ratios. Prolonged exposure of the base fluid containing nanoparticles to sonication results in the breakdown of larger particles into smaller particles, the strong van der Waals forces leads to small particle agglomeration and sedimentation, enhanced dissolution, and a lesser impact of zeta potential. Table 5 Literature has reported that aluminum-based nanoparticles disintegrate better than other inorganic nanoparticles (copper and manganese)[29]. SEM analyses have reported average particle sizes around 50-74 nm; moreover, literature has reported that the decreases in thermal conductivity leads to particle size decrease below 50 nm.
GRA has been employed for simultaneous optimization of multi-machining characteristics. Using GRA, optimization of the multi-machining characteristics was converted into single characteristic called grey relational grade. represents the ANOVA analysis of the responses.
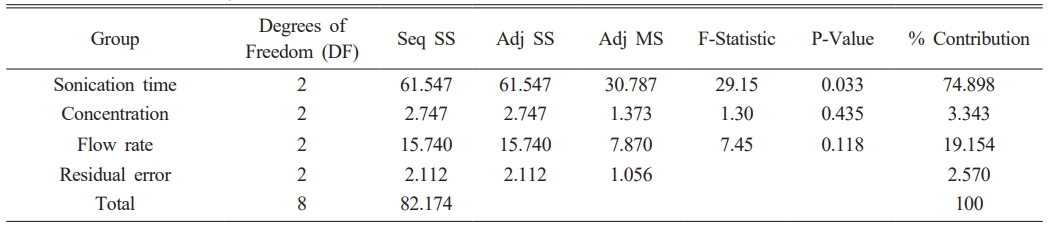
Table 6 and Table 7 ANOVA analysis was carried out using the grade obtained from GRA, have revealed that the sonication time factor was found to be significant (P value = 0.033). It was established from ANOVA for GRG values, the characteristics of multiple machining that the significantly affecting the parameters was found to be sonication time and concentration. Fundamentally, if the appropriate machining features were better, the GRG value will be larger. The optimal calculated GRG is 0.255, which is higher than the average grade for the nine trials. Consequently, by applying the current technique, machining qualities have been improved greatly.
From the regression analysis (Eq. (5)) it was found that sonication time and nanoparticle concentration was found to have positive influence on the response (grade), whereas flow rate was found to have negative response on the response (grade).
Experiments was conducted at the optimum predicted conditions (A3B2C1) and the response was found to have RN (592), NN (2.5), HT (W) (510), HTC (W/m2 K) (394) and Heat flux (K) (17.8). The experimental value was found in correlated with the predicted value of RN (610), NN (2.6), HT (W) (530), HTC (W/m2 K) (415) and HF (K) (18.5) respectively.
|
Fig. 2 The main effects plots of mean responses based on grade analysis. |
|
Fig. 3 The main effects plots of S/N ratio of the responses based on grade analysis. |

Taguchi optimization and GRA is an efficient method adopted in majority of the manufacturing and processing industries. There is a consistent quest for efficient process to quickly transfer heat from narrow variation zones/process employing base fluids with excellent thermal properties. The experimental results from the optimization, the following salient points are featured below;
1. Al2O3 based nanofluids was found to be efficient in transferring heat within the copper-based, serpentine-shaped microtube.
2. Based on ANOVA analysis, sonication time was found to be influencing parameter towards the response (p value = 0.033), followed by flow rate (p value = 0.118) and finally nanoparticle concentration (p value = 0.435).
3. GRA method was employed for optimizing multiple response characteristics (Reynolds number, Nusselt number, Heat transfer (W), HTC (W/m2K), and HF q(W/m2)).
4. The optimum predicted conditions was found to be Al2O3
5. Experiments was conducted at the optimum predicted conditions (Al2O3) and the response was found as follows; Reynolds Number (592), Nusselt Number (2.5), Heat transfer (W) (510), HTC (W/m2 K) (394) and HF (W/m2) (17.8).
6. The experimental value was found to be in correlation with the predicted values of Reynolds number (610), Nusselt number (2.6), heat transfer (W) (530), HTC (W/m2 K) (415), and heat flux (K) (18.5), respectively.
No participation of humans takes place in this implementation process
No violation of Human and Animal Rights is involved.
No funding is involved in this work.
Data sharing not applicable to this article as no datasets were generated or analyzed during the current study
Conflict of Interest is not applicable in this work.
All authors are contributed equally to this work
There is no acknowledgement involved in this work.
- 1. K. Apmann, R. Fulmer, A. Soto, and S. Vafaei, Mater., (Basel, Switzerland), 14 (2021) 1291.
-

- 2. E.M. El-Said, M. Abdulaziz, and M.M. Awad, Cogent Eng. 4 (2017) 1396638.
-
- 3. M.B. Wollele, H. Hv, and M. Assaye, Cogent Eng. 9 (2022) 2146627.
-
- 4. I. Elbadawy and M. Fayed, Alexandria Eng. J. 59 (2020) 1771-1785.
-
- 5. S.U. Choi and J.A. Eastman, Inter. Mech. Eng. Congr. Exhibition. (1995).
-
- 6. Z. Lyu, A. Asadi, I.M. Alarifi, V. Ali, and L.K. Foong, Sci. Rep. 10 (2020) 5185.
-
- 7. J.F. Kelly and M.G. Cotterell, J. Mater. Process. Technol. 120 (2002) 327-334.
-
- 8. L.S. Sundar, M.K. Singh, and A.C. Sousa, Int. Commun. Heat Mass Transf. 44 (2013) 7-14.
-
- 9. K.S. Pavithra, M.P. Yashoda, and S. Prasannakumar, Particul. Sci. Technol. (2019).
-
- 10. T.R. Prasad, K.R. Krishna, K.V. Sharma, and C.N. Bhaskar, J. Indian Chem. Soc. 99 (2022) 100461.
-
- 11. A.A. Radhiyah and K. Nurziela, J. Phys. Confer. Ser. 1529 (2020) 052036.
-
- 12. F. Mashali, E.M. Languri, J. Davidson, and D. Kerns, Heat Transfer Eng. 42 (2021) 479-491.
-
- 13. S. Das, A. Giri, S. Samanta, and S. Kanagaraj, J. Sci. Adv. Mater. Devices. 4 (2019) 163-169.
-
- 14. C. Maatki, Therm. Eng. 30 (2022) 101753.
-
- 15. S. Sridhar, V. Chinnathambi, P. Arumugam, and P.K. Suresh, Appl. Biochem. Biotechnol. 169 (2013) 911-922.
-
- 16. K. Gelis, K. Ozbek, O. Ozyurt, and A.N. Celik, Appl. Therm. Eng. 219 (2013) 119609.
-
- 17. W. Grine, and M.E. Benhamza, Heat Transfer—AsianRes. 48 (2019) 2930-2947.
-
- 18. S.E. Ghasemi, A.A. Ranjbar, M.J. Hoseini, and S. Mohsenian, J. Mater. Res. Technol. 15 (2021) 2276-2286.
-
- 19. N. Alagappan, N. Karunakaran, and C.S. Rathnasabapathy, Mater. Todays Proc. 24 (2020) 2094-2107.
-
- 20. K. Bennett and Y.T. Chen, Therm. Sci. Eng. Prog. 11 (2019) 167-194.
- 21. K. Jagatheesan and K. Babu, Biomass Conv. Biorefi. (2020) 1-8.
- 22. A. Asadi, F. Pourfattah, I.M. Szilágyi, M. Afrand, G. Żyła, H.S. Ahn, and O. Mahian, Ultrason. Sonochem. 58 (2019) 104701.
-
- 23. H. Machrafi, Nanoscale. 12 (2020) 15081-15101.
-
- 24. K.G. Sundari, L.G. Asirvatham, S.J.J. Marshal, S. Manova, M. Sahu, and M.J. Aaron, Mater. Today Proc. 47 (2021) 7045-7049.
-
- 25. S. Deb Majumder and A. Das, Front. in Mater. 8 (2021) 630182.
-
- 26. M. Saberi, M. Kalbasi, and A. Alipourzade, Int. J. Therm. Technol. 3 (2013) 10-15.
- 27. S. Mukherjee, P.C. Mishra, S. Chakrabarty, and P. Chaudhuri, J. Clust. Sci. 33 (2022) 1763-1771.
-
- 28. S. Pradhan, J. Hedberg, E. Blomberg, S. Wold, and I. Odnevall Wallinder, J. Nanopart. Res. 18 (2016) 1-14.
-
- 29. M.P. Beck, Y. Yuan, P. Warrier, and A.S. Teja, J. Nanopart. Res. 11 (2009) 1129-1136.
-
 This Article
-
2023; 24(6): 1071-1078
Published on Dec 31, 2023
- 10.36410/jcpr.2023.24.6.1071
- Received on Mar 2, 2023
- Revised on Aug 9, 2023
- Accepted on Aug 26, 2023
Services
- Abstract
introduction
materials and methods
results and discussion
conclusion
- Ethics Approval and Consent to Participate
- Human and Animal Rights
- Funding
- Data availability statement
- Conflict of Interest
- Author Contributions
- Acknowledgements
- References
- Full Text PDF
Shared
Correspondence to
- E. Manikandan
-
Department of Mechanical Engineering, Sri Manakula Vinayagar Engineering College, Puducherry - 605107, India
Tel : 9566299886 - E-mail: manikadane2609@gmail.com
Clean-Energy Research Institute(CRI), Hanyang University, 222, Wangsimni-ro, Seongdong-gu, Seoul, 04763, Korea
E-mail: jcpr@hanyang.ac.kr