


- Investigation and optimization on micro and nano Al2O3 reinforced aluminium composites using GRA coupled PCA technique
A. Srinivasana,*, R. Prabub, S. Rameshc and R. Viswanathana
aDepartment of Mechanical Engineering, AVS Engineering College, Salem-636003, Tamil Nadu, India
bDepartment of Mechanical Engineering, Mahendra Engineering College, Namakkal -637503, Tamilnadu, India
cDepartment of Mechanical Engineering, Jerusalem College of Engineering, Chennai -600100, IndiaThis article is an open access article distributed under the terms of the Creative Commons Attribution Non-Commercial License (http://creativecommons.org/licenses/by-nc/4.0) which permits unrestricted non-commercial use, distribution, and reproduction in any medium, provided the original work is properly cited.
Aluminum alloy are widely adopted material for engineering applications in automobile, aircraft and marine industries. Its high strength to weight ratio attracts modern industry to extend its applications in various domains. For producing various components, turning is the most reputed machining operation. The method of manufacturing directly impacts the product accuracy. The present research deals with fabrication and optimization study in dry turning of LM25 Aluminium Metal Matrix Composites (AMMCs). For AMMC fabrication, 10 wt.% of micro and nano Al2O3 ceramic particle is added as reinforcement. Hybrid Grey Relational Analysis (GRA) coupled Principal Component Analysis (PCA) technique is suggested for finding optimization results. Experiment was conducted with cutting speed (V), feed rate (f), and depth of cut(d) as input parameters. Based on optimization, feed rate dominates the entire turning process compared to cutting speed and depth of cut and 12.95% improvement of GRA was achieved at the end of confirmation experiment
Keywords: Al2O3, Ceramic composites, Hybrid optimization, LM25 alloy, Turning, GRA
This modern world visualized the new epoch in materials research. Specifically, development and demand of light materials is much needed in automobile industry. Aluminum alloy fulfills the needs of automobile industry due to its high strength and light weight. The present world is still in a hurry to develop different combination of lightweight materials in numerous applications [1]. Thus, the enhanced material property required in material application is fulfilled by Metal Matrix Composites (MMCs). MMCs offer enhanced material properties like minimum thermal conductivity and expansion, greater specific strength and stiffness etc. Aluminum Metal Matrix Composites (AMMCs) are widely used in huge applications due to its enriched material properties such as high strength, high fatigue etc. In aircraft and automotive sectors, AMMCs are used to reduce the parts weight, fuel and less pollution aspects [2-6].
LM25 aluminum alloy is the most widely used in automotive industry for the fabrication of cylindrical blocks, heads, wheels and other cast parts. Addition of reinforcement in AMMCs induces more strength and stiffness and offers high machinability [7-10]. Successive reinforcement characterization is noted by chemical composition, volume fraction and distribution of reinforcement particle in AMMCs [11]. Naguib G. Yakoub [12] studied the effect of nano zirconia in Al-7075 fabricated by stir casting process. He identified that ZrO2 reduces wear rate and friction coefficient and exhibited good tribological performance. Manjunatha and Anil kumar [13] studied the mechanical characterization of aluminum Al6061/ ZrO2/Zirconium sand hybrid composite. They stated that ZrO2 particles in AMMCs increased the tensile strength and hardness. Addition of 10 wt.% of ZrO2 and 2 wt.% of ZrO2 sand induces high strength when compared with base metal. Suresh et al. [14] investigated on LM25 alloy for evaluating mechanical and wear properties. They pointed that, hardness values of LM25 alloy reinforced with B4C (Boron Carbide) improved when compared with LM25 alloy. They also stated that, inclusion of Graphite (Gr) as reinforcement reduced the wear resistance in LM25-B4C. At the same time, Gr in LM25-B4C reduces hardness and material properties due to spongy nature of Gr (Graphite).
Surendaran et al. [15] examined the tribological behavior of LM25 with nano aluminum oxide (Al2O3). Better tribological behavior of LM25 was observed when 5 wt.% of Al2O3 was used amongst the other compositions selected due to even dispersion of Al2O3 in base metal. Elango and Raghunath [16] investigated the wear and friction resistance in LM25 alloy reinforced with Silicon Carbide (SiC) and Titanium dioxide (TiO2). They stated that, co efficient of friction (COF) reduced with respect to raise in TiO2. Wear rate of LM25+SiC+ 5% TiO2 was minimum while it was compared with LM25 alloy. In material research, selection of fabrication technique, methods of machining and machining parameters are the key factors. Properties of composites are controlled by the varying reinforcement and its percentage level. Commonly selected wt.% of reinforcement is 5 wt.% while SiC, Al2O3 and B4C are used as reinforcements in AMMCs. Drilling, turning and friction stir processing (FSP) are the common machining techniques adopted by researchers in AMMCs [17]. Periasamy et al. [18] analysed the mechanical properties in Al7075 by FSP technique and SiC and Gr added were selected as reinforcements. Experimental observations denote the formation of lubrication layer on the specimen due to addition of soft Gr. Significant improvement in hardness was identified in Al7075 due to the inclusion of SiC as reinforcement.
Kannan et al. [19] performed turning operation in Al7075 alloy fortified with SiC and Gr as reinforcement and found that addition of 3 wt.% SiC and 7 wt.% of Gr were identified as optimal reinforcement. Also, they pointed that parameters of 40 m/min cutting speed, 0.075 mm/rev feed and 0.3 mm depth of cut offered dominant impact on surface roughness of turned AMMCs and tool wear. At optimum condition, surface roughness improved by 16% and tool wear reduced by 22%. Hence performing optimization is much needed in material machining research. Optimization in machining parameters results in high precision outputs. Numerous research works were carried out in optimization techniques in which ANOVA, GRG (Grey Relational Grade) and GRC (Grey Relational Coefficient) are the most familiar techniques [20]. TOPSIS technique is also used in machining parameter optimization. In material turning and optimization, machining parameters such as feed, depth and cutting parameters played a key factor [21-24]. Dhanalakshmi and Rameshbabu [25] performed an investigation about influencing parameter on LM25 under dry condition. They reported about obtaining high GRG value in wet machining. Based on the experiments, 500 rpm cutting speed, 0.2 mm/min feed and 0.6 mm depth of cut were the optimum parameters while machining in CNC Machine.
On reviewing the past study, numerous researches were performed on AMMCs under various circumstances. Lot of research is carried out in improving materials. Based on past examination, it is evident that selection of reinforcement was done in the base of wt.% only. Hence influence of reinforcement size on machining need to be investigated. This paper is forced on optimization of machining parameters and size of reinforcement. For the present research, LM25 Al was selected and Al2O3 was chosen as reinforcement.
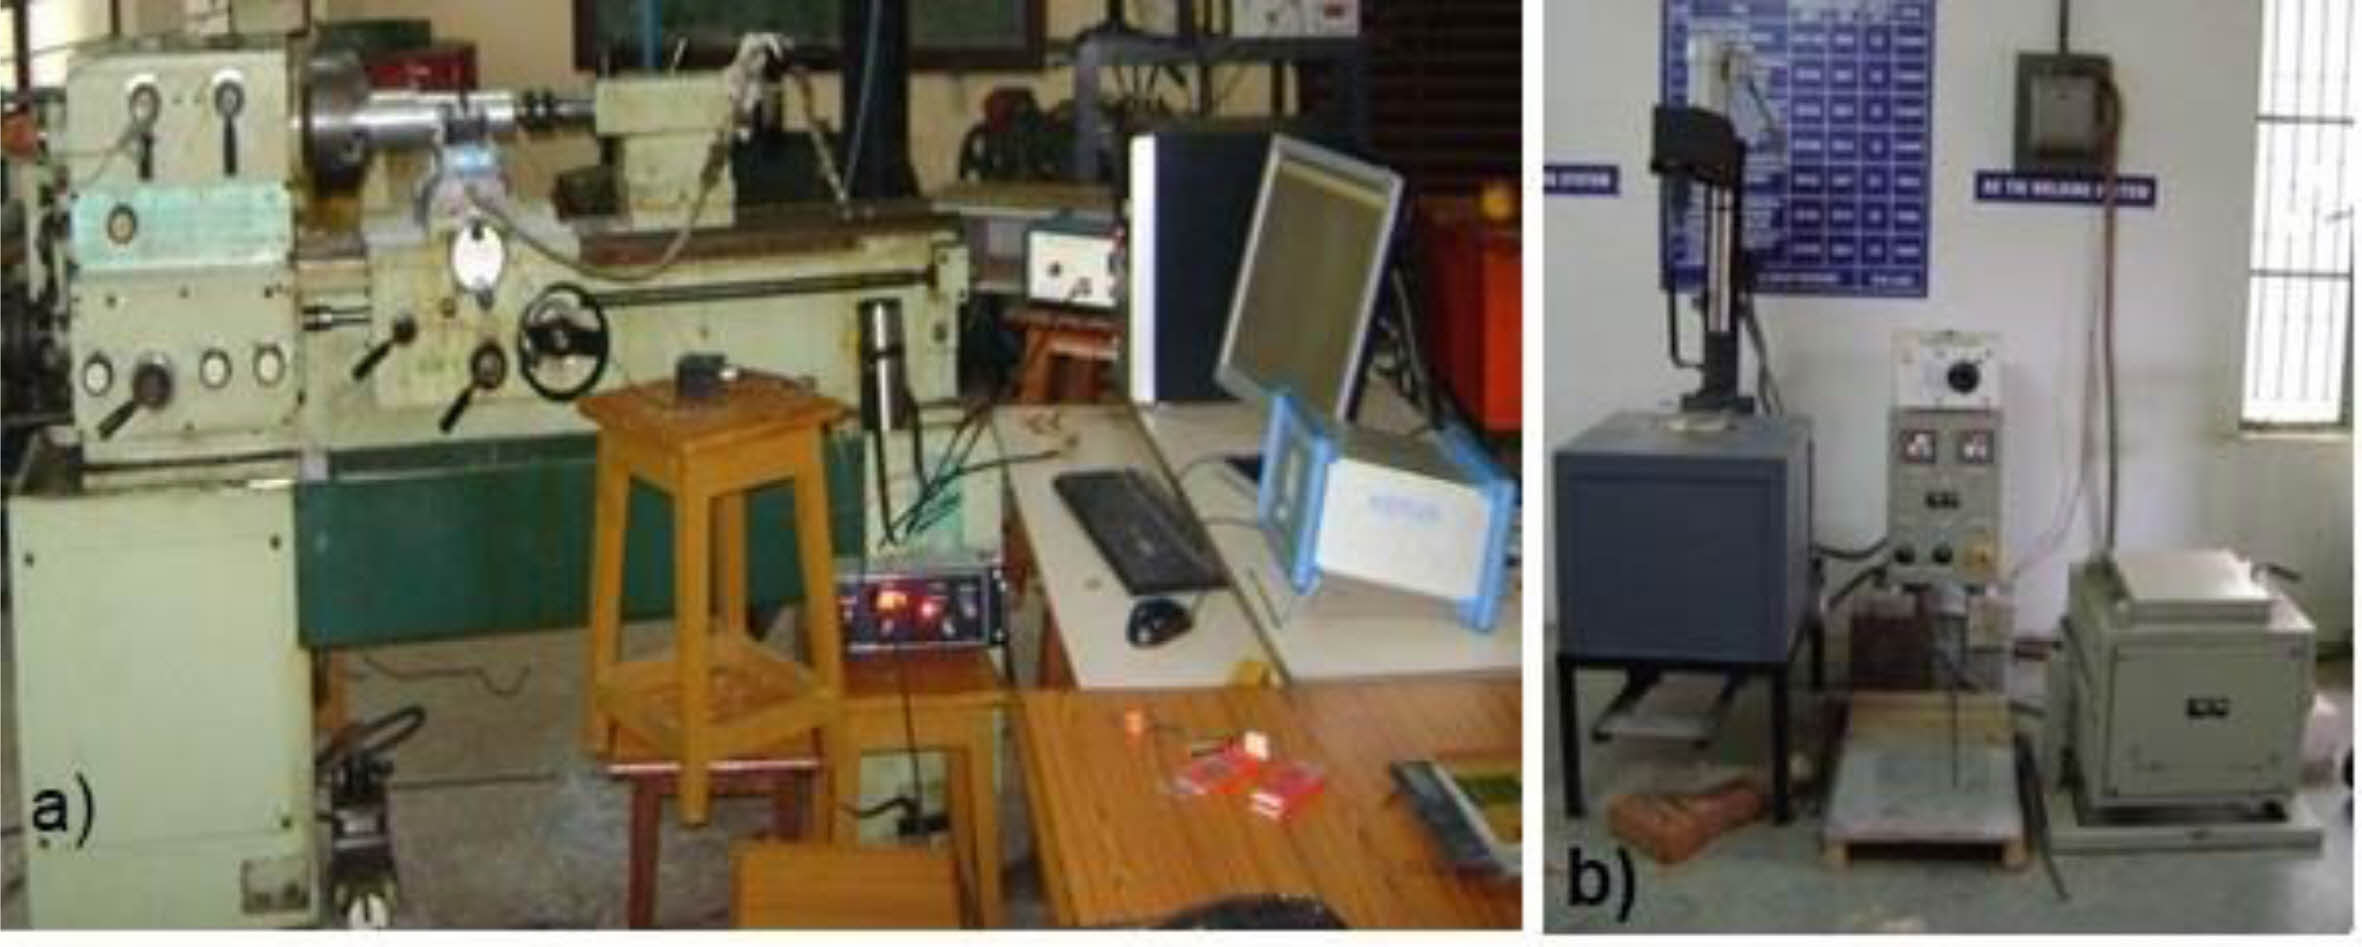
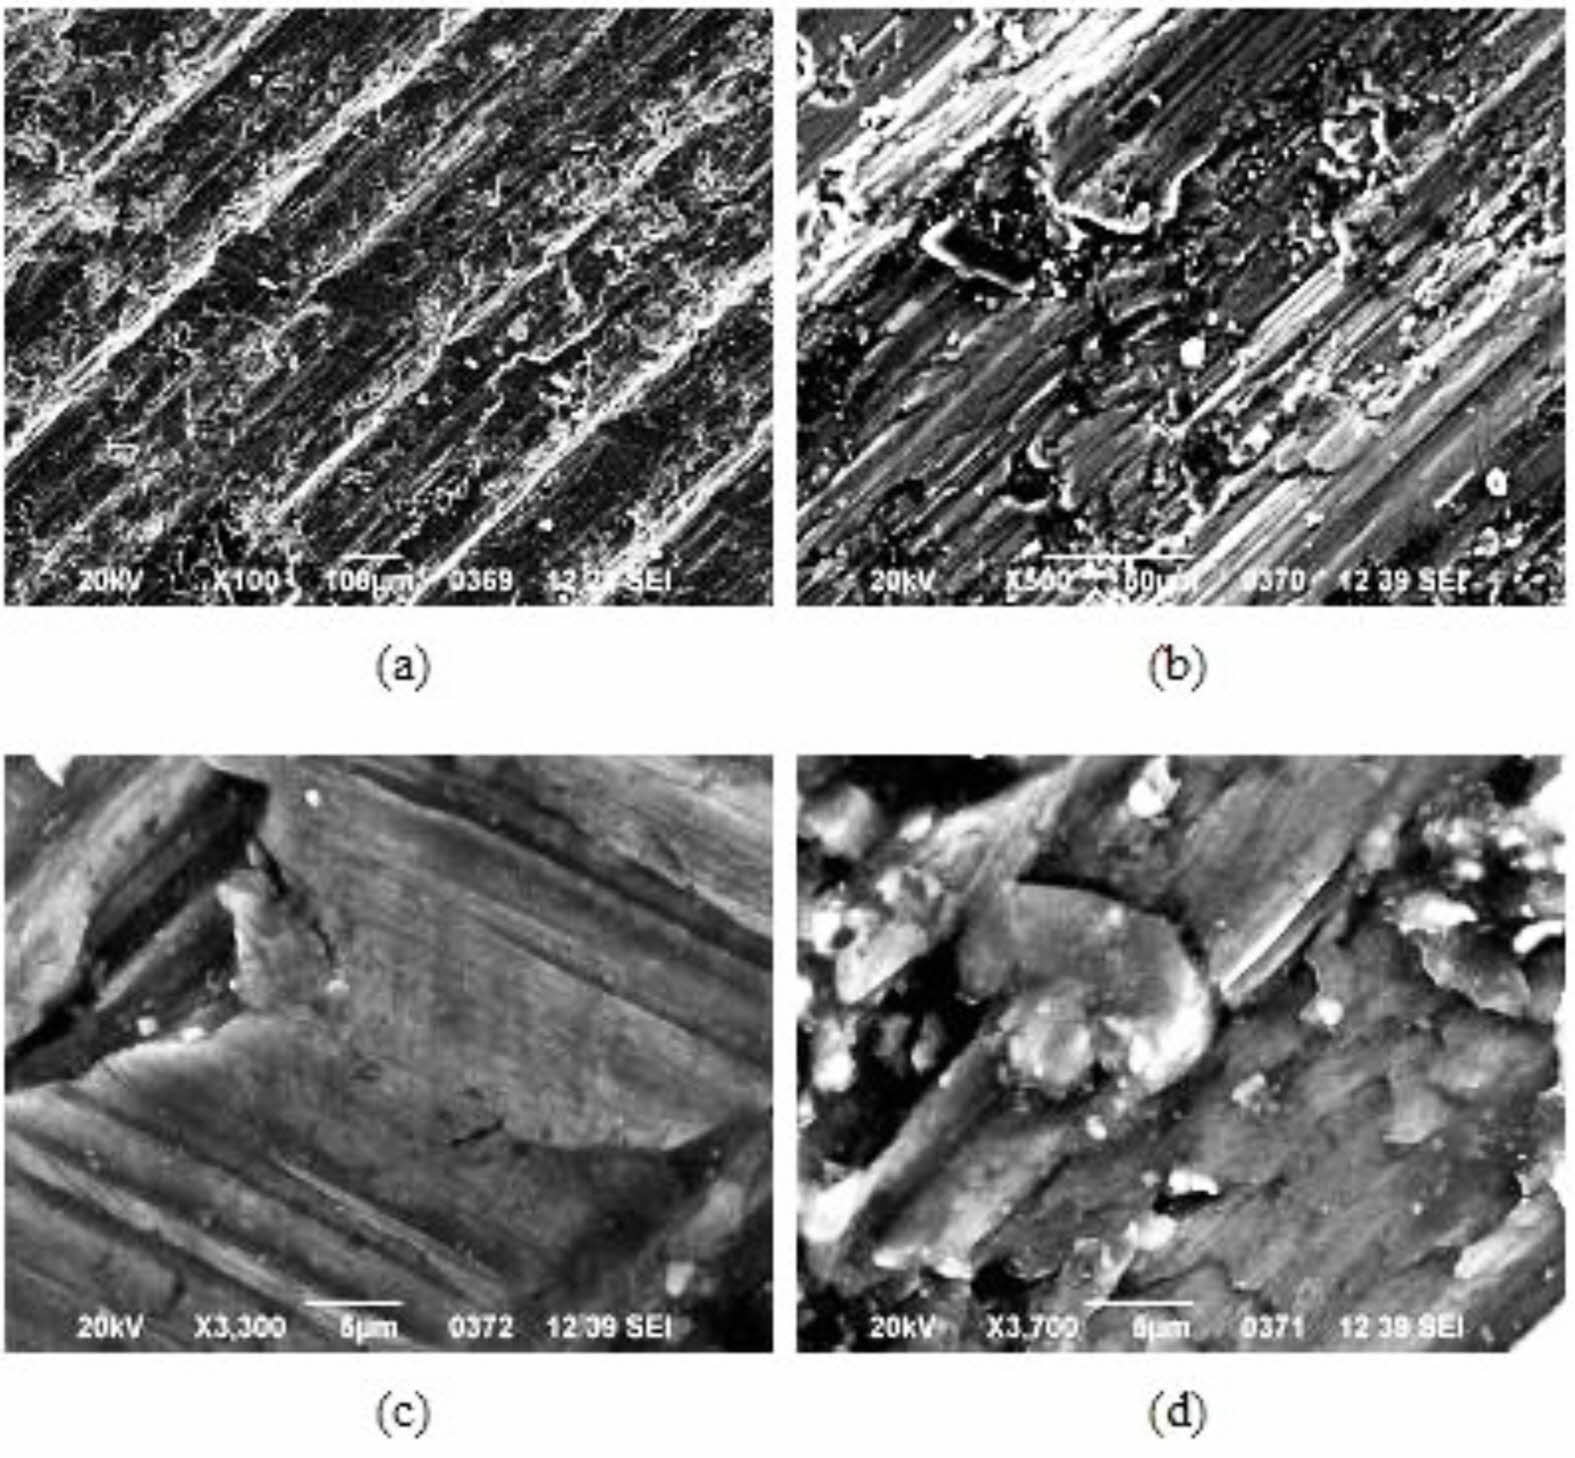
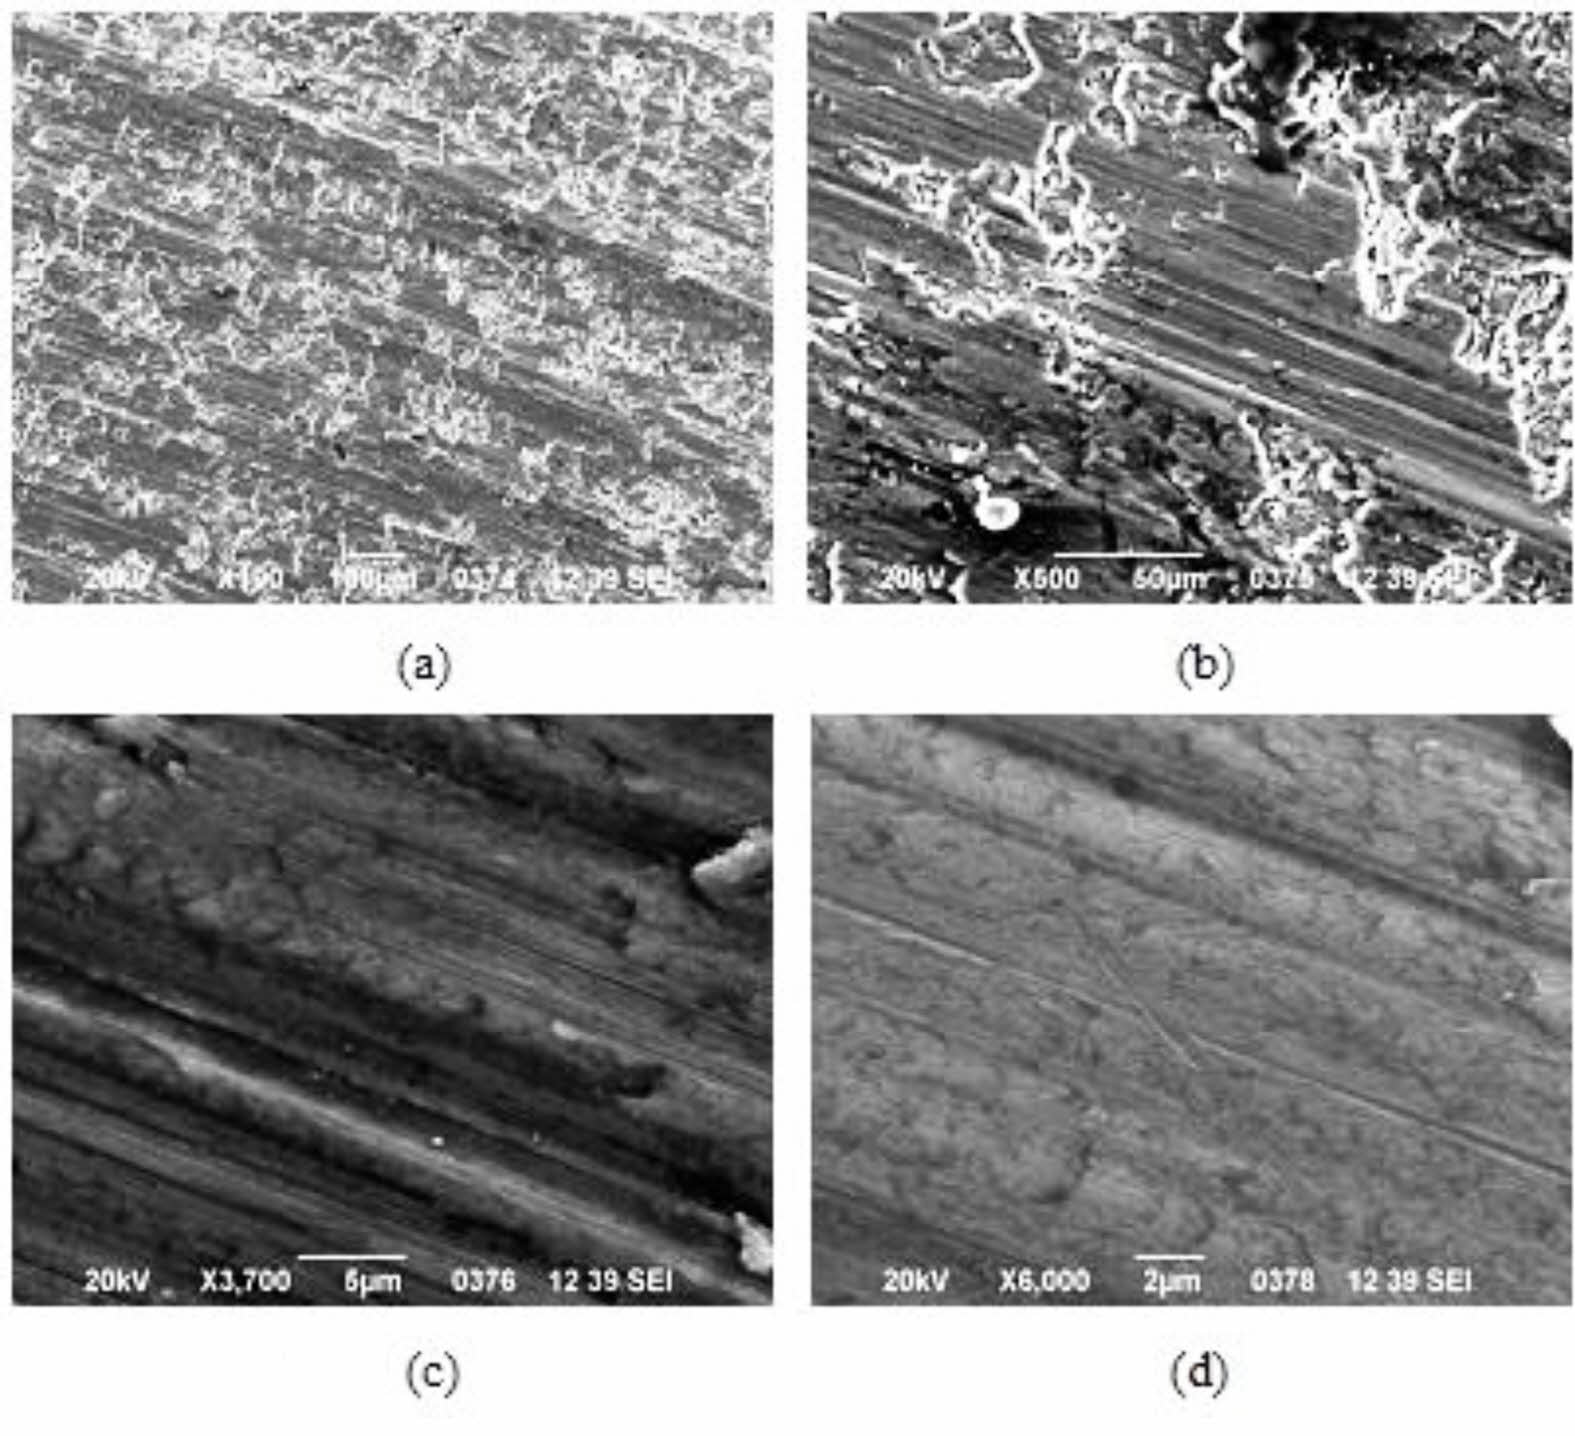
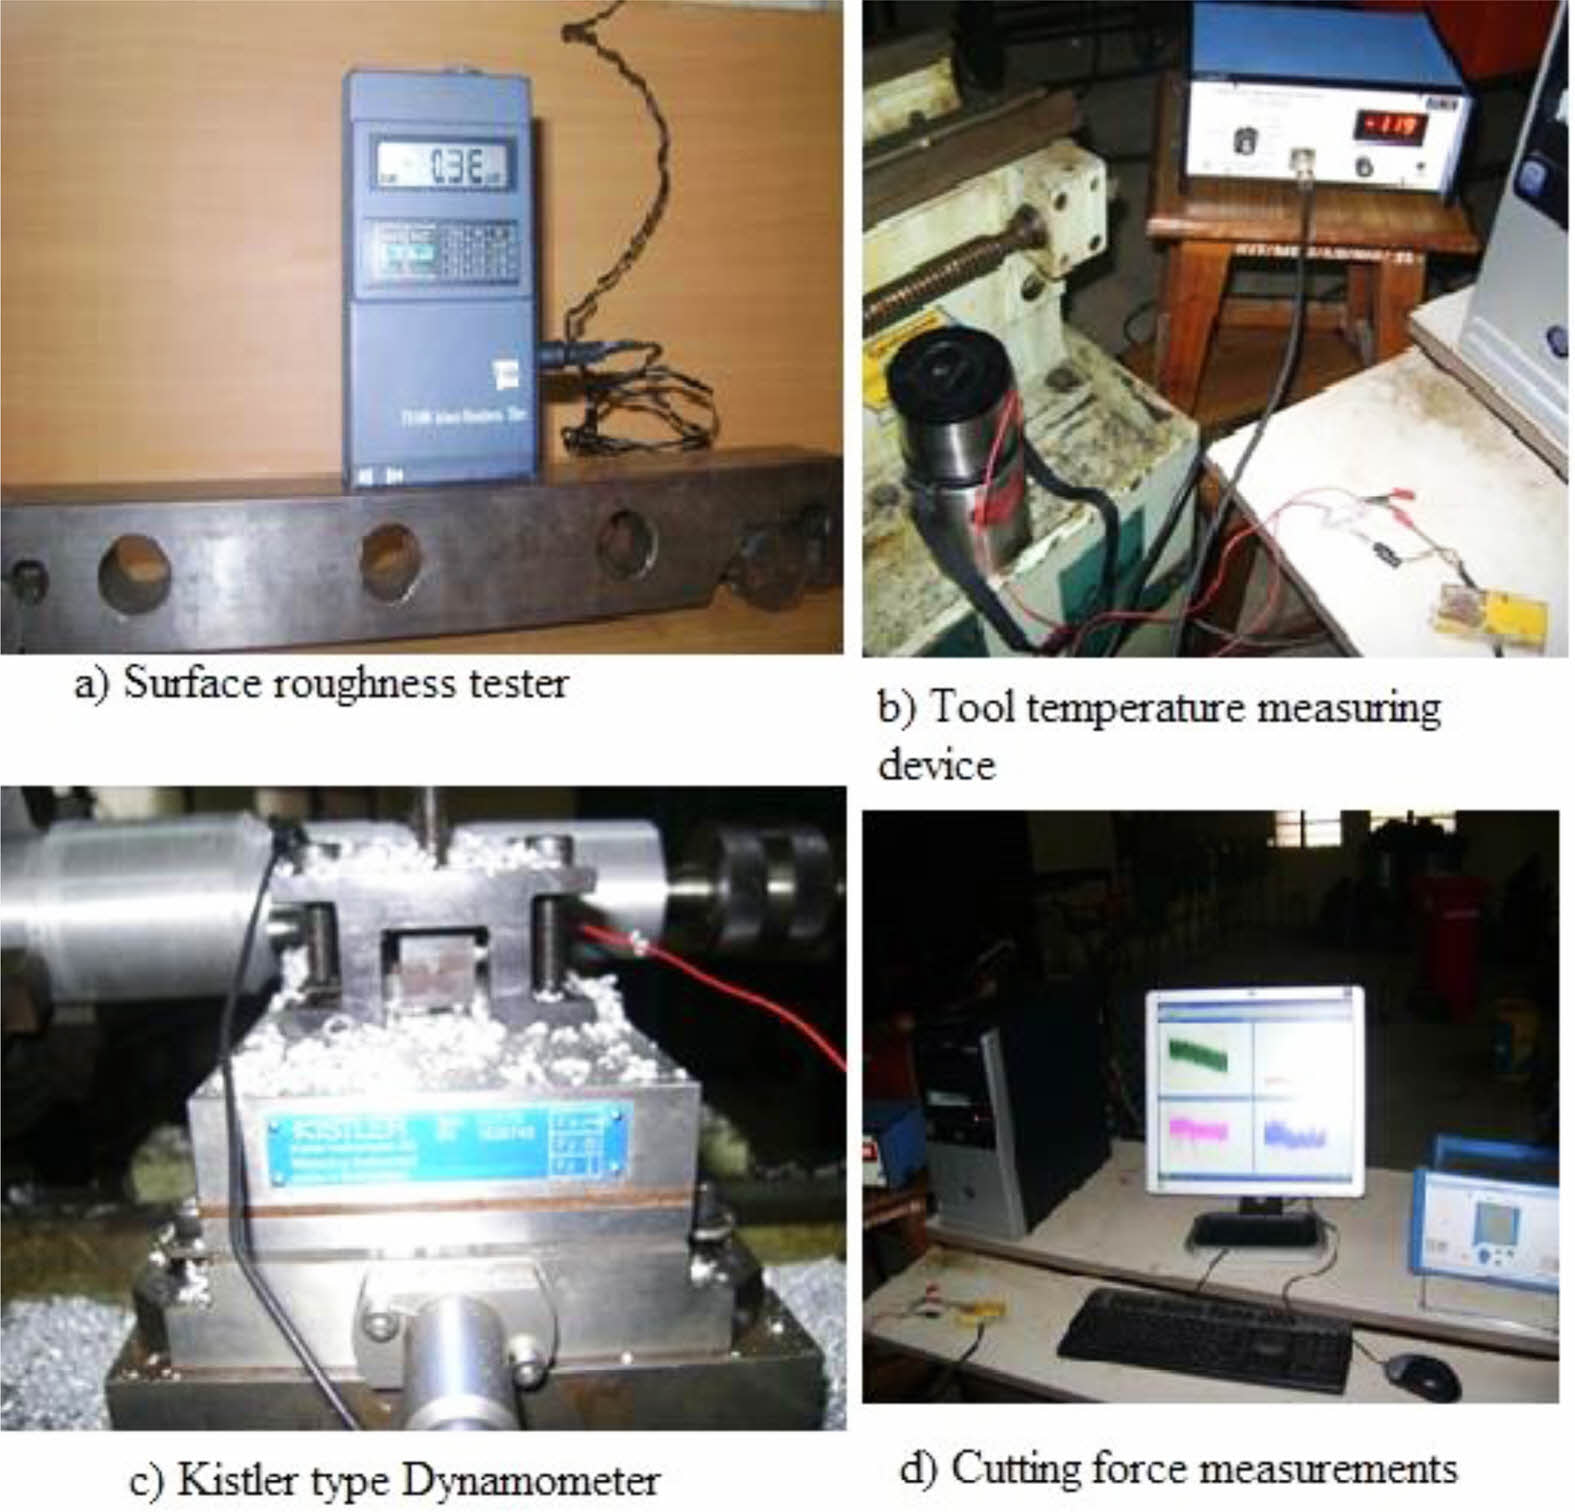
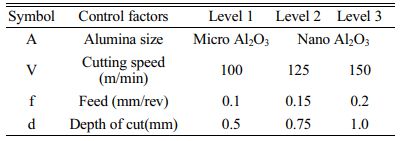
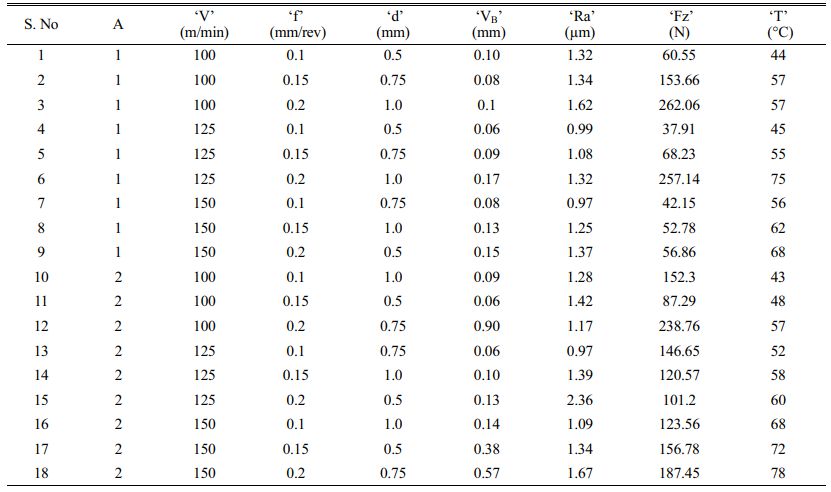
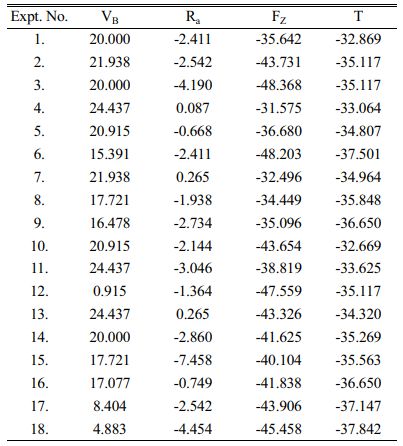
AMMCs were fabricated by stir casting process with 10 wt.% of micro and nano Al2O3 particles as reinforcement. The average particle size of micro and nano alumina is 25 µm and 40 nm respectively. Initially a base metal is melted using electrical induction heating furnace in a graphite crucible at 720 °C. The mixing of Al2O3 particles along with base metal is done by mechanical stirring mode at 650 rpm. Lastly, it is poured into a zircon coated steel die. The hardness of the fabricated composite specimen was found as 36 HRB and 58 HRB for micro and nano Al2O3 reinforced composites respectively. Fig. 1 shows the experimental setup. Fig. 2 and 3 represents the SEM image of micro and nano Al2O3 particles reinforced AMMCs at different magnifications and it is observed that no pores have been observed and indicate better wettability between the matrix and reinforcement particles. This research focused on performing turning operation in LM25 Al MMC under dry condition. Kirloskar Turn Master all geared type lathe machine is used to perform turning operation. Selected parameters for performing turning operation are based on earlier findings [19, 26-29] and given in Table 1. For optimization, L18 orthogonal array was selected. Surface roughness (Ra), cutting force (Fz), tool wear (VB) and tool temperature (T) were the output parameters which are measured by TR100 surface roughness tester, Kistler dynamometer (SN type), tool maker’s microscope and tool temperature thermocouple setup respectively as shown in Fig. 4. Calculated experimental values are represented in Table 2.
|
Fig. 1 (a) Experimental setup. (b) Stir casting setup |
|
Fig. 2 SEM image of micro Al2O3 reinforced composites (a) 100×; (b) 500×; (c) 3300× and (d) 3700×. |
|
Fig. 3 Fig. 5 SEM images of nano Al2O3 reinforced composites: (a) 100×; (b) 500×; (c) 3700× and (d) 6000×. |
|
Fig. 4 Measurement of responses. |
Grey Relational Analysis (GRA)
GRA is used to find the optimal machining parameters and cutting conditions while using multi response complex problems [30, 31]. Rank system is used to find the best optimal values. The following effective steps are used for finding GRC and GRG.
STEP 1: Calculation of S/N ratio is the first step of GRA. This article concentrated on minimizing the response for optimal conditions.
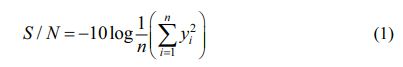
N = No. of observations and y = observed data.
STEP 2: Normalization is the second stage in GRA technique. The response value obtained from S/N ratio normalized is by normalization formula. Suitable formula for obtaining the normalized value is represented in eq. (2).
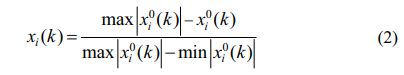
xi(k) = Value of normalization, k = performance characteristics, i = no. of experiments
STEP 3: The expression used to compute GRC value is given below.
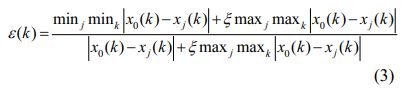
Here, ε(k)= grey relational coefficient
j = 1, 2, 3… n
k = 1, 2, 3…. m
n = experimental data
m = observed performance characteristic.
Distinguishing coefficient (ξ) = 0.5.
STEP 4: Average value of GRC is used to find the GRG value. The expression used to determine the GRG is presented in Eq. (4).
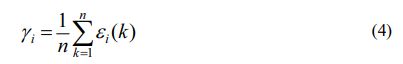
Where k = performance characteristics, i = no. of experiments
Principal component analysis (PCA)
The current work is focused on performance characteristics and finding suitable input parameters. Shihab et al. [32] carried an investigation and studied about GRA and PCA in turning of alloy steel and found both GRA and PCA to be effective methods of optimization. Following steps are adopted for PCA technique [33].
STEP 1: In PCA, normalization of output performance is considered as first step. Here xik is considered as output responses. The normalization value of output performance is calculated by Eq. (5) and (6).
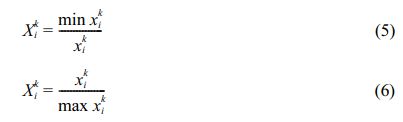
Where k = 1, 2, 3…n
n = no. of output characteristics
i = 1, 2, 3…m
m = no. of Experiments
STEP 2: The second step of PCA technique indicates the determination of covariance matrix, Eigen values and Eigen vectors. The covariance matrix is expressed in Eq. (7)
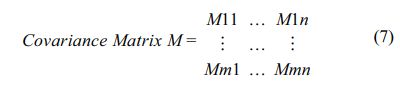
The Eigen values are denoted by λk. It is calculated by Eq. (8).
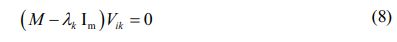
Where Vik = Corresponding Eigen Vectors
M= Covariance matrix.
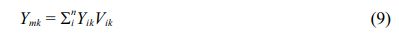
STEP 3: The final step of PCA indicates the individual principal component formation and it is expressed in Eq. (9)
The main aim of this experimental work is to diminish the VB, Ra, FZ and T. Based on Eq. (1), S/N ratio of output responses was calculated and plotted in Table 3.
GRG Analysis
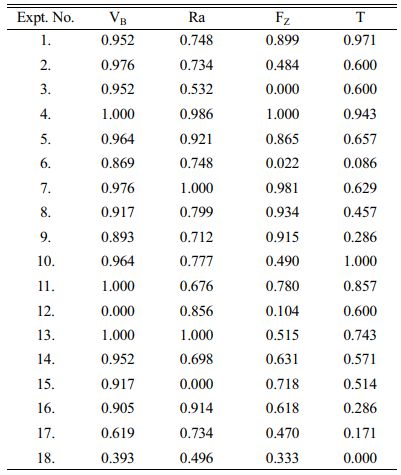
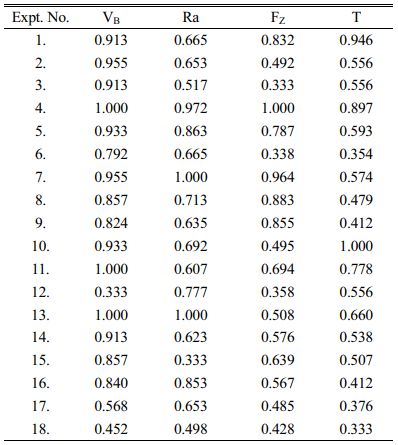
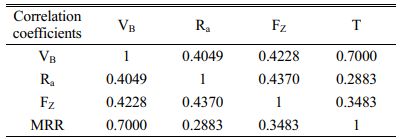
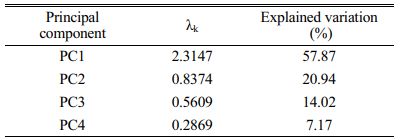
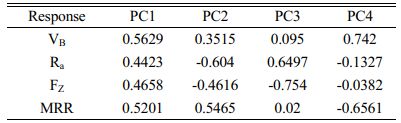
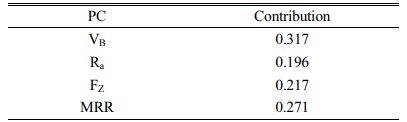
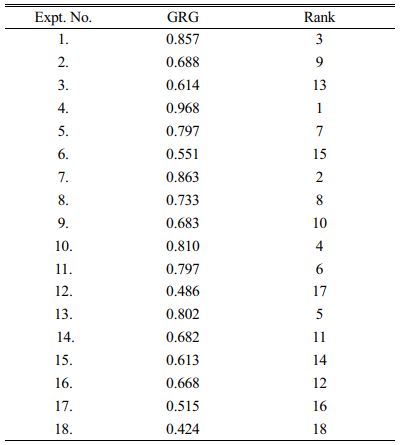
The normalization values of measured output values were determined by using Eq. (2) and normalized values are plotted in Table 4. The corresponding GRC values were determined by using Eq. (3) and it is represented in Table 5. In this work, GRA and PCA are coupled with each other to evaluate the optimal cutting conditions. Later, PCA is used to determine the influencing parameters among all values. The correlation coefficient amount targeted quality characters are calculated and presented in Table 6 and its performance features are given in Table 7. The Eigen vectors of each performance feature are plotted in Table 8. Performance characteristics of principal components are determined by adding Eigen vectors and it is given in Table 9. Based on plotted Table 7, principal component one features high as 57.87% compared to remaining three principal components. After calculation of weighted values, GRG values were found by using Eq. (4). The ranks of parameters with GRG values are presented in Table 10. Based on GRG, maximum GRG represents best quality characteristics.
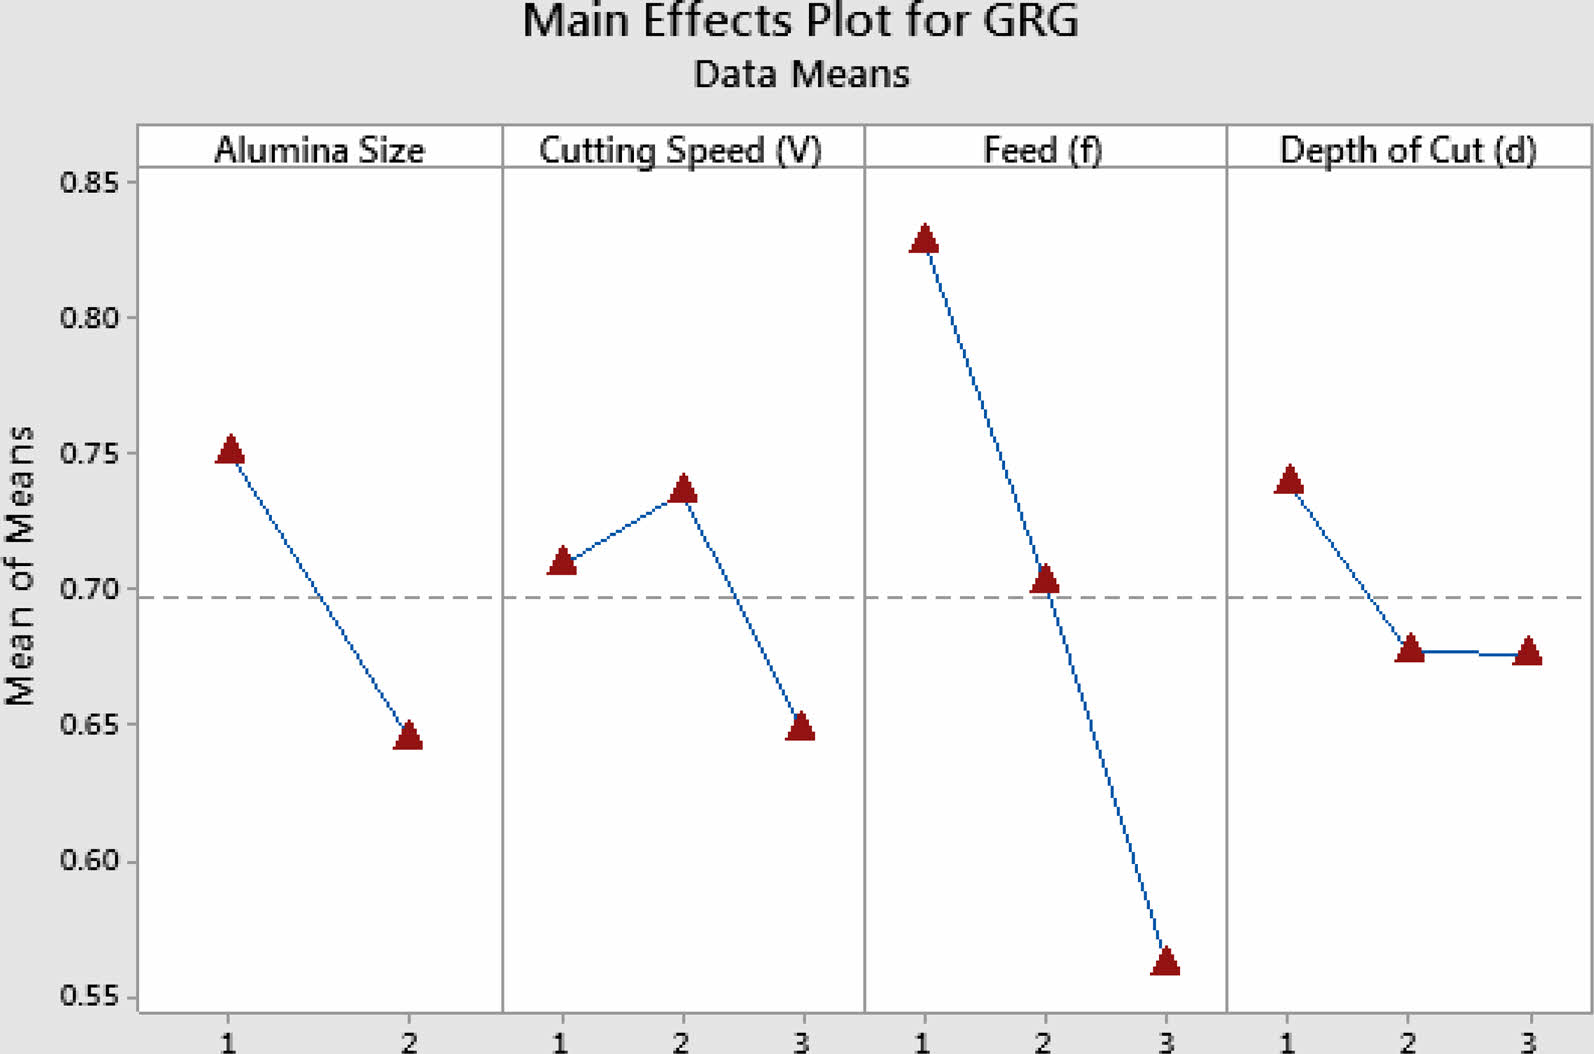
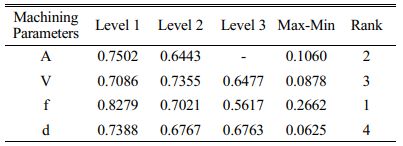
Maximum GRG value was obtained in experiment four. Among 27 experiments, the maximum GRG of 0.968 was achieved. The optimum parameter for machining LM25 is evaluated from GRG and it is plotted in Table 11. From Table 11, A1V2f1d1 is indicated as optimum condition for dry turning of AMMCs. Micro Al2O3 is preferred when compared to nano reinforcement. Likewise, 125 m/min cutting speed, 0.1 mm/rev feed and 0.5 mm depth of cut were identified as optimum parameters and represented in Fig. 5. Based on analysis of variance technique, identification of dominant factor is much easier [34-36]. From Table 11, it is evident that feed rate is the most dominant factor followed by alumina size and cutting speed.
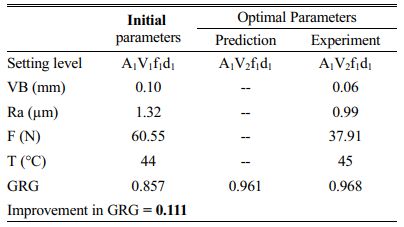
By utilizing the optimal parameters, confirmation experiment was carried out to examine the accuracy of the optimization result [37]. Table 12 indicates the confirmation test. Improvement in GRG was registered by 12.95% when compared with initial experiment.
Analysis of variance
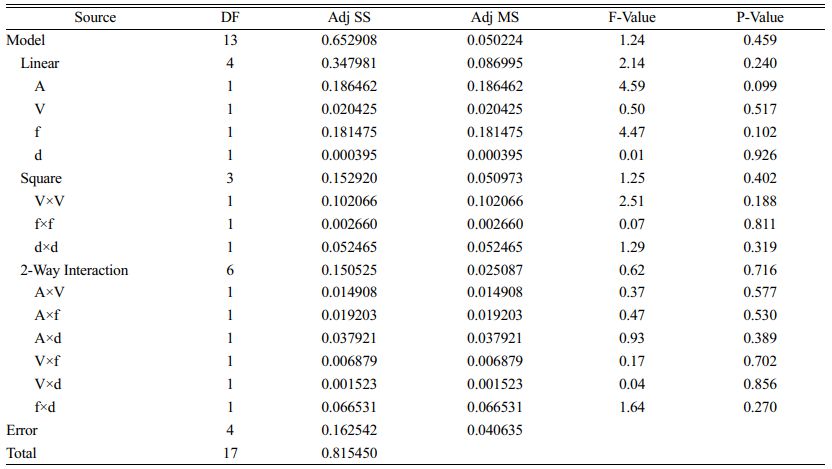
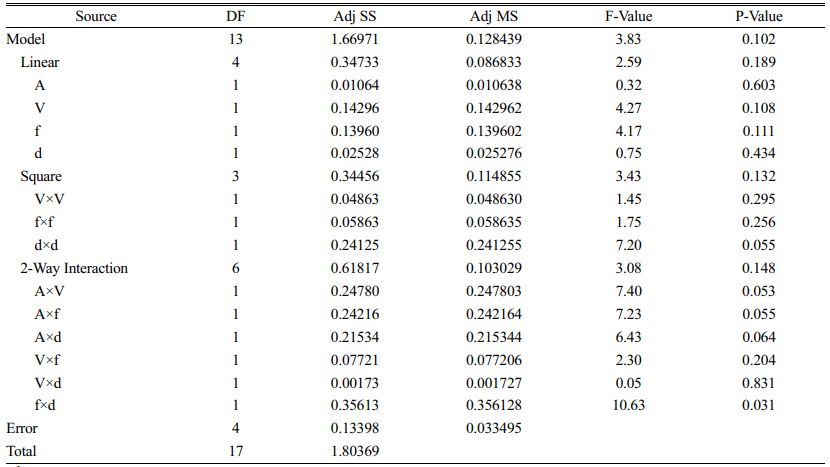
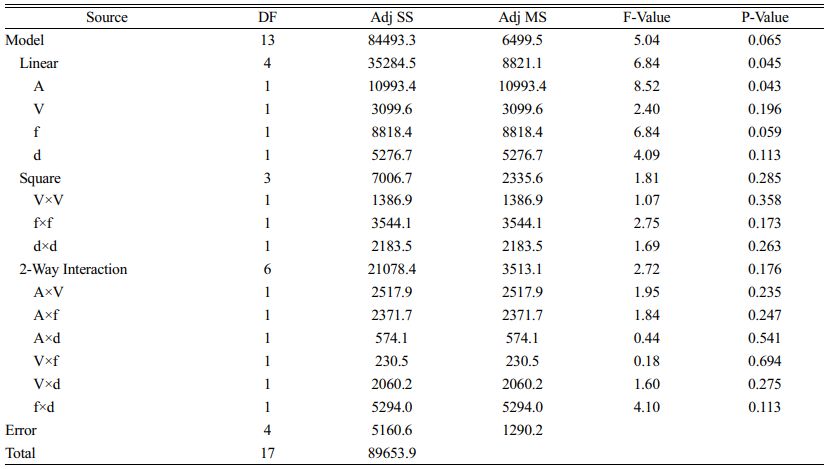
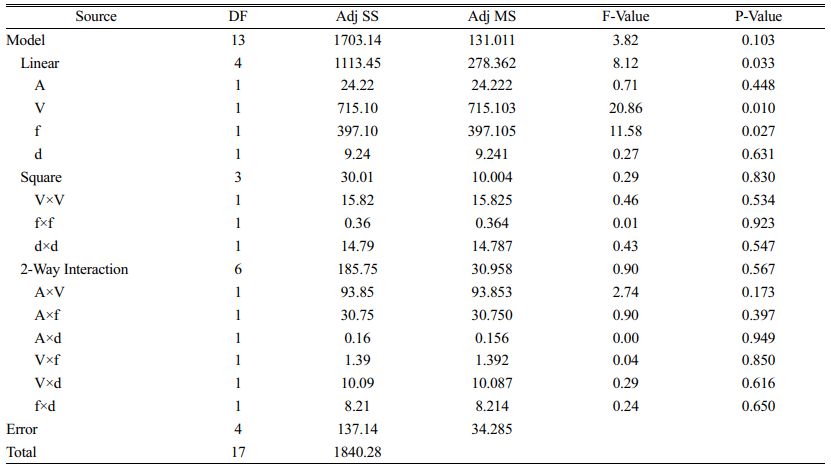
ANOVA study was computed to identify the most influencing factor on each parameter. Response surface methodology (RSM) is a key factor for researchers aimed at developing quadratic model. For output response and arithmetic model development, RSM was utilized [38, 39]. To get better optimization results, VB, Ra, Fz and T empirical model was developed and expressed in Eq. (10) to Eq. (13).
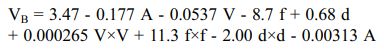
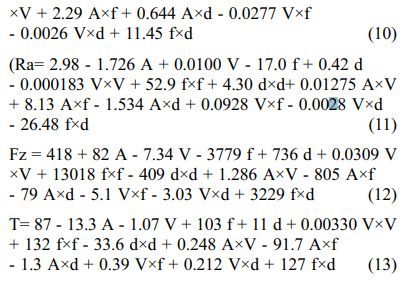
The computed value of ANOVA for VB, Ra, Fz and T are given in Table 13, 14, 15 and 16 respectively. From table values, it is evident that the R2 value of VB, Ra, Fz and T are 90.07, 92.57, 94.24 and 92.55% respectively. Hence based on R2 value represents the significant model development [40-42].
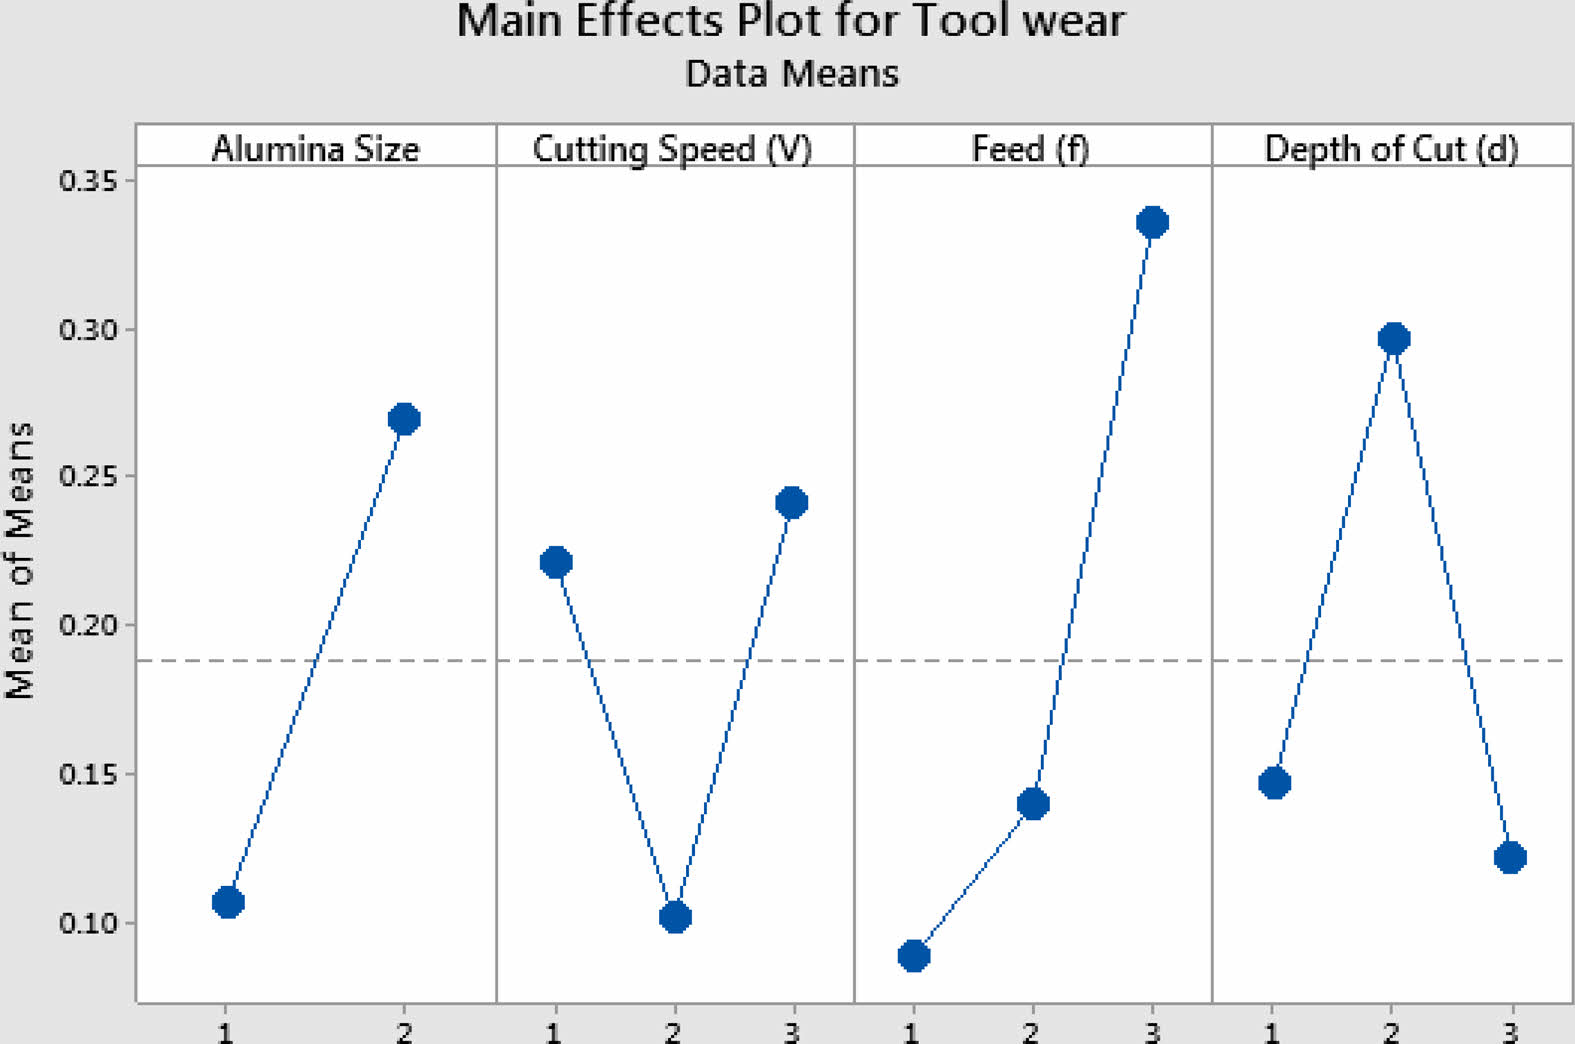
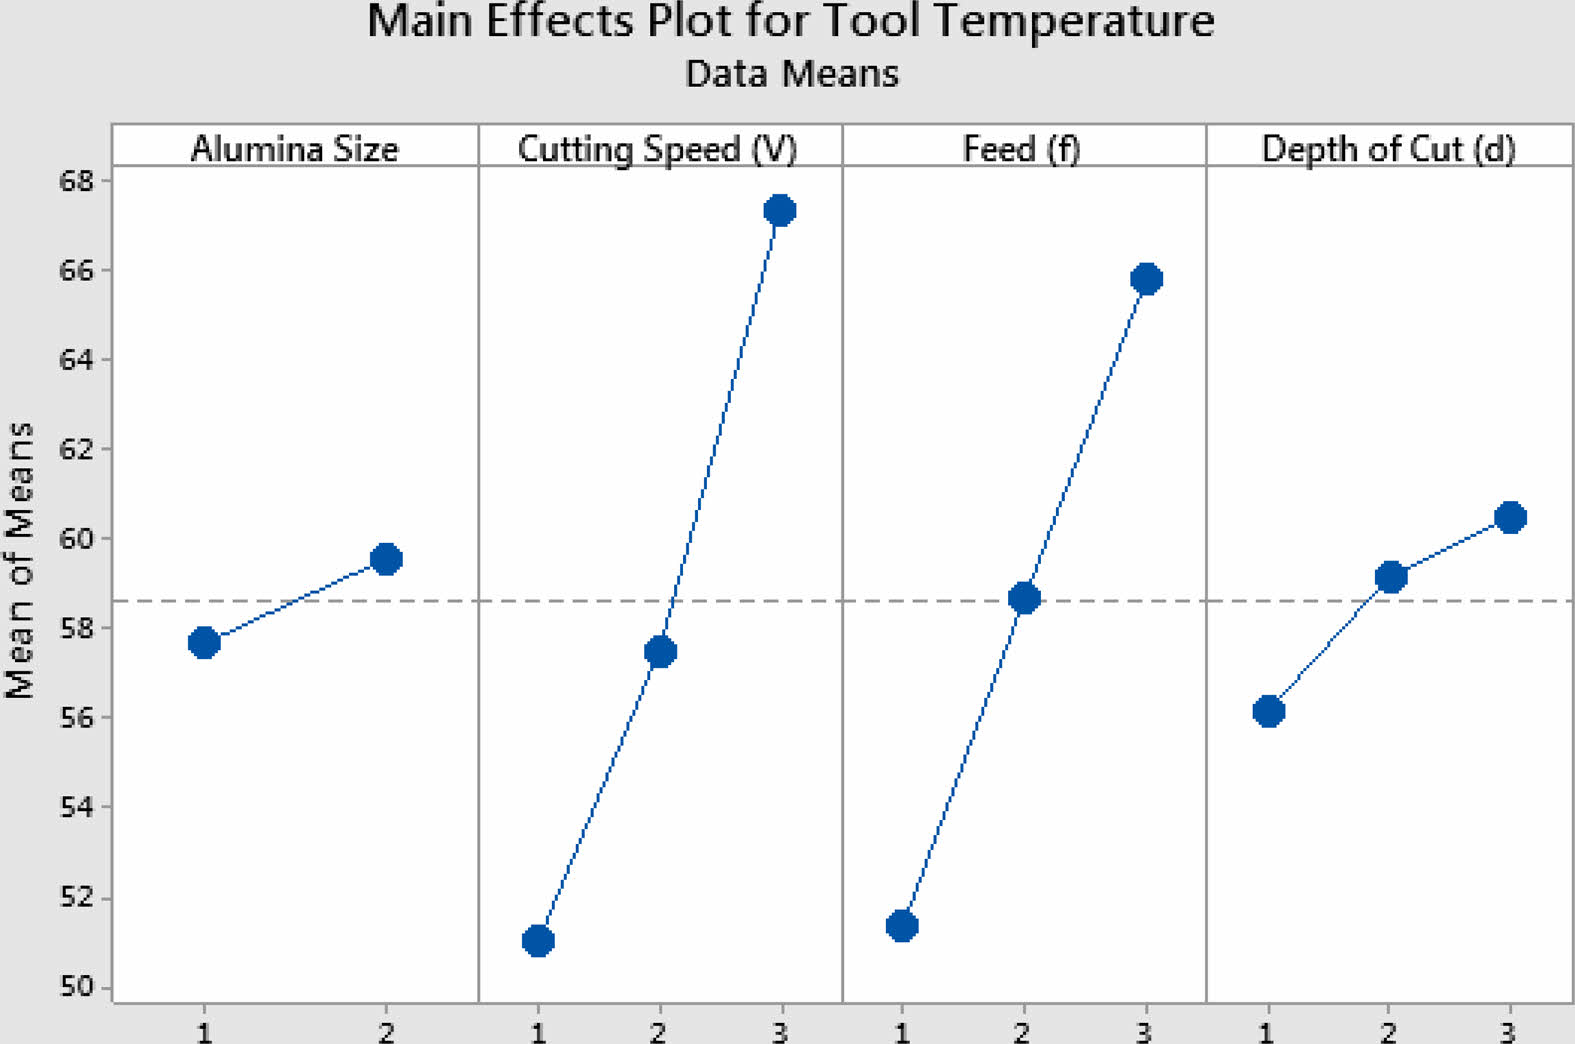
Mean response plot for all the parameters was drawn for further analysis. Fig. 6 to Fig. 9 represents the main effect plot for VB, Ra, Fz and T respectively. To minimize tool wear, parameters such V=150 m/min, f=0.2 mm/rev, d=0.75 mm and nano size reinforcement are suitable factors. For all the output response, nano Al2O3 is preferred. Nano reinforcement offered uniform distribution of the particles. High depth of cut results in higher wear. So, moderate depth would reduce the tool wear. Reinforcement like hard alumina increases the hardness of the AMMCs. Hence, nano reinforcement offered good strength to the MMCs and does not affect the tool. Fig. 7 Fig. 8
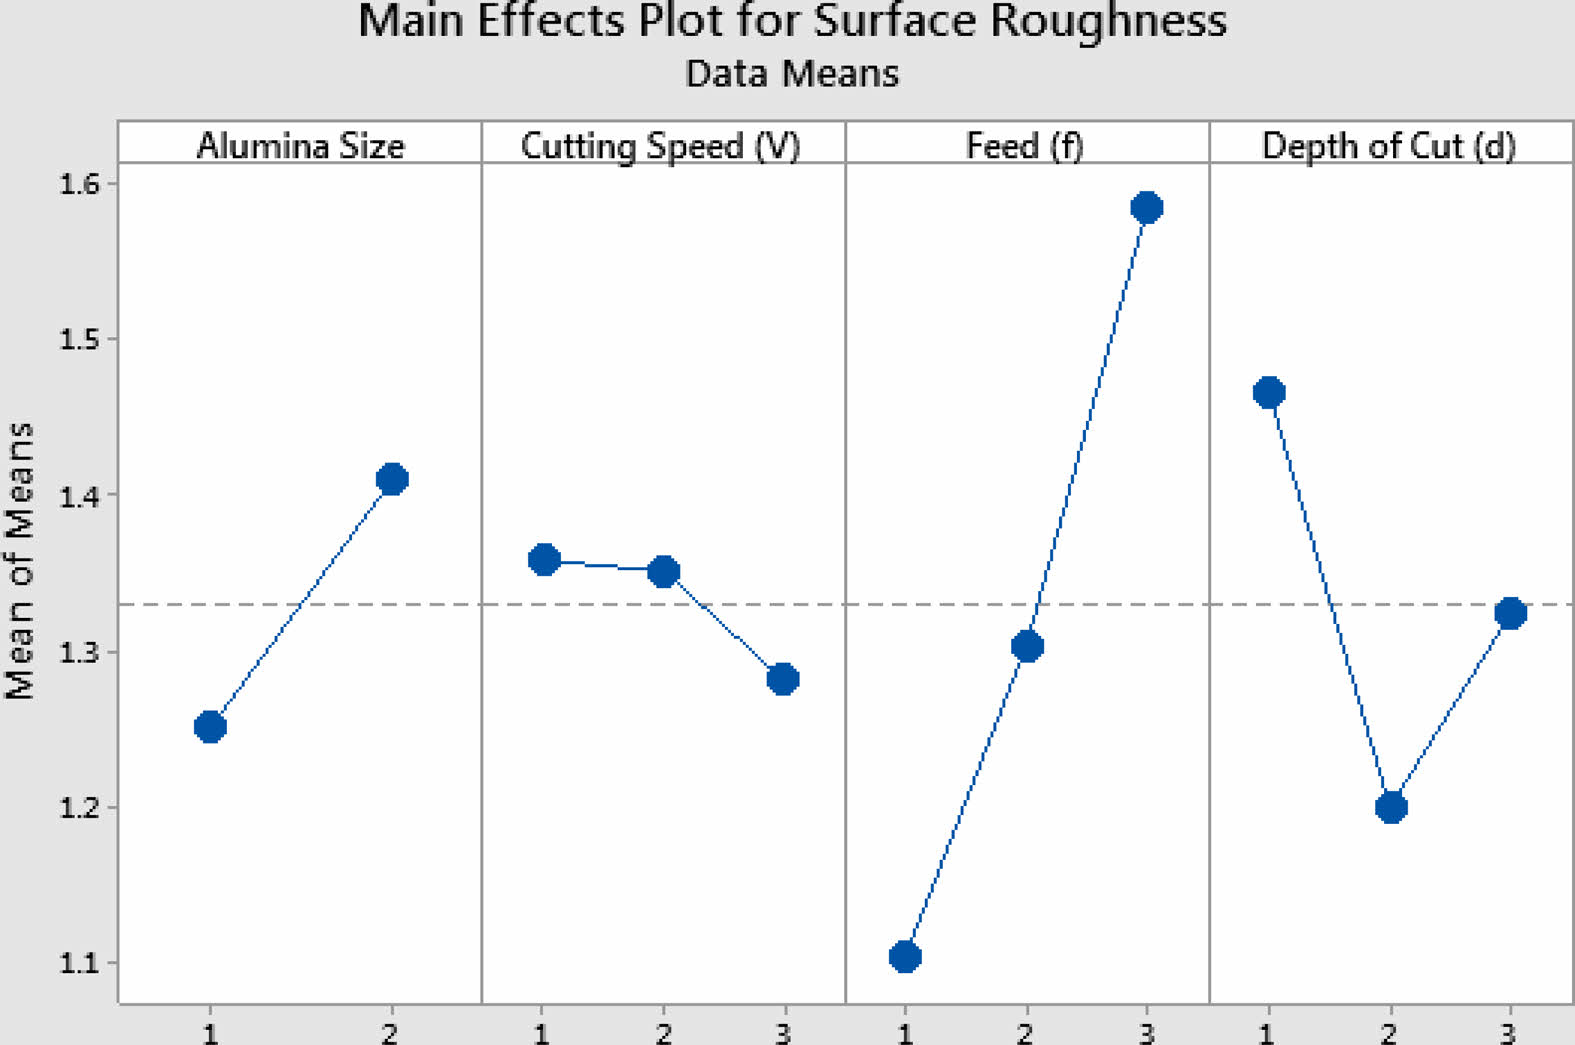
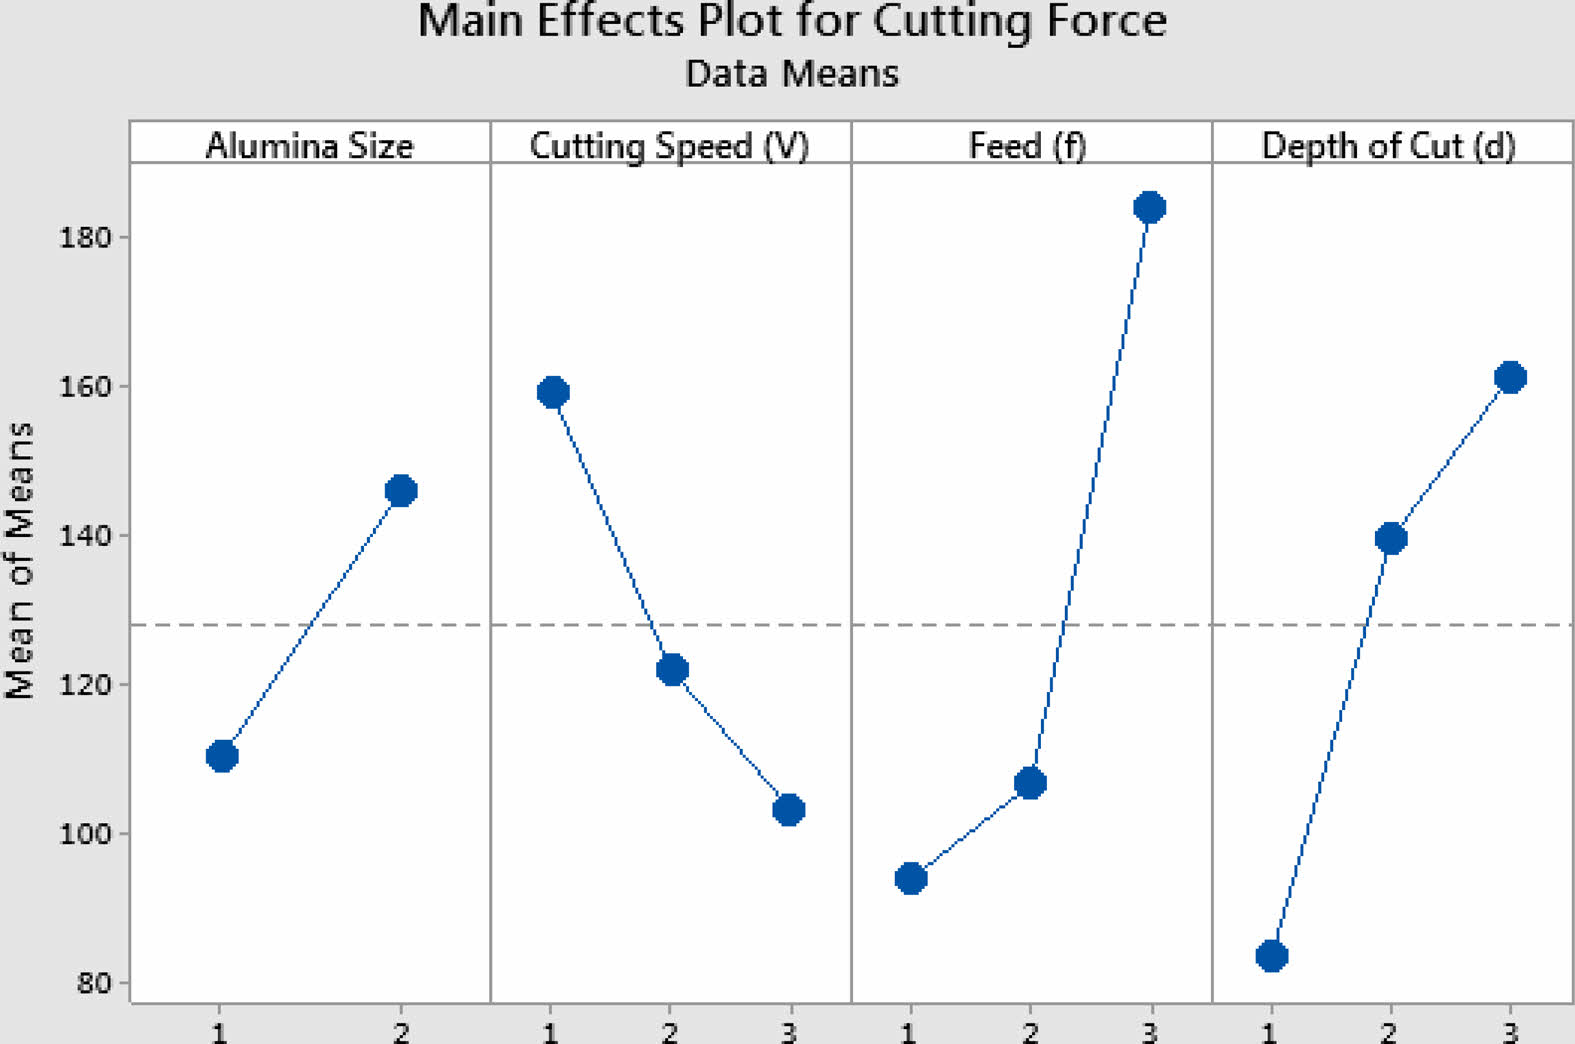
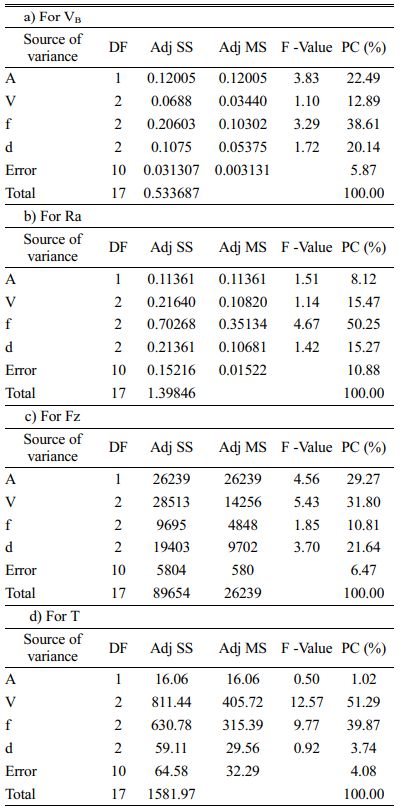
For roughness, V=100 m/min, f=0.15 mm/rev, d=0.5 mm and nano size reinforcement are the optimum parameters. For cutting force, V=100 m/min, f=0.20 mm/rev, d=1 mm and Nano size reinforcement are the optimum parameters and for temperature, V=150 m/min, f=0.20 mm/rev, d=1 mm and Nano size reinforcement are the optimum parameters. Table 17 represents the responses of VB, Ra & Fz. It is evident that for VB, feed is the dominant factor compared with cutting speed and depth of cut. At the same time, for Ra, cutting speed is the most dominant factor. It dominates 50.25% when compared with other parameters. For Fz, cutting speed dominated at 32%. At high cutting speed, temperature raise could affect the tool and surface [25]. Similarly for T, cutting speed was found as dominant factor with 51.29%. These are in line with similar findings made by Kannan [19].
|
Fig. 5 Mean response plot for GRG |
|
Fig. 6 Mean response plot- VB. |
|
Fig. 7 Mean response plot- Ra. |
|
Fig. 8 Mean response plot - Fz. |
|
Fig. 9 Mean response plot- T |
Based on LM25 AMMCs turning, the following conclusions are made and listed below.
1. To determine the dominating parameter in dry turning of LM25 AMMCs, GRA coupled PCA optimization technique was suggested and feed rate was found as dominating parameter.
2. The optimal parameter based on GRA coupled PCA technique are 125 m/min cutting speed, 0.1 mm/rev feed and 0.5 mm depth of cut. For better reinforcement composition, micro Al2O3 is preferred when compared with nano reinforcement.
3. Based on ANOVA analysis, the influencing factor of each parameter was found i.e., feed is the dominant factor VB and cutting speed for Ra, Fz and T respectively.
4. RSM analysis represents effectiveness of the regression model. Based on RSM, it was found that, R2 value of VB, Ra, Fz and T are 90.07, 92.57, 94.24 and 92.55% respectively. It represents significant model development.
5. After conducting confirmation experiment, improvement in GRG was registered by 12.95% when compared with initial experiment.
- 1. P.K. Jain, S.C. Soni and P.V. Baredar, Mater. Sci. Res. India. 11[2] (2014) 114-120.
-

- 2. I. Mohammed and A.R. Anwar Khan, J. Mater. Res. Technol. 8[3] (2019) 3347-3356.
-
- 3. P. Rambabu, N. Eswara Prasad, V.V. Kutumbarao and R.J.H. Wanhill. Ind. Inst. Met. Series (2017) 29-51.
-
- 4. D.S. Prasad, C. Shoba and N. Ramanaiah, J. Mater. Res. Technol. 3 (2014) 79-85.
-
- 5. J. Umar Mohamed, P.L.K. Palaniappan, P. Maran and R. Pandiyarajan, J. Ceram. Process. Res. 22[3] (2021) 306-316.
-
- 6. A. Elaya Perumal, G.R. Jinu, S. Vidhyalakshmi and S. Amal Bosco Jude, J. Ceram. Process. Res. 21[5] (2020) 524-532.
-
- 7. T.R. Sorena, K. Ramanuj, I. Panigrahia, A.K. Sahooa, A. Pandaa and R.K. Dasa, Mater. Today Proc. 18 (2019) 50 69-75.
- 8. L. Krishnamurthy and B.K. Sridhara, Int. J. Mach. Mach. Mater. 10[12] (2011) 137-152.
-
- 9. M. Thirumal Azhagan and B. Mohan, J. Ceram. Process. Res. 22[4] (2021) 470-474.
-
- 10. T. Tamilanban, T.S. Ravikumar, C. Gopinath and S. Senthilrajan, J. Ceram. Process. Res. 22[6] (2021) 629-635
-
- 11. P. Narayanasamy, N. Selvakumar and P. Balasundar, Comp. Trans. Ind. Inst. Met. 68[5] (2015) 911-925.
-
- 12. N.G. Yakoub, Int. J. Sci. Technol. Res. 9[8] (2020) 417-421.
- 13. B.R. Manjunatha and A. Anil kumar, Int. J. Eng. Res. Tech. 4[31] (2016) 1-5.
- 14. V. Suresh, P. Vikram, R. Palanivel and R.F. Laubscher, Mat. Today Proc. 5 (2018) 27852-27860.
-
- 15. R. Surendran, A. Kumaravel and S. Vignesh, IOSR J. Mech. Civ. Eng. 11[3] 1-7.
-
- 16. G. Elango and B.K. Raghunath, Proc. Eng. 64 (2013) 671-680.
-
- 17. S.K. Lalmuan, S. Das, M. Chandrasekarana, and S.K. Tamang, Mat. Today Proc. 4 (2017) 8167-8175.
-
- 18. K. Periasamy, N. Sivashankar, S. Chandrakmar and R. Viswanathan, Int. J. Innov. Technol. Explor. Eng. 9 (2020) 278-281.
-
- 19. A. Kannan, R. Mohan, R. Viswanathan and N. Sivashankar, J. Mat. Res. Tech. 9[6] (2020) 16529-16540.
-
- 20. N. Sivashankar, R. Viswanathan and K. Periasamy, Mat. Today Proc. 37[2] 2020 214-219.
-
- 21. R. Viswanathan, S. Ramesh, S. Maniraj and V. Subburam, Measurement 159 (2020).
-
- 22. S. Ramesh, R. Viswanathan and S. Ambika S. Measurement 78 (2015) 63-72.
-
- 23. R. Viswanathan, S. Ramesh and V. Subburam, Measurement 120 (2018) 107-113.
-
- 24. S. Sakthivelu, T. Anandaraj and M. Selwin, Mech. Mech. Eng. 21[1] (2017) 95-103.
- 25. S. Dhanalakshmi and T. Rameshbabu, Mat. Today: Proc. 39[1] (2021) 48-53.
-
- 26. P. Suresh and P. Mathiyalagan, J. Mat. Sci. Mech. Eng. 3[3] (2016) 192-196.
- 27. A. Srinivasan, R.M. Arunachalam, S. Ramesh and J.S. Senthilkumaar, American J. App. Sci. 9[4] (2012) 478-483.
- 28. X. Li and WKH Seah, Wear 247 (2001) 161-171.
-
- 29. S.S. Joshi and D.M. Pendse, Mach. Sci.Technol. 8[1] (2004) 85-102.
-
- 30. J. Deng, J. Grey Sys. 1[1] (1989) 1-24.
- 31. L.K. Pan, C.C. Wang, S.L. Wei and H.F. Sher, J. Mat. Proc. Tech. 182 (2007) 107-116.
-
- 32. S.K. Shihab, Z.A. Khan and A.N. Siddiquee, Int. J. Eng. Trends Technol. 38[5] (2016) 238-245.
-
- 33. N. Kaushik and S. Singhal, Prod. Manuf. Res. 6[1] (2018) 171-189.
-
- 34. A. Gok, Measurement 70 (2015) 100-109.
-
- 35. A. Gok, C. Gologlu and H.I. Demirci, Int. J. Adv. Manuf. Technol. 69 (2013) 1063-1078.
-
- 36. A. Gok, K. Gok, M.B. Bilgin and M.A. Alkan, Mater. Technol. 51[6] (2017) 957-965.
-
- 37. M. Srinivasan, S. Ramesh, S. Sundaram and R. Viswanathan, J. Ceram. Process. Res. 22[3] (2021) 345-355.
-
- 38. D.I. Lalwani, N.K. Mehta and P.K. Jain, J. Mater. Process. Technol. 206 (2008) 167-179.
-
- 39. P.D. Selvaraj, P. Chandramohan and M. Mohanraj, Measurement 49 (2014) 205-215.
-
- 40. T. Pridhar, K. Ravikumar, B. Sureshbabu, R. Srinivasan, and B. Sathishkumar, Int. J. Ceram. Process. Res. 21[2] (2020) 131-142.
-
- 41. R. Srinivasan, B. Suresh Babu, P. Prathap, Ruban Whenish, R. Soundararajan and G. Chandramohan, Int. J. Ceram. Process. Res. 22[1] (2021) 16-24.
-
- 42. P. Muthurasu and M. Kathiresan, Int. J. Ceram. Process. Res. 22[6] (2021) 697-704.
-
 This Article
-
2022; 23(6): 783-793
Published on Dec 31, 2022
- 10.36410/jcpr.2022.23.6.783
- Received on Jan 9, 2022
- Revised on Apr 6, 2022
- Accepted on Apr 9, 2022
Services
- Abstract
introduction
materials and methods
gra combined through pca technique
results and discussion
conclusion
- References
- Full Text PDF
Shared
Correspondence to
- A. Srinivasan
-
Department of Mechanical Engineering, AVS Engineering College, Salem-636003, Tamil Nadu, India
Tel : +91-9894852123 - E-mail: srivankumar14@gmail.com
Clean-Energy Research Institute(CRI), Hanyang University, 222, Wangsimni-ro, Seongdong-gu, Seoul, 04763, Korea
E-mail: jcpr@hanyang.ac.kr