


- Optimization of rice husk ash (RHA) as partial replacement of cementing material in structural ceramic composite concrete using response surface methodology (RSM) statistical experimental design
Aliff Akhmal Mohd Fazlia, Siti Koriah Zakariaa, Nur Iman Najwa Abd Rahmana, Siti Zuliana Salleha,
Abdul Hafidz Yusoffa, Nurul Azita Sallehb, Mustaffa Ali Azhar Taibc, Faisal Budimand, Arlina Alia and Pao Ter Teo1,*aAdvanced Materials Research Cluster, Faculty of Bioengineering and Technology, Universiti Malaysia Kelantan, Jeli Campus, 17600 Jeli, Kelantan, Malaysia
bSchool of Technology Management and Logistics, Universiti Utara Malaysia, 06010 Sintok, Kedah, Malaysia
cDivision of Advanced Ceramic Materials Technology, Advanced Technology Training Center (ADTEC) Taiping, 34600 Kamunting, Perak, Malaysia
dSchool of Electrical Engineering, Telkom University, Bandung 40257, West Jawa, Indonesia
Rapid development in the
concrete industry leads to a higher demand for cement consumption worldwide.
Due to this, the production of cement has become very crucial, resulting in a
high carbon footprint and pollution along the process. Therefore, the
utilization of agricultural by-products as cement replacement will help to
reduce pollution caused by conventional cement production and therefore reduce
the unsystematic waste management. Rice husk ash contains high silica content
that makes it a potential material to partially replace cement in concrete
production. This is because, the reaction between rice husk ash and cement can
improve the compressive strength of the concrete. With the aid of response
surface methodology, the optimization of utilizing rice husk ash as a partial
replacement of cement in concrete can be achieved. Therefore, concrete
incorporated with rice husk ash with high and optimum compressive strength can
be produced.
Keywords: rice husk ash (RHA), Concrete, Cement
The growth of cement production around the world is
expected to keep increasing with the infrastructure development due to
increment of population. The progress of this production making researchers to
find alternative material as a replacement of cement due to high
possibly of shortcoming natural resource. Moreover, the cement
production caused the emission of CO2 and high energy used which
results in negative effect in environment [1]. The replacement of
cement from waste material is vital in order to increase the
sustainability in green construction [2]. For example, the utilization of waste
materials such as fly ash [3-5], recycled copper slag [6], sugarcane bagasse
ash [7, 8], and corncob ash [9] have been reported. These wastes are
considered as alternative for cement because they possess pozzolanic properties
[10].
Besides that, there are numerous reports that suggest the
utilization of rice husk ash (RHA) as a partial replacement
in body formulation of concrete production [11-13]. The
source of RHA is abundant and highly generated annually because 90% of rice plantation
are produced and consumed in Asian Region [14, 15]. Hence, RHA is the best
option as supplementary cementitious material (SCM) due to widely available
resource. In addition, the utilization of rice husk ash as a pozzolanic
material in cement and concrete provides several advantages, such as improved
strength and durability properties, reduced materials cost due to cement
savings and environmental benefits related to the disposal of waste materials
and to reduced carbon di oxide emissions [16]. In the other
work, Zareei et al. (2017) have reported that concrete with high compressive
strength compared to standard concrete could be produced by substituting 10% of
cement with RHA [17]. The pozzolanic properties of RHA which caused a reaction
between SiO2 and Ca(OH)2 during cement hydration process
and thus enhanced the properties of RHA-mixed cement [18].
The other factors that enhanced the RHA-mixed cement properties can be
associated to the formation rate of calcium silicate hydroxide (C-S-H) from the
reaction between Ordinary Portland Cement (OPC) and water [19]. The positive
utilization effect of RHA will be able to reduce the problem arise by the
abundant of RHA generated [20].
Although the replacement of RHA into cement production can
increases the performance of cement but a further increment of RHA would reduce
the compressive strength of concrete due slight cementitious
properties of RHA than conventional cement [17]. In a work reported by Hwang et
al. (2011) where they observed a decrement performance of concrete when the
addition of RHA beyond 20% [12]. Hence, the optimum percentage of RHA need to
be determined because it will influence the performance of cement-mixed with
RHA.
Most of the utilization of RHA in cement production are
reported without the use of response surface methodology (RSM). Aydar et al.
(2018) mentioned that RSM is helpful for creating, improving, and enhancing the
reaction variable [21]. In addition, RSM can be used to optimize one or more
responses for examples maximize strength and also to minimize cost [22].
In this work, the compressive strength of a concrete
affected by RHA replacement (10, 20 and 30 wt%) and curing time (3, 5 and 7
days) is reported. The statistical analysis including model adequacy checking,
analysis of variance (ANOVA), main effect and interaction plots as well as the
regression analysis were performed for each response. The aim of this work is
to obtain a correct body formulation of concrete incorporated with RHA with the
aid of statistical design.
Material
Ordinary Portland Cement (OPC) was produced by one of the
local cement manufacturers in Malaysia. Sand aggregate is used as a structural
filler for the concrete. Black and Grey RHAs were obtained from BERNAS Paddy
Processing Centre, Penang, Malaysia.
Method
The concrete was formulated based on M-20 concrete,
which composed of cement, sand, and aggregate with a ratio of 1:1.5:3 [23]. For
this study, the cement ratio consisted of a combination of cement and RHA (10
wt.%, 20 wt.%, and 30 wt.%). Two types of RHA (black RHA and grey RHA) were
used throughout the study. The raw materials (RHA and OPC) were also
characterized in terms of chemical composition (XRF) and mineralogical property
(XRD).
Firstly, raw materials are mixed in a dry condition for 2
minutes, then water was added and mixed for another 3 minutes using Heidolph
mixer at constant mixing speed. The fresh concrete was then poured into the
plastic mold with a dimension of 10 cm × 10 cm × 5 cm. The
concrete was de-molded after 24 hours and cured in a tank of water. The
concrete samples were tested at the concrete age of 3, 5 and 7 days after
curing.
The final cured concrete is then characterized in terms
of compressive test, porosity test, water absorption test, and
also surface and phase analysis. Compressive test (ASTM C109), effective
porosity, and water absorption (ASTM C642-97) tests were performed to determine
the mechanical properties of the concrete samples.
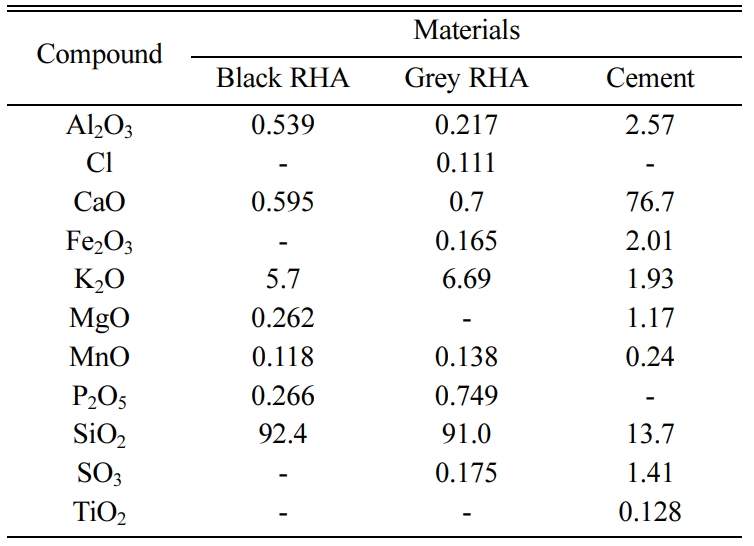
Chemical
Composition of Raw Materials
Table 1 listed the composition of raw materials that were
determined by XRF. Black RHA shows a high concentration of silicon dioxide,
which is 92.4%, and grey RHA is 91.0%. Cement has a high concentration in
calcium oxides, which is 76.7%. The usage of RHA as a partial replacement for
cement is important because it has a high content of silicon dioxide (SiO2)
that will react with calcium oxides from the cement to enhance the strength of
concrete by the formation of calcium silicate hydrate (C-S-H) gel.
Mineralogical
Analysis
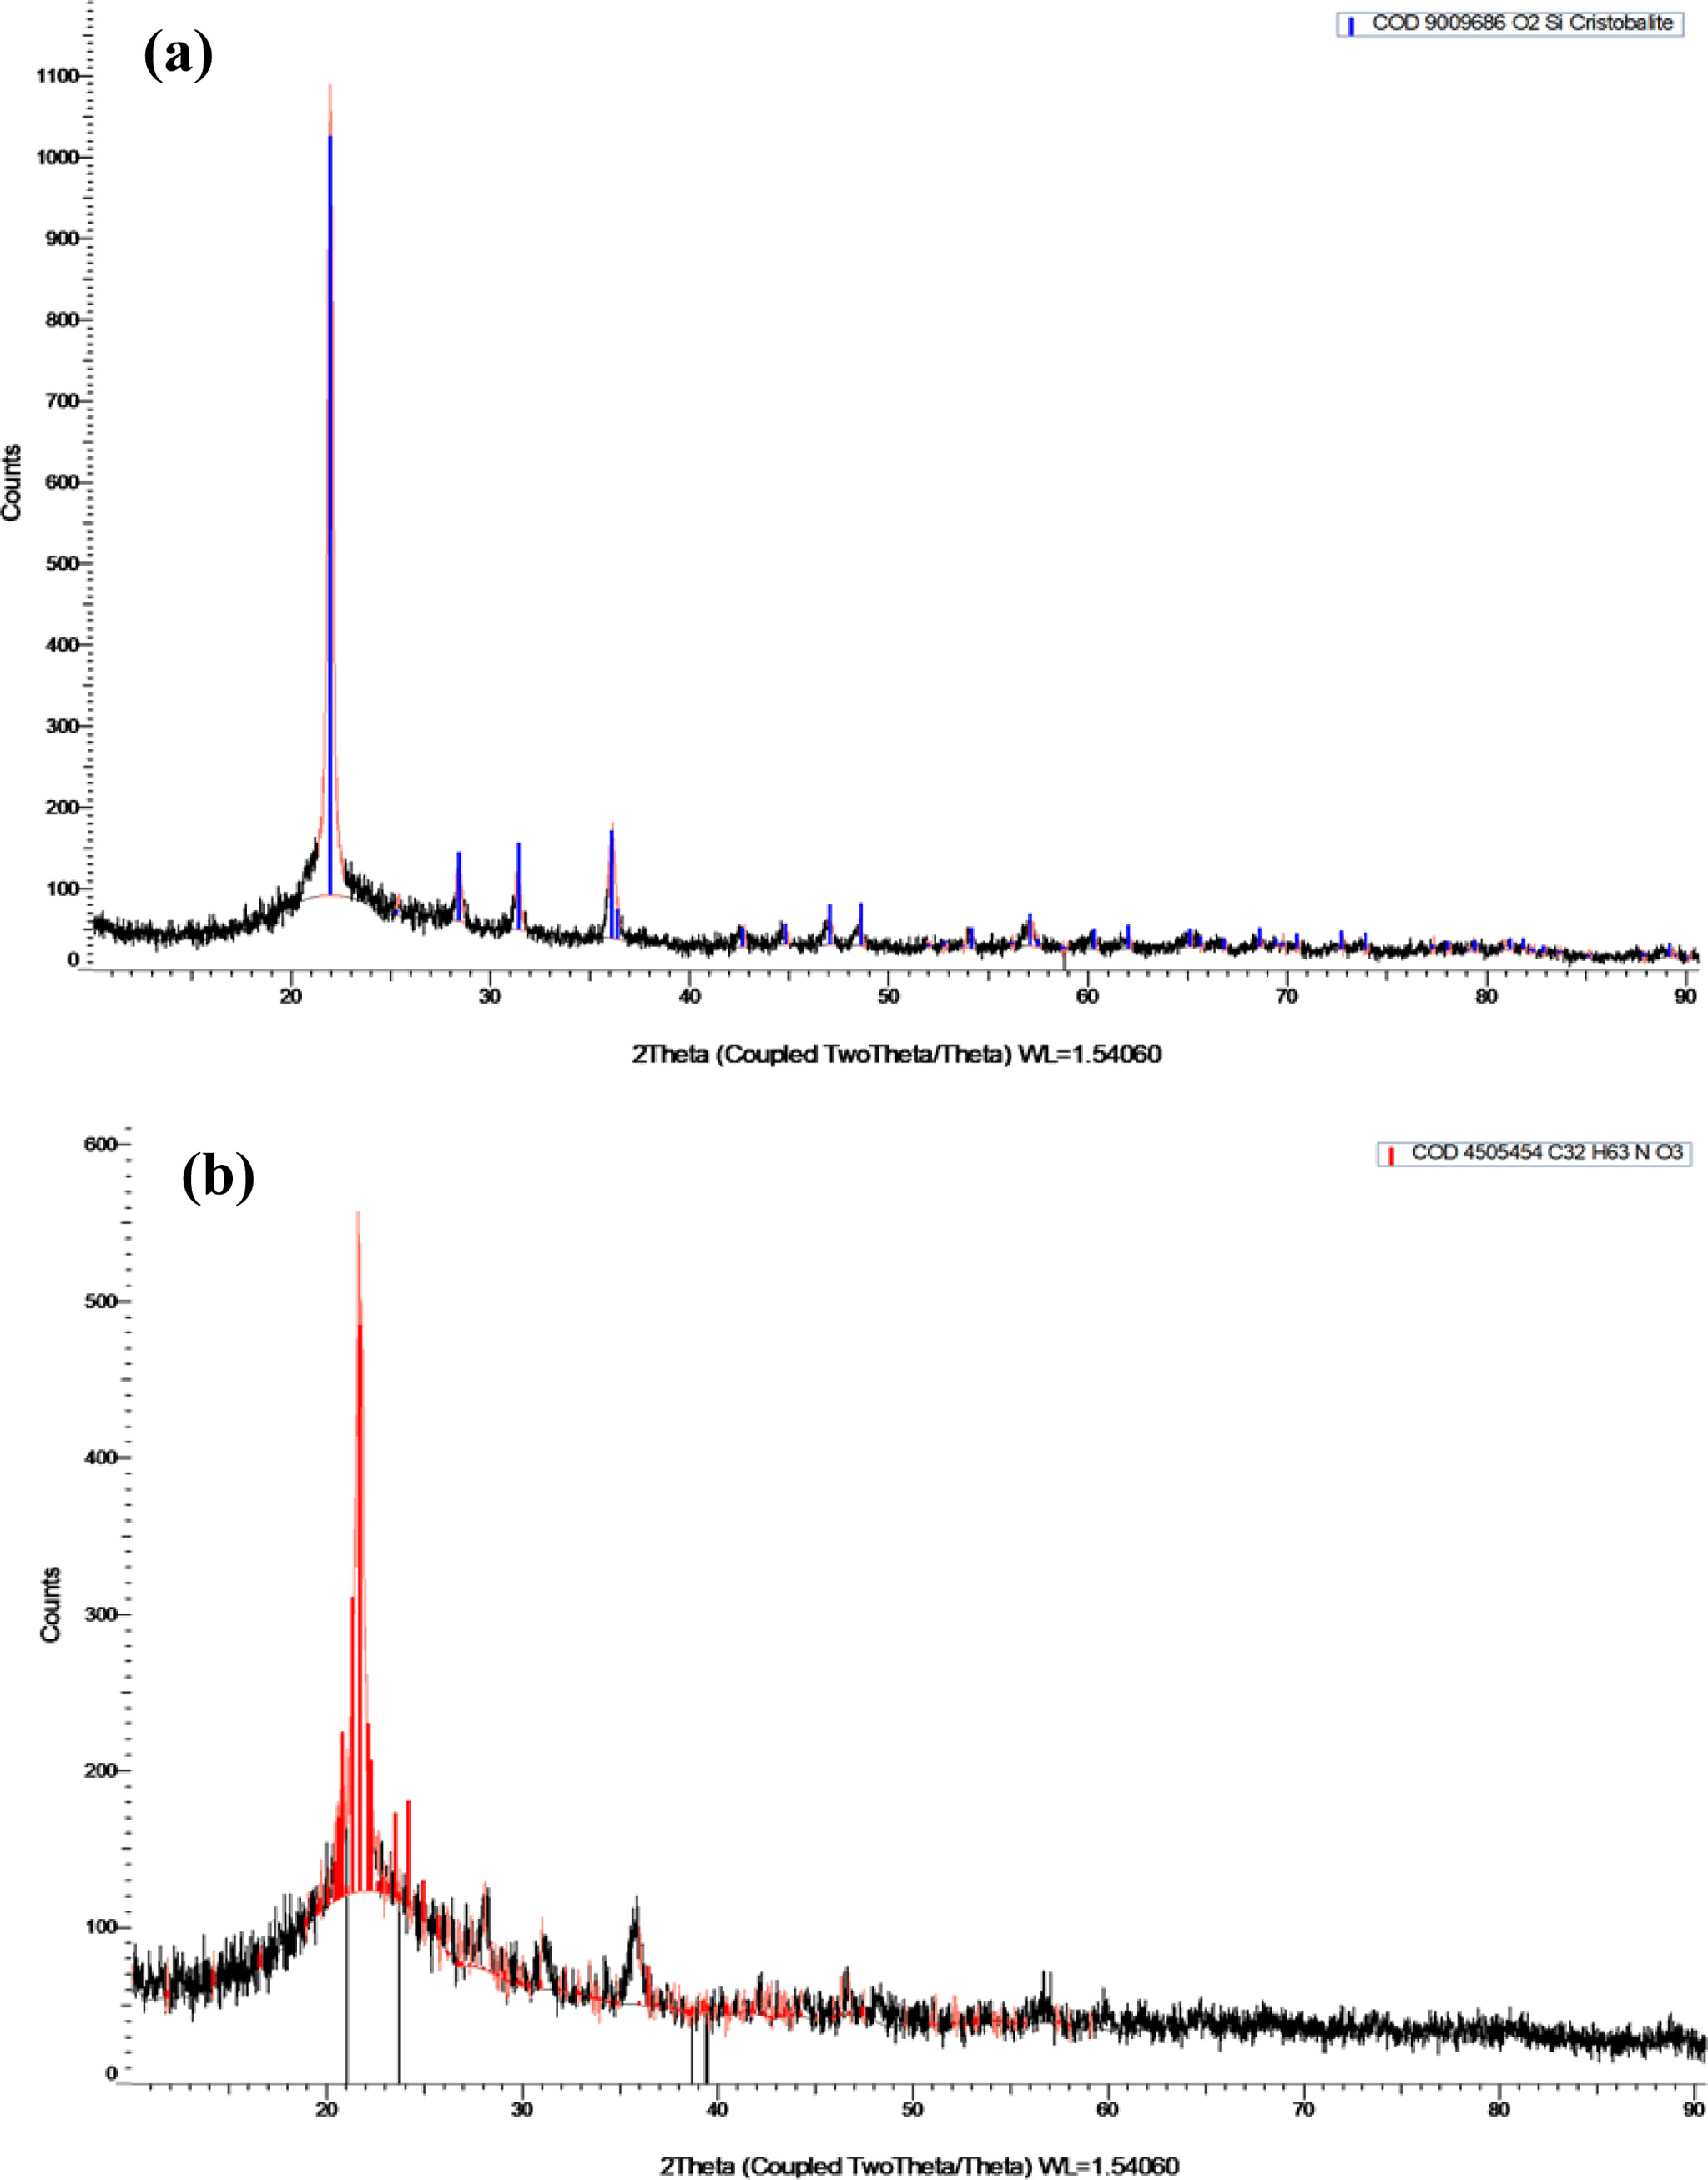
Fig. 1(a) shows the XRD pattern of black RHA. The
crystallinity of black RHA is 53.9% showing that black RHA being incinerated at
a temperature below 700 °C. The color of black RHA was formed due to
incomplete combustion of rice husk [24].
On the contrary, Fig. 1(b) reveals the XRD pattern for
Grey RHA that forms an amorphous region where its crystallinity is 44.7% that
indicates Grey RHA being incinerated above 700 °C. As the temperature of
incineration increase above 700 °C, the mineralogy of silica in RHA
started to change to crystalline [25]. The purity of silica is highly affected
by chemical treatment compared to thermal treatment. The grey color of RHA was
formed due to the strong interaction between potassium and silica ion that
causes the formation of potassium silicate combined with carbon. Therefore, the
grey color of RHA was formed during incineration [26].
Central Composite Design
Central Composite Design is an experimental design, useful
in response surface methodology for building a second-order (quadratic) model
for the response variable. Table 2 and Table 3 show the experimental design
matrix and response for black and grey RHA, which sum up to a total of 26
experimental runs in random order with 2 replications, using MINITAB 16. After
that, coding was used to denote the level or range of each evaluated factor on
scale ‘-1’ for 10% and 3 days, ‘0’ for 20% and 5 days, and ‘+1’ for 30 % and 7 days.
Subsequently, statistical analysis, including model adequacy
checking, analysis of variance (ANOVA), main effect and
interaction plots and regression analysis were performed for each response.
Model Adequacy Checking
Khan et al. (2017) have reported that the assumption of
residuals by statistical analysis can be proven by model adequacy check [22].
In general, statistical subject residuals can be described as the difference
between actual and prediction value. In this study, the actual response values
were obtained from Table 2 and Table 3.
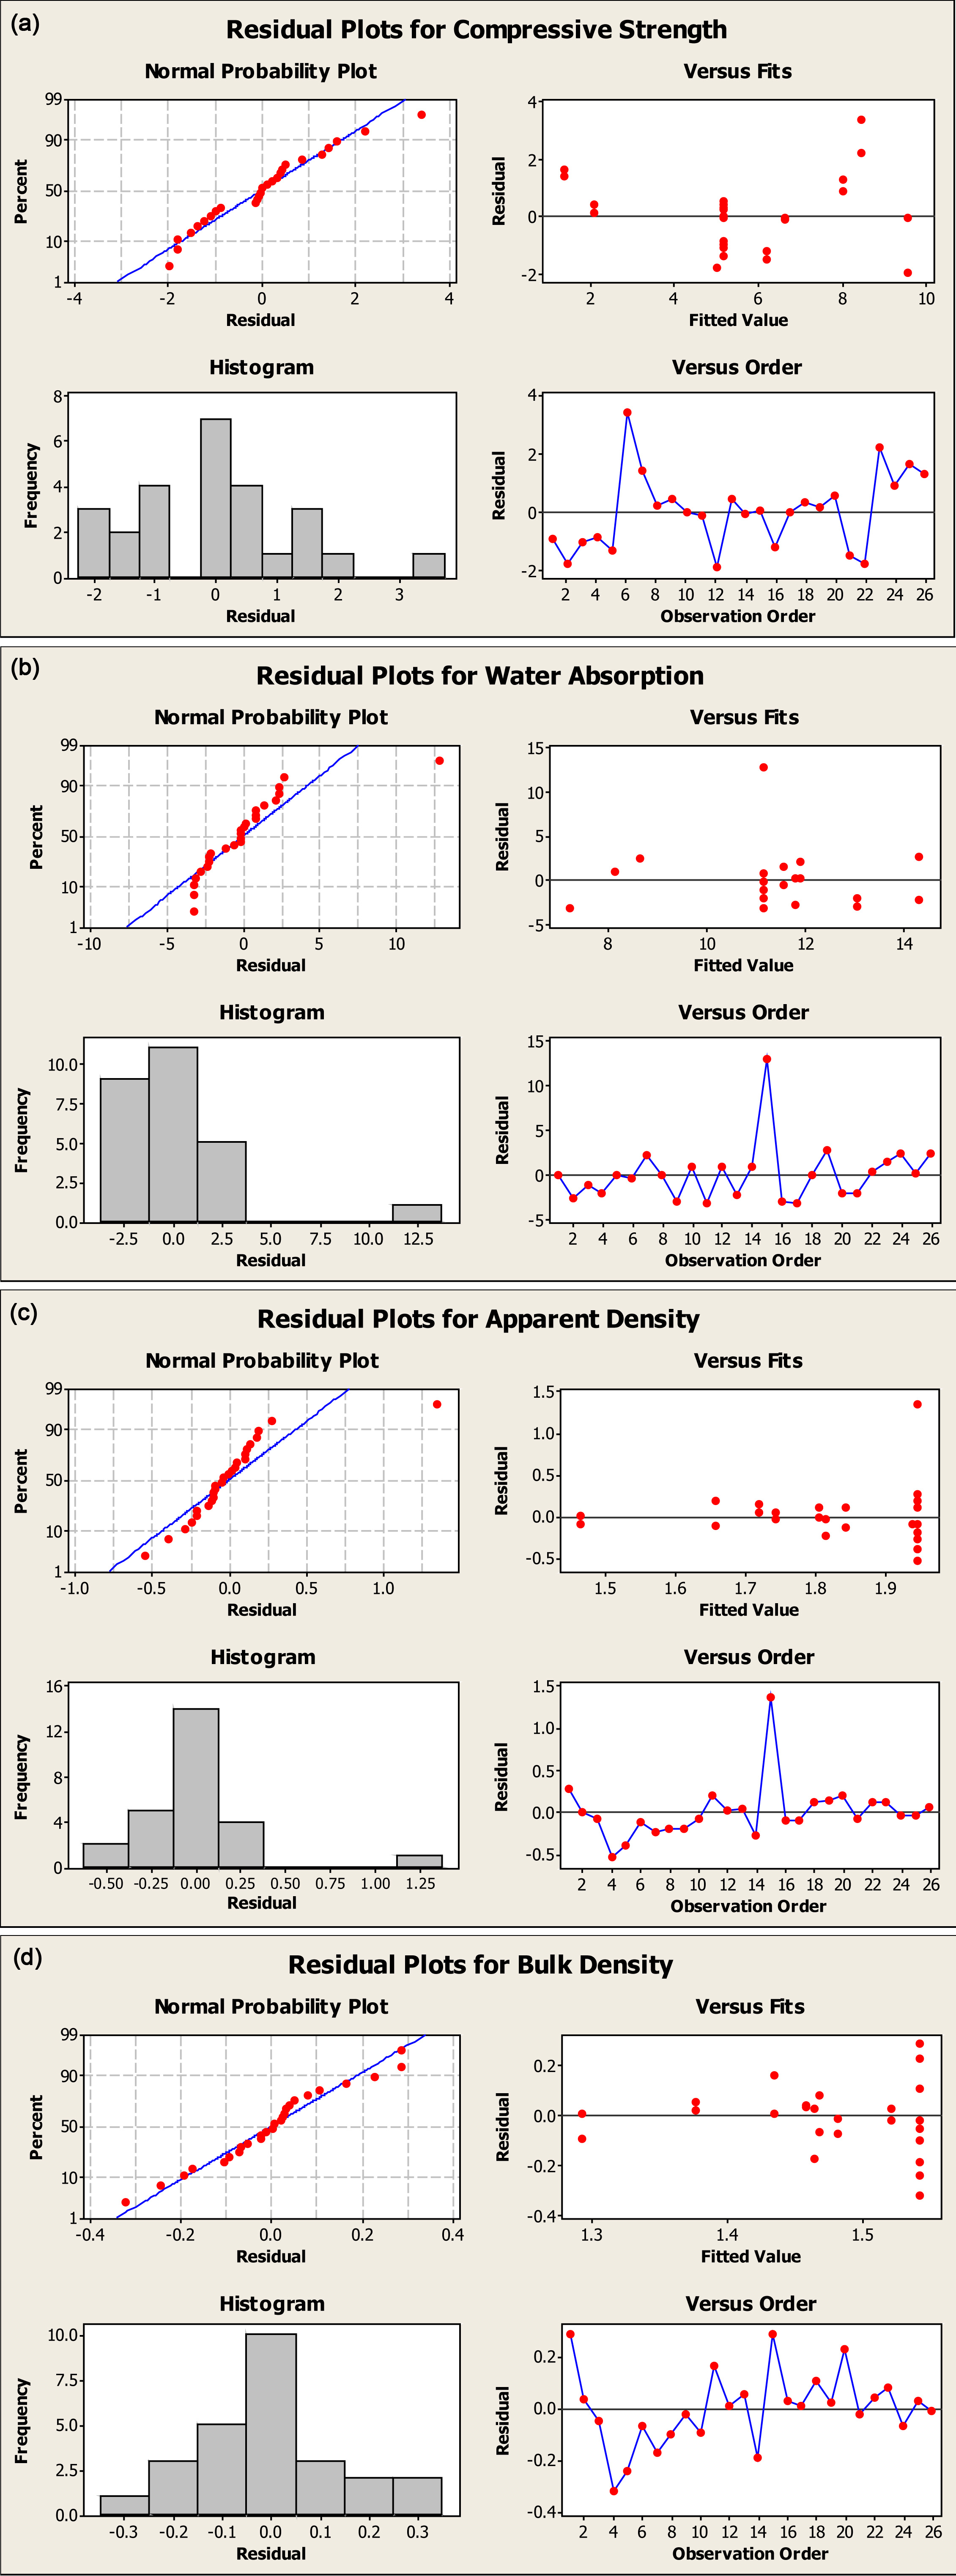
Fig. 2(a)-(d) shows the residual plots for compressive
strength, water absorption, apparent density, and bulk density of concrete that
incorporated with black RHA. By analyzing all the normal probability plot from
graph present from black RHA, it was observed the residual plots shows two
types of pattern which is light tail distribution for compressive, water
absorption and apparent density that indicate this side of the
distribution produces outliers at a reduced rate from what
expect with a normal distribution, a light tail often means that all the
observations are piled up near a boundary for the distribution [27]. This
pointed out that compressive strength, water absorption, apparent density, and
bulk density fulfilled the first criteria of model adequacy checking and were
normally distributed [28].
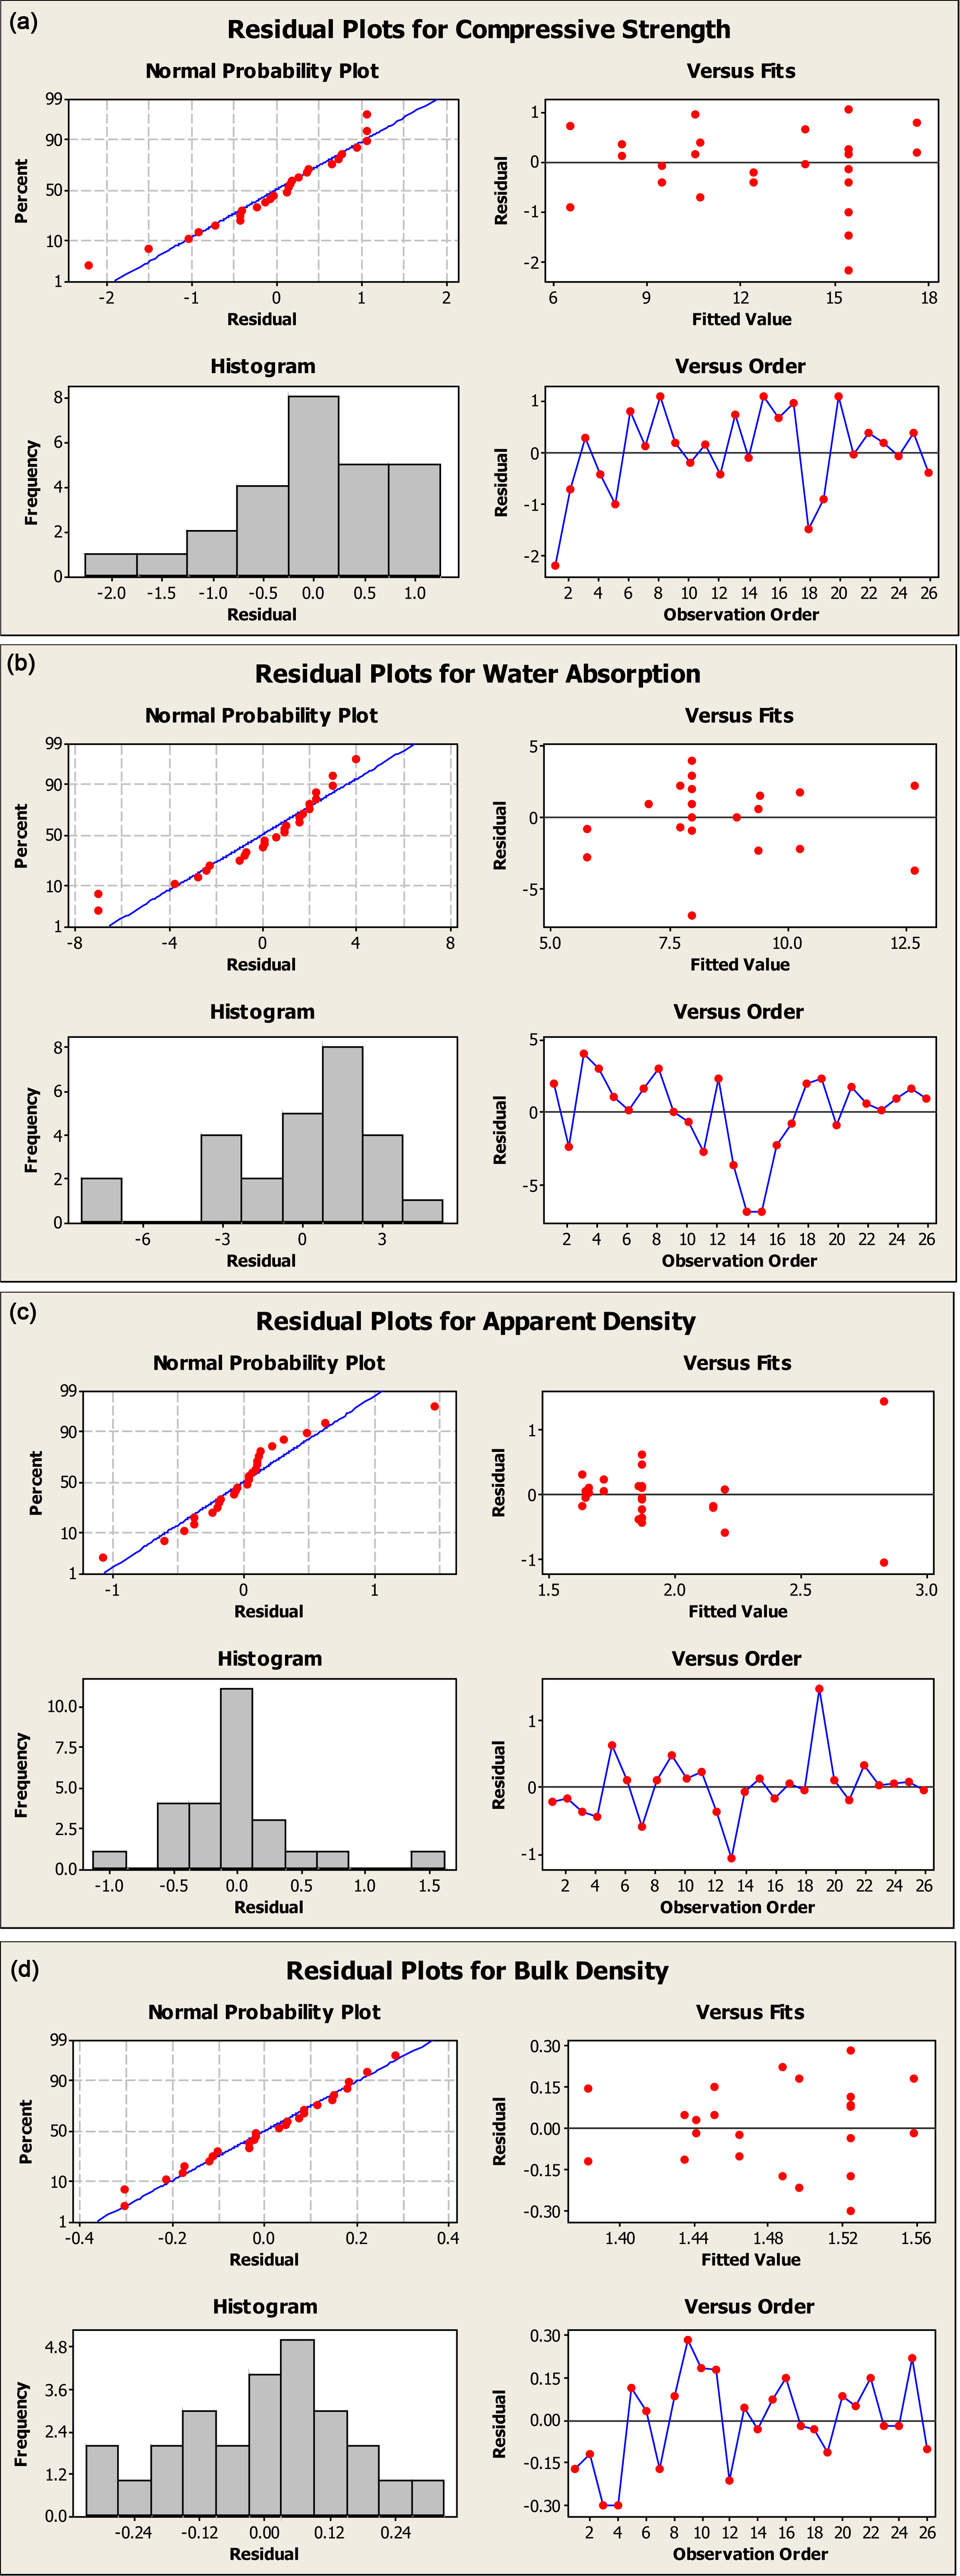
Meanwhile, Fig. 3(a)-(d) show residual plots for compressive
strength, water absorption, apparent density, and bulk
density of concrete containing grey RHA. The normal probability plots of grey
RHA were scattered along the straight line indicating normal distribution of
the evaluated properties. Thus, the first criteria of model adequacy checking
were fulfilled. Next, all the histogram plots show bell-shaped patterns which
indicates that all of the data were normally distributed, and this further
supports the normal distribution data of compressive
strength, water absorption, apparent density, and bulk
density.
After that, residuals versus fitted value plots
illustrated that the data points for compressive strength, water
absorption, apparent density, and bulk density that use black and grey RHA are
distributed randomly, ensuring that constant variance criteria of residuals
[29]. The residual versus observation order plots indicate that residual
points are completely random despite observation order. This
implies that residual was independent with each other obeying the third
assumption.
Analysis
of Variance
Analysis of Variance or commonly known as ANOVA is a test
of the hypothesis that the means of two or more populations are equal [30]. It
is conducted in order to observe the significant effect of operating factors on
responses of a particular developed product. In this study, the significant
effect of weight percentage of black and grey rice husk as and curing time to
the responses such as compressive strength, water absorption,
apparent density, and bulk density could be determined by observing the
probability value or known as ‘p-value’. Most of the researcher has agreed that
the p-value has to be equal or smaller than 0.05 so that operating factor is
statically significant in investigating response leading to rejection of the
null hypothesis of ANOVA.
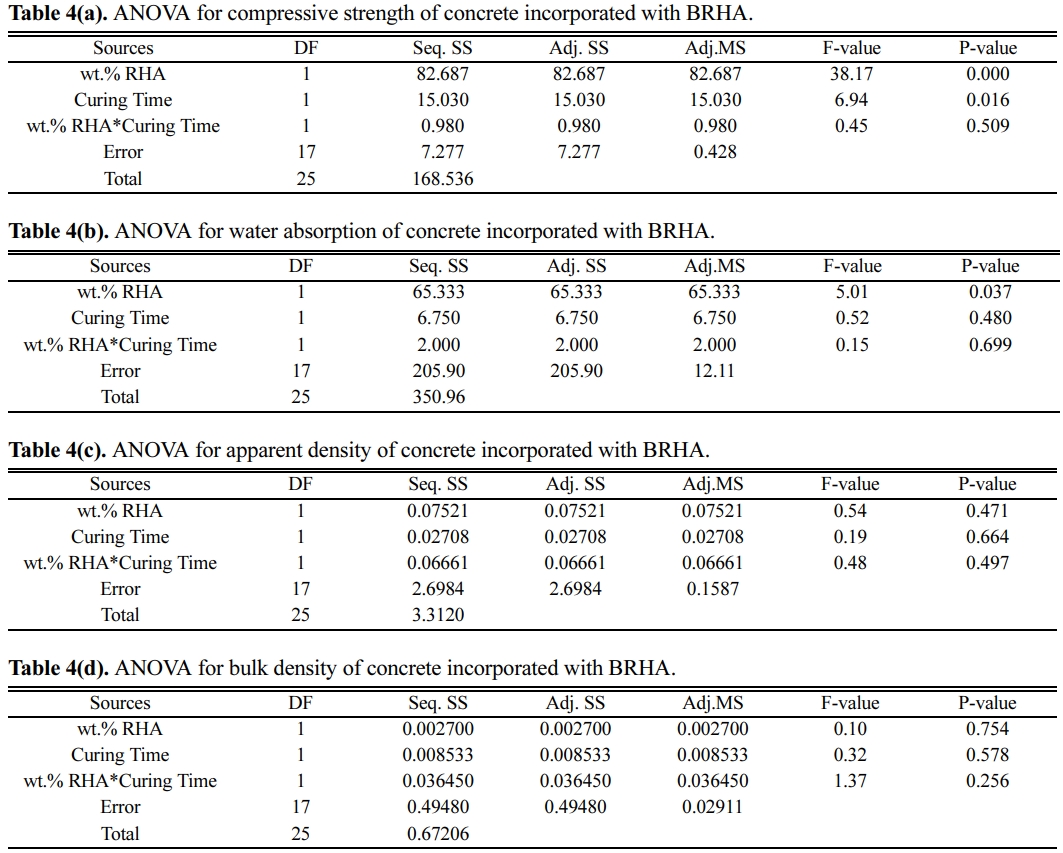
Table 4(a)-(d) present ANOVA for compressive strength,
water absorption, apparent density, and bulk density for black RHA. From the
analysis, it was found that the p-value for wt.% of RHA replacement and curing
time linear factor and also wt.% * curing time interaction factor is zero
(0.000) for compressive strength response by black RHA. The smaller p-value
than 0.05 indicates that factor could be regarded to have a higher effect on
response [31]. However, the p-value for other response such as water
absorption, apparent density, and bulk density are higher than 0.05, which
mean it is not statistically significant and indicates weak
evidence against the null hypothesis. For water absorption,
Saraswathy and Song (2007) have mentioned in their
study where concrete that uses RHA is slightly low compared to concrete that
fully uses cement [32].
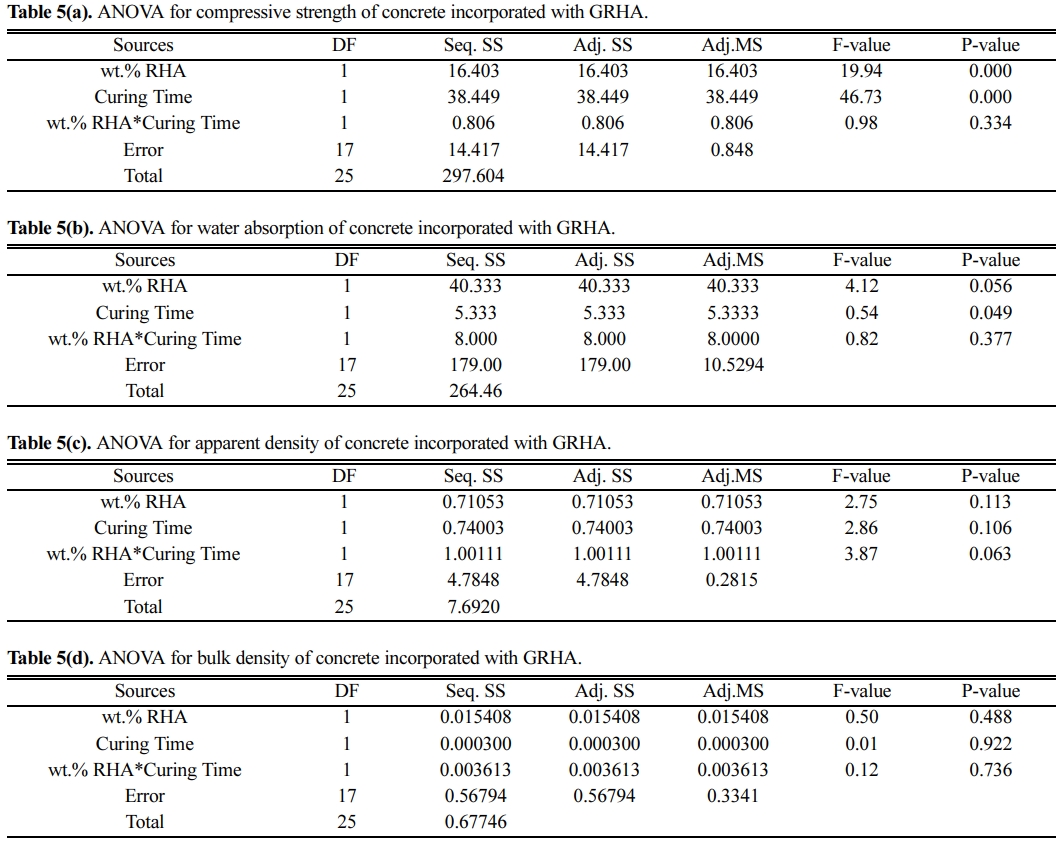
Meanwhile, Table 5(a)-(d) present ANOVA for compressive
strength, water absorption, apparent density, and bulk density for grey RHA. It
was found that the p-value for wt.% of RHA replacement and curing time linear
factor is zero (0.000) for compressive strength response by grey
RHA. This indicates that wt.% and curing time have a significant effect on
compressive strength of concrete that incorporated with grey RHA as [31] have
reported that if the p-value is 0.05 and lower. The p-value for water
absorption is 0.056 for wt.% RHA and 0.049 for curing time, these p-values
indicate also indicate that wt.% RHA and curing time have a significant effect
toward water absorption of grey RHA.
However, the p-value for water absorption, apparent
density, and bulk density of black RHA and apparent density and bulk density of
grey RHA were not significant. This is because all of the p-values from the
responses mentioned have exceeded the minimum limit of the p-value, which is
0.05. The insignificant of the p-value for all responses due to the factor
which is wt.% RHA and curing time do not affect the responses in this study.
This due to the factor that the replacement of cement by RHA only affecting the
compressive strength of the concrete due to the reaction between SiO2 in
RHA and OPC, which produced the addition of C-S-H that responsible to the
strengthening of the concrete. Hence, it can be concluded that addition of RHA
in concrete does not affect the water absorption, bulk density, and apparent
density as the role of RHA in concrete only affecting the compressive strength
of the concrete.
Main
Effect and Interaction Plots
Main effect plot demonstrates the effect of factor (with
different levels) to the changes in a particular response. In this general
factorial design, the main factor that evaluated were weight percentage (wt.%)
of black and grey RHA and curing time. Meanwhile, the interaction plot
illustrated the combination of effects of both main
factors (with different levels) to the particular response
(compressive strength, water absorption, apparent density, and bulk density).
Compressive Strength
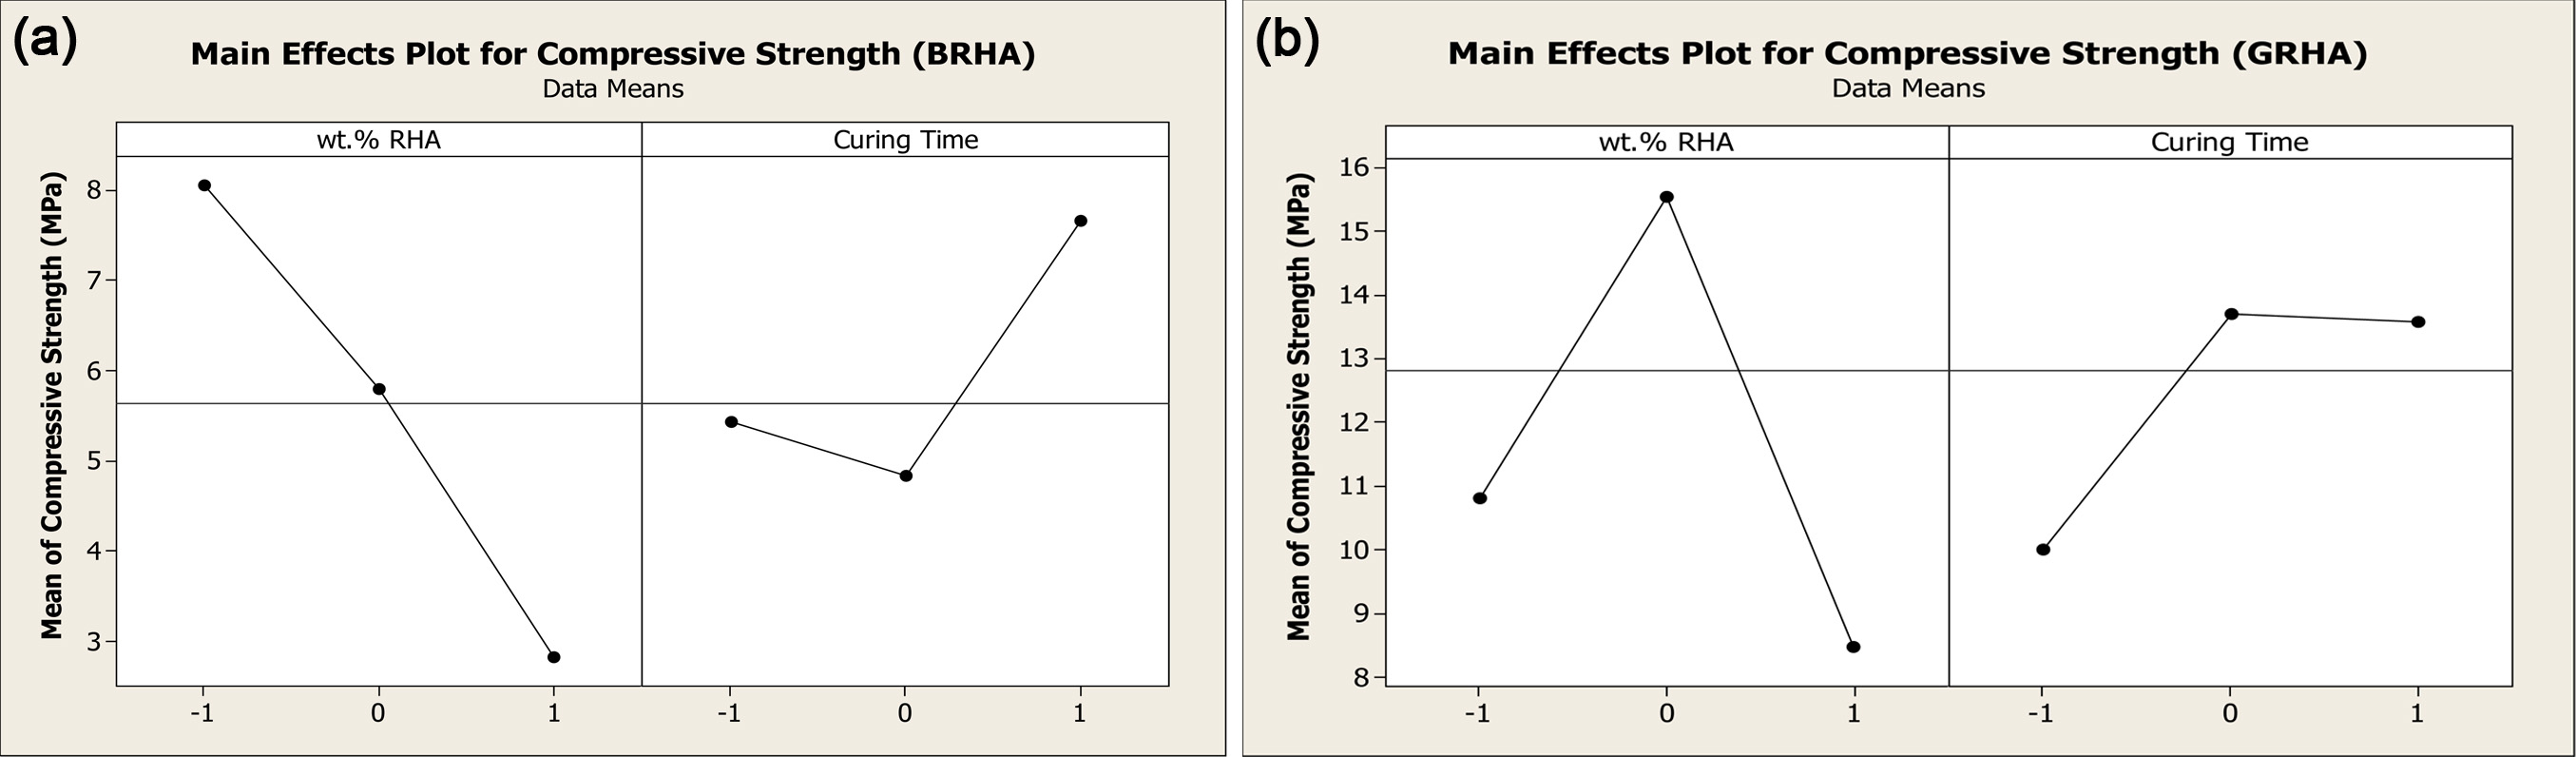
Fig. 4(a) and Fig. 4(b) show main effects plots for
compressive strength for black and grey RHA. From the main effects plot, it was
observed that by increasing weight percentage of black RHA from 10 wt.% (coded as
‘-1’) to 30 wt.% (coded as ‘1’) it shows the decreasing trend due to
black RHA is incomplete combustion of rice husk and mostly has lower amorphous
silica, higher loss of ignition (LOI) and lower SiO2 content than
grey RHA [24]. For curing time, it shows a decreasing trend from 3 days (coded
as ‘-1’) to 5 days (coded as ‘0’).
However, the trend suddenly increases when curing time
increase to 7 days (coded as ‘1’). Fig. 4(b) show the main effects of
compressive strength for grey RHA. From the main effects plot, it was observed
that increasing the weight percentage of grey RHA from 10 wt.% (coded as ‘-1’)
to 20 wt.% (coded as ‘0’) show an increasing trend. However, further increasing
to 30 wt.% (coded as ‘1’) reduced the compressive strength of the concrete.
Curing time for grey RHA show an increasing trend from 3 days (coded as ‘-1’)
to 5 days (coded as ‘0’) and finally show a constant trend for 7 days (coded as
‘1’).
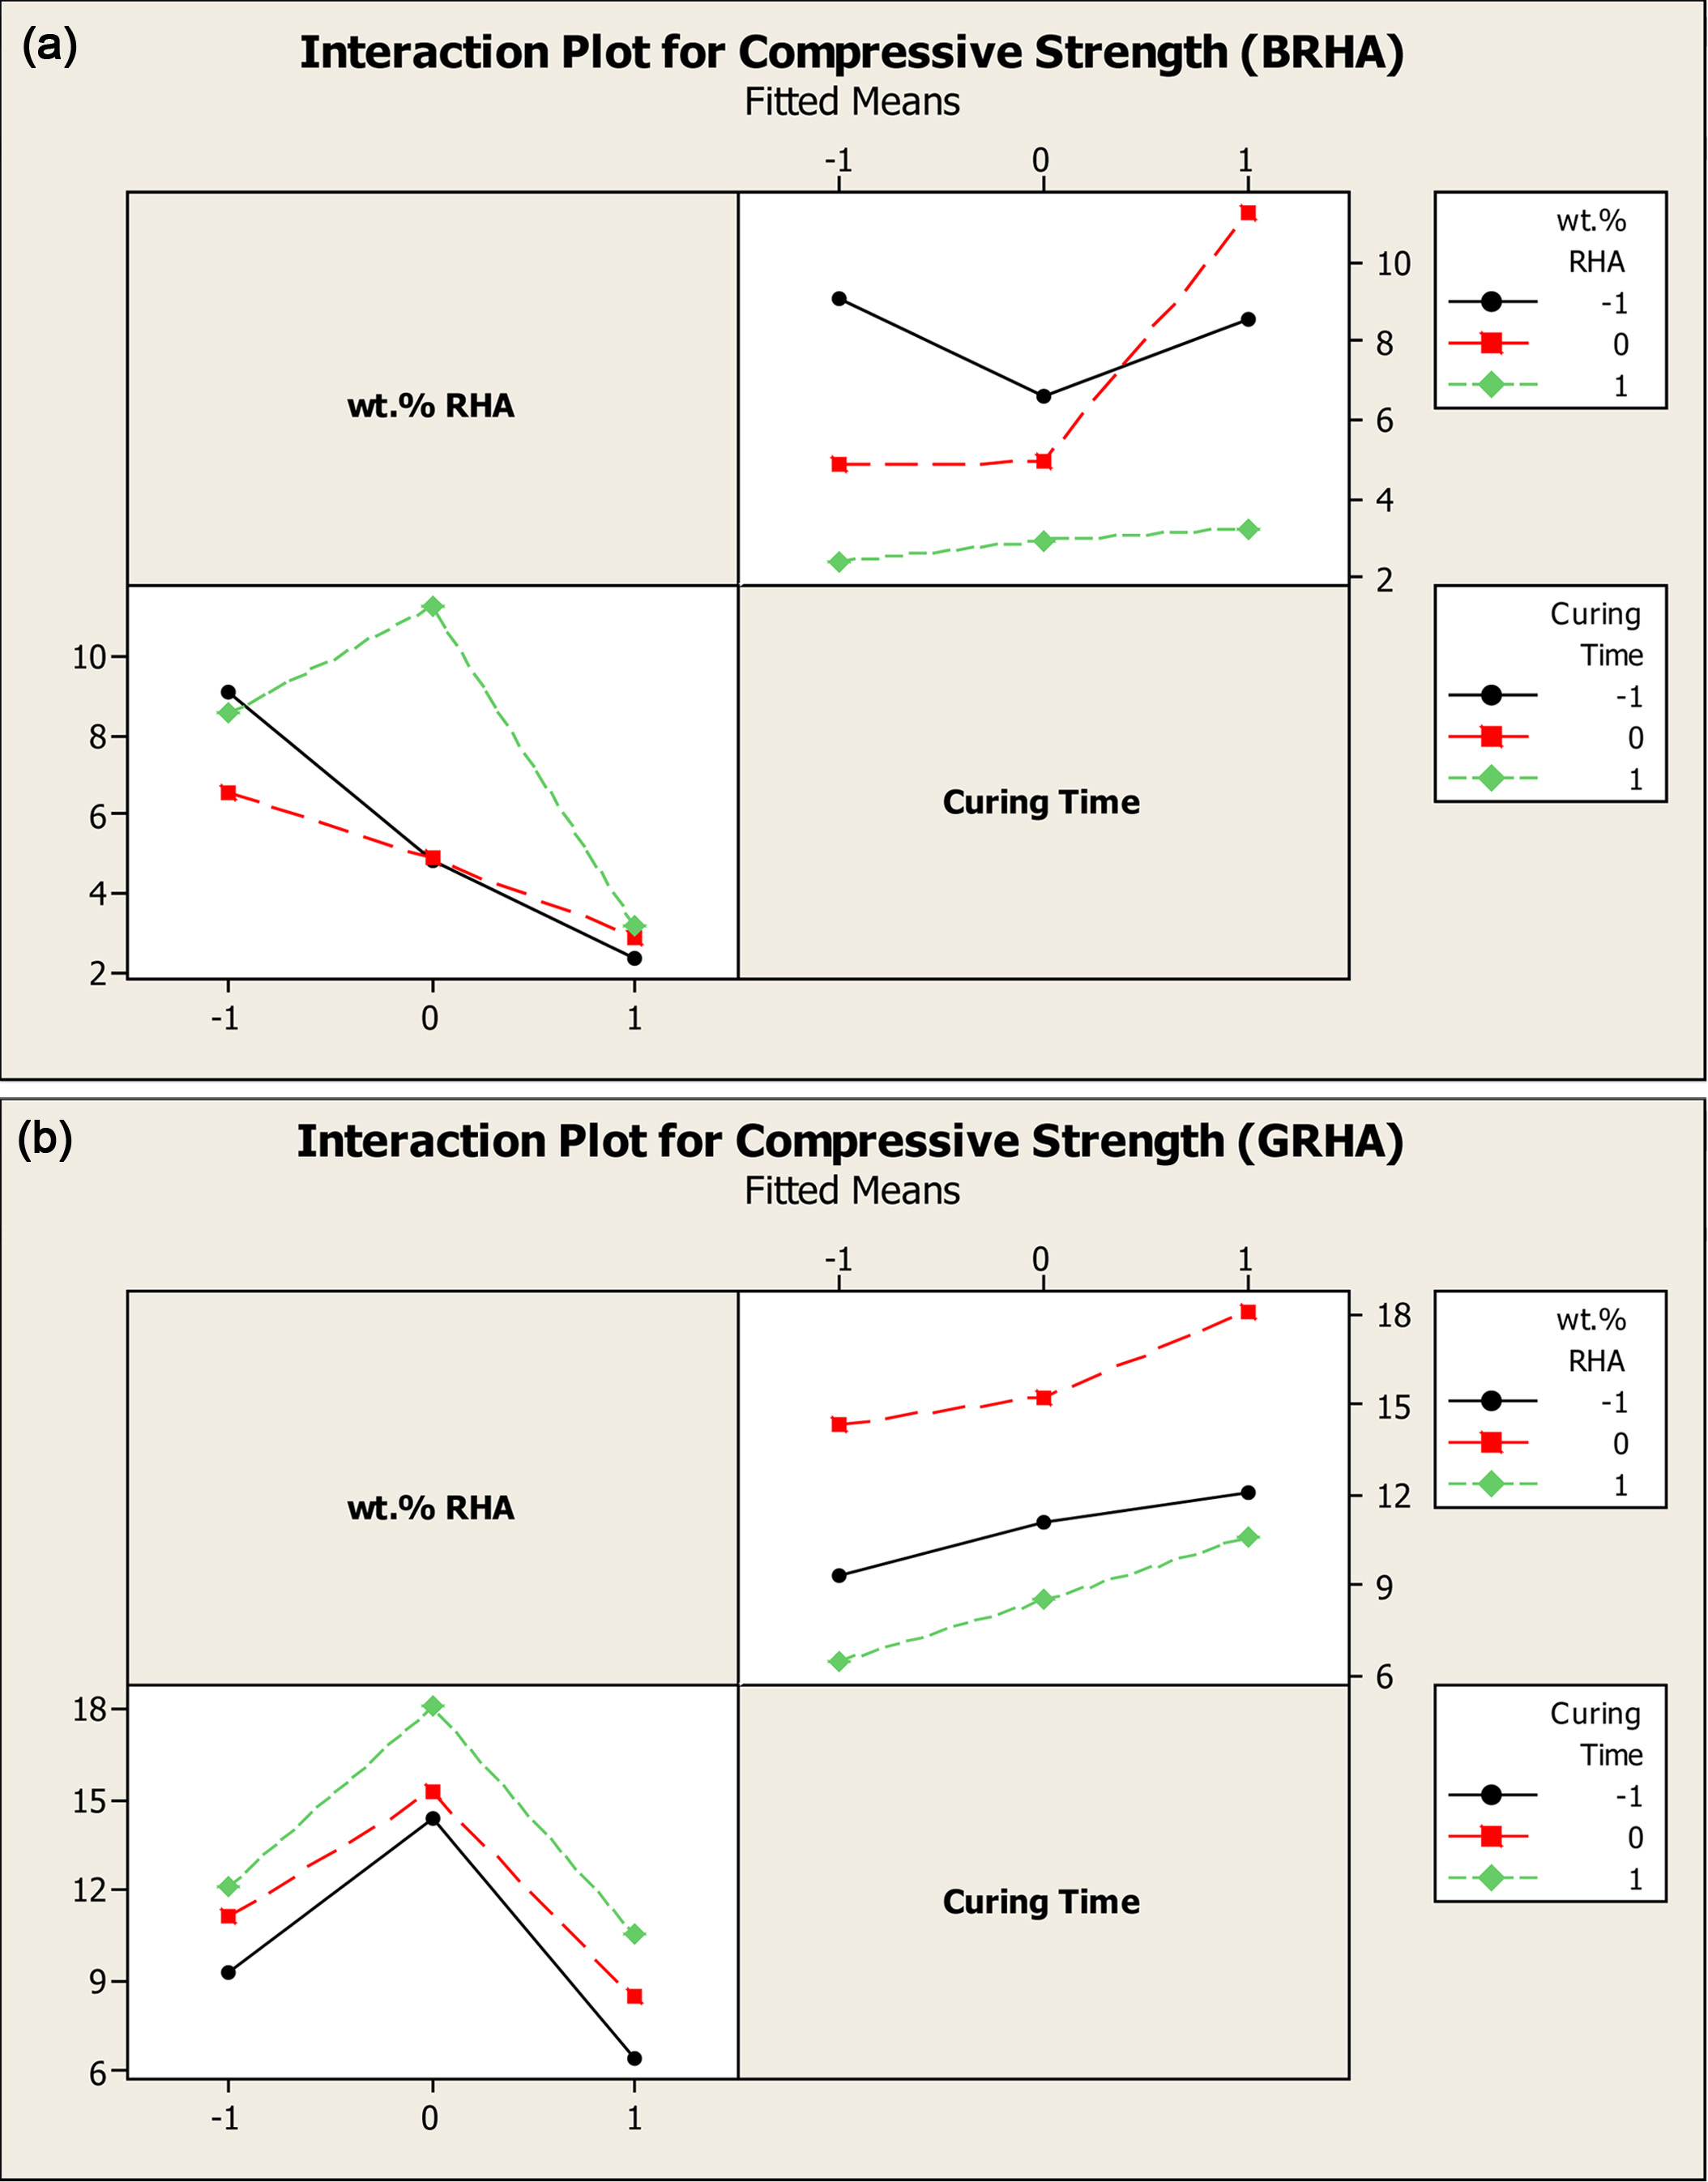
Fig. 5(a) shows that the interaction plots for black RHA
are not parallel, which means strong interaction among factor (weight percentage
of grey RHA and curing time). It is observed that the lesser weight percentage
of black RHA replacement resulting in the higher compressive strength of the
concrete. At the same time, the interaction plot for grey RHA in Fig. 5(b) show
that the lines were not parallel, which is suggesting that there is a strong
interaction among factor (weight percentage of grey RHA and curing
time). Further analysis of the plot has revealed that for all
weight percentage of RHA added, the compressive strength of the concrete
increase with longer curing time. Concrete added 20 wt.% of grey RHA combine with
7 days of curing time show the highest compressive strength.
The effect of curing time toward the concrete also shows that decreasing trend
where the more prolonged the curing time, the lower the compressive strength of
the concrete.
Water Absorption
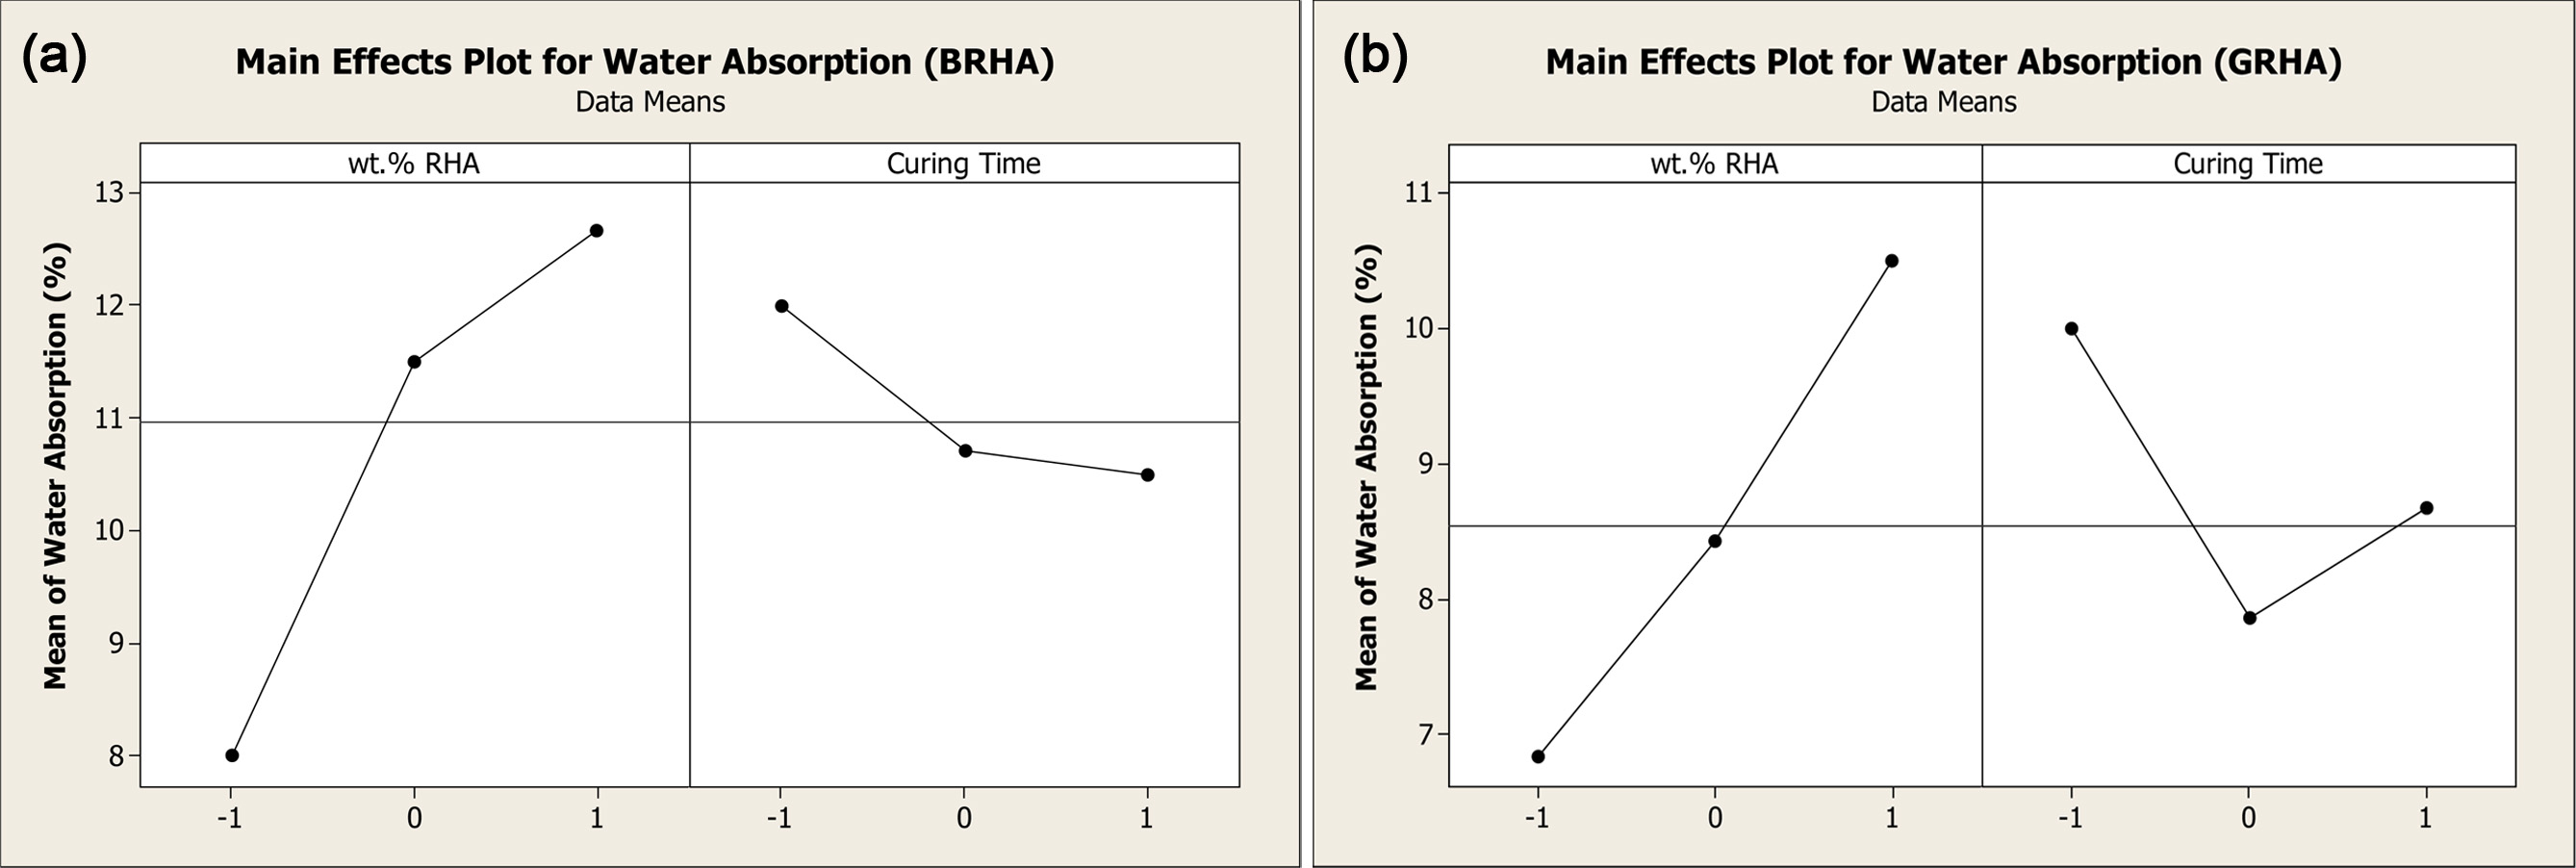
Fig. 6(a), Fig. 6(b), show the main effect, while Fig.
7(a) and Fig. 7(b) interaction plot for water absorption for both black and
grey RHA. By observing the main effect plot of water absorption, it is revealed
that increasing the weight percentage of both types of RHA contributes to
higher water absorption for the concrete. The main effect plots show a
decreasing trend from 3 days (coded as ‘-1’) to 7 days (coded as ‘1’) for both
black and grey RHA.
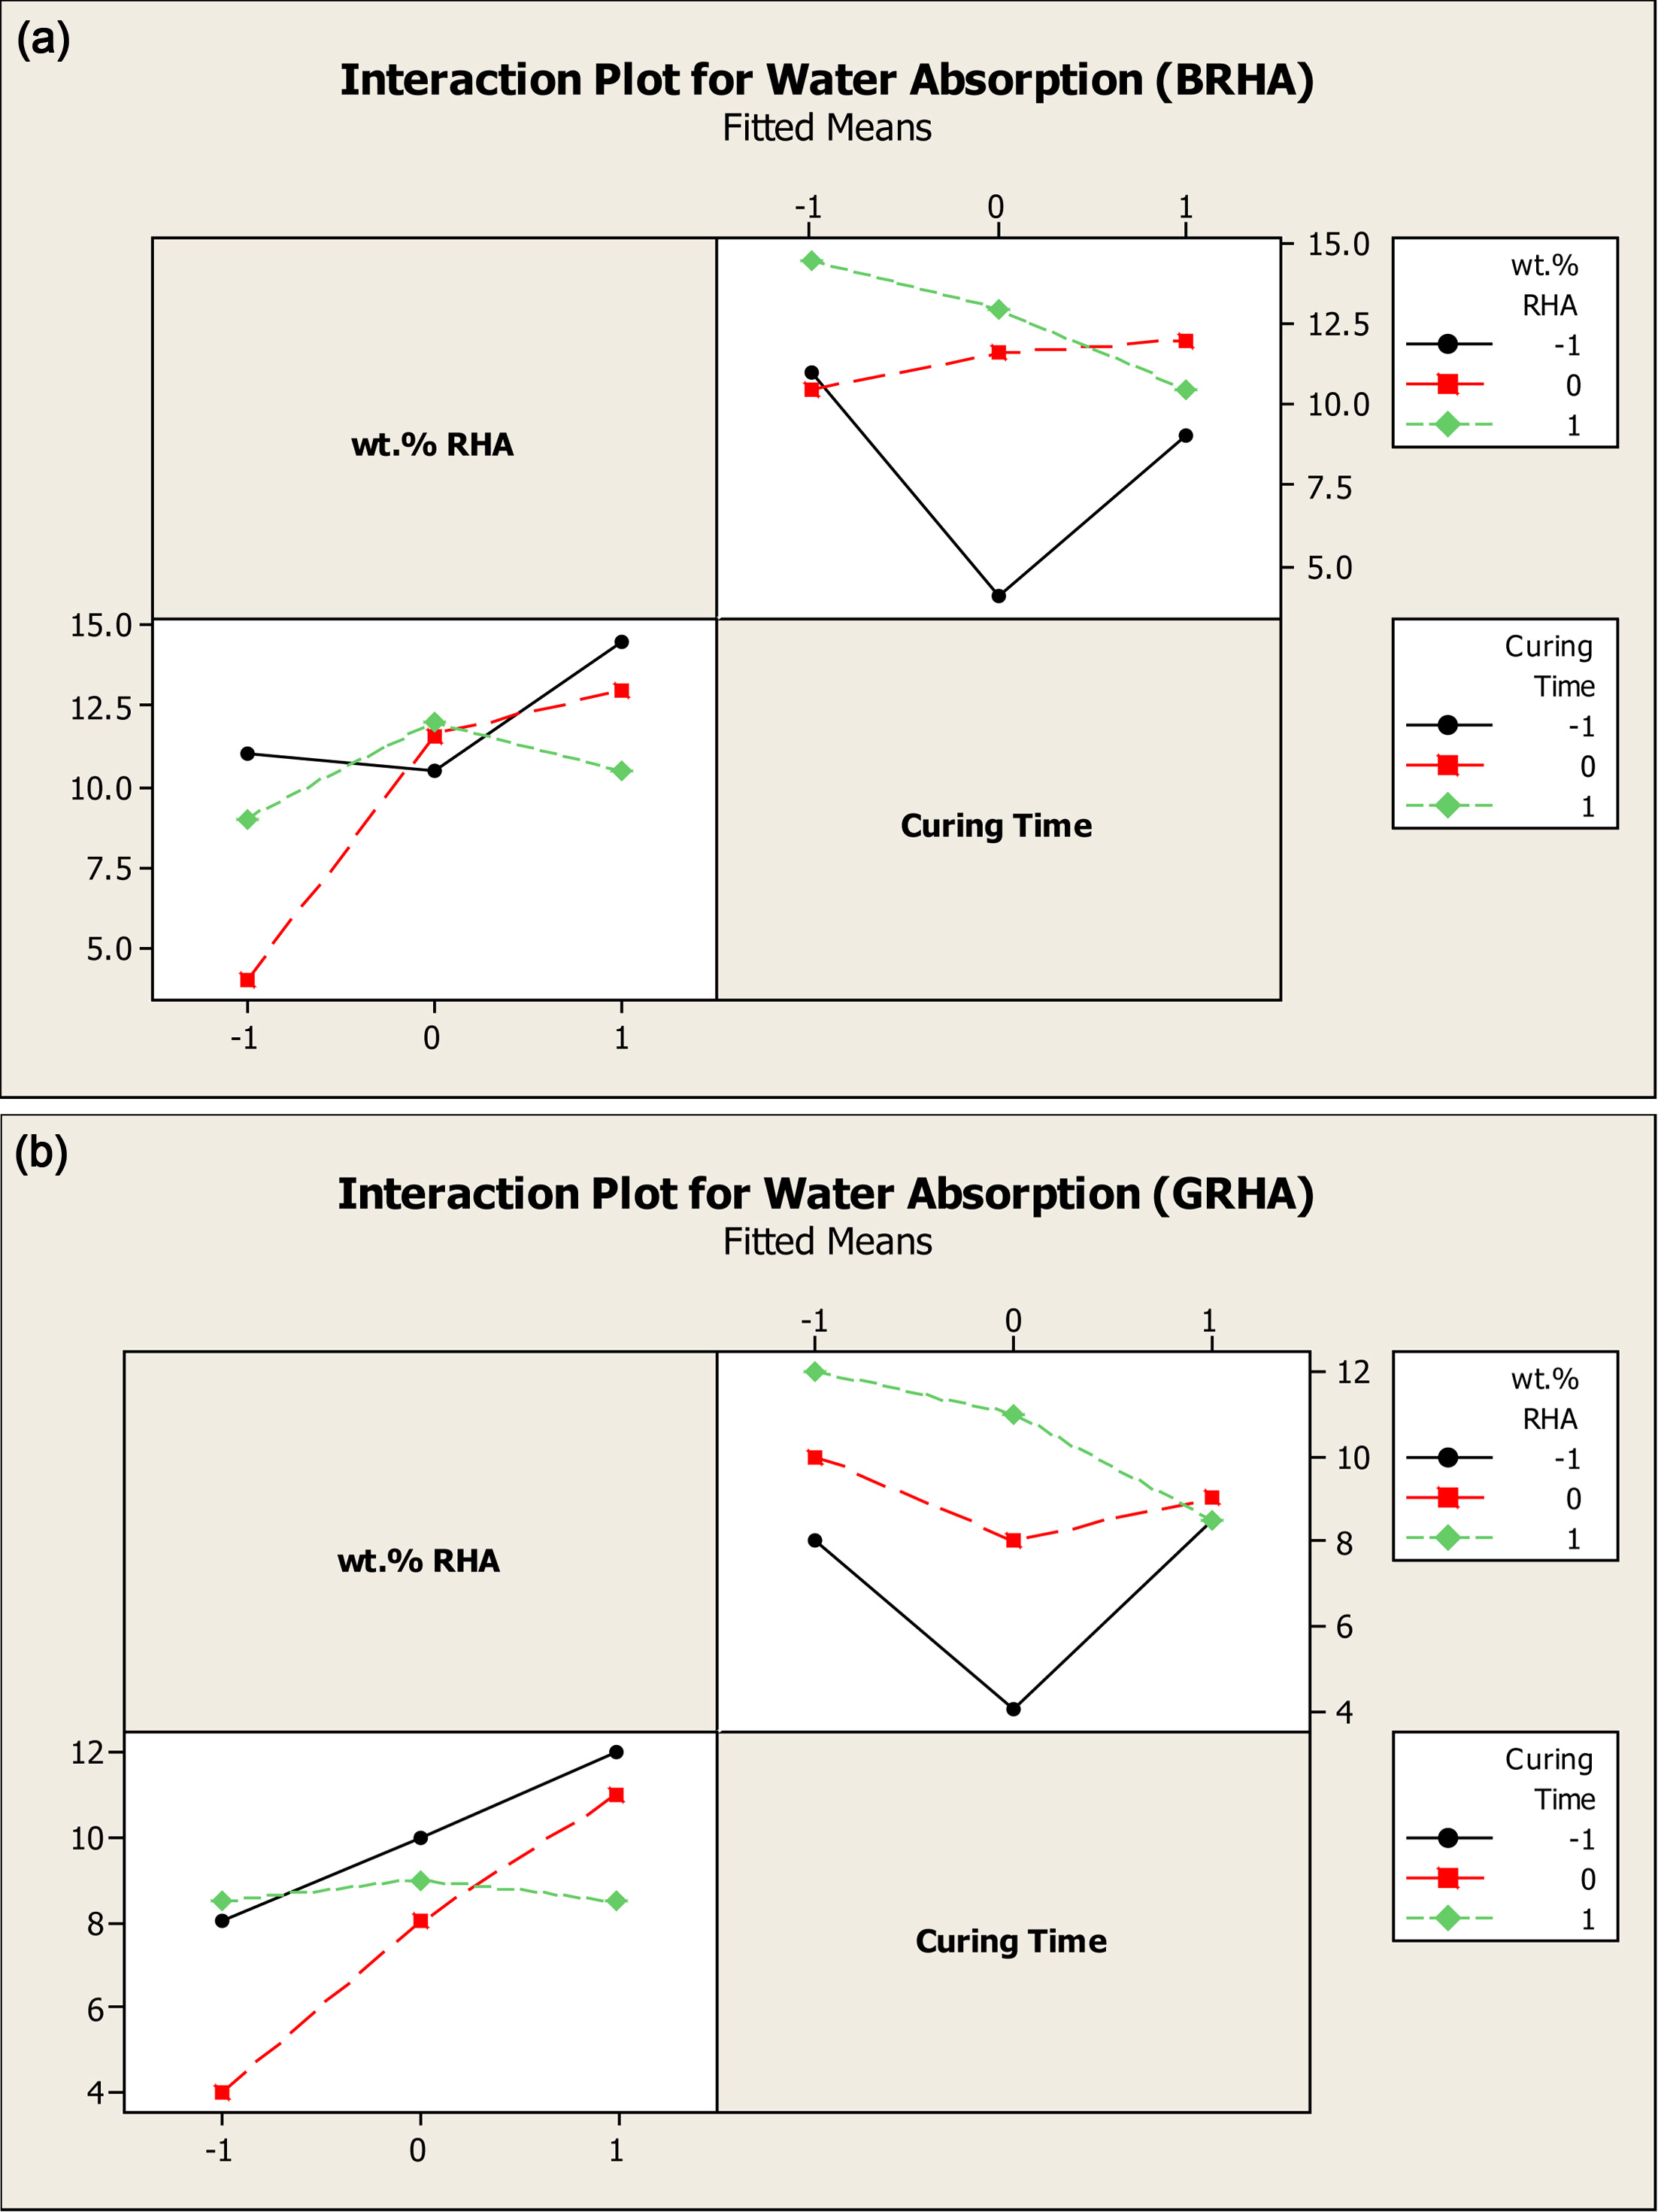
From the interaction plot of water absorption, the highest
water absorption is concrete that incorporated with 30 wt.% of RHA, while 7
days of curing time show the highest result of water absorption for black RHA.
However, the interaction plot of water absorption for grey RHA show an
increasing pattern for curing days but a decreasing pattern for weight
percentage. The highest water absorption is concrete incorporated with 30 wt.%
of grey RHA due to the higher RHA replacement in cement the
higher porous of the concrete products, which lead to higher water
absorption [33].
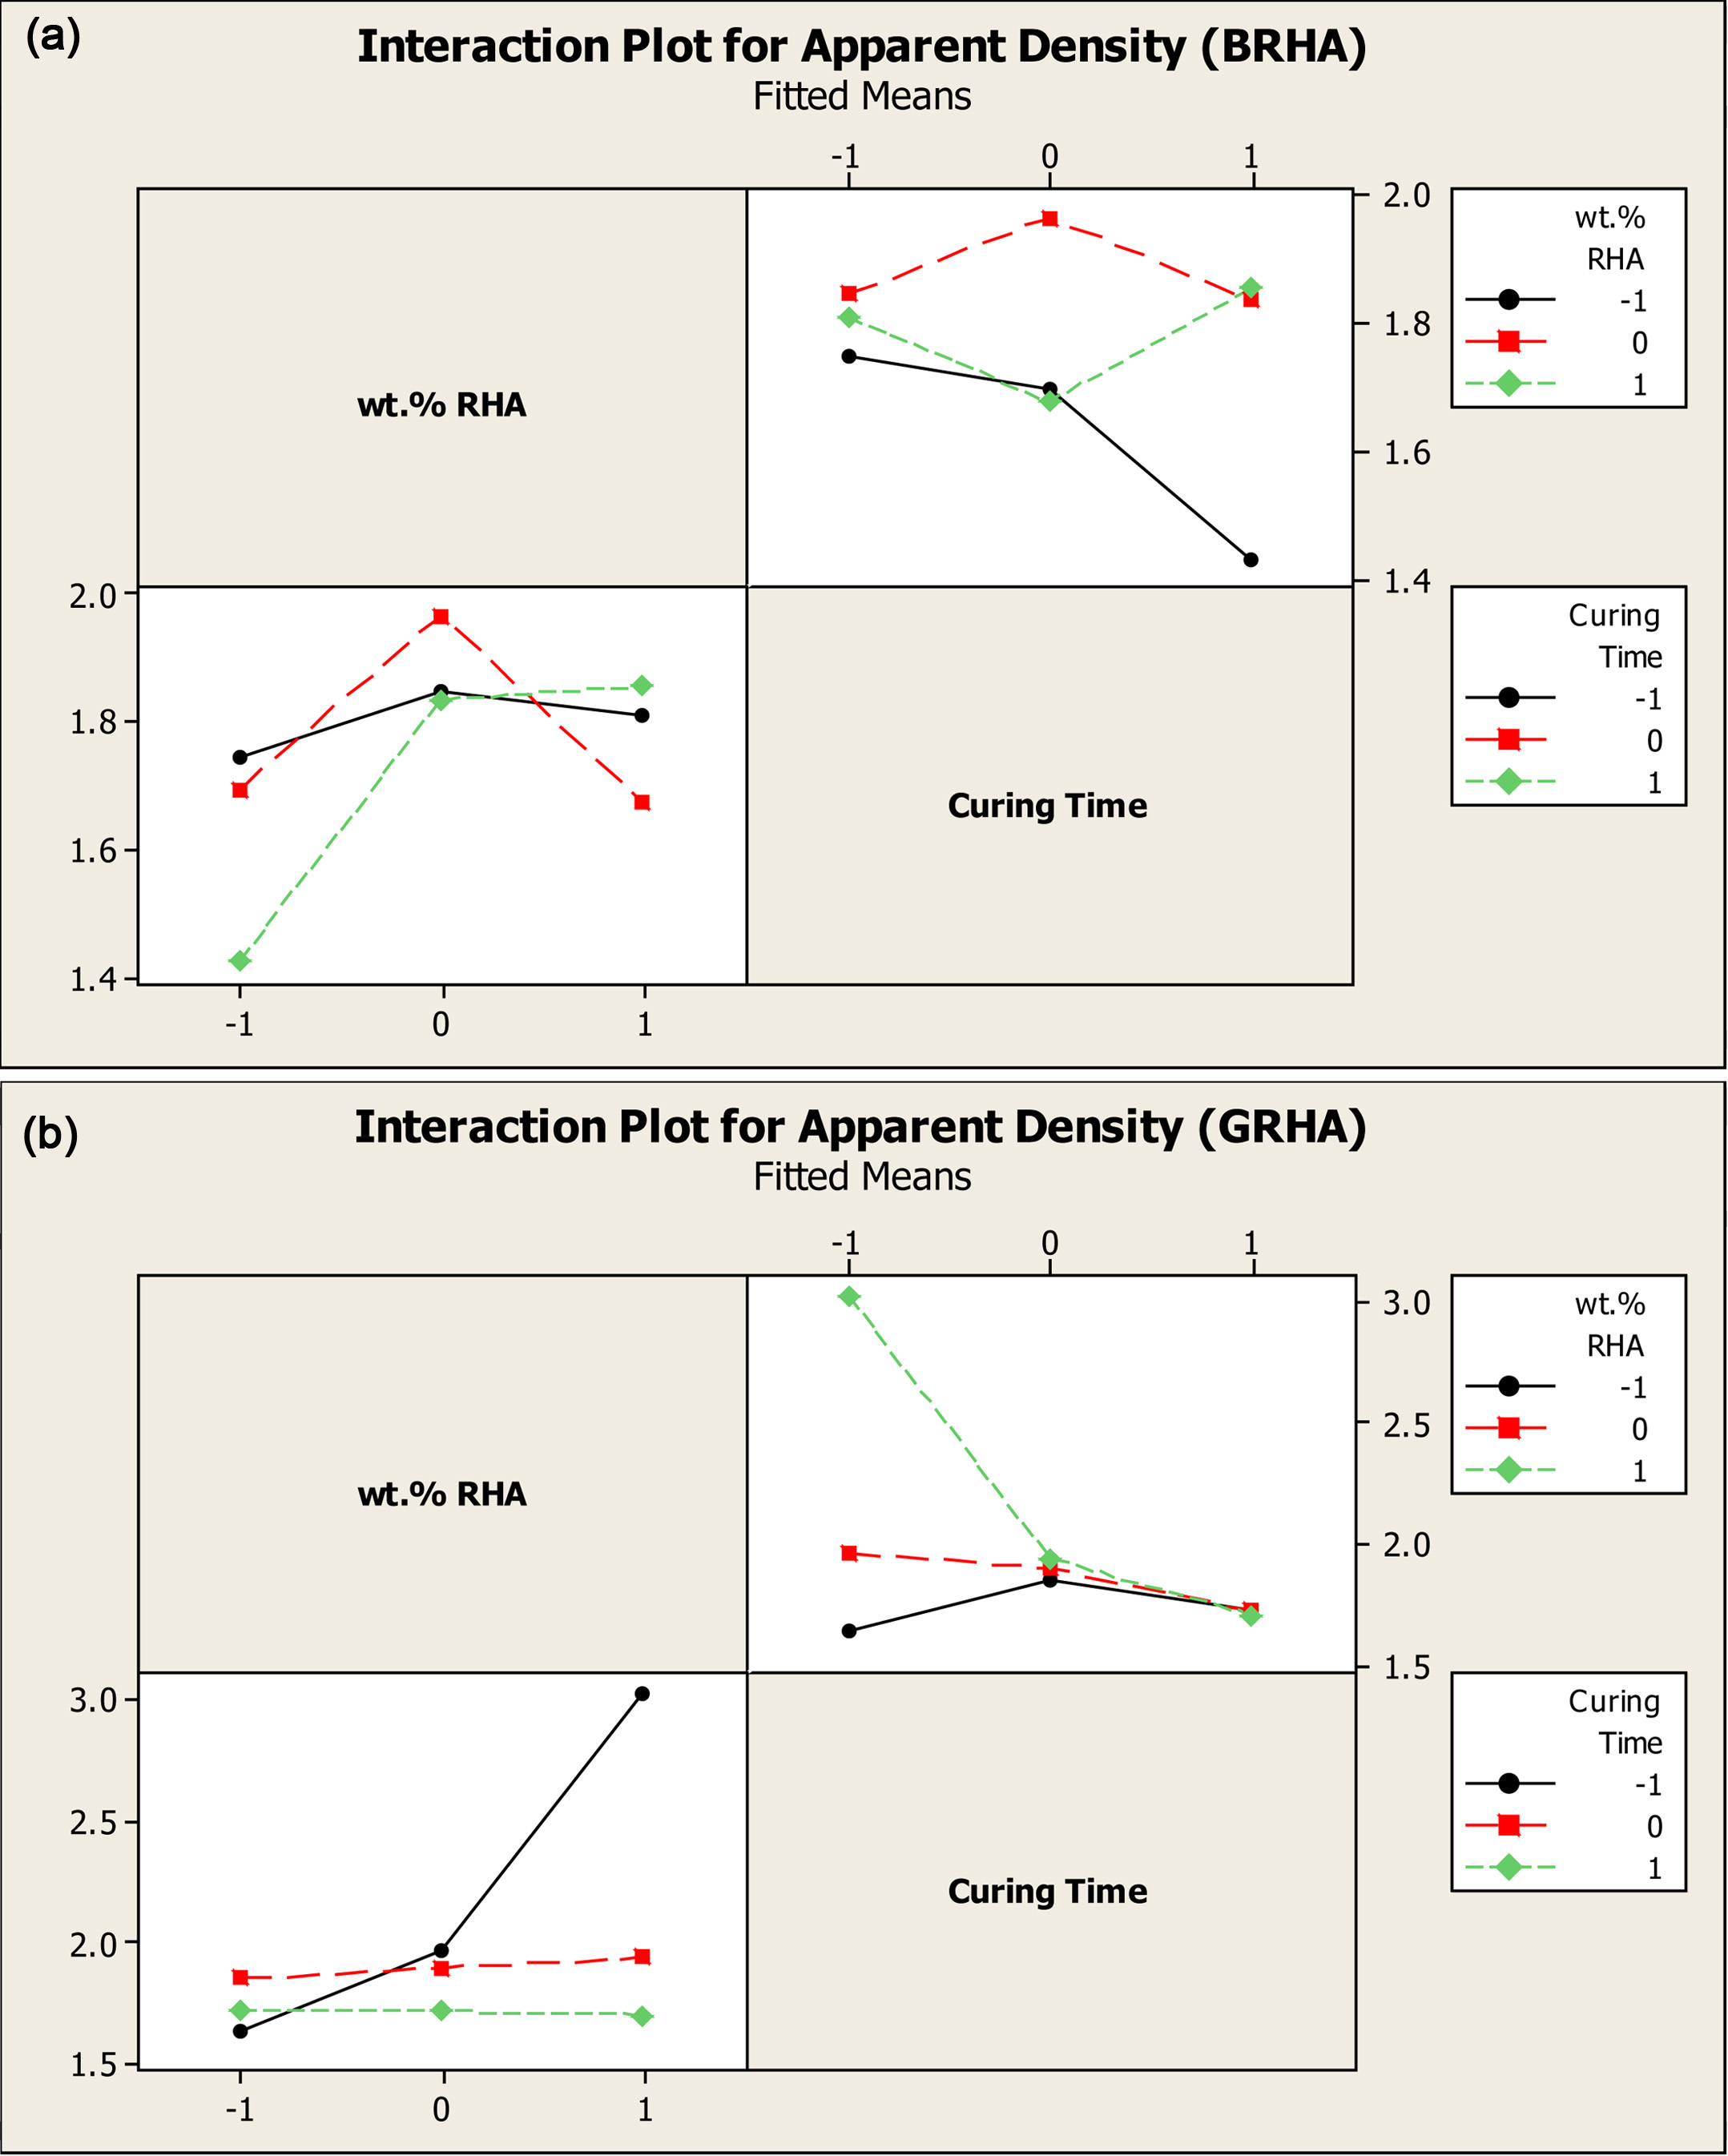
Apparent Density
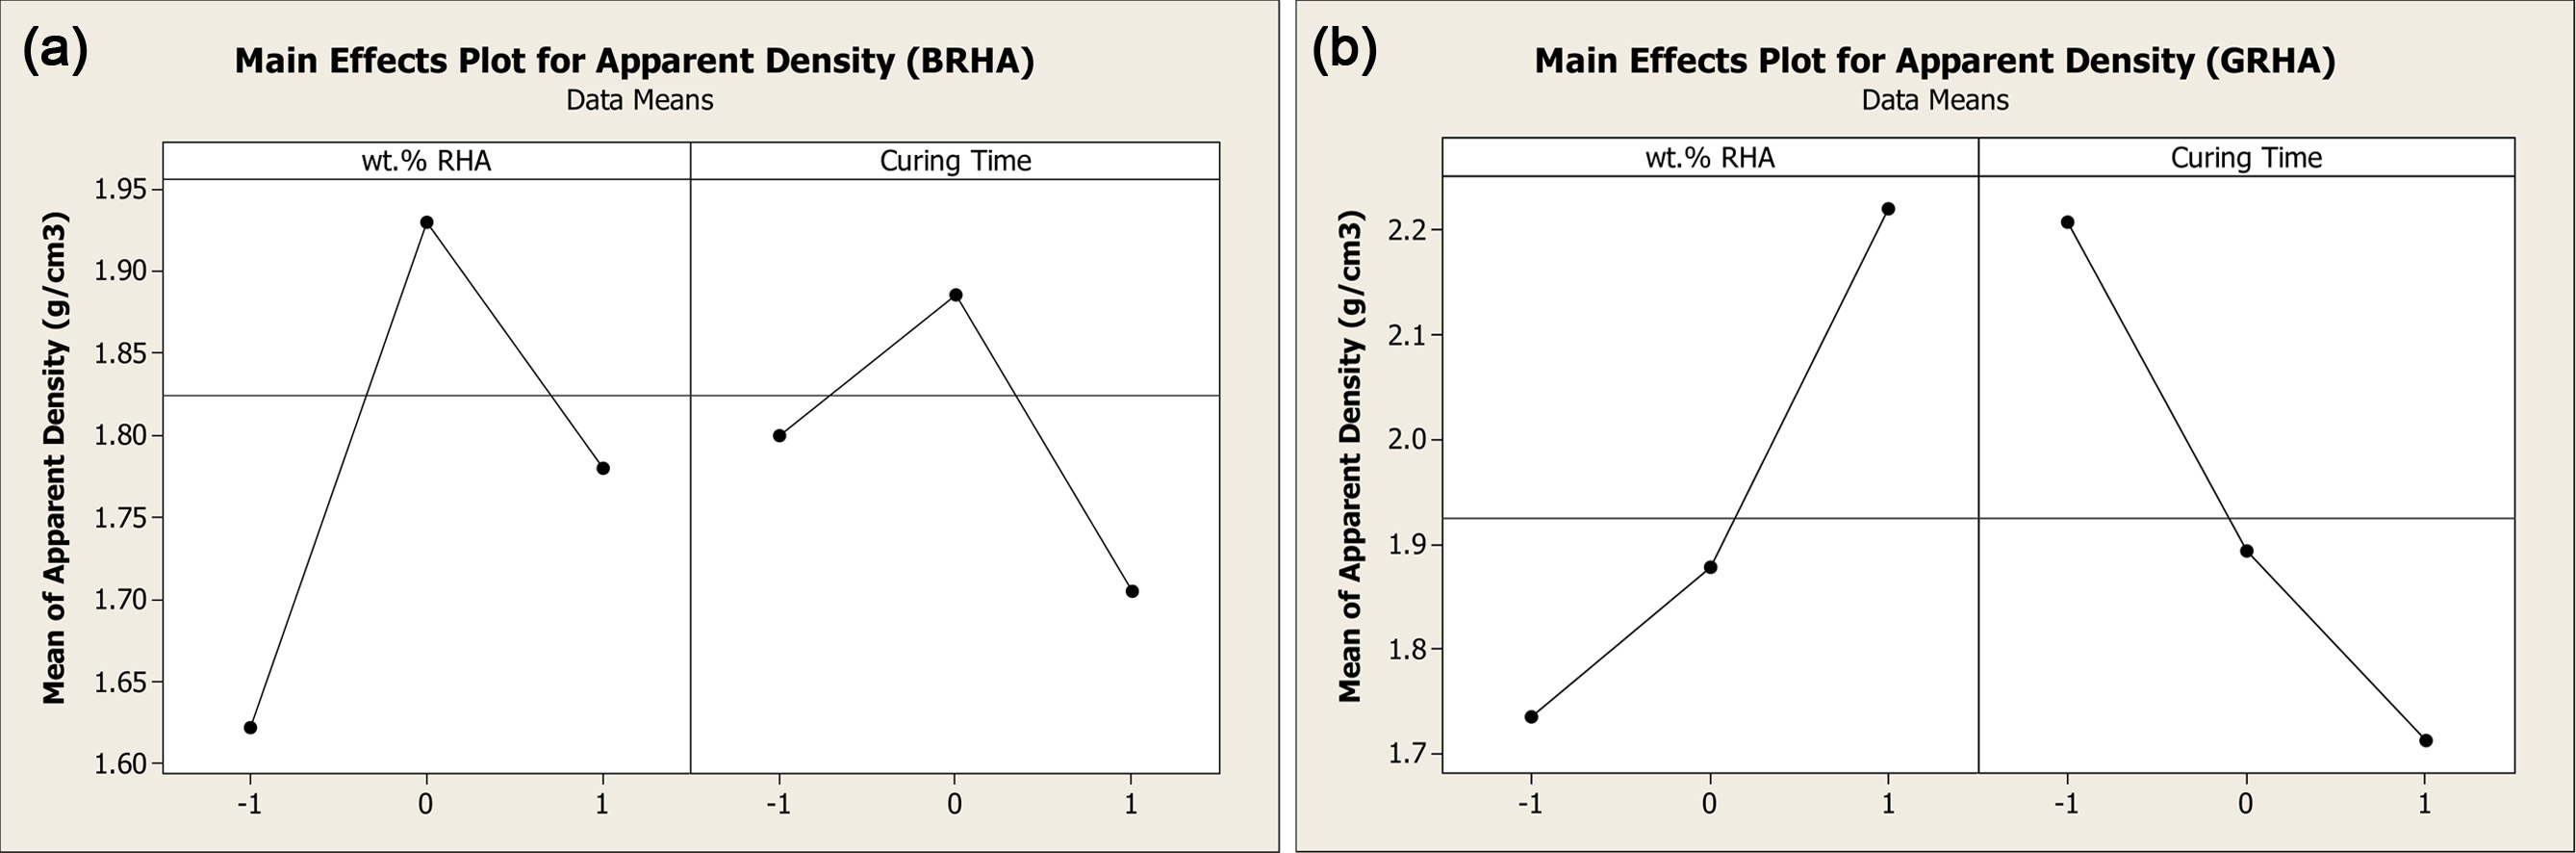
Fig. 8(a) and Fig. 8(b) show the main effect plot for
black and grey RHA while Fig. 9(a) and Fig. 9(b) show interaction plot for both
types of RHA. From the observation of the main effect plot, black and grey RHA
show an increasing trend, but for black RHA, it started to decrease when the
weight percentage of RHA is 20 wt.% to 30 wt.%. The curing time shows a
decreasing pattern for grey RHA as the day’s increase form 3 days (code as
‘-1’) to 7 days (coded as ‘1’). Conversely, black RHA shows an increasing trend
from 3 days (coded as ‘-1’) to 5 days (coded as 0). After that, the trend
started to decrease to 7 days (coded as ‘1’).
Fig. 9(a) and Fig. 9(b) show the interaction plot for
black and grey RHA for apparent density. From the observation for black RHA, it
shows 20 wt.% (coded as ‘0’) and 5 days (coded as ‘0’) show the highest
reading. Meanwhile, from observation of grey RHA, the line is parallel to each
other. This indicates that no interaction occurs among the response, whether
weight percentage or curing time [34].
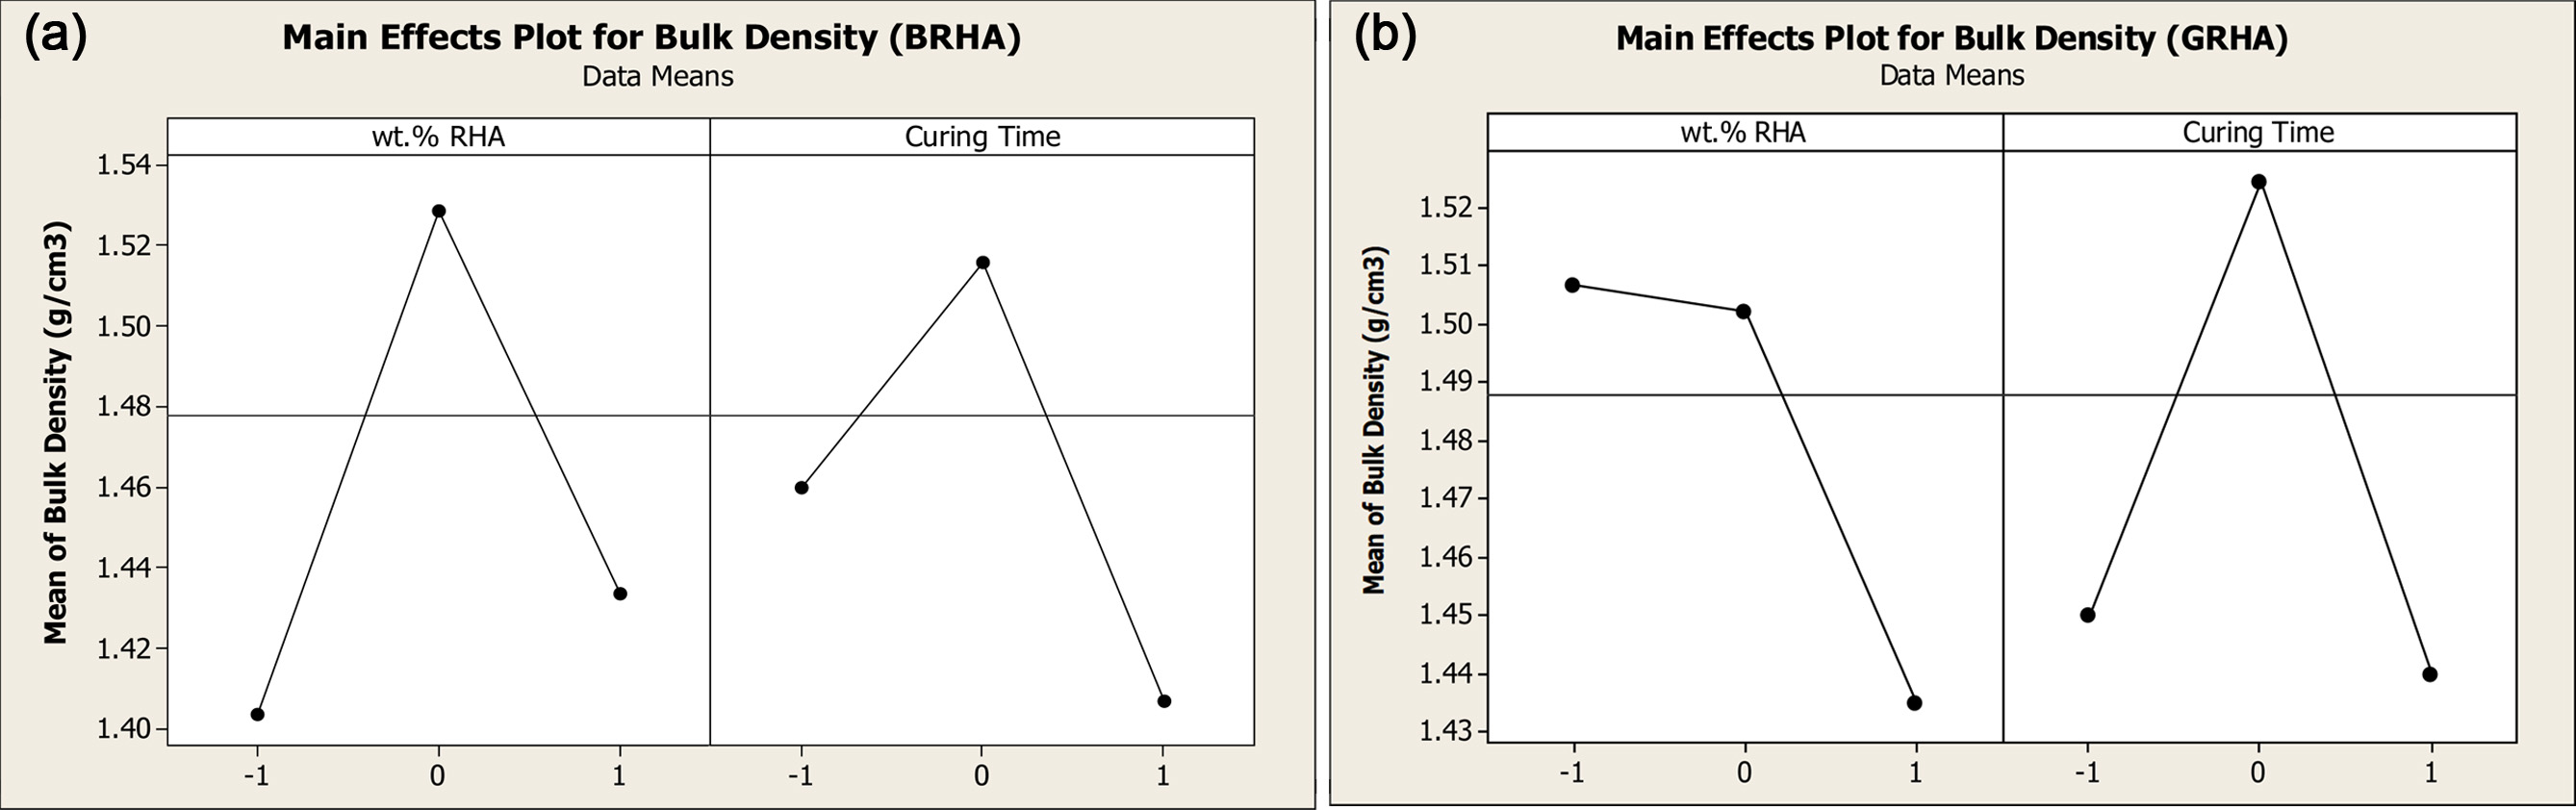
Bulk Density
Fig. 10(a) and Fig. 10(b) show the main effect plot for
bulk density for black and grey RHA. From the observation, the main effect plot
for black RHA show an increasing trend from 10 wt.% to 20 wt.% for weight
percentages and 3 days to 5 days for curing time. Then, it shows a decreasing
trend to 30 wt.% and 7 days. From the results of grey RHA, the weight
percentage of RHA show a decreasing pattern, while for curing time show both
increase and decrease pattern. It starts to increase from 10 wt.% to 20 wt.%
and decrease from 20 wt. % to 30. wt.%.
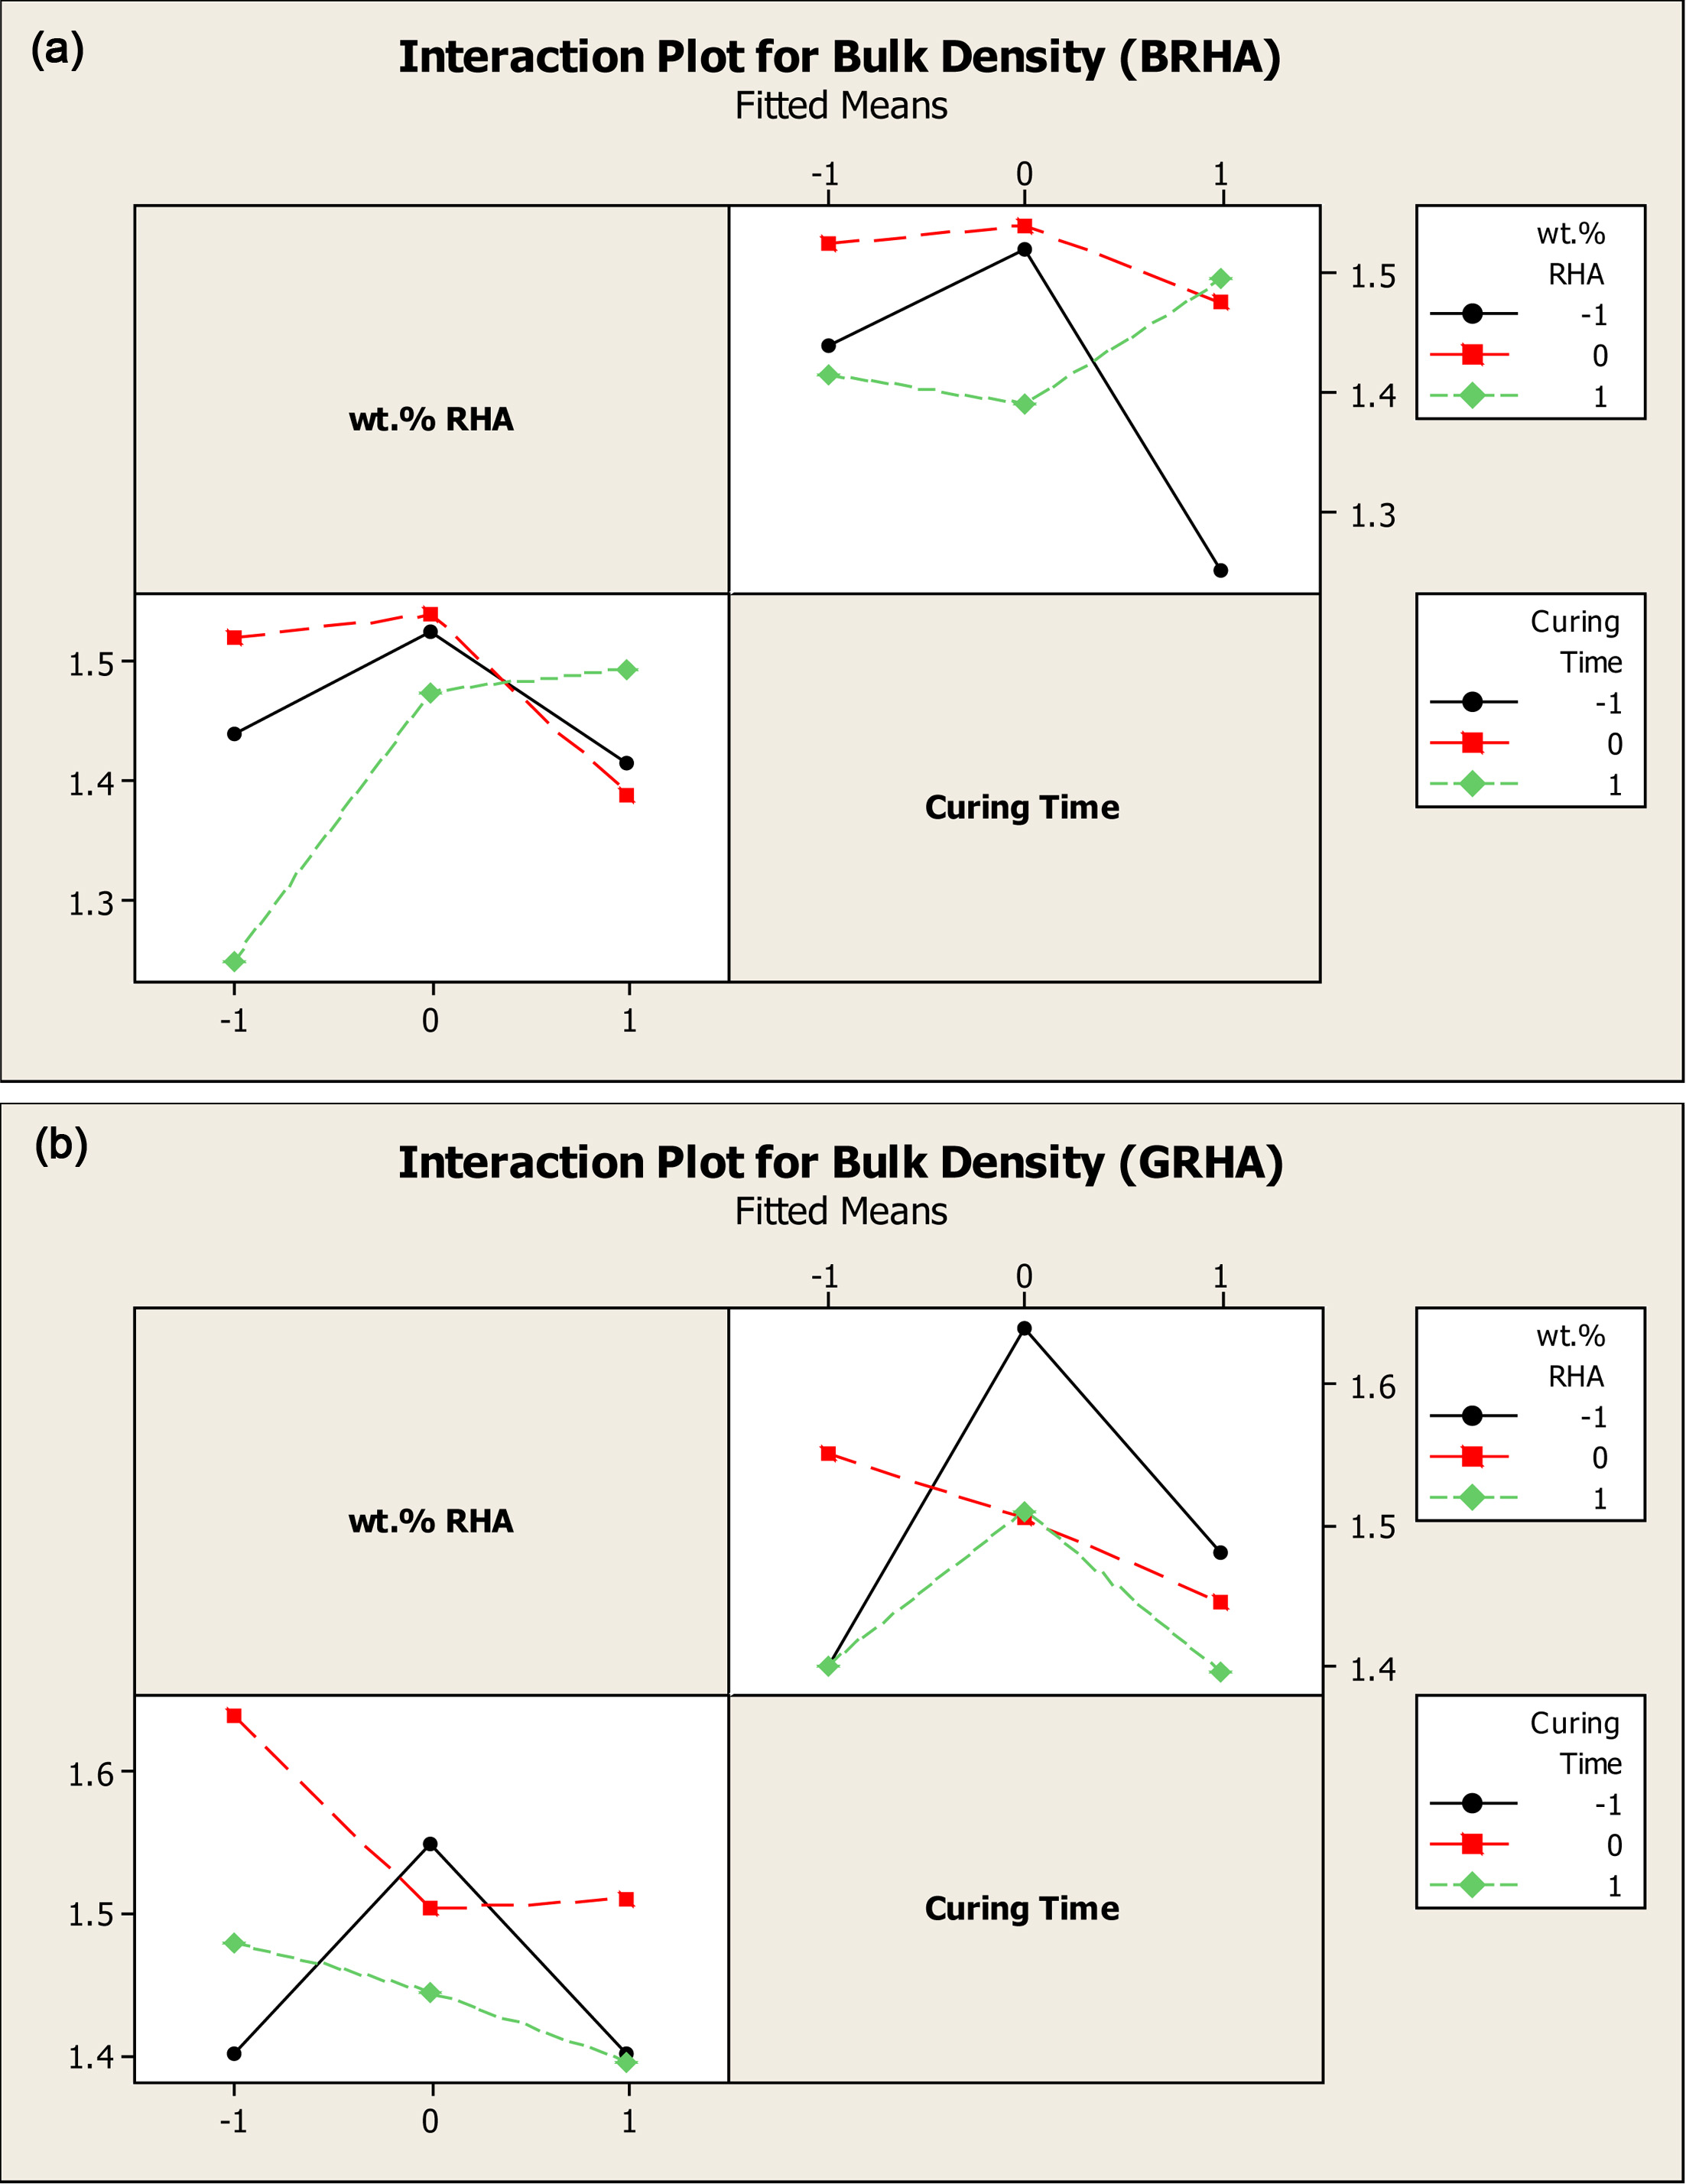
For the interaction plot in Fig. 11(a), 20 wt.% of RHA and
5 days of curing time show the highest reading. After that, Fig. 11(b) for grey
RHA show that 10 wt.% and 5 days of curing time show the highest reading, among
others variable response.
|
Fig. 1 XRD Pattern of (a) Black RHA and (b) Grey RHA. |
|
Fig. 2 (a) Residual plots for compressive strength of black RHA; (i) Normal probability plot, (ii) Histogram of frequency versus residual,
(iii) Residual versus fits, (iv) Residual versus observation order of data. (b) Residual plots for water absorption black RHA; (i) Normal
probability plot, (ii) Histogram of frequency versus residual, (iii) Residual versus fits, (iv) Residual versus observation order of data. (c)
Residual plots for apparent density black RHA; (i) Normal probability plot, (ii) Histogram of frequency versus residual, (iii) Residual versus
fits, (iv) Residual versus observation order of data. (d) Residual plots for bulk density black RHA; (i) Normal probability plot, (ii) Histogram
of frequency versus residual, (iii) Residual versus fits, (iv) Residual versus observation order of data. |
|
Fig. 3 (a) Residual plots for compressive strength grey RHA; (i) Normal probability plot, (ii) Histogram of frequency versus residual, (iii)
Residual versus fits, (iv) Residual versus observation order of data. (b) Residual plots for water absorption grey RHA; (i) Normal probability
plot, (ii) Histogram of frequency versus residual, (iii) Residual versus fits, (iv) Residual versus observation order of data. (c) Residual plots
for apparent density grey RHA; (i) Normal probability plot, (ii) Histogram of frequency versus residual, (iii) Residual versus fits, (iv)
Residual versus observation order of data. (d) Residual plots for bulk density grey RHA; (i) Normal probability plot, (ii) Histogram of
frequency versus residual, (iii) Residual versus fits, (iv) Residual versus observation order of data. |
|
Fig. 4 (a) Main Effects Plots for Compressive Strength (BRHA). (b) Main Effects Plots for Compressive Strength (GRHA). |
|
Fig. 5 (a) Interaction Plot for Compressive Strength (BRHA). (b) Interaction Plot for Compressive Strength (GRHA). |
|
Fig. 6 (a) Main Effects Plots for Water Absorption (BRHA). (b) Main Effects Plots for Water Absorption (GRHA). |
|
Fig. 7 (a) Interaction Plots for Water Absorption (BRHA). (b) Interaction Plots for Water Absorption (GRHA). |
|
Fig. 8 (a) Main Effects Plots for Apparent Density (BRHA). (b) Main Effects Plots for Apparent Density (GRHA). |
|
Fig. 9 (a) Interaction Plots for Apparent Density (BRHA). (b) Interaction Plots for Apparent Density (GRHA) |
|
Fig. 10 (a) Main Effects Plot for Bulk Density (BRHA). (b) Main Effects Plot for Bulk Density (GRHA). |
|
Fig. 11 (a) Interaction Plot for Bulk Density (BRHA). (b) Interaction Plot for Bulk Density (GRHA). |
|
Table 2 Experimental design matrix of central composite design for BRHA. |
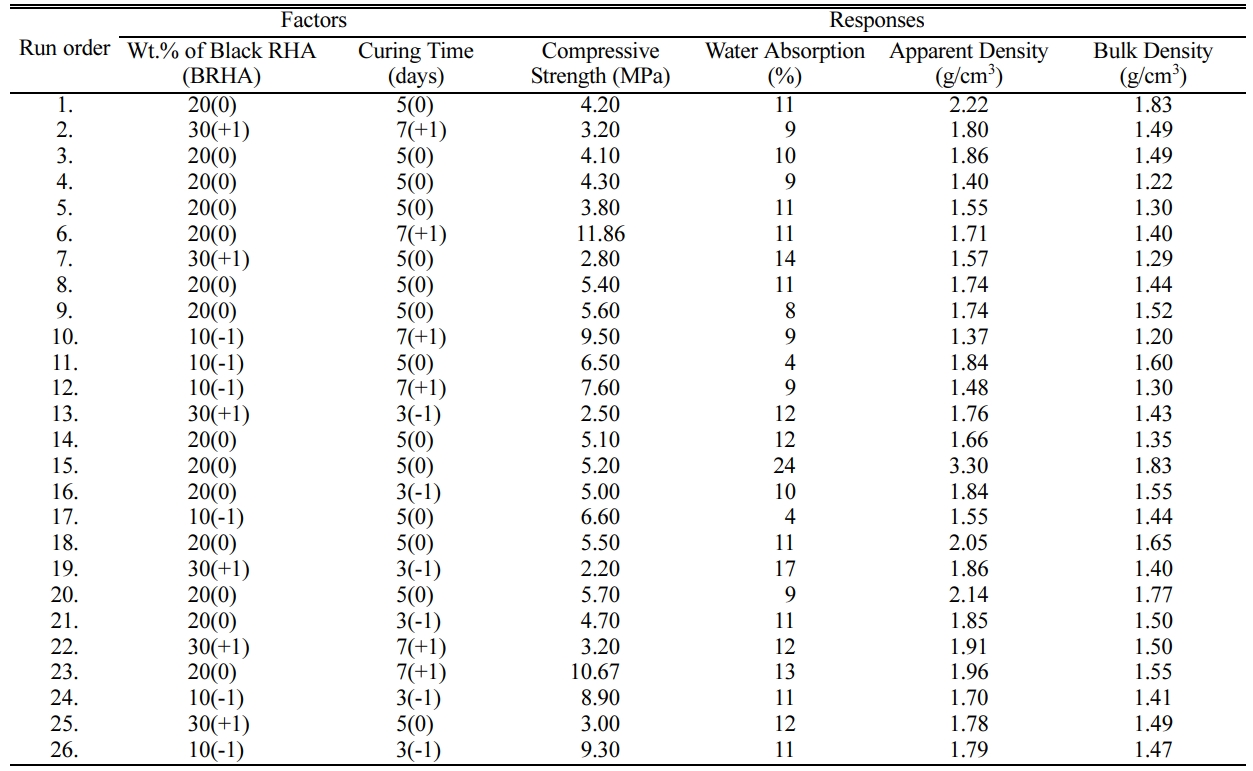
Factor I: Wt.% of BRHA; ‘(-1)’ represents 10 wt.%, ‘(0)’ represents 20 wt.%, ‘(+1)’ represents 30 wt.% |
|
Table 3 Experimental design matrix of central composite design for GRHA. |
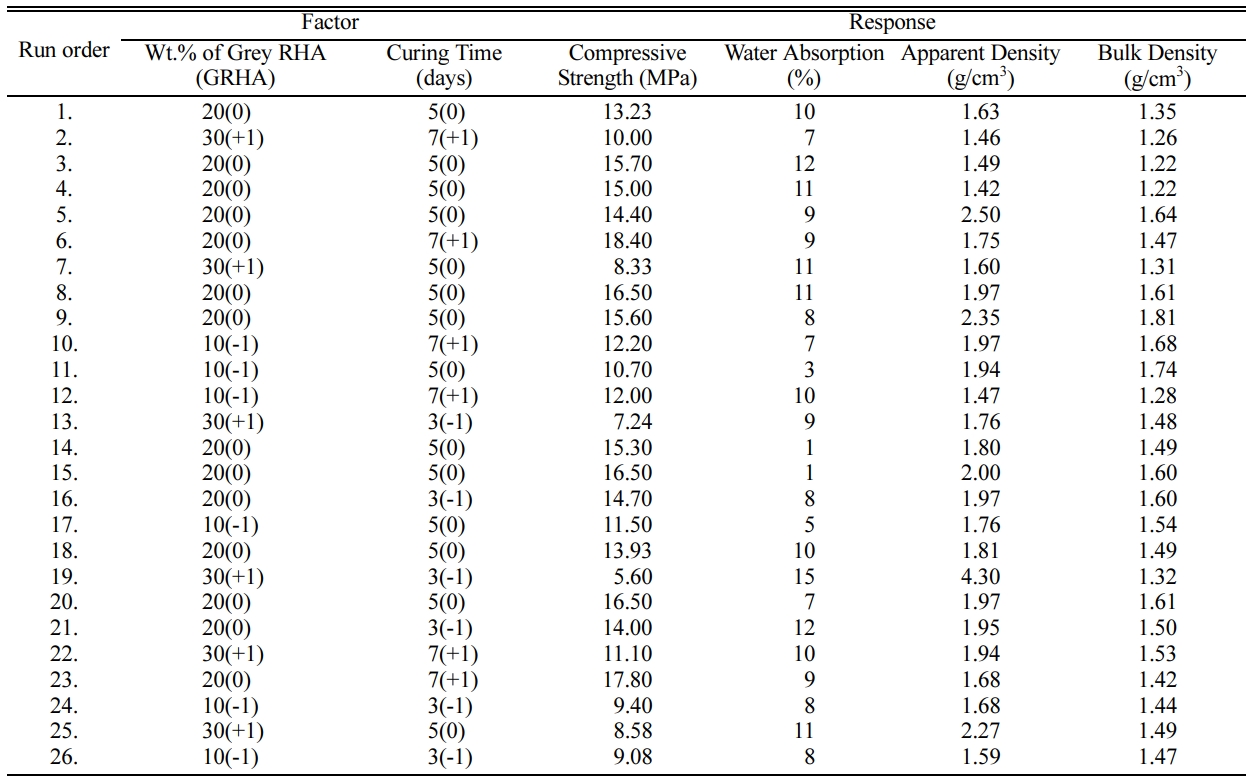
Factor I: Wt.% of GRHA; ‘(-1)’ represents 10 wt.%, ‘(0)’ represents 20 wt.%, ‘(+1)’ represents 30 wt.% |
In this study, the utilization of RHA as a partial
replacement of cementing material in concrete by using a statistical
experimental design was successfully done. Based on the
result obtained from compressive strength, water
absorption, bulk density, apparent density also from XRD and XRF results, which
show positive finding where it indicated that the suitability of RHA to partially
replace cement in concrete. This results further supported by
analysis through statistical experimental design that shows the p-value of all
responses that indicated responses have a significant effect on the factor.
From the data, the best RHA replacement for black RHA was the combination of 20
wt.% RHA and 7 days of curing time due to it have higher compressive strength,
which is 11.86 and 10.67 MPa compared to another sample. A similar result also
can be observed for grey RHA that shows the highest compressive strength of
17.80 and 18.4 MPa. According to Bahri et al. (2018), the difference between
the compressive strength of grey and black RHA was affected by their
crystallinity in which amorphous silica has a higher pozzolanic reaction
compared to crystalline silica. Higher pozzolanic reaction means more C-S-H
were produced during the reaction, which leads to higher compressive strength
[24].
The authors would like to thank the Faculty of
Bioengineering and Technology, University Malaysia Kelantan (UMK), for
providing the research facilities in order to complete this project.
- 1. E. Khankhaje, M. Rafieizonooz, M.R. Salim, R. Khan, J. Mirza, H.C. Siong, and Salmiati, J. Clean. Prod. 172 (2018) 1476-1485.
-

- 2. H. Mohammadhosseini and J.M. Yatim, J. Clean. Prod. 144 (2017) 8-21.
-
- 3. F. Rivera, P. Martínez, J. Castro, and M. López, Cem. Concr. Compos. 63 (2015) 104-112.
-
- 4. J.B. Lee, S.S. Kim, J.Y. Lee, and J.S. Ryou, J. Ceram. Process. Res. 18[4] (2017) 291-300.
- 5. S.K. Seo, Y.S. Chu, and K.B. Shim, J. Ceram. Process. Res. 18[3] (2017) 177-182.
- 6. C.W. Hong, J. Il Lee, and J.H. Ryu, J. Ceram. Process. Res. 17[7] (2016) 768-772.
- 7. A. Bahurudeen, D. Kanraj, V. Gokul Dev, and M. Santhanam, Cem. Concr. Compos. 59 (2015) 77-88.
-
- 8. S.A. Mangi, N. Jamaluddin, M.H. Wan Ibrahim, A.H. Abdullah, A.S.M. Abdul Awal, S. Sohu, and N. Ali, IOP Conf. Ser.: Mater. Sci. Eng. 271[1] (2017) 012001.
-
- 9. S.A. Memon, U. Javed, and R.A. Khushnood, Constr. Build. Mater. 195 (2019) 165-177.
-
- 10. A. Ayinde Raheem and M. Abiodun Kareem, Int. J. Sustain. Constr. Eng. Technol. 7[2] (2017) 77-93.
- 11. D.D. Bui, J. Hu, and P. Stroeven, Cem. Concr. Compos. 27[3] (2005) 357-366.
-
- 12. H. Chao-Lung, B. Le Anh-Tuan, and C. Chun-Tsun, Constr. Build. Mater. 25[9] (2011) 3768-3772.
-
- 13. S.K. Antiohos, V.G. Papadakis, and S. Tsimas, Cem. Concr. Res. 61-62 (2014) 20-27.
-
- 14. S. Muthayya, J.D. Sugimoto, S. Montgomery, and G.F. Maberly, Ann. N. Y. Acad. Sci. 1324[1] (2014) 7-14.
-
- 15. A. Maryoto and G. Heri Sudibyo, MATEC Web Conf. 258 (2019) 01005.
-
- 16. V. Saraswathy and H.W. Song, Constr. Build. Mater. 21[8] (2007) 1779-1784.
-
- 17. S.A. Zareei, F. Ameri, F. Dorostkar, and M. Ahmadi, Case Stud. Constr. Mater. 7 (2017) 73-81.
-
- 18. A.A. Ramezanianpour, M. Mahdi Khani, and G. Ahmadibeni, Int. J. Civ. Eng. 7[2] (2009) 83-91.
- 19. B.K. Ngun, H. Mohamad, E. Sakai, and Z.A. Ahmad, J. Ceram. Process. Res. 11[3] (2010) 311-315.
- 20. G.H.M.J. SubashiDe Silvaa and B.V.A.Perera, J. Build. Eng. 18 (2018) 252-259.
-
- 21. A.Y. Aydar, in “Statistical Approaches With Emphasis on Design of Experiments Applied to Chemical Processes” (InTech, 2018) p 157.
-
- 22. A. Khan, J. Do, and D. Kim, J. Constr. Eng. Manag. 143[4] (2017) 04016108.
-
- 23. I.K. Ejiogu, P.A. Mamza, P.O. Nkeonye, and A.S. Yaro, Pac. J. Sci. Technol. 19[1] (2018) 22-36.
- 24. S. Bahri, H.B. Mahmud, and P. Shafigh, Sadhana43[2] (2018) 22.
-
- 25. S. Memon, I. Wahid, M. Khan, M. Tanoli, and M. Bimaganbetova, Sustainability 10[5] (2018) 1322-1343.
-
- 26. C.D. Igwebike-Ossi, Int. J. Appl. Chem. 12[3] (2016) 281-291.
- 27. K. Burnecki, A. Wylomanska, and A. Chechkin, PLoS One 10[12] (2015) e0145604.
-
- 28. L. Foglia, S.W. Mehl, M.C. Hill, and P. Burlando, Water Resour. Res. 49[1] (2013) 260-282.
-
- 29. A.F. Zuur and E.N. Ieno, Methods Ecol. Evol. 7[6] (2016) 636-645.
-
- 30. H.-Y. Kim, Restor. Dent. Endod. 39[1] (2014) 74-77.
-
- 31. S. Greenland, S.J. Senn, K.J. Rothman, J.B. Carlin, C. Poole, S.N. Goodman, and D.G. Altman, Eur. J. Epidemiol. 31[4] (2016) 337-350.
-
- 32. V. Saraswathy and H.-W. Song, Constr. Build. Mater. 21[8] (2007) 1779-1784.
-
- 33. M.M. Ahmad, F. Ahmad, M. Azmi, and M.Z.A. Mohd Zahid, Appl. Mech. Mater. 802 (2015) 267-271.
-
- 34. A. Thejas Shetty and S.D. Kularni, Int. Res. J. Eng. Technol. 4[7] (2017) 482-488.
 This Article
-
2020; 21(6): 667-682
Published on Dec 31, 2020
- 10.36410/jcpr.2020.21.6.667
- Received on Jul 8, 2020
- Revised on Aug 30, 2020
- Accepted on Sep 4, 2020
Services
- Abstract
introduction
methodology
results and discussion
conclusion
- Acknowledgements
- References
- Full Text PDF
Shared
Correspondence to
- Pao Ter Teo
-
Advanced Materials Research Cluster, Faculty of Bioengineering and Technology, Universiti Malaysia Kelantan, Jeli Campus, 17600 Jeli, Kelantan, Malaysia
Tel : +609-9477427 Fax: +609-9477402 - E-mail: teopaoter@umk.edu.my
Clean-Energy Research Institute(CRI), Hanyang University, 222, Wangsimni-ro, Seongdong-gu, Seoul, 04763, Korea
E-mail: jcpr@hanyang.ac.kr