- Synthesis of TiO2 nanoparticles using titanium tetraisopropoxide and starch
Soo-Jong Kima,* and Kenji Oginob
aDepartment of Advanced Materials & Chemical Engineering, Halla University, 28 Halladaegil, Wonju, Kangwon 26404, Korea
bGraduate School of Bio-Applications and Systems Engineering, Tokyo University of Agriculture and Technology, 2-24-16 Nakacho, Koganei, Tokyo, 184-8588, Japan
Simple synthesis of
nanocrystalline titanium dioxide (TiO2) by impregnation method was
investigated. Titanium tetraisopropoxide (TTIP) was used as the precursor and starch as the
impregnations matrix. TiO2 nanoparticles of 100 nm in size were
synthesized by varying the conditions. Crystallization and the growth of the
particles were accelerated with increasing calcination temperature and time.
The X-ray diffraction study shows that the product has anatase crystal
structure at calcination temperatures below 600 oC. Anatase
phase and rutile phase coexisted at 700 oC. At temperatures
above 700 oC, the intensity of the anatase crystal phase peaks
decreased and a peak of the new rutile crystal phase appeared at 2θ of
27.42(110), 36.11(101), 41.28(111) and 55.06(220). In more than 800 oC
of temperature, rutile phase only existence.
Keywords: TiO2, Starch, Nanoparticle
There are about 11 types of titanium dioxide crystals as
such as anatase, retiles, and brookite etc. Of these, anatase, rutile and
brookite are the best formed and exhibit excellent features. Titanium dioxide
is highly oxidizing, harmless to the human body, and very stable. In addition,
the band gap energy is about 3 eV, which is the optical semiconductor
characteristic [1]. TiO2 particles
with excellent electrical, magnetic, catalytic, electrochemical and optical
properties are used in various industrial fields [2-5]. TiO2 has a
very high refractive index and is excellent in whiteness, and thus is used for
the preparation of white pigments and various
pigments. In particular, ultraviolet light absorbing ability is excellent in the ultraviolet
wavelength range of 400 nm or less, and it is chemically stable and used as a
UV blocking agent [6, 7]. In addition, due to the characteristics of
ultrafine particles, it has a large specific surface area, strong durability,
and excellent photocatalytic ability and is used in various catalysts, catalyst
supports, sterilizing media, and sensors [8-12]. We have previously reported
the synthesis of titanium oxide nanoparticles using pulp as the impregnation
matrix [13-15]. In this synthetic method, a polymer material having a
microfibril structure is impregnated with a metal salt, and then the
impregnated mixture is dried and fired to prepare ceramic nanoparticles. This
method can control the particle size by changing the type of the impregnation
medium, the heat treatment conditions, and the concentration of the aqueous
metal salt solution [16]. It is also suitable for the synthesis of ceramics
nanoparticles with a uniform particle size distribution in a simple process without using the alkaline organic solvent used in the precipitation method
[17]. In this study, impregnation method was selected as a method for
synthesizing titanium oxide nanoparticles. Titanium tetraisopropoxide (TTIP)
was used as the starting material of this synthesis method, and starch was used instead of pulp as the impregnation
matrix. We chose Starch as a matrix because starch is economically advantageous because of its simpler manufacturing
process than industrial pulp. Pulp is manufactured in paper mills, which
requires a lot of wood to get 1 kg of pulp.
On the other hand, Starch can be obtained directly by grinding grain or plant. Starch in powder form
can be impregnated more than pulp because it has a larger surface area than
plate-type industrial pulp. As a result, yields can be increased and economic
processes can be developed. Pulp having a plate-like dense and rigid structure
has a problem that TTIP is not completely impregnated. Starch in powder form,
however, does not have this problem. Starch with fine particles and large surface
area is easy to impregnate with TTIP. On the other hand, Starch is not easy to
impregnate with aqueous solution. Starch dissolves in water to a certain extent
and agglomerates into a massive mass, which is inconvenient for drying and
firing operations.
Titanium tetraisopropoxide (TTIP, ≥95.0%), isopropanol
(C3H8O, ≥99.7%) and starch (C6H10O5)n,
≥99.5%) were purchased Dae Jung Chemical Co. All the chemical reagents
were analytically pure and used without further
purification. The precursor solution was 5 mL of TTIP mixed with 25
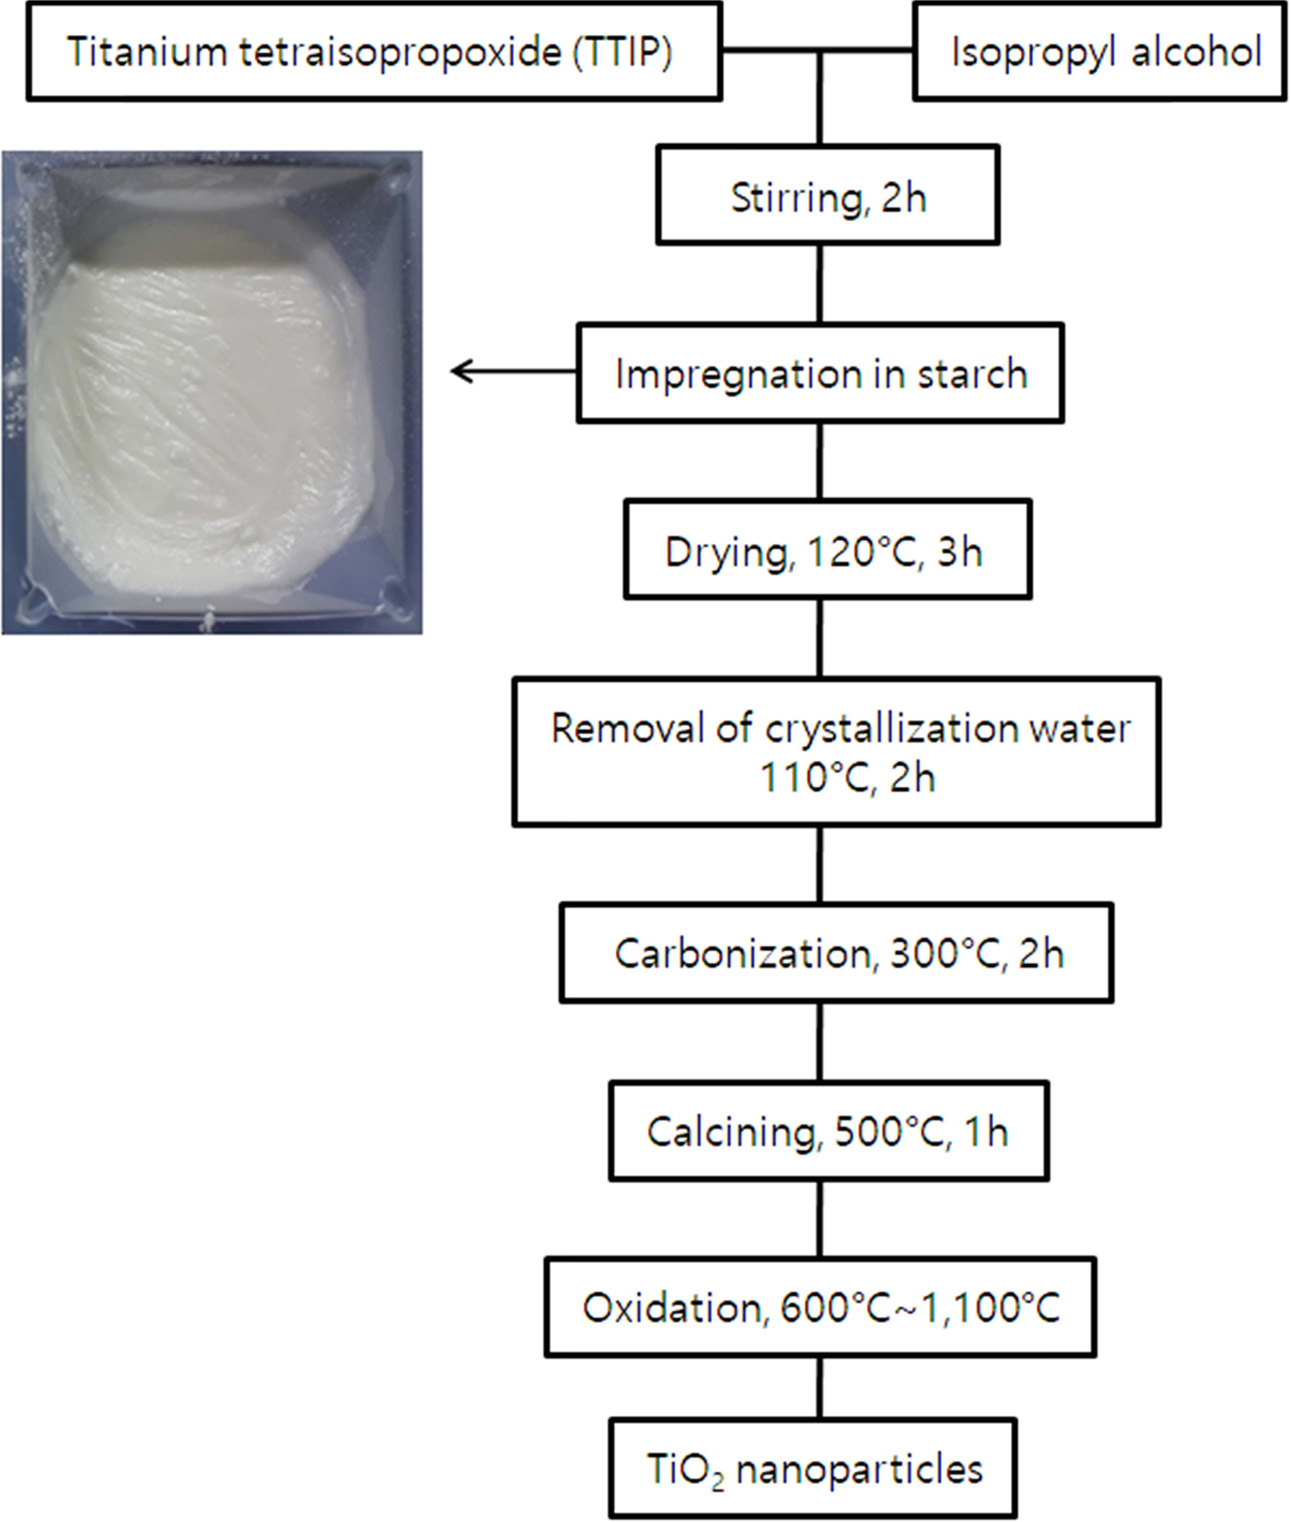
mL isopropanol under a vigorous stirring. Schematic
diagram of the TiO2 nanoparticles prepared by this method is shown
in Fig. 1. The starch and TTIP precursor solution were impregnated at a weight
ratio of 1:1. The impregnated precursor was dried at 120 oC for
3 hours. The dried precursor was calcined in
an electric furnace at 500 oC for 1 hour to remove the organic components in
the precursor and the starch. This calcined
sample was pulverized with agate and then calcined
in an electric furnace at a temperature range of 600 oC and 1,000 oC (heating
rate:5 oC/min) for
1 to 3 hours. The calcined samples were pulverized to obtain
final powdery TiO2. X-ray diffraction pattern was investigated by
DMAX-2200V/PC High power X-ray diffractometer of Rigaku. Cu-Kα with a Ni filter
was used to measure a scanning speed of 5o/min, an acceleration
voltage of 40 kV, and an acceleration current of 30 mA in a diffraction angle
(2θ) range of 10 to 80o. FE-SEM (Model S-4300, Hitachi, Acceleration
Voltage 17 kV) was used for surface structure analysis such as the particle
size of the prepared TiO2 powder.
|
Fig. 1 Preparation procedures of TiO2 nano powders. |
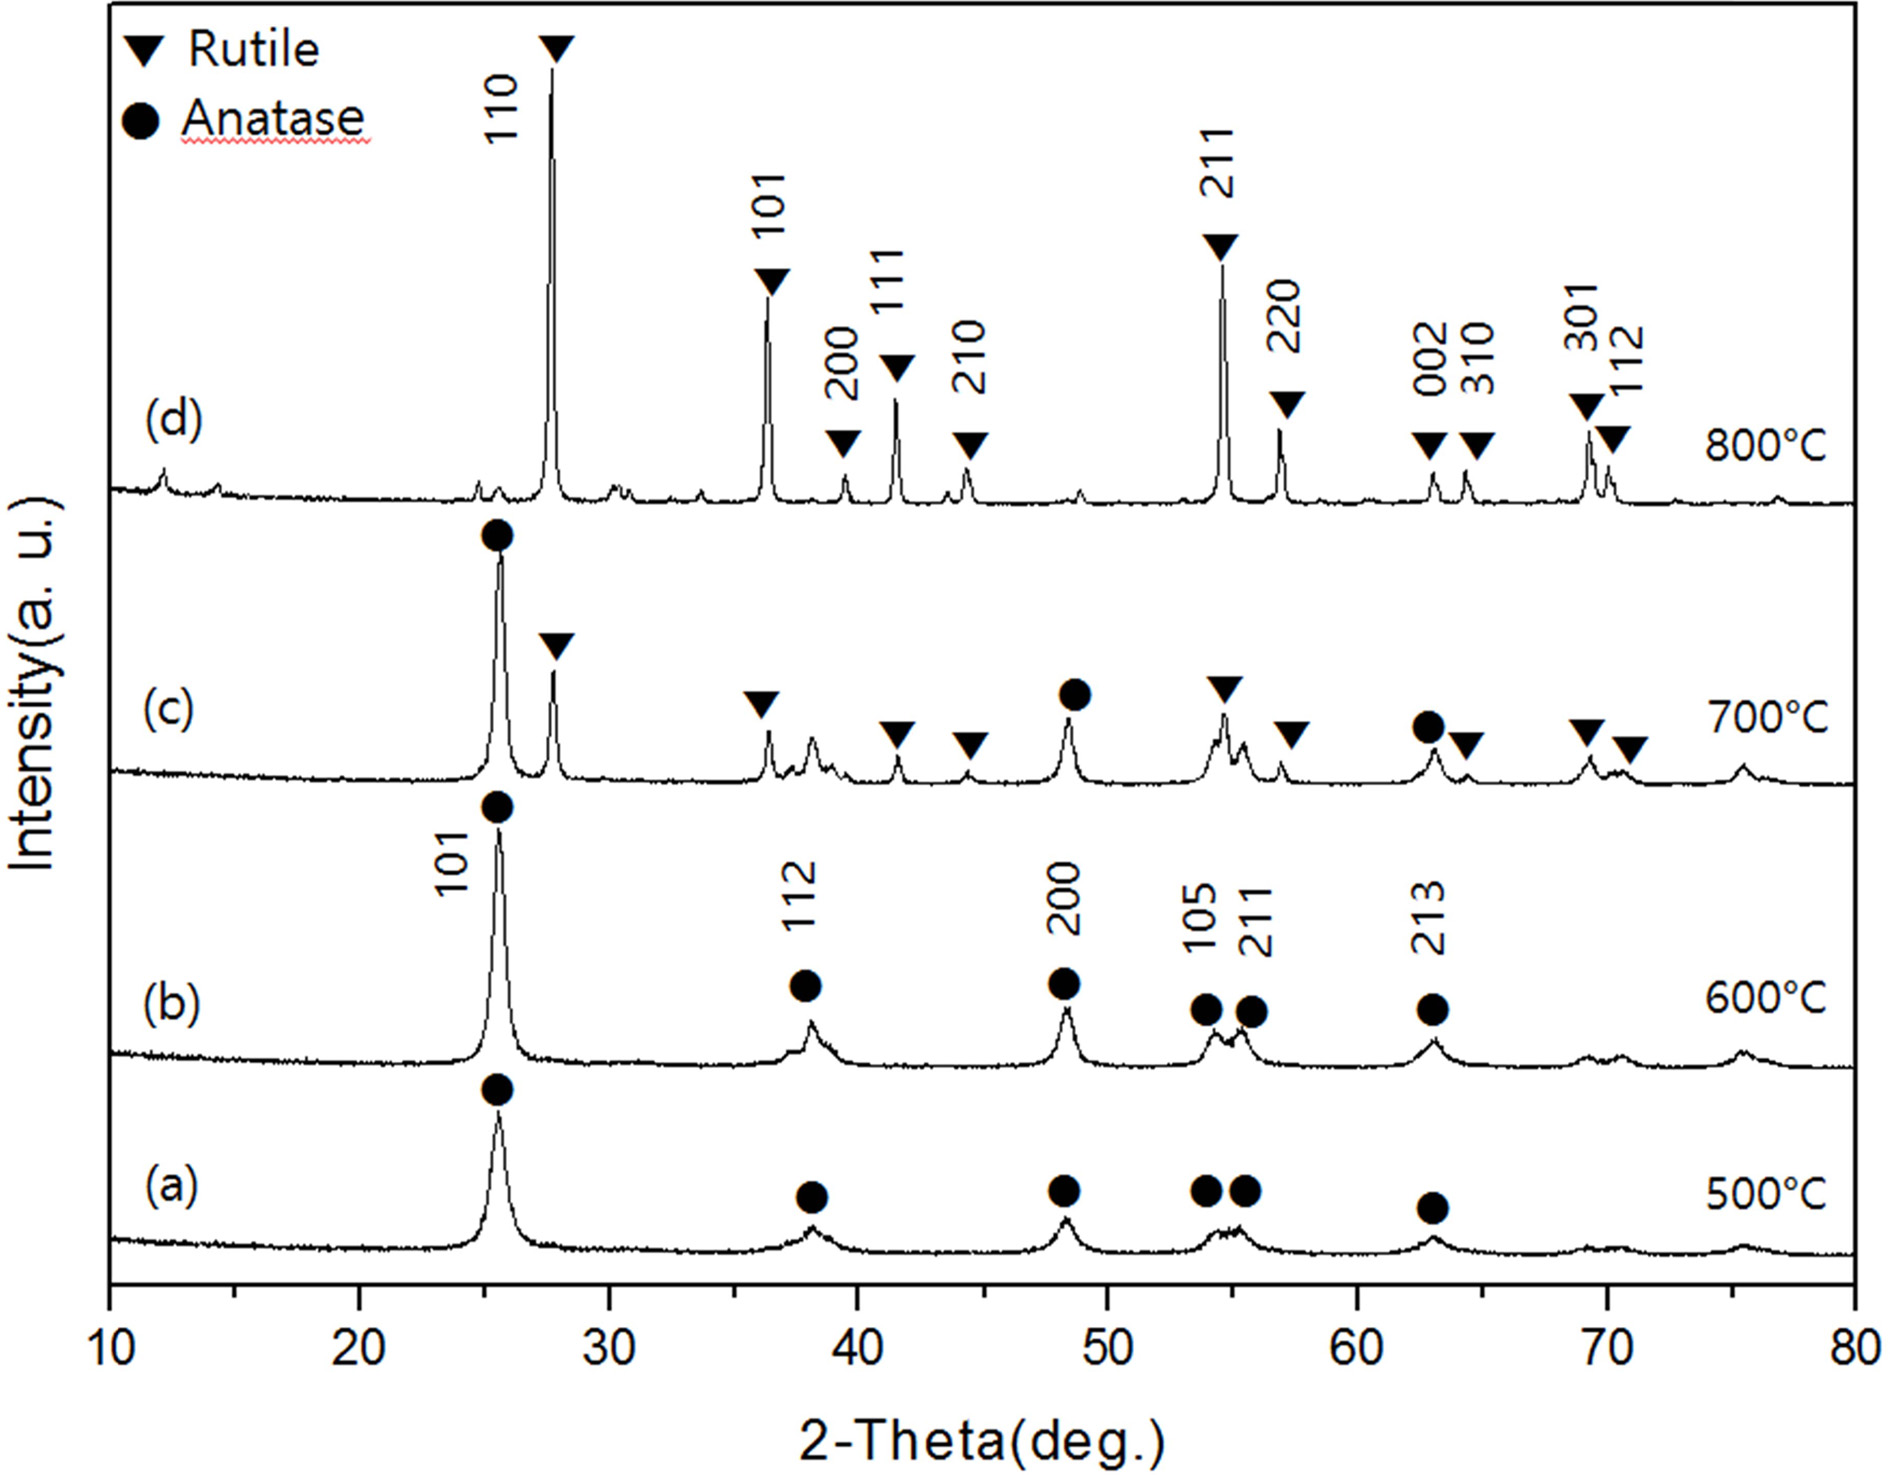
Fig. 2 shows the XRD diffraction pattern of TiO2
powder calcined at 500-800 oC for 1 hour, respectively. As shown
in Fig. 2(a) and (b), the XRD diffraction patterns of
powders prepared at 500 oC and 600 oC showed only
an anatase crystalline form. In these samples, diffraction peaks of the anatase
crystal form were found at the 2θ values of 25.3, 37.9, 48.1, 53.9, 55.0, 62.8,
68.9, 70.41 and 75.18, and the corresponding Miller indices were (101), (004),
(211), (204), (116), (220), and (215). When the calcination time was increased
from 1 hour to 3 hours in this temperature range, the size of the crystals
increased. However, the crystal phase did not change and only anatase phase
appeared. On the other hand, in the XRD diffraction pattern of the calcined
powder at 700 oC shown in Fig. 2(c), anatase phase and rutile
phase existed together. At this time, the intensity of the diffraction peak of
the anatase phase was lower than that of the calcined powder at 600 oC,
and the diffraction peak newly appeared at the 2θ value of 27.42(110),
36.11(101), 41.28(111) and 55.06(220) are due to the formation of the rutile
crystal form[13]. In the diffraction pattern of samples prepared at 800 oC
with increasing calcination temperature, only rutile phase, which is a
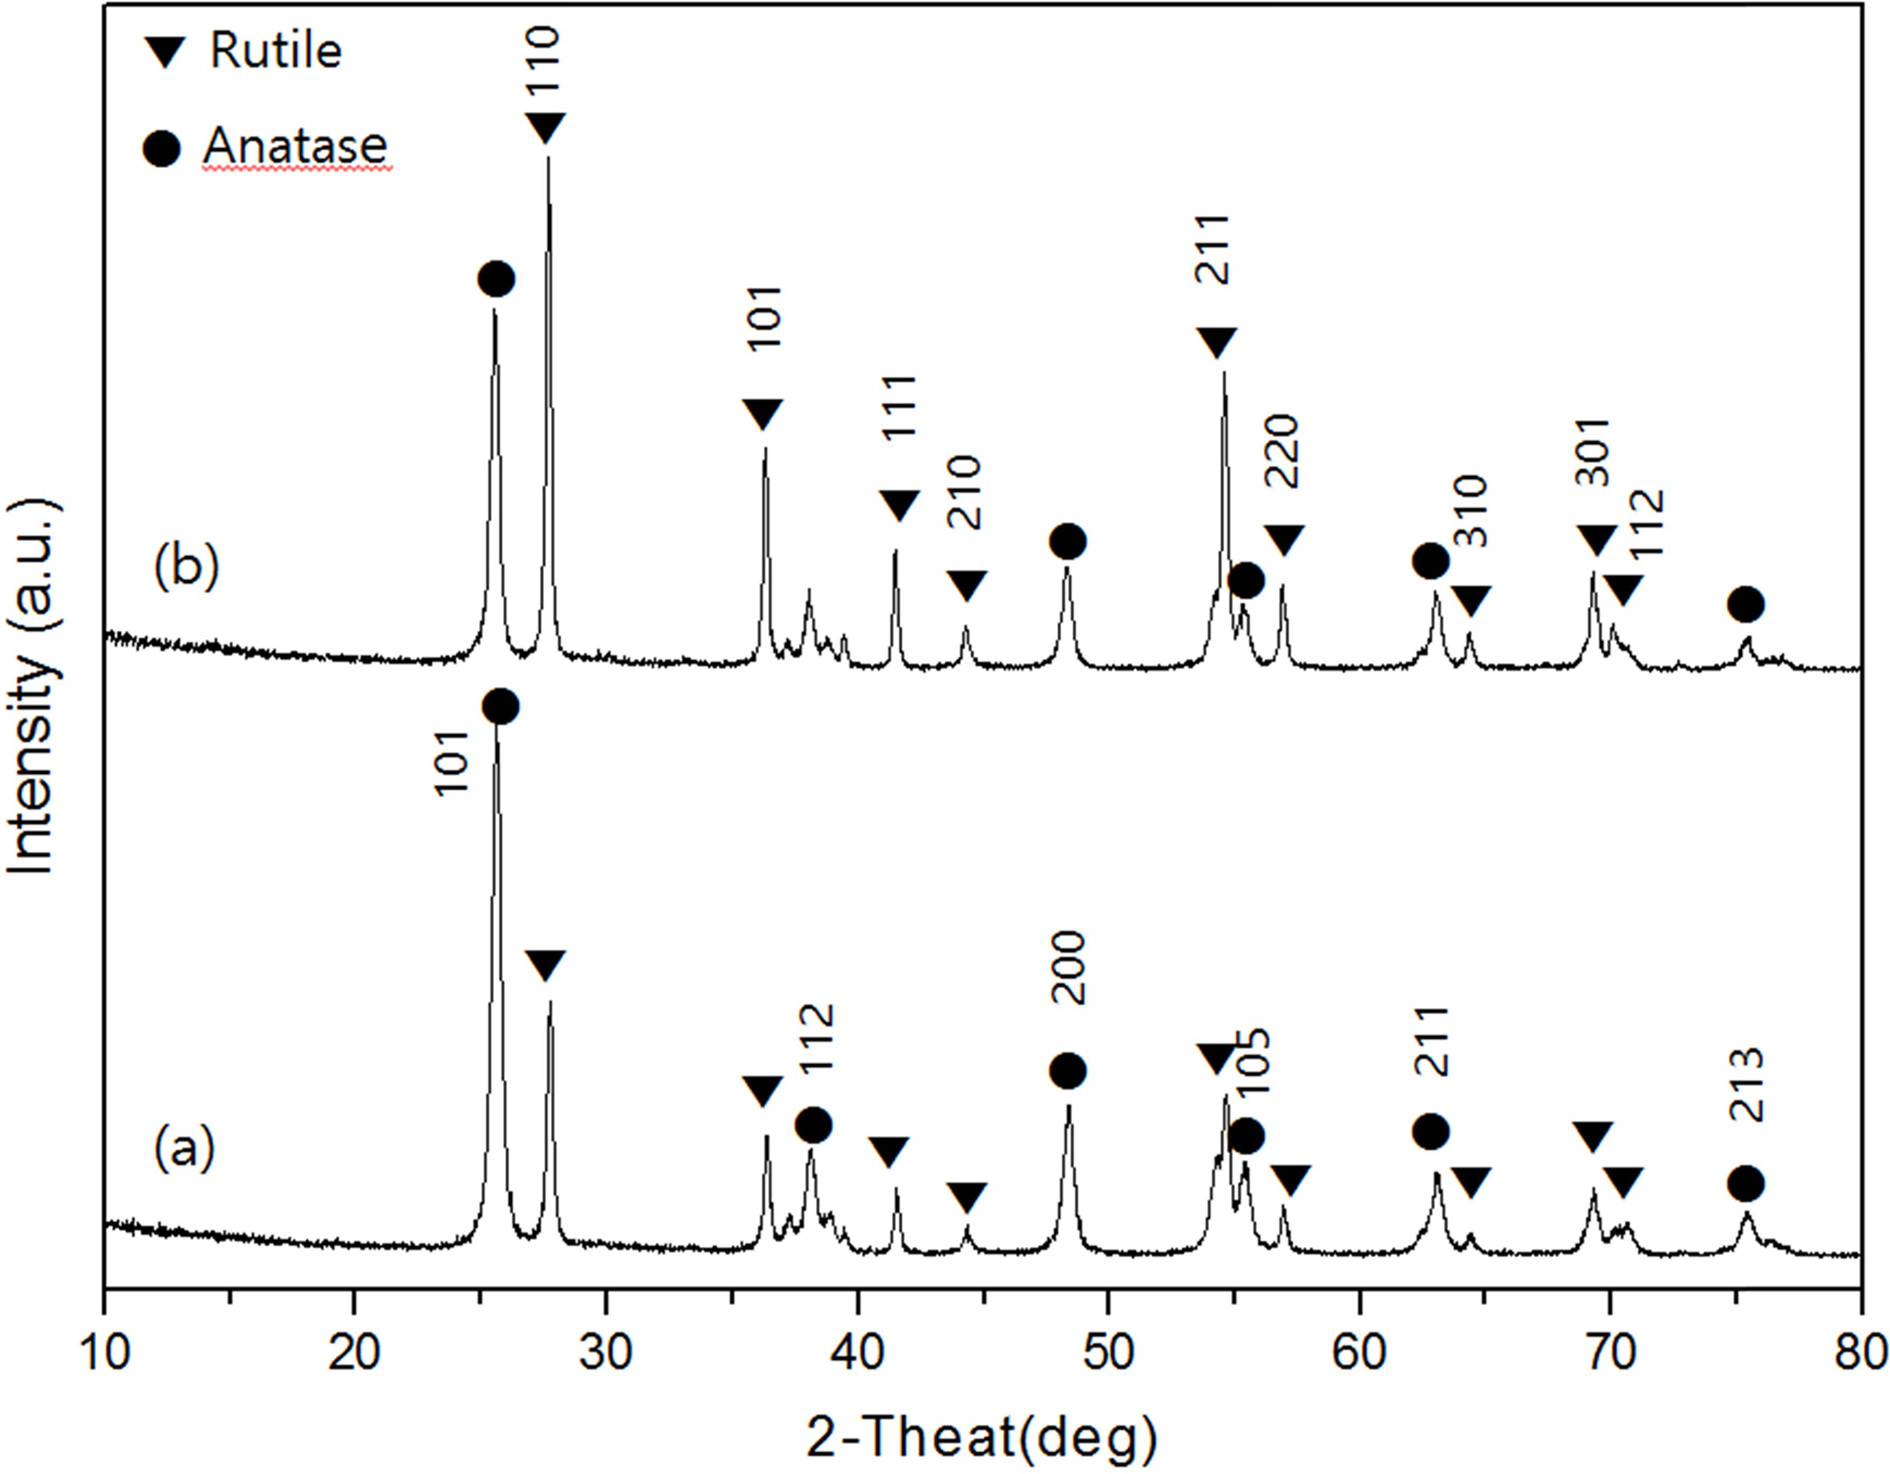
crystalline form at high temperature, appeared. Fig. 3 shows the XRD
diffraction pattern of the samples prepared by different calcination times of 1
hour and 3 hours at 700 oC. Both the anatase phase and the
rutile phase exist in Fig. 3(a) and (b). Therefore, it was found that there
existed two crystal phases regardless of increase of calcination time at
700 oC. The calcination time increased to 3 hours Fig. 3(b),
the diffraction intensity of the anatase peak is weakened. At 600 oC,
the change in the crystal phase, which did not occur even when the calcination
time was increased, appeared only at 700 oC.
As a result, the transition temperature of the crystal phase was 700 oC.
Therefore, it can be seen that the calcination temperature has a greater
influence on the crystal phase transition than the calcination time. On the
other hand, in Fig. 3(b) where the calcination time was increased
to 3 hours, the peak of the atanase crystal phase
exhibited lower strength than that of Fig.3 (a) when the
calcination time was 1 hour. This suggests that the
calcination time has some influence on the transition phase. As a
result, it was confirmed that the anatase crystal phase was obtained at a
synthesis temperature of 600 oC or lower, and the rutile phase
was formed at a synthesis temperature of 700 oC or higher. The
reason why the crystal phase differs according to the synthesis temperature
is that the surface energy changes depending on the
particle size. Since the surface energy of anatase phase particles is less than
the surface energy of rutile particles, they are synthesized at
lower temperatures. In our earlier work, when pulp was used as the impregnation
matrix, anatase phase and rutile phase appeared at a calcination
temperature of 600 oC. There was a difference
in the crystalline phase as the impregnated matrix changed from pulp to starch.
That is, when a pulp was used, a rutile phase was obtained at a temperature
lower by 100 oC. This is because micro-morphology of pulp and
starch are different. Starch produces more heat energy than pulp when burned.
Thus, when starch is used as a matrix, more heat energy is transferred to the
precursor TTIP. It is believed that TTIP is decomposed at
a lower temperature, and TiO2 has a lower production temperature.
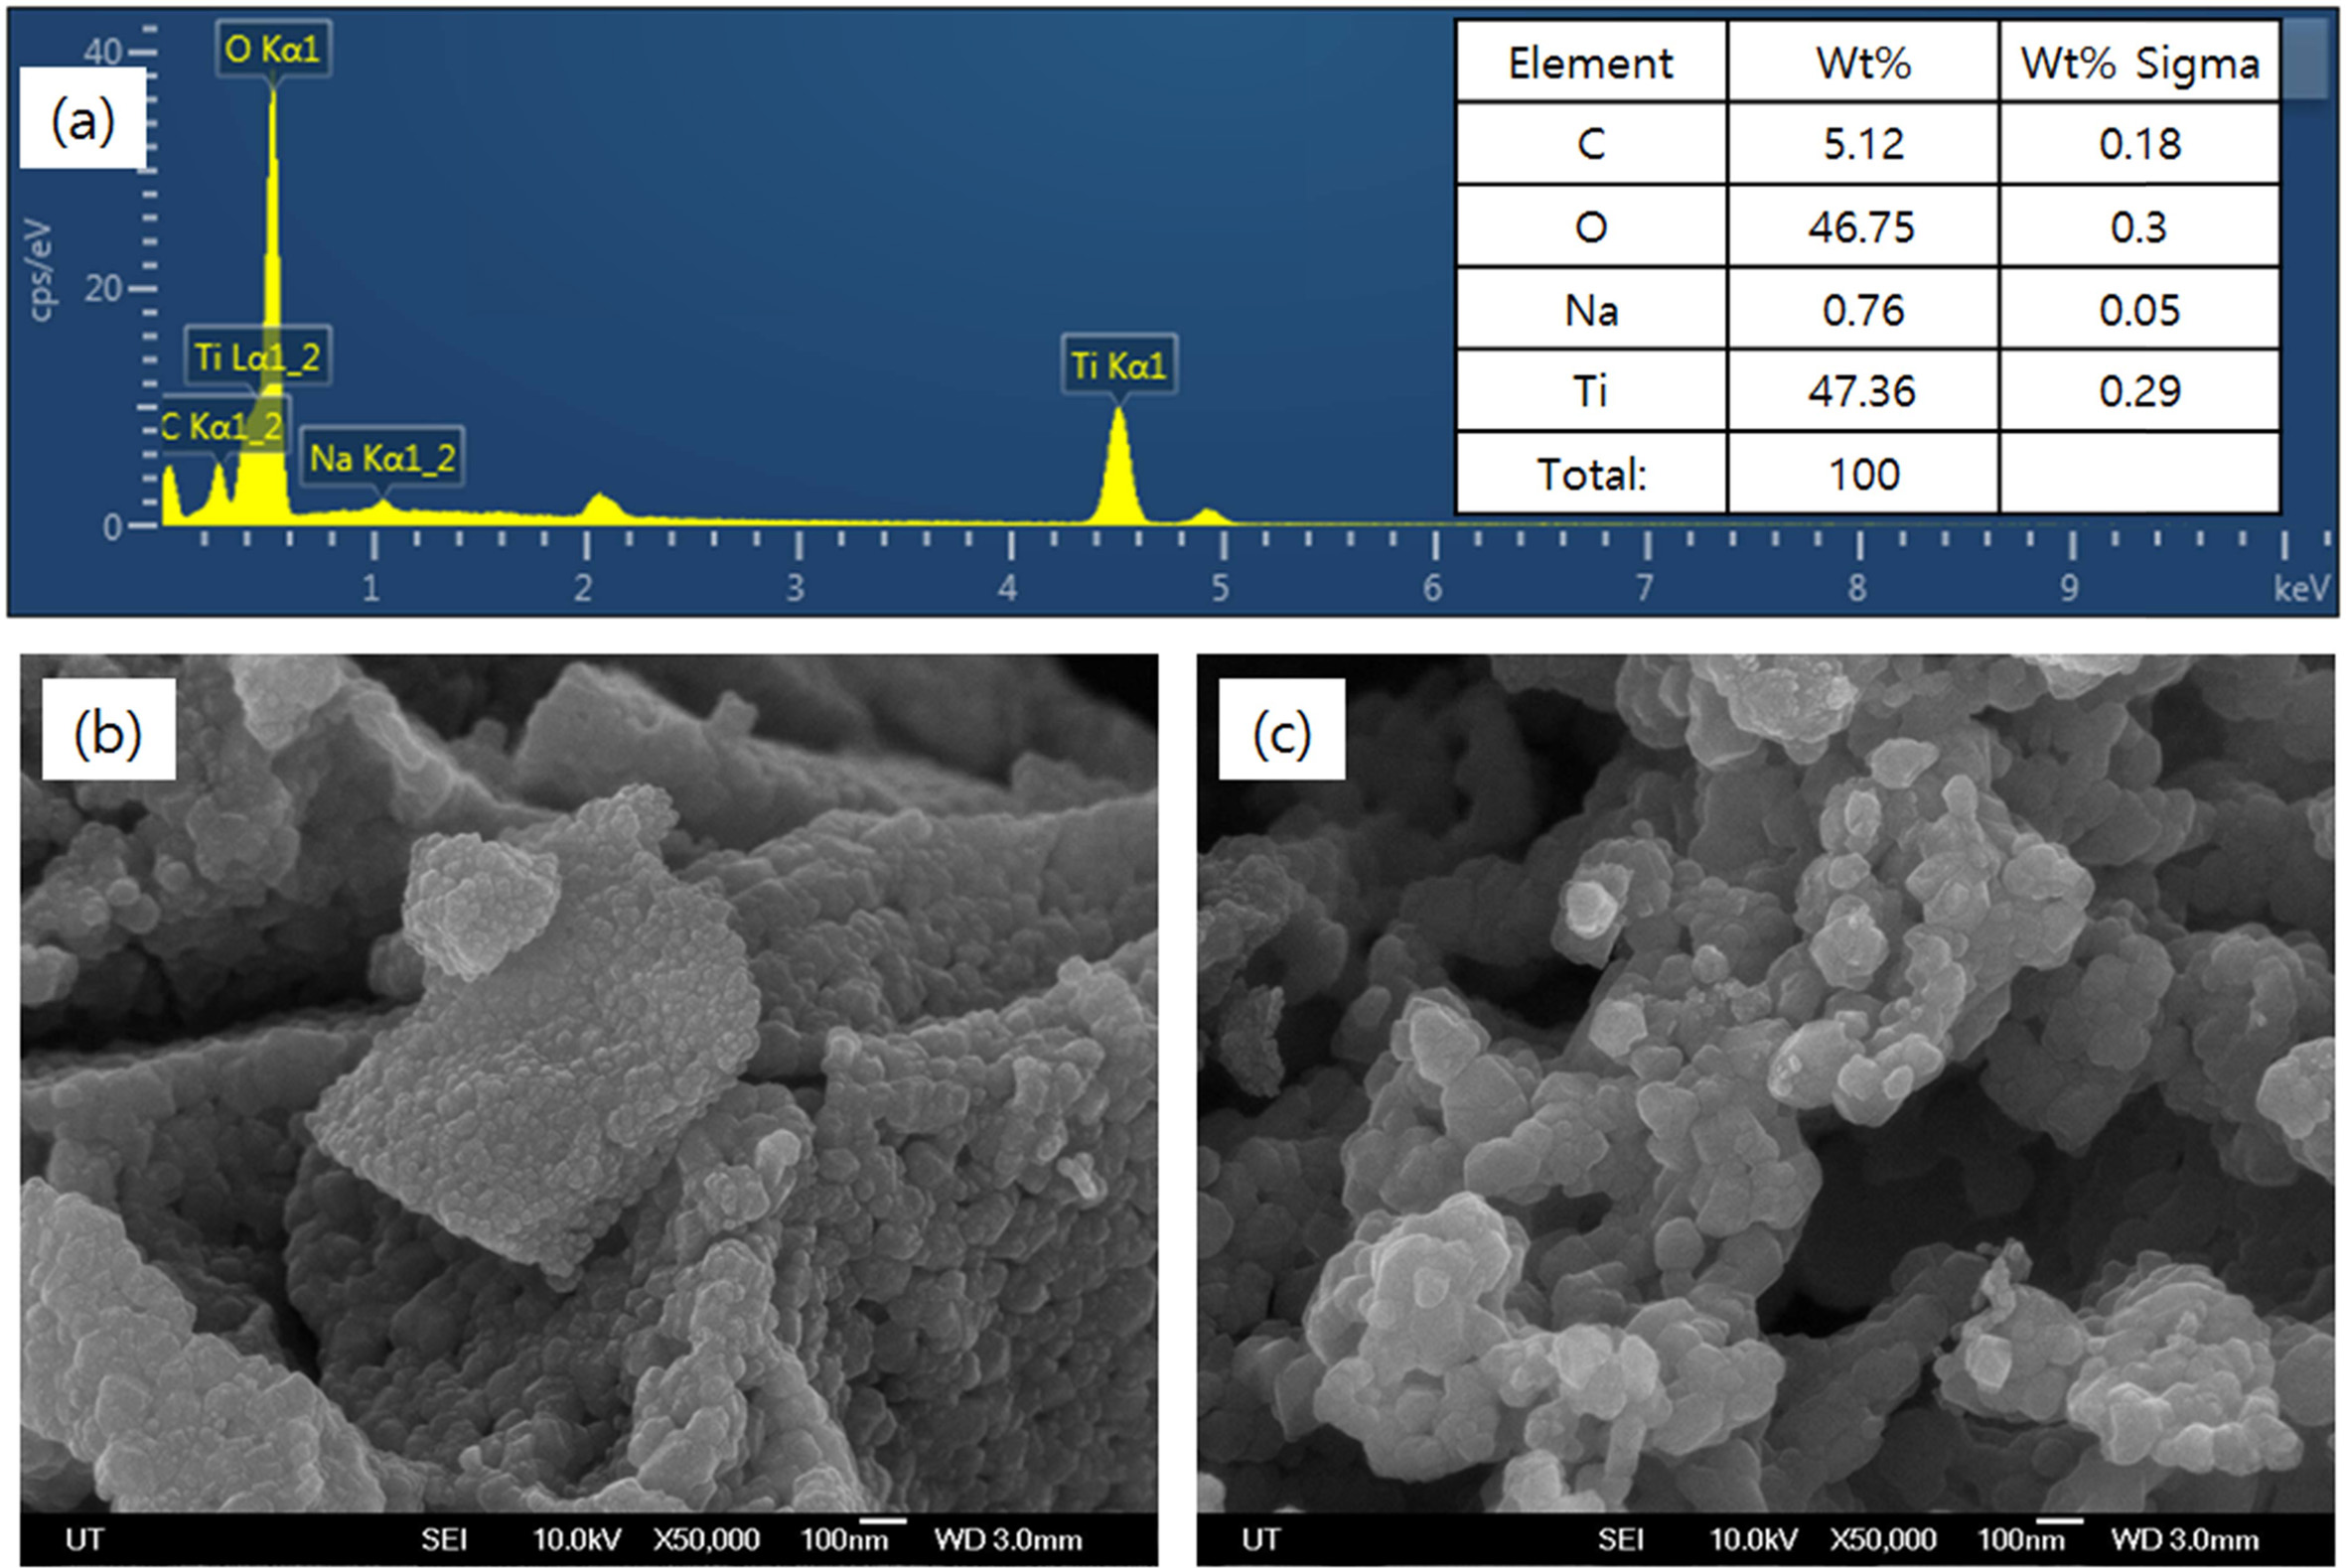
Fig. 4(a) shows the EDX spectra of samples calcined at
800 oC for 1 hour. The elemental peaks corresponding to
titanium and oxygen were found, and the distribution of these two elements was
found to be in the form of TiO2 by calculating the stoichiometry
ratio. Fig. 4(b) and (c) shows SEM photographs of samples calcined at 700 oC
for 1 hour and 3 hours, respectively. As can be seen in the figure, crystals
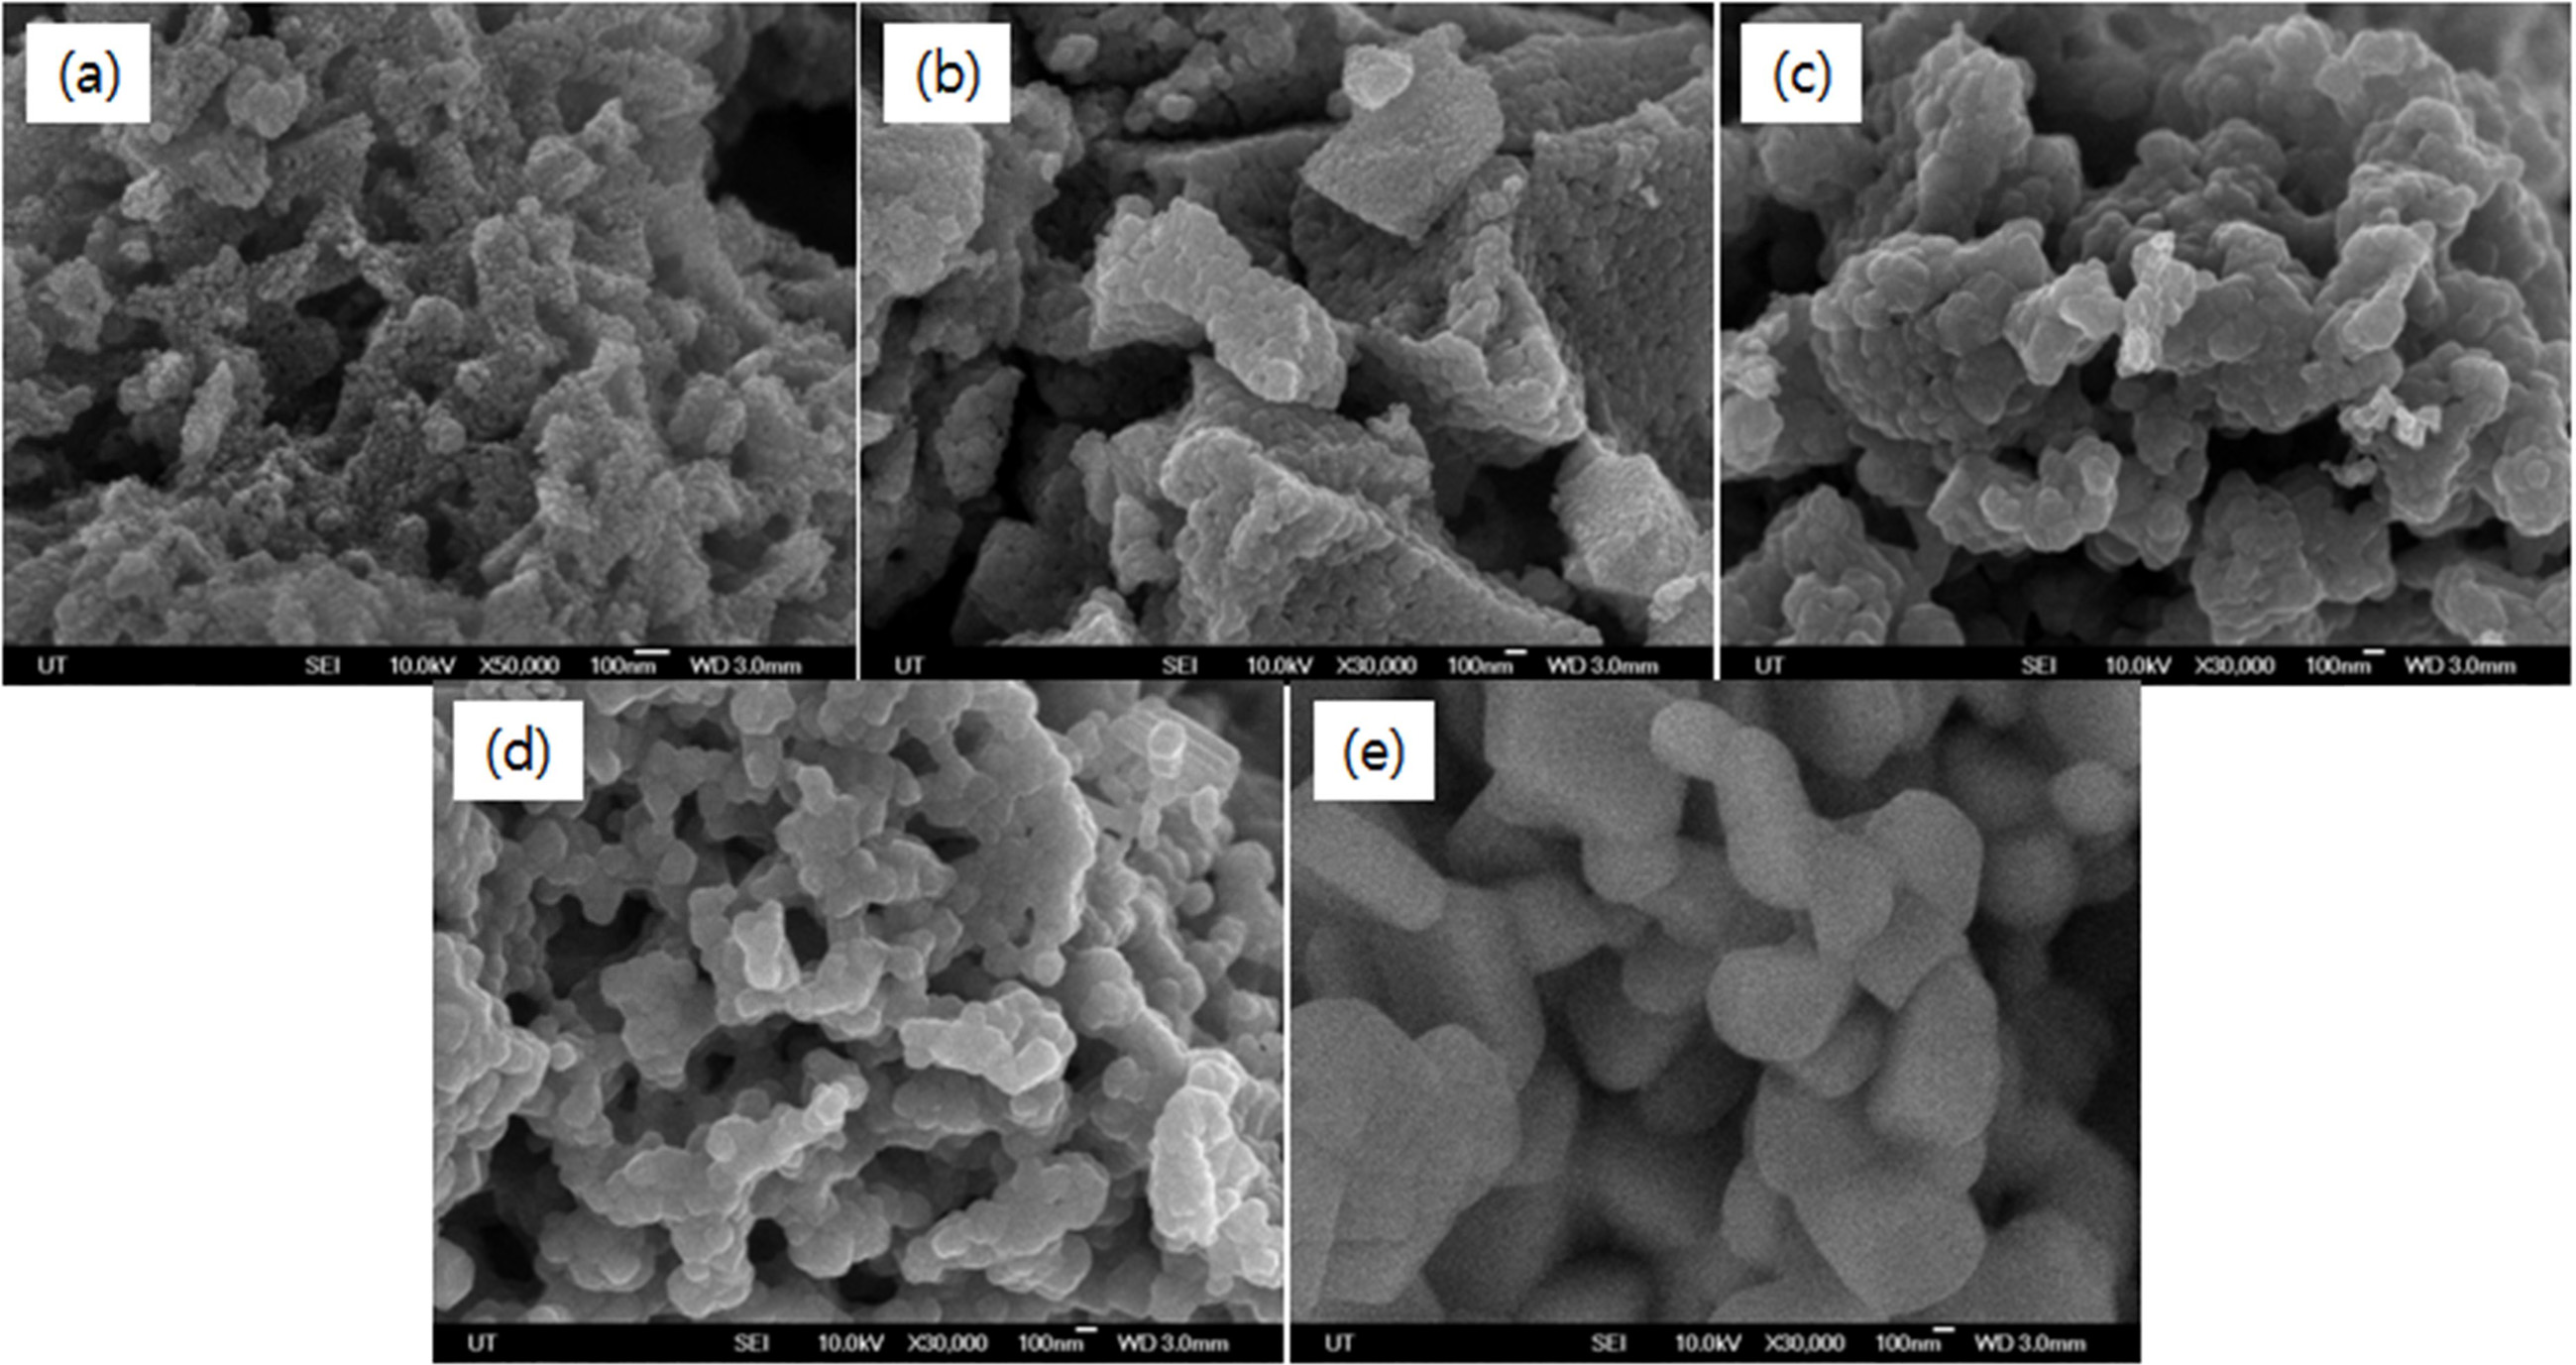
grow as the calcination time increases. Fig. 5 shows the results of FE-SEM
measurement of the morphology of synthesized TiO2 particles when the
calcination time was fixed to 1 hour and the calcination temperature was
changed from 600 oC to 1,100 oC. The samples
calcined at 600 oC showed very small particle size (≤50 nm).
Since the anatase phase is more stable than the rutile phase as the particle
size is smaller, crystals of the anatase phase are formed only at a low
calcination temperature of 600 oC or lower (Fig. 2 (a)). In the
samples calcined at 700 oC, grain growth (≤100 nm) began to be
observed with increasing crystallinity. In the samples
calcined at 800 oC, the shape
and size of the particles grew to more than 100 nm, and
crystallization progressed over a wide range and uniform particle size
distribution began to appear. At the calcination temperature of 900 oC
to 1,100 oC, the growth of the particles is promoted, and the
phenomenon of crystal growth (≥100 nm) is observed. The crystallization of the
particles was promoted at 1,100 oC, and the rutile-phase TiO2
crystal was clearly identified.
|
Fig. 2 XRD patterns of TiO2 powders in various calcination temperatures for 1 hr. |
|
Fig. 3 XRD patterns of TiO2 powders at 700 oC at various calcination time (a) 1 hr and (b) 3 hr. |
|
Fig. 4 EDX and FE-SEM images of TiO2 powders in various calcination conditions: (a) 800 oC, 1 hr, (b) 700 oC, 1 hr, and (c) 700 oC, 3 hrs. |
|
Fig. 5 FE-SEM images of TiO2 powders at various calcination temperatures for 1 hr: (a) 600 oC, (b) 700 oC and (c) 800 oC, (d) 900 oC and (e) 1,100 oC. |
TiO2 nanoparticles were synthesized under
various conditions by impregnation method. TTIP was used as the precursor and
starch as the impregnations matrix. As a result of XRD analysis, only anatase
phase was formed when calcined at 500-600 oC. At 700 oC,
the anatase phase and the rutile phase existed together. At 800 oC
and above, only the rutile phase existed. TiO2 with a size of 100 nm
or less were obtained when calcined for 1hour at 700 oC. As a
result of firing at 600-800 oC for 1-3 hours with different
calcination conditions, crystallization was promoted and grain size was
increased with increasing calcination temperature and time.
- 1. Y. Xu and M.A. Schoonen, Am. Miner. 85 (2000) 543-556.
-

- 2. J. Zou and W. Zheng, Ceram. Int. 42 (2016) 8198-8205.
-

- 3. C. Tiana, Mat. Res. Bul. 103 (2018) 83-88.
- 4. Y.-S. Song, S. Son, D.-Y. Lee, M.-H. Lee, and B.-Y. Kim, J. Cer. Proc. Rea. 17[11] (2016) 1197-1201.
- 5. H.-S. Lee, S.-M. Koo, and J.-W. Yoo, J. Cer. Proc. Rea. 13[S2] (2012) s300-s303.
- 6. J. Liu and W.X. Wang, Sci. Tot. Envir. 593-594 (2017) 47-53.
-

- 7. J.J. Reinosa, C.M.Á. Docio, V.Z. Ramírez, and J.F.F. Lozano, Ceram. Int. 44 (2018) 2827-2834.
-

- 8. V. Likodimos, Appl. Catal. B: Envir. 230 (2018) 269-303.
-

- 9. M. Qamar, B. Zhang, and Y. Feng, Opt. Mat. 89 (2019) 368-374.
-

- 10. J.C.C. Franco and M.Á. Láinez, Mat. Sci. Semicon. Proc. 90 (2019) 190-197.
-

- 11. N.D. Chinh, C.-J. Kim, and D.J. Kim, J. All. and Comp. 778 (2019) 247-255.
-

- 12. K.-W. Kim, S.-H. You, S.-S. Park, G.-H. Kang, W.-T. Bae, and D.-W. Shin, J. Cer. Proc. Rea. 9[5] (2008) 530-537.
- 13. S.-J. Kim, C.H. Han, and J.H. Shim, J. Kor. Cer. Soc. 50[6] (2013) 489-494.
-

- 14. S.-J. Kim and C.-H. Han, J. Cer. Proc. Rea. 19[2] (2018) 130-133.
- 15. S.-J. Kim, T. Masaki, S.-H. Choi, and D.-H. Yoon, J. Cer. Proc. Rea. 17[4] (2016) 338-343.
- 16. N.M. Deraz, J. Ind. Environ. Chem. 2[1] (2018) 19-21.
- 17. C. Tian, Mat. Res. Bul. 103 (2018) 83-88.
-

 This Article
-
2019; 20(6): 665-669
Published on Dec 31, 2019
- 10.36410/jcpr.2019.20.6.665
- Received on Jun 24, 2019
- Revised on Sep 17, 2019
- Accepted on Sep 26, 2019
 Services
Shared
 Correspondence to
- Soo-Jong Kim
-
Department of Advanced Materials & Chemical Engineering, Halla University, 28 Halladaegil, Wonju, Kangwon 26404, Korea
Tel : +82-33-760-1237 Fax: +82-33-760-1290 - E-mail: sjkim@halla.ac.kr


 Copyright 2019 International Orgranization for Ceramic Processing. All rights reserved.