


- Effects of water-to-cement ratio, curing method and fiber on the autogenous shrinkage of early-age concrete
Weilun Wang*, Junting Li and Wenjun Peng
Guangdong Provincial Key Laboratory of Durability for Marine Civil Engineering; College of Civil Engineering, Shenzhen University, Shenzhen, P.R. China
This study used a temperature stress test machine (TSTM) to study the effects of the water-to-cement (w/c) ratio, curing method and the content of polyvinyl alcohol (PVA) fiber on the autogenous shrinkage of high-performance concrete (HPC). The experimental values were compared with theoretical values obtained from four sets of autogenous shrinkage models to compare model accuracy. The study results indicated the followings: (1) the autogenous shrinkage value of concrete increased with decreases in the w/c ratio. (2) The natural and semi-adiabatic curing conditions caused the specimens to form a low- and a high-temperature rise, respectively. The higher the temperature rise, the larger the stable value of the autogenous shrinkage. (3) Among the CEB-FIP, EN-1992, RILEM and Tazawa models, the Tazawa model demonstrated the highest degree of accuracy. (4) PVA fiber contents of 0.75% and 0.25% had the most significant and minimal autogenous shrinkages, respectively.
Keywords: Autogenous shrinkage, Early age, Curing method, Fiber, Temperature stress test machine
Over the past decade, high-performance concrete (HPC) has been widely used. HPC has the characteristics of a low water-to-cement (w/c) ratio, high strength and low permeability [1, 2]. However, the low w/c ratio also presents certain other problems, such as high self-desiccation [3] and high-temperature rise [4]. Self-desiccation produces significant autogenous shrinkage [5], and if HPC is constrained, it can result in high restraint stresses, which increase the risk of cracking [6]. Therefore, it is necessary to study the autogenous shrinkage of HPC to more accurately assess the crack resistance of HPC.
Autogenous shrinkage is one of the primary aspects of early concrete deformation. This shrinkage not caused by the variation of material, temperature changes, and the impact of external forces and constraints [5], and represent the macroscopic volume change of cement-based materials [7]. Many studies have investigated the mechanism and development of autogenous shrinkage and proposed some semi-empirical formulas. CEB-FIP [8], EN-1992 [9] and RILEM [10] models are convenient for some engineers to select and establish an autogenous shrinkage model related to compressive strength during the design phase. The Tazawa [11] model, which was proposed by the JCI Technical Committee of Japan, mainly to reflect the influence of cementitious materials and the water-binder ratio on the development of autogenous concrete shrinkage. Using the Tazawa model, Lee [12] changed the ultimate autogenous shrinkage to the 28-day autogenous shrinkage value, and used the ultrasonic pulse velocity method to examine the onset of autogenous shrinkage to determine the relationship between autogenous shrinkage and time. Jonasson [13] used the relationship between hydration reaction and autogenous shrinkage proposed by Hedlund [14] to derive an autogenous shrinkage model. However, several factors affect autogenous shrinkage, such as w/c ratio, temperature, admixture, etc [5, 15]. In addition, when the autogenous shrinkage model is derived, the experimental conditions and influencing factors are different, making it difficult to explain which group of models is more accurate and suitable for predicting the development of autogenous shrinkage. Thus, verifying the accuracy of the autogenous shrinking model has an important positive impact on the selection of the autogenous shrinking model.
The temperature of the external environment changes rapidly, and the impact it has on concrete can be complicated. Together with the hydration heat release of the concrete itself [16], the temperature change in concrete can become more complex. Adiabatic curing can significantly reduce the influence of external temperature, making it possible to consider only the temperature increase from the hydration reaction in the concrete itself. Moreover, the concrete behaviour inside the concrete mass is close to the adiabatic state, and there is no heat loss into the surrounding environment [17, 18]. Therefore, adiabatic curing could be used to study the autogenous shrinkage of HPC.
Autogenous shrinkage is not conducive to the development of early concrete. Many studies have also examined measures to reduce the development of autogenous shrinkage [2, 5, 11, 12]. Fly ash has been shown to reduce the development of autogenous shrinkage. Because the fineness of blast furnace slag is higher than that of cement, it will also accelerate autogenous shrinkage [5]. The shrinkage-reducing agent and expansion additive have a positive effect on reducing autogenous shrinkage [15]. Because of their internal curing, prewetted lightweight aggregates and super absorbent polymers can increase the relative humidity inside the concrete and thus reduce autogenous shrinkage [19, 20]. Wu et al. [5] indicated that fiber is also a factor affecting the development of autogenous shrinkage. There are several types of fibers, and the amount added has different effects on autogenous shrinkage. However, further research with respect to fiber effects is needed.
In this study, the autogenous shrinkage development of concrete under different w/c ratios and different curing conditions were evaluated. The experimental values and theoretical values were used to verify the accuracy of the four groups of autogenous shrinkage models. In addition, the effects of different amounts of PVA fiber content were considered based on concrete-free deformation tests.
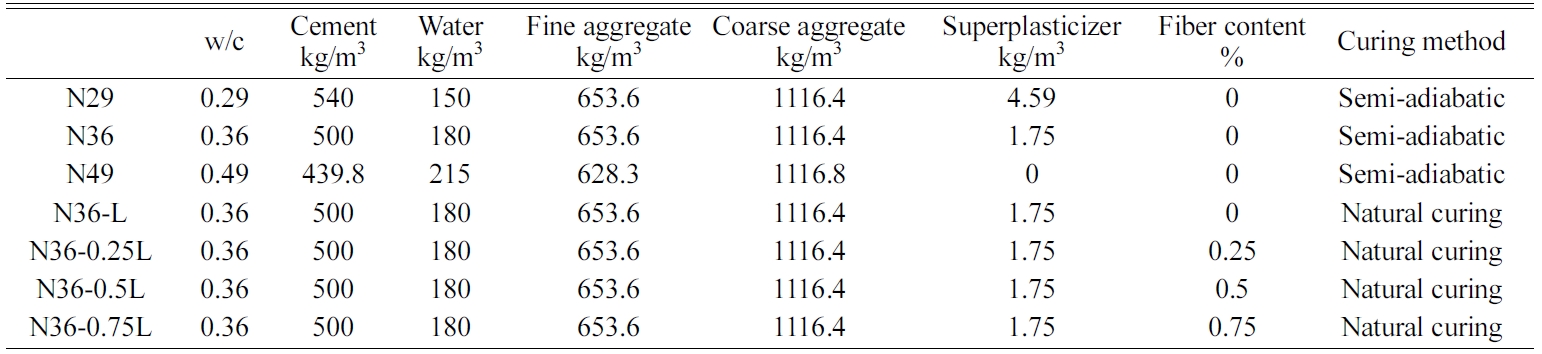
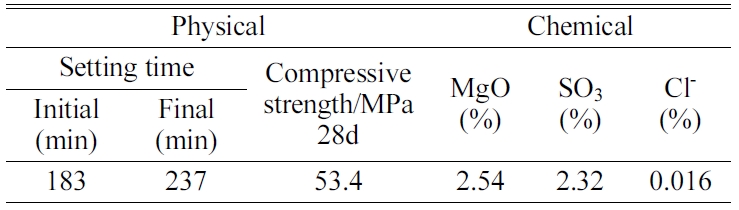
There are mixture proportions of the concrete for this test in Table 1. The Ordinary Portland cement (PO42.5) and its composition and performance parameters were in line with national standards, as shown in Table 2. The ordinary medium sand, the fineness modulus is 2.4. The coarse aggregate is basalt with a maximum particle size of 15 mm and a stacking density of 2800 kg/m3. Polycarboxylate superplasticizer is used to improve the working performance of the concrete. The mixed water is tap water.
In the process of concrete preparation, the materials were added in the order of coarse aggregate, fine aggregate and cement, and then stirred for 3 min. After the materials were evenly stirred, the tap water and water-reducing agent were slowly added, and finally stirred for 3 min.
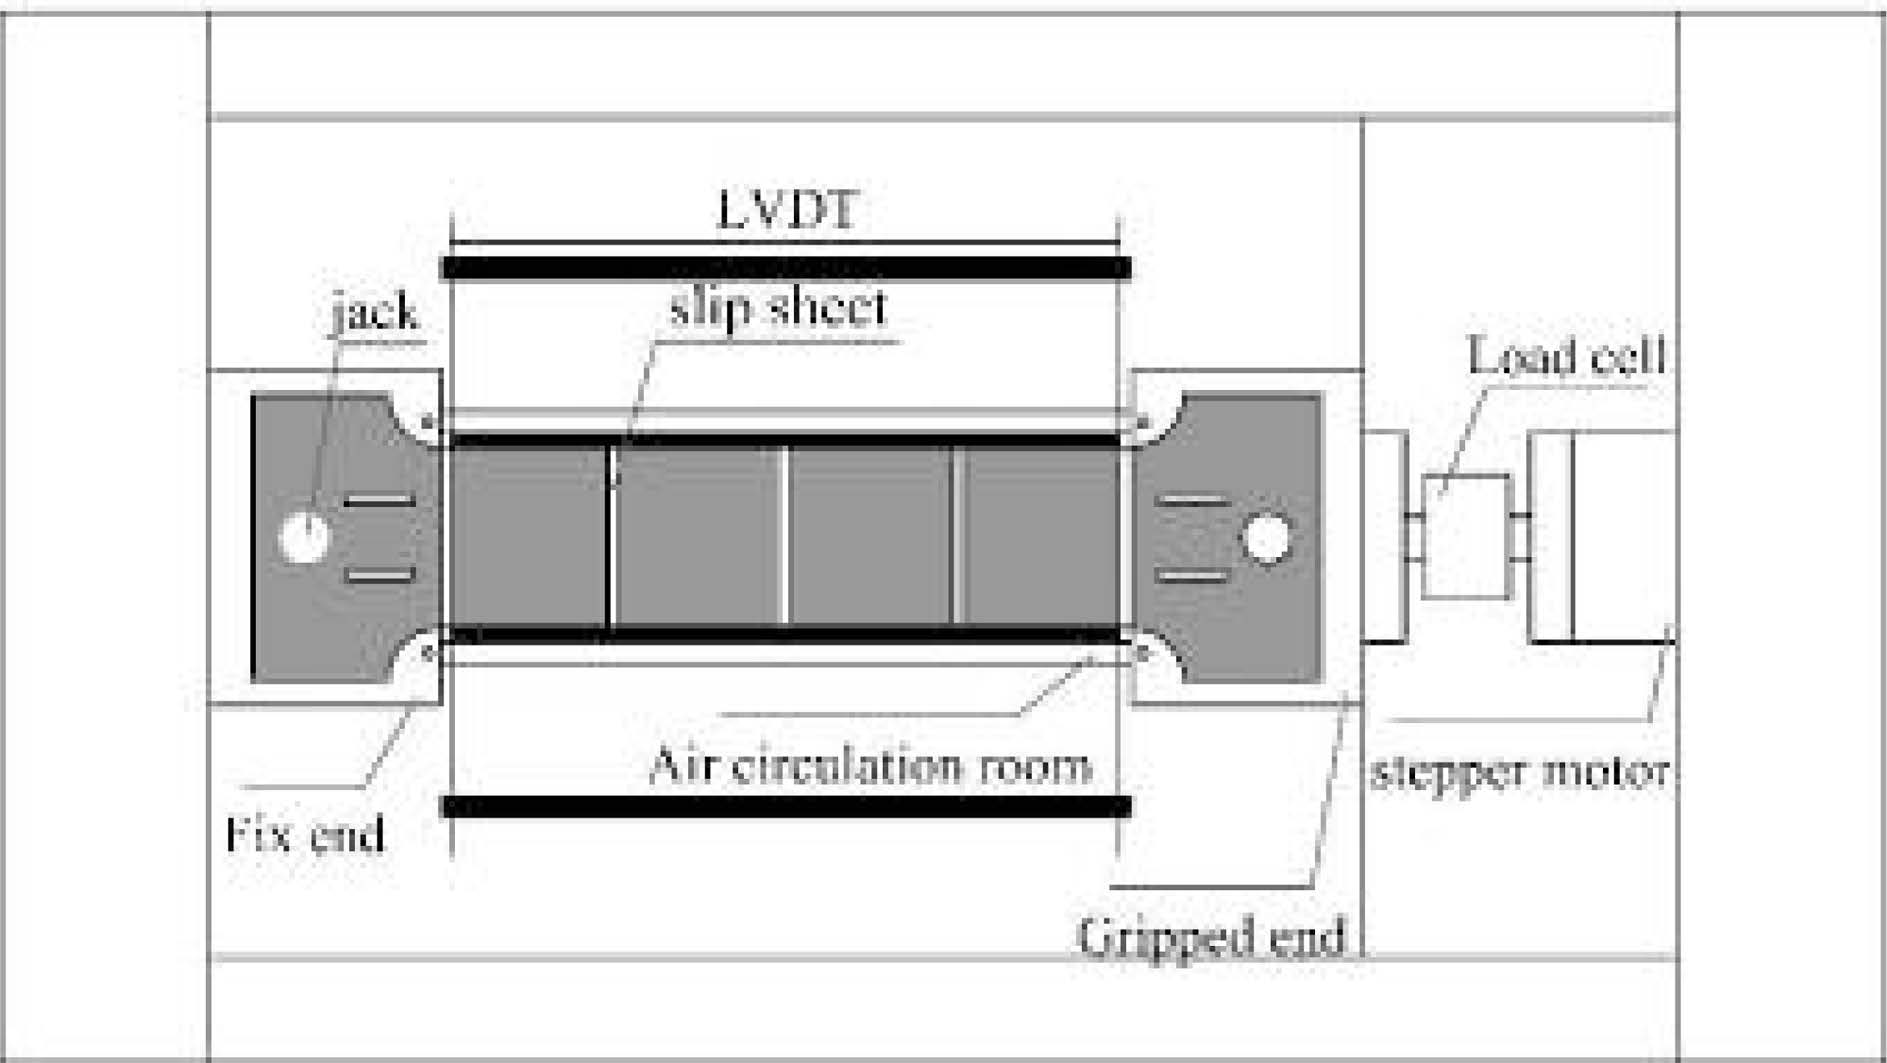
The free deformation test of the sealed test piece was carried out using TSTM. The TSTM was proposed by Springenschmid [21], and Kovler [22, 23] proposed a uniaxial shrinkage constraint test equipment. The equipment used in this test is shown in Fig. 1.
In the free deformation test, after the specimen was cast, one temperature sensor was placed in the middle and the other sensor was placed at the end of the specimen for monitoring the temperature. To ensure that the temperature of each part of the specimen was the same, the equipment had a separate air-controlled temperature control device. To ensure that the specimen was in a semi-adiabatic state, the temperature was controlled between -15 ℃ and 100 ℃ by circulating hot air in the experimental chamber and reducing the heat loss as much as possible.
The size of the device is 120 x 120 x 1540 mm, and the length of the middle part of the device is 1200 mm. The test piece is cast in the mould, one end is a fixed chuck, one end is a gripped chuck, and the whole device is controlled by a computer. In the free deformation mode, to ensure that the axial stress of the test piece is maintained within 0.01 MPa. During the early expansion or contraction of the concrete, when the test piece stress reaches the critical value of 0.01 MPa, the stepper motor will start and will force the action. The chuck moves to restore the stress to a zero stress level.
During the test, two layers of plastic film were placed in the test mould to reduce the friction between the test mould and the specimen [24]. The surface was sealed with a plastic film, and the test piece was wrapped with a pre-laid two-layer plastic film and sealed with tape to prevent evaporation of water and minimise the effects of dry deformation on the test.
|
Fig. 1 Temperature Stress Test Machine used in the experiment: schematic description. |
The concrete can be measured for its total deformation under free deformation. The total deformation of the early age concrete includes autogenous shrinkage and temperature deformation because the effect of drying shrinkage was virtually eliminated. Therefore, to investigate the effect of the w/c ratio on autogenous shrinkage, temperature deformation and autogenous shrinkage must be separated from the total deformation. The temperature deformation of concrete can be obtained by the coefficient of thermal expansion (CTE). The CTE was calculated using Eq. (1) [25].
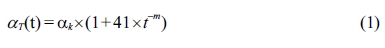
where αT(t) is the CTE of concrete as a function of t from time zero, in με/℃; αk is the CTE of concrete at 28 d, in με/℃; t is the age of concrete, in h; m is the coefficient, for ordinary concrete and silica fume concrete (doped less than 10%), m = 2.0, fly ash concrete (fly ash concrete content is greater than 15%), m = 1.5.
Therefore autogenous shrinking can be obtained by Eq. (2).
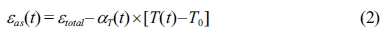
Where εas(t) is the calculated autogenous shrinkage of concrete at time t, in με; εtotal is the total deformation, in με; T(t) is the temperature of concrete, in ℃; T0 is the temperature of concrete at time 0, in ℃.
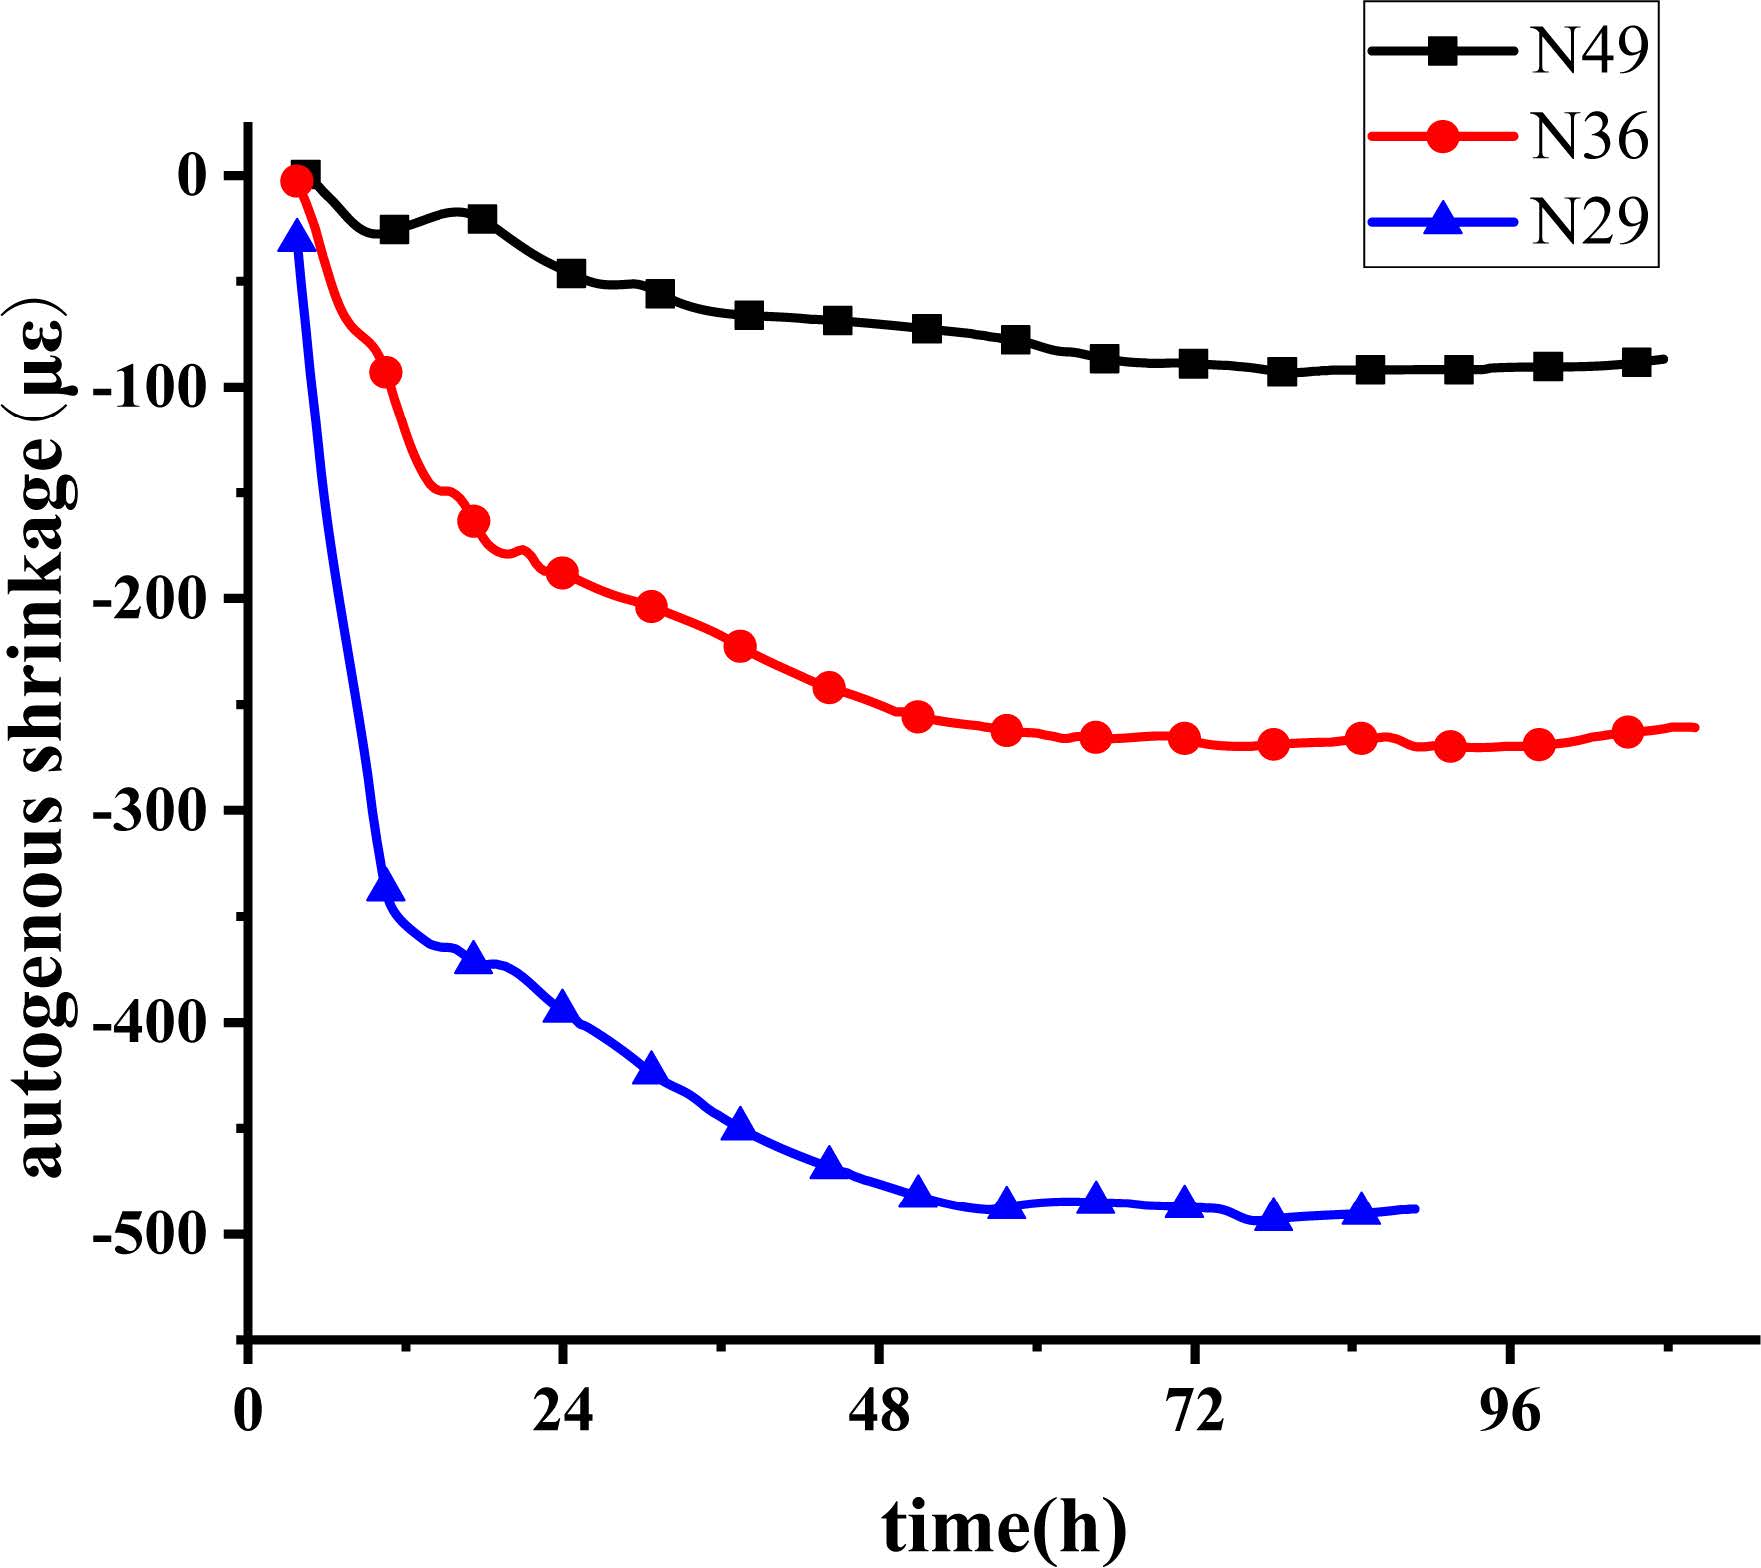
Fig. 2 shows the autogenous shrinkage of N49, N36 and N29. It can be seen that the autogenous shrinkage of N49, N36 and N29 is -85 με, -300 με and -490 με, respectively. As the w/c ratio decreased, the autogenous shrinkage increased by 252% and 476.5%, respectively. The experimental results indicated that autogenous shrinkage increases as the w/c ratio decreases [26]. At the same time, the rate of autogenous shrinkage of concrete was significantly affected by the w/c ratio, and the speed of autogenous shrinkage of N29 is much higher than that of N49. In addition, the autogenous shrinkage increased rapidly in the first 24 h after concrete pouring, and then gradually stabilized [12, 27].
The decrease in the w/c ratio led to not only a decrease in the water content of the concrete but also accelerated the hydration of the concrete, reduced the relative humidity inside the concrete and enhanced the self-drying effect. Then autogenous shrinkage increases. Furthermore, the w/c ratio decreased, which reduces the total hole volume of the concrete, and the formation of a more encrypted real pore structure caused a redistribution of internal water, and the water flowed to the smaller pores, because of which the critical radius of the pores was reduced, accelerating the increase in the negative pressure of the capillary, thus increasing the autogenous shrinkage of the concrete. Therefore, reducing the w/c ratio was found to increase the autogenous shrinkage of the concrete [5].
|
Fig. 2 The autogenous shrinkage of N49-N36-N29. |
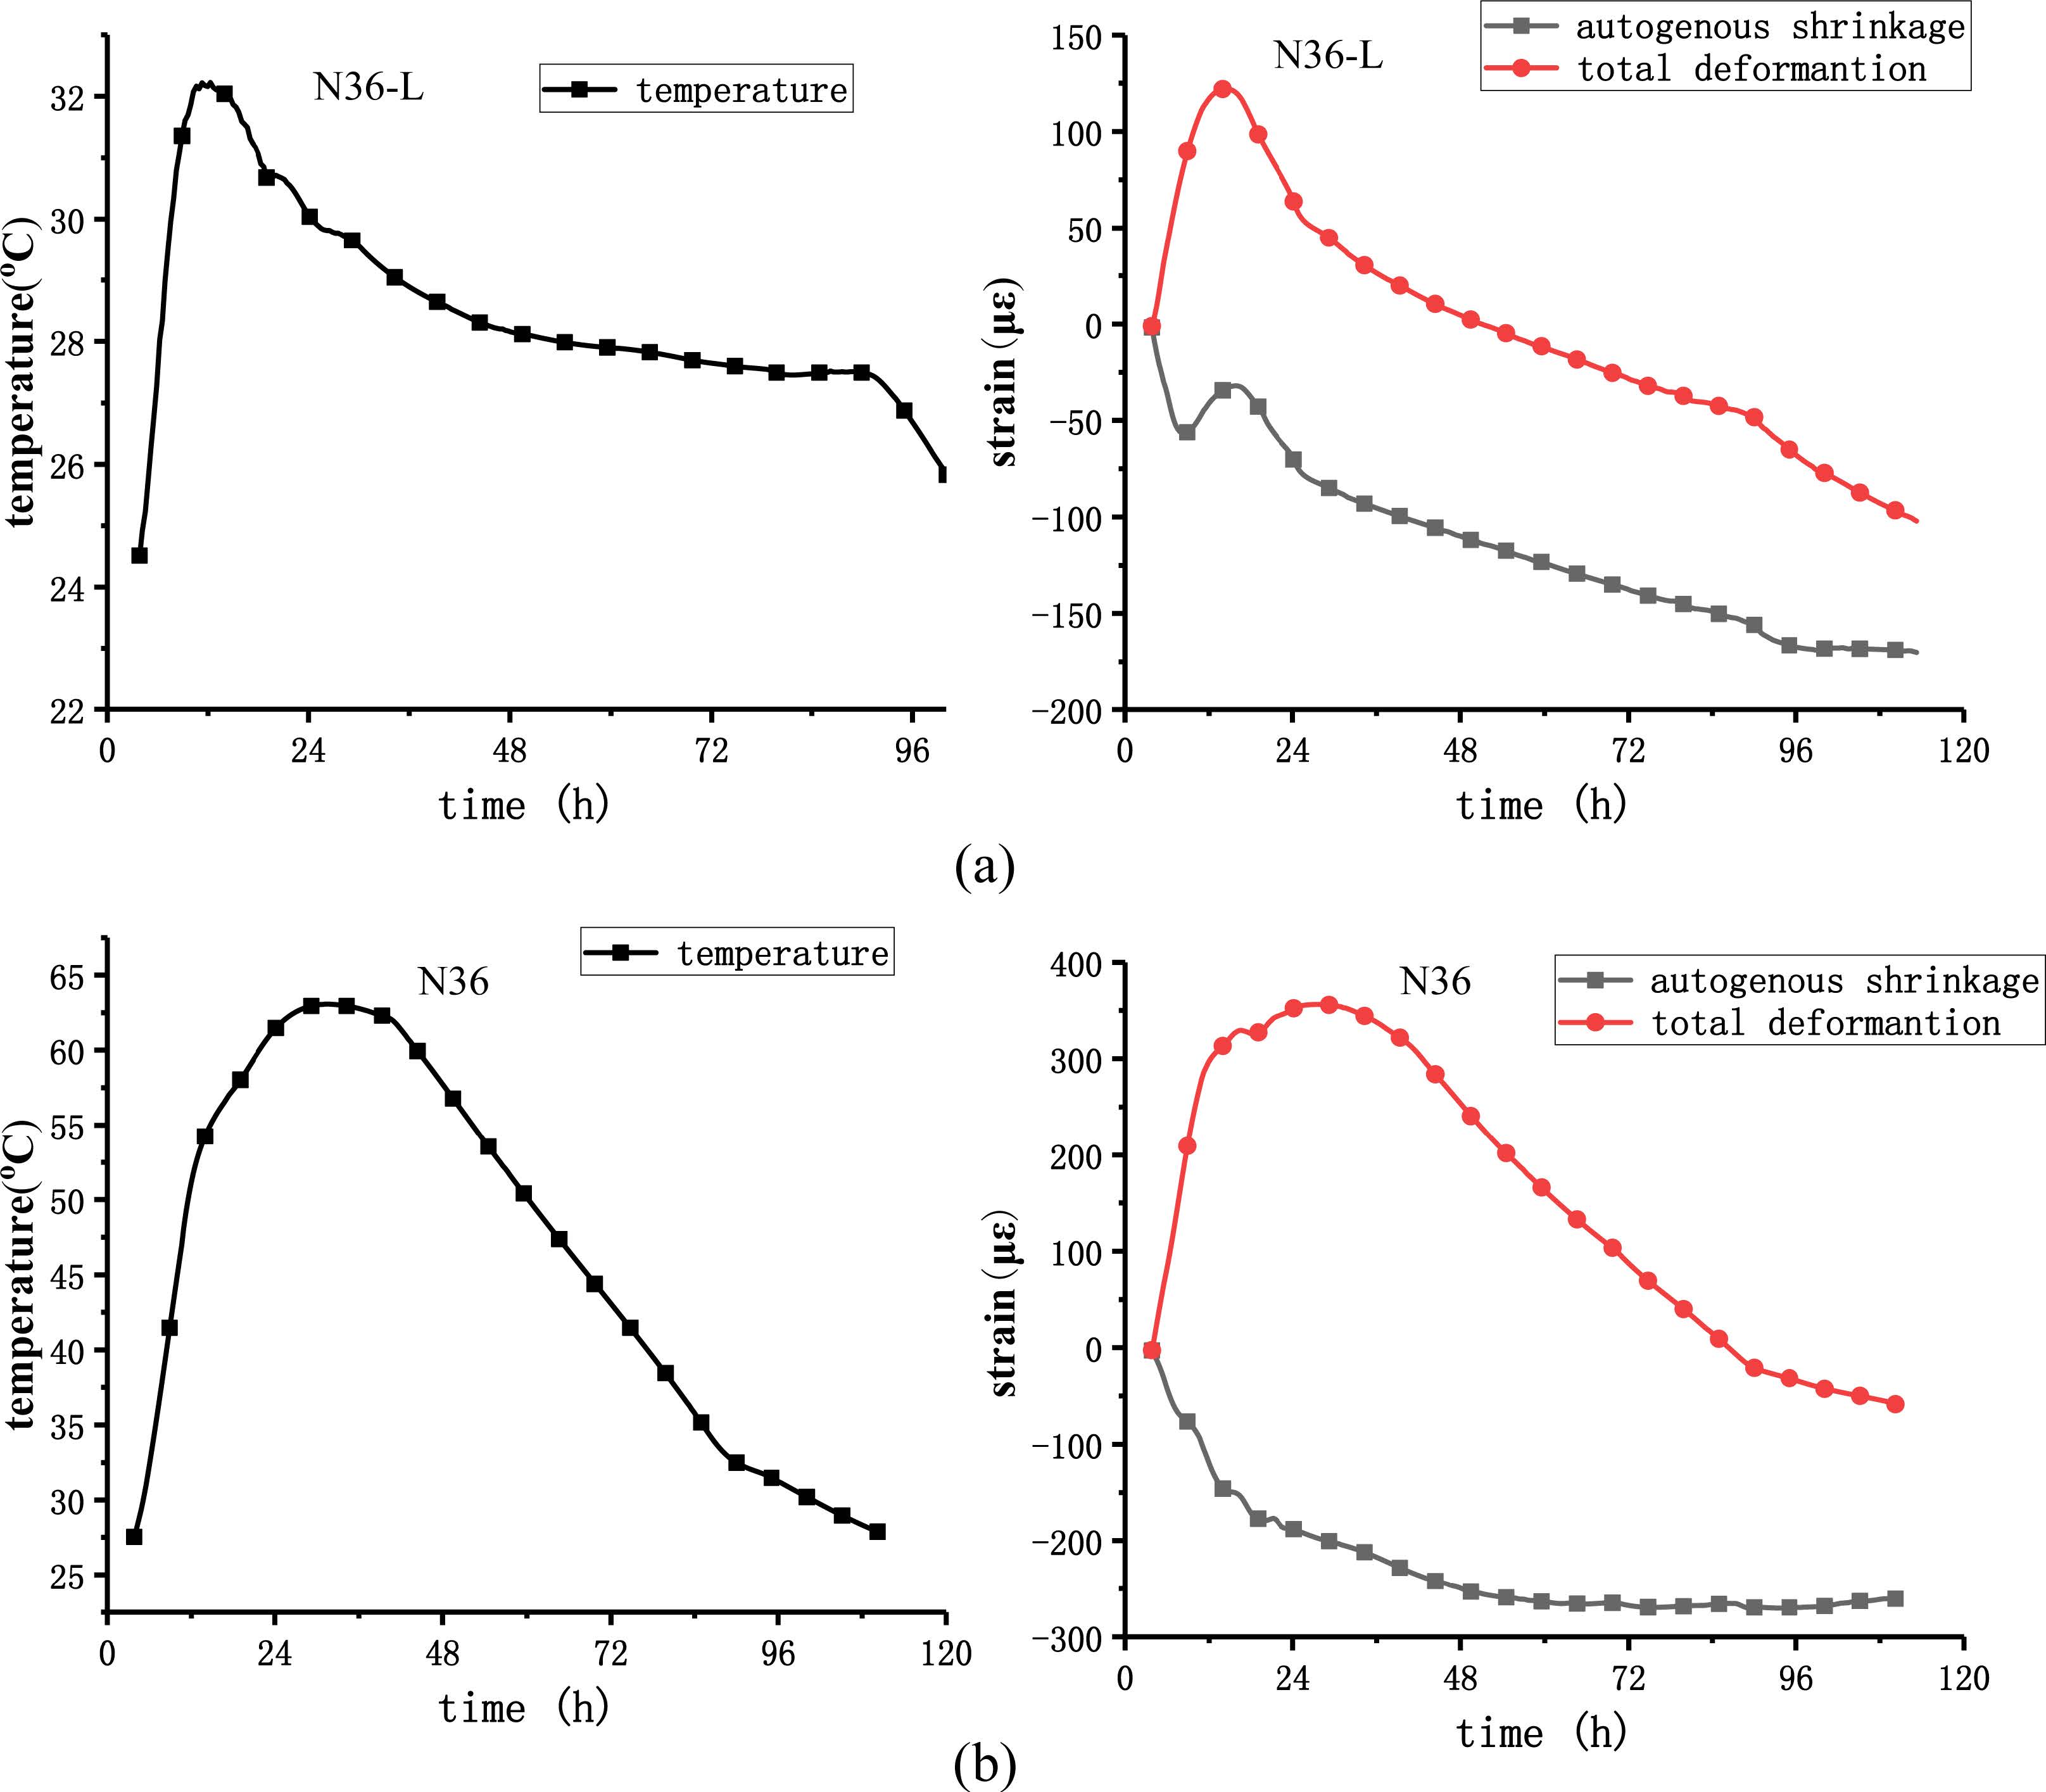
The autogenous shrinkage of concrete is not only related to the w/c ratio but also affected by temperature. The hydration reaction changes the temperature, which causes the thermal expansion and contraction of concrete and affects the autogenous shrinkage [12]. The external temperature also changes the temperature. These effects are primarily reflected in the temperature rise of concrete [4, 28]. In this test, the curing method was set by the temperature control system, and the concrete with a w/c ratio of 0.36 was naturally and semi-adiabatically cured. Fig. 3 shows the experimental results.
The natural curing and semi-adiabatic curing conditions make the specimens form low temperature rise and high temperature rise respectively. Fig. 3(a) shows the relationship among temperature, autogenous shrinkage and total deformation of N36 at low temperature rise with time in the case of natural curing. In the low-temperature rise case, the maximum expansion value of the total deformation of the specimen was 122 μm, and at 96 h, the autogenous shrinkage reached a stable value of 168 μm. Fig. 3(b) shows the relationship between temperature, autogenous shrinkage and total deformation of N36 at high temperature rise with time under semi-adiabatic curing. In the high-temperature rise case, the maximum expansion of the total deformation of the test piece is 356 μm, and at 60 h, the autogenous shrinkage reaches a stable value of 265 μm.
In the case of high-temperature rise, the development of autogenous shrinkage was accelerated, the time required to reach a steady state was relatively short and the autogenous shrinkage was large. In the low-temperature rise case, the autogenous shrinkage developed slowly, the time required to reach a steady state was longer and the autogenous shrinkage was small. In the low-temperature rise case, the total deformation of the specimen began to shrink after the temperature reached the temperature peak. In the high-temperature rise case, the total deformation of the test piece began to shrink before the temperature reached the temperature peak, which indicates that the higher the temperature rises, the faster the autogenous shrinkage of concrete develops, the greater is the autogenous shrinkage. This may be caused by the acceleration of autogenous shrinkage by the high-temperature rise [4, 28].
|
Fig. 3 Temperature, autogenous shrinkage and total deformation of different curing conditions over time: (a) natural curing; (b) semi-adiabatic curing. |
Autogenous shrinkage is one of the main causes of concrete shrinkage and cracking. Effectively predicting the development of autogenous shrinkage will improve the understanding of the state of concrete better and make it possible to take measures to prevent shrinkage and cracking. Many studies have proposed models for the autogenous shrinking of HPC [8, 9, 11, 28, 29], most of which are semi-empirical formulas with some different test parameters. Moreover, in the above studies, the test method and the measurement accuracy were different, which greatly reduces the accuracy of the autogenous shrinkage of the obtained concrete. Aïtcin [30] pointed out that the study of autogenous shrinkage must be carried out within 24 hours, sometimes even before the initial setting. The autogenous shrinkage should be recorded and analysed with the moment when the stress appears as time zero [31]. Therefore, in this study, autogenous shrinkage was recorded from the moment stress occurred, and the corresponding time was the actual age of the concrete.
Below are the three typical models,
CEB-FIP [8]:
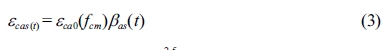
where εcas(t) is the calculated autogenous shrinkage of concrete at time t, in με; fcm is the mean compressive strength of concrete, in MPa; fcm = fck + Δf, Δf = 8 MPa; fck the compressive strength of concrete cylinders at 28 days, in MPa; fcm0 is 10 MPa; αas is a coefficient dependent on the type of cement (700 for OPC); t1 is 1 day; t is the age of concrete, in day.
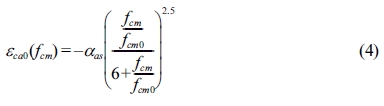
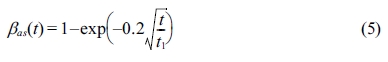
EN-1992[9]:
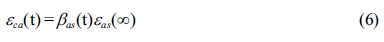
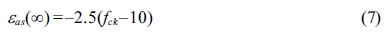
where εca(t) is the calculated autogenous shrinkage of concrete at time t, in με; fck the compressive strength of concrete cylinders at 28 days, in MPa; t is the age of concrete, in day.
Tazawa [11]:

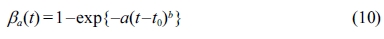
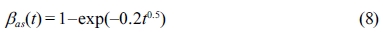
where εc(t) is the calculated autogenous shrinkage of concrete at time t, in με; ϒ is a coefficient dependent on the type of cement (1.0 for OPC); a and b are constant, t0 is the initial setting time, in h; t is the age of concrete, in h.
RILEM[10]:

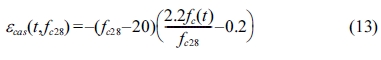
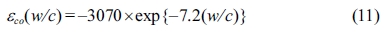
where εcas(t, fc28) is the calculated autogenous shrinkage of concrete at time t (the time-zero is the initial setting), in με; t is the age of concrete, in day; fc28 the compressive strength of concrete cylinders at 28 days, in MPa; fc28 the compressive strength of concrete cylinders at t, in MPa; if unknown, fc(t) = [t/(1.40 + 0.95t)]fc28.
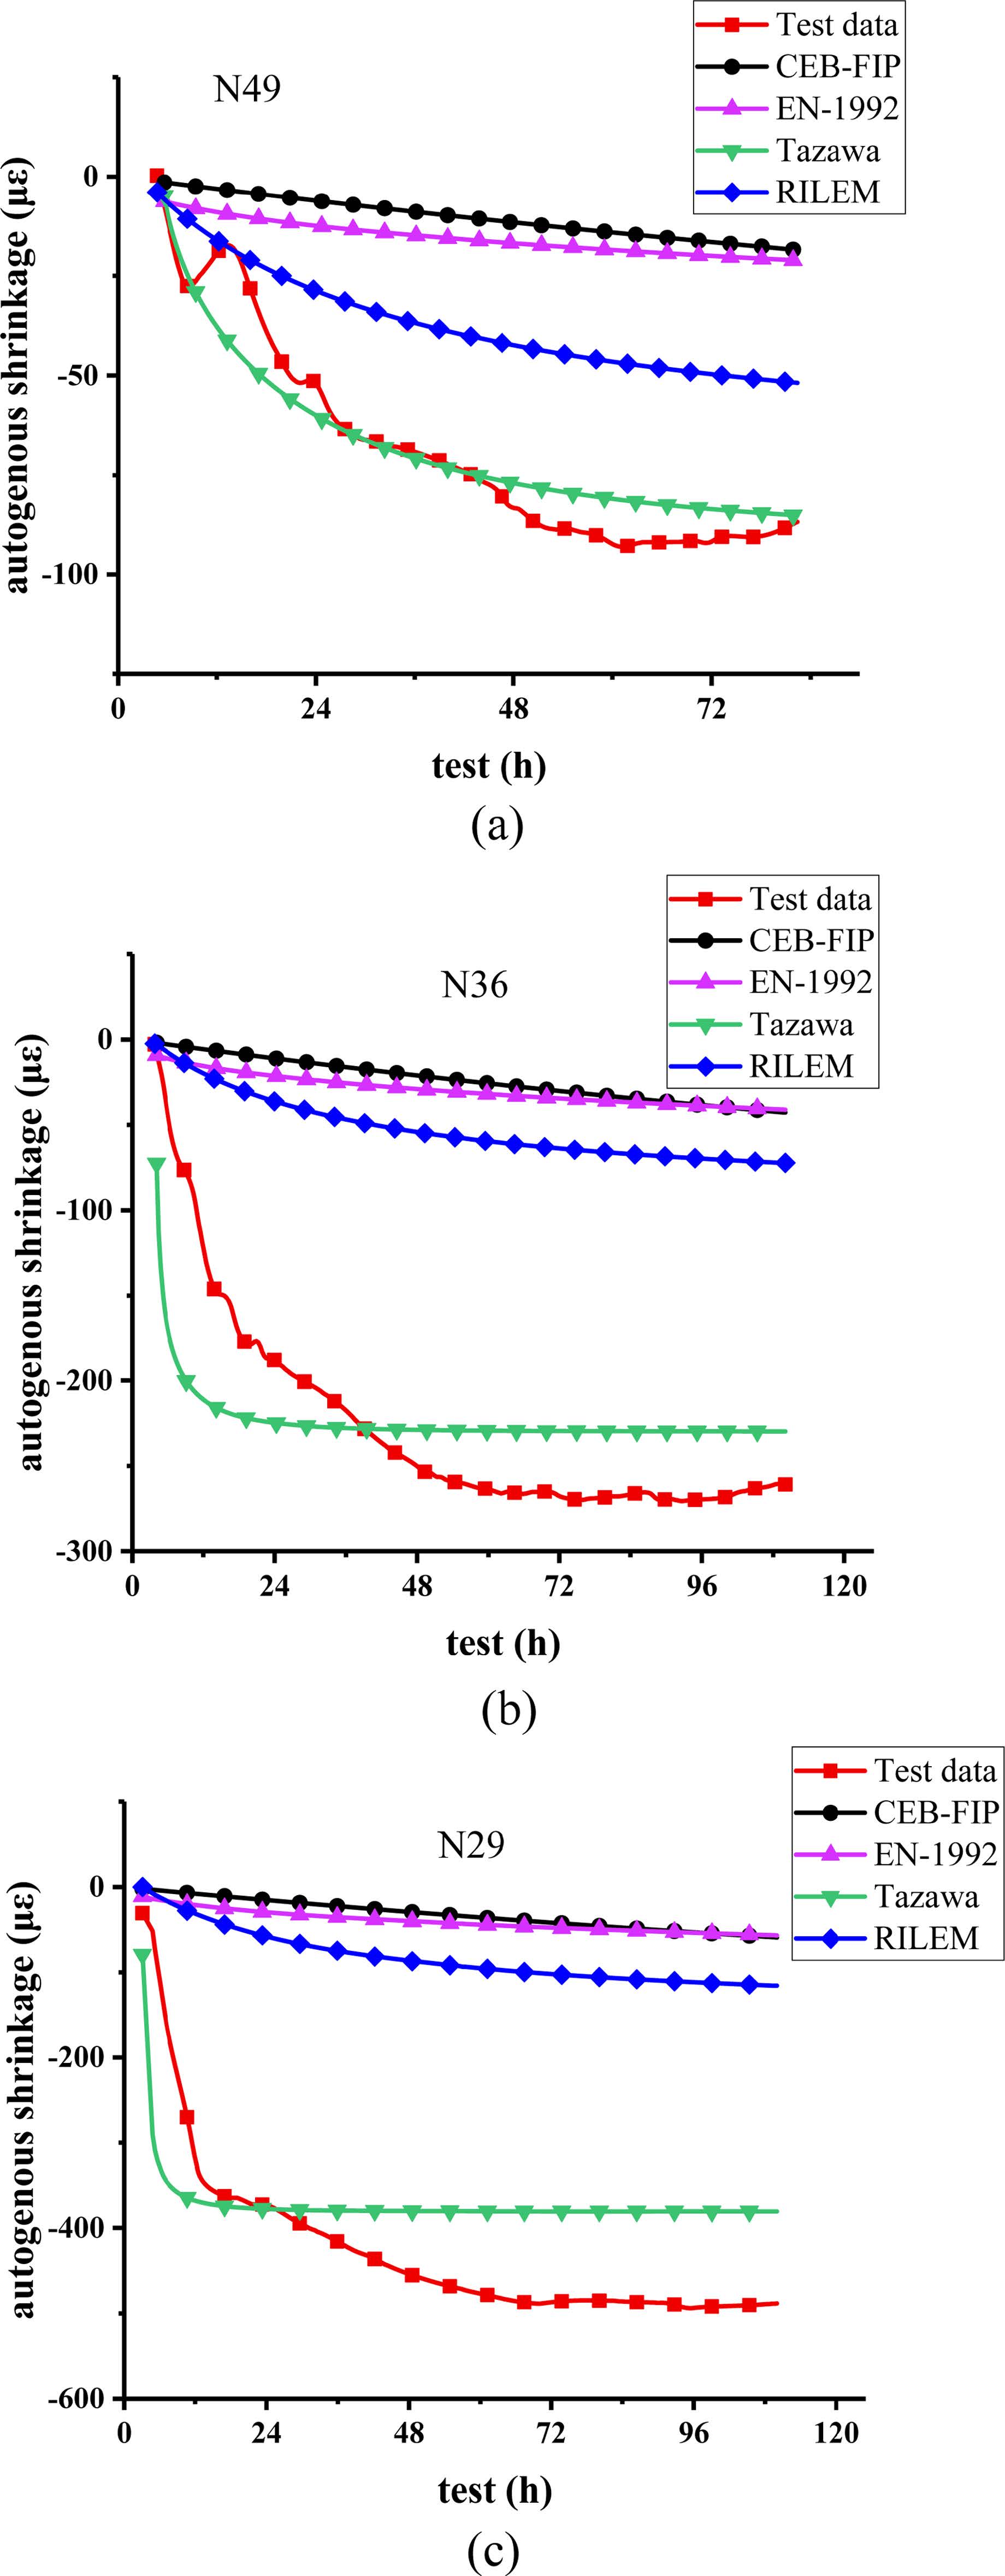
Fig. 4 shows the comparison between the theoretical values of the autogenous shrinkage model of N49, N36 and N29 and the experimental values obtained by semi-adiabatic curing. The theoretical value obtained CEB-FIP [8], EN-1992 [9] and RILEM [10] models differed significantly from the experimental value, which may be related to the compressive strength of the parameters considered in the formula. Autogenous shrinkage is related to the microstructure of the concrete and the composition of the concrete [5], regardless of the compressive strength. Moreover, the shape of the curve obtained by the three is also different from the development trend of autogenous shrinkage of concrete. The theoretical value obtained by the Tazawa [11] model and experimental values show better accuracy. Especially for N49, the theoretical value curve and the experimental value curve were in relatively good agreement. The expansion of the medium-term of the N49 specimen may be related to the redistribution of internal bleeding. Concrete with a high w/c ratio is prone to bleeding; under the action of self-drying, the secreted water is reabsorbed and the concrete expands [32]. In N36 and N29, the autogenous shrinkage predicted by the Tazawa model increased too quickly in the early stage and reached a stable value at 12 h. At this time, the autogenous shrinkage of the concrete obtained from the test continued to increase, and the stable value predicted by the Tazawa model was less than the test value. The smaller the w/c ratio, the larger the difference between the theoretical value and model and experimental values.
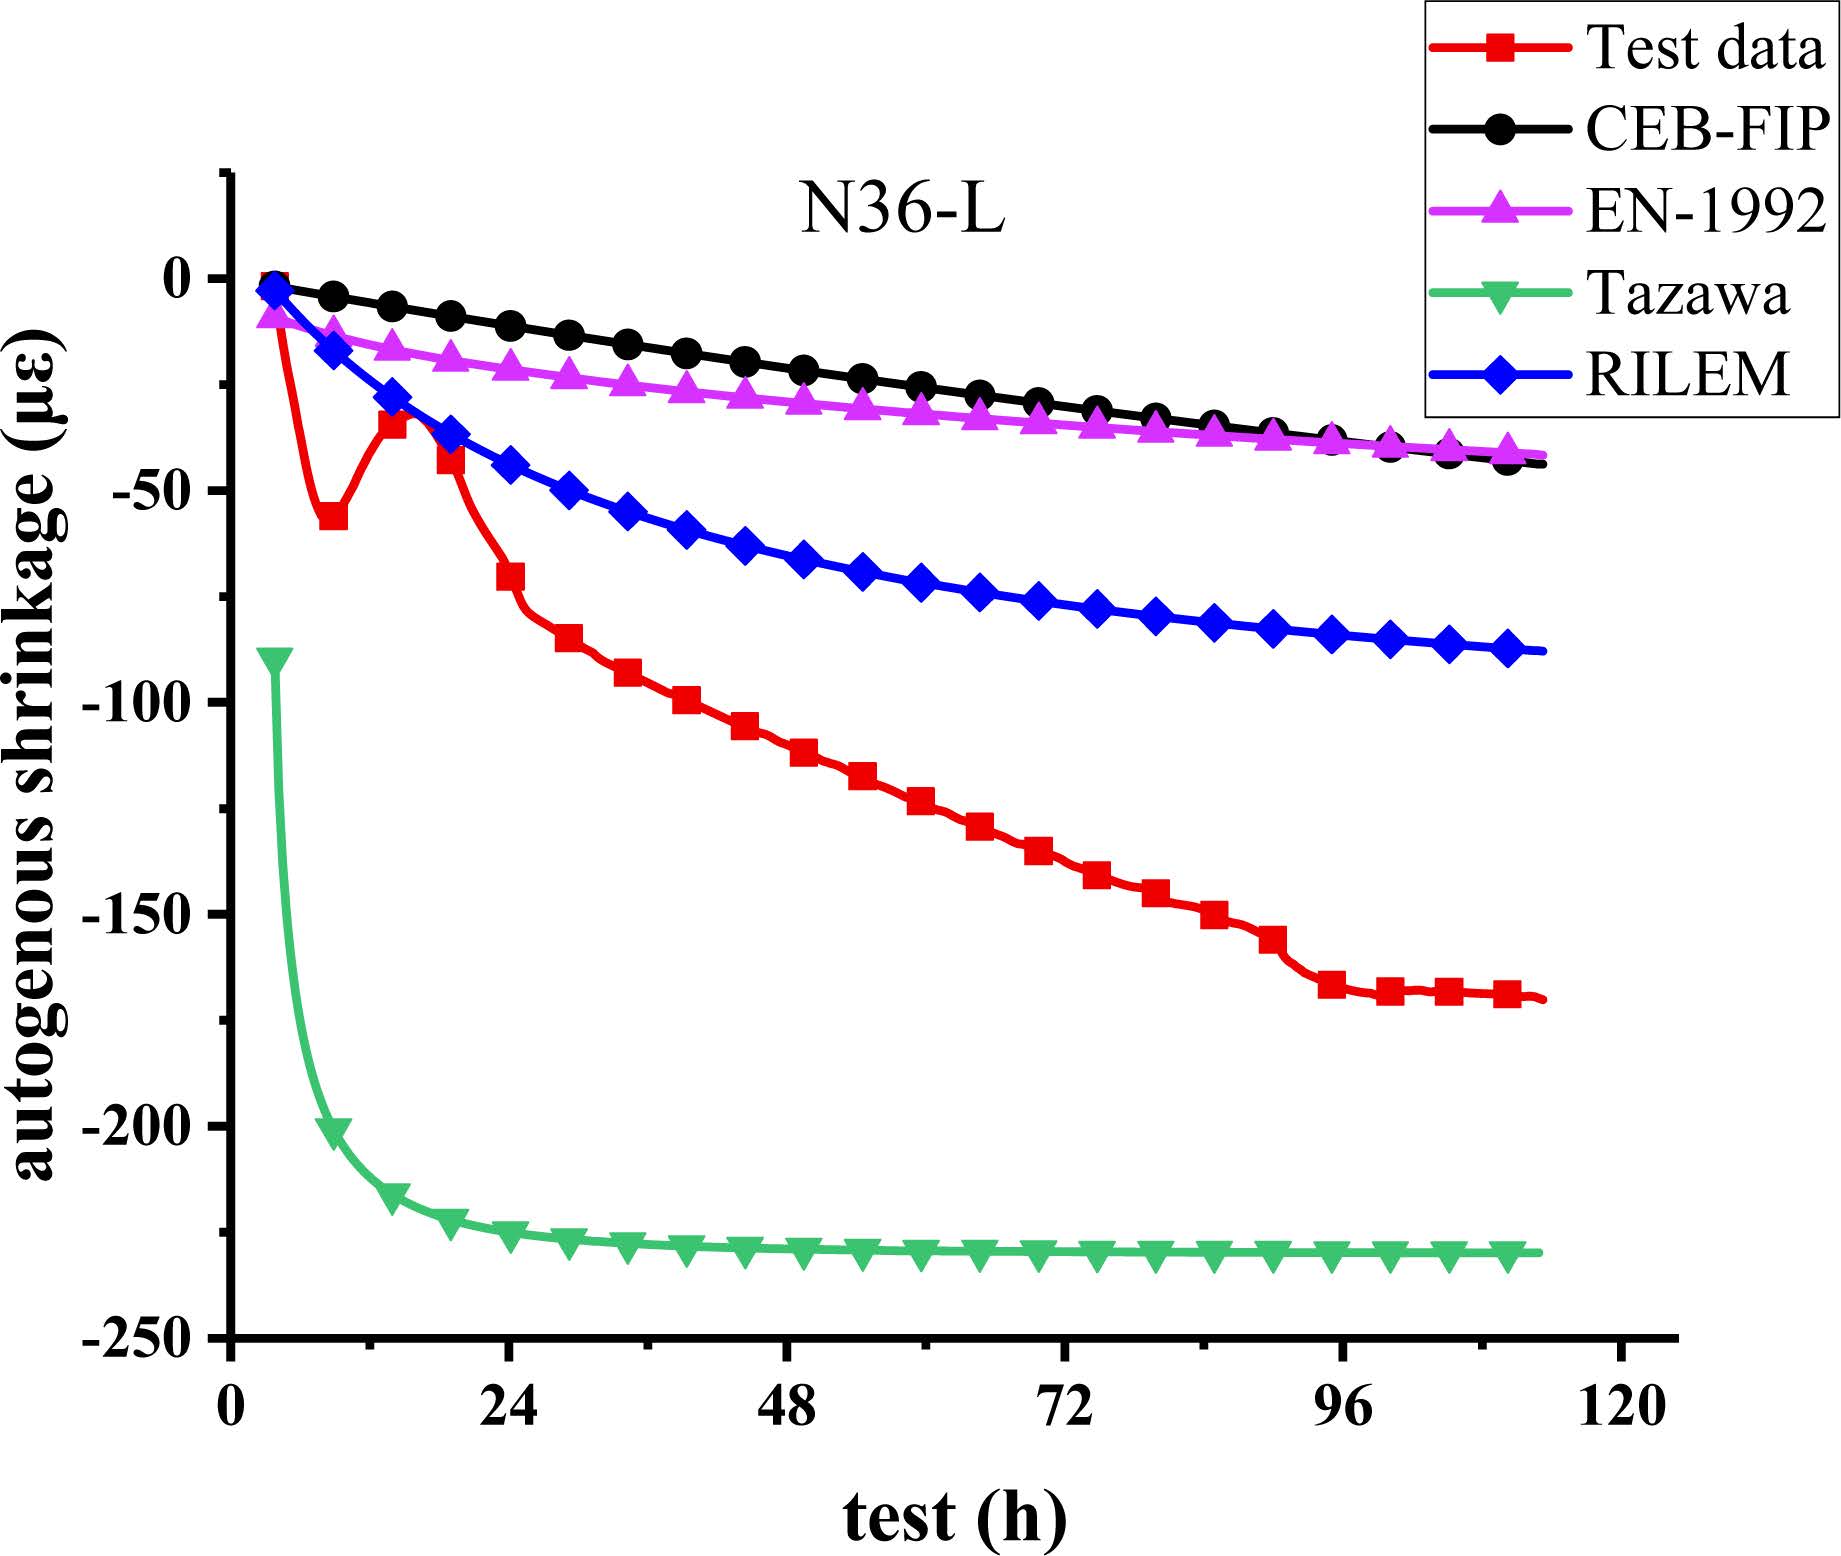
Fig. 5 is a comparison of the autogenous shrinkage model and the N36-L test value under natural curing conditions. It can be seen that under natural curing conditions, CEB-FIP [8], EN-1992 [9] and RILEM [10] models still had a deviation from the experimental value, but the error was smaller, under natural curing conditions. However, the Tazawa [11] model does not show better accuracy under semi-adiabatic conditions. The theoretical value obtained by the Tazawa model is far greater than the experimental value in the case of low-temperature rise. The Tazawa model predicted that the developing of autogenous shrinkage of concrete was still too fast at an early age. The final stable value was greater than the test value.
The Tazawa model demonstrated the highest degree of accuracy among the four models, but it still had a deviation from the experimental value. This experiment used natural and semi-adiabatic curing, and 20 ℃ was the test temperature in the Tazawa model, which may be the cause of the error between the experimental and theoretical values obtained by this model. Therefore, a coefficient related to the temperature rise of the concrete can be added to the Tazawa model to correct the model, allowing for a more accurate prediction of the autogenous shrinking.
|
Fig. 4 Comparison of theoretical values of autogenous shrinkage model and experimental values of semi-adiabatic conditions: (a) N49; (b) N36; (c) N29. |
|
Fig. 5 Comparison of natural conservation N36-L test value and autogenous shrinkage mode. |
Cracking is primarily caused by the tensile stress generated by deformation exceeding the tensile strength of the concrete. Autogenous shrinkage is one of the deformations of concrete. By reducing autogenous shrinkage of concrete, the deformation can be reduced and crack resistance can be improved.
The incorporation of synthetic fibers causes the cement particles to combine with coarse particles, which increases the friction between the particles inside the concrete and improves the tensile strength. Moreover, the addition of fibers reduces the movement of water, reduces the rate of water evaporation and reduces capillary tension, thereby reducing autogenous shrinkage [5].
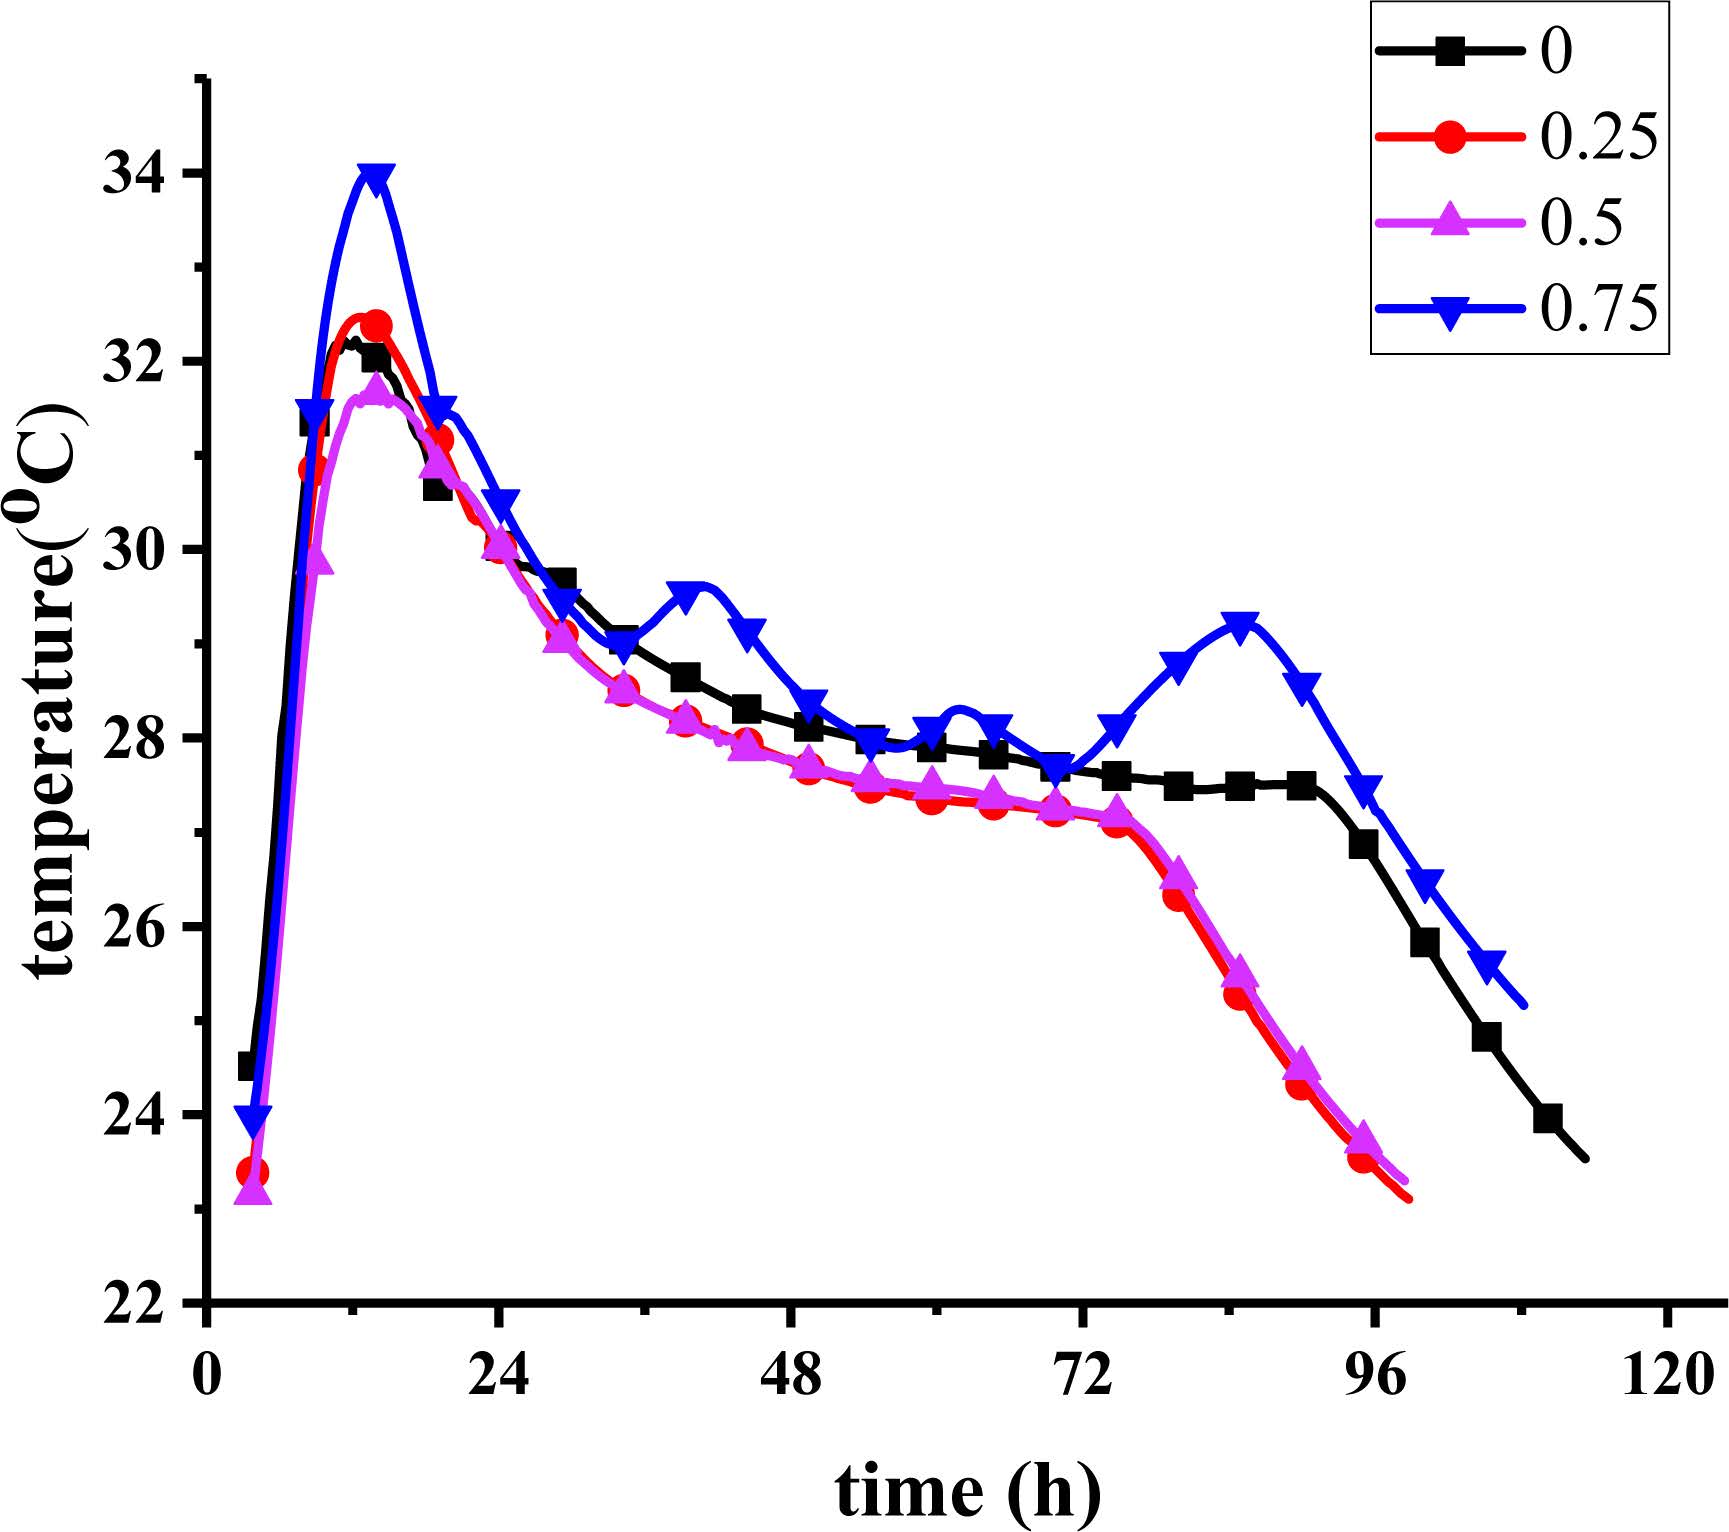
Fig. 6 is the relationship between temperature and time of different mix content of fiber concrete. When the amount of PVA fiber is 0, 0.25%, 0.5%, 0.75%. The temperature history of the specimen was similar, the temperature rise and the temperature drop were similar and the temperature rise value of 0.75% was slightly higher, indicating that the amount of fiber has little effect on the temperature of concrete.
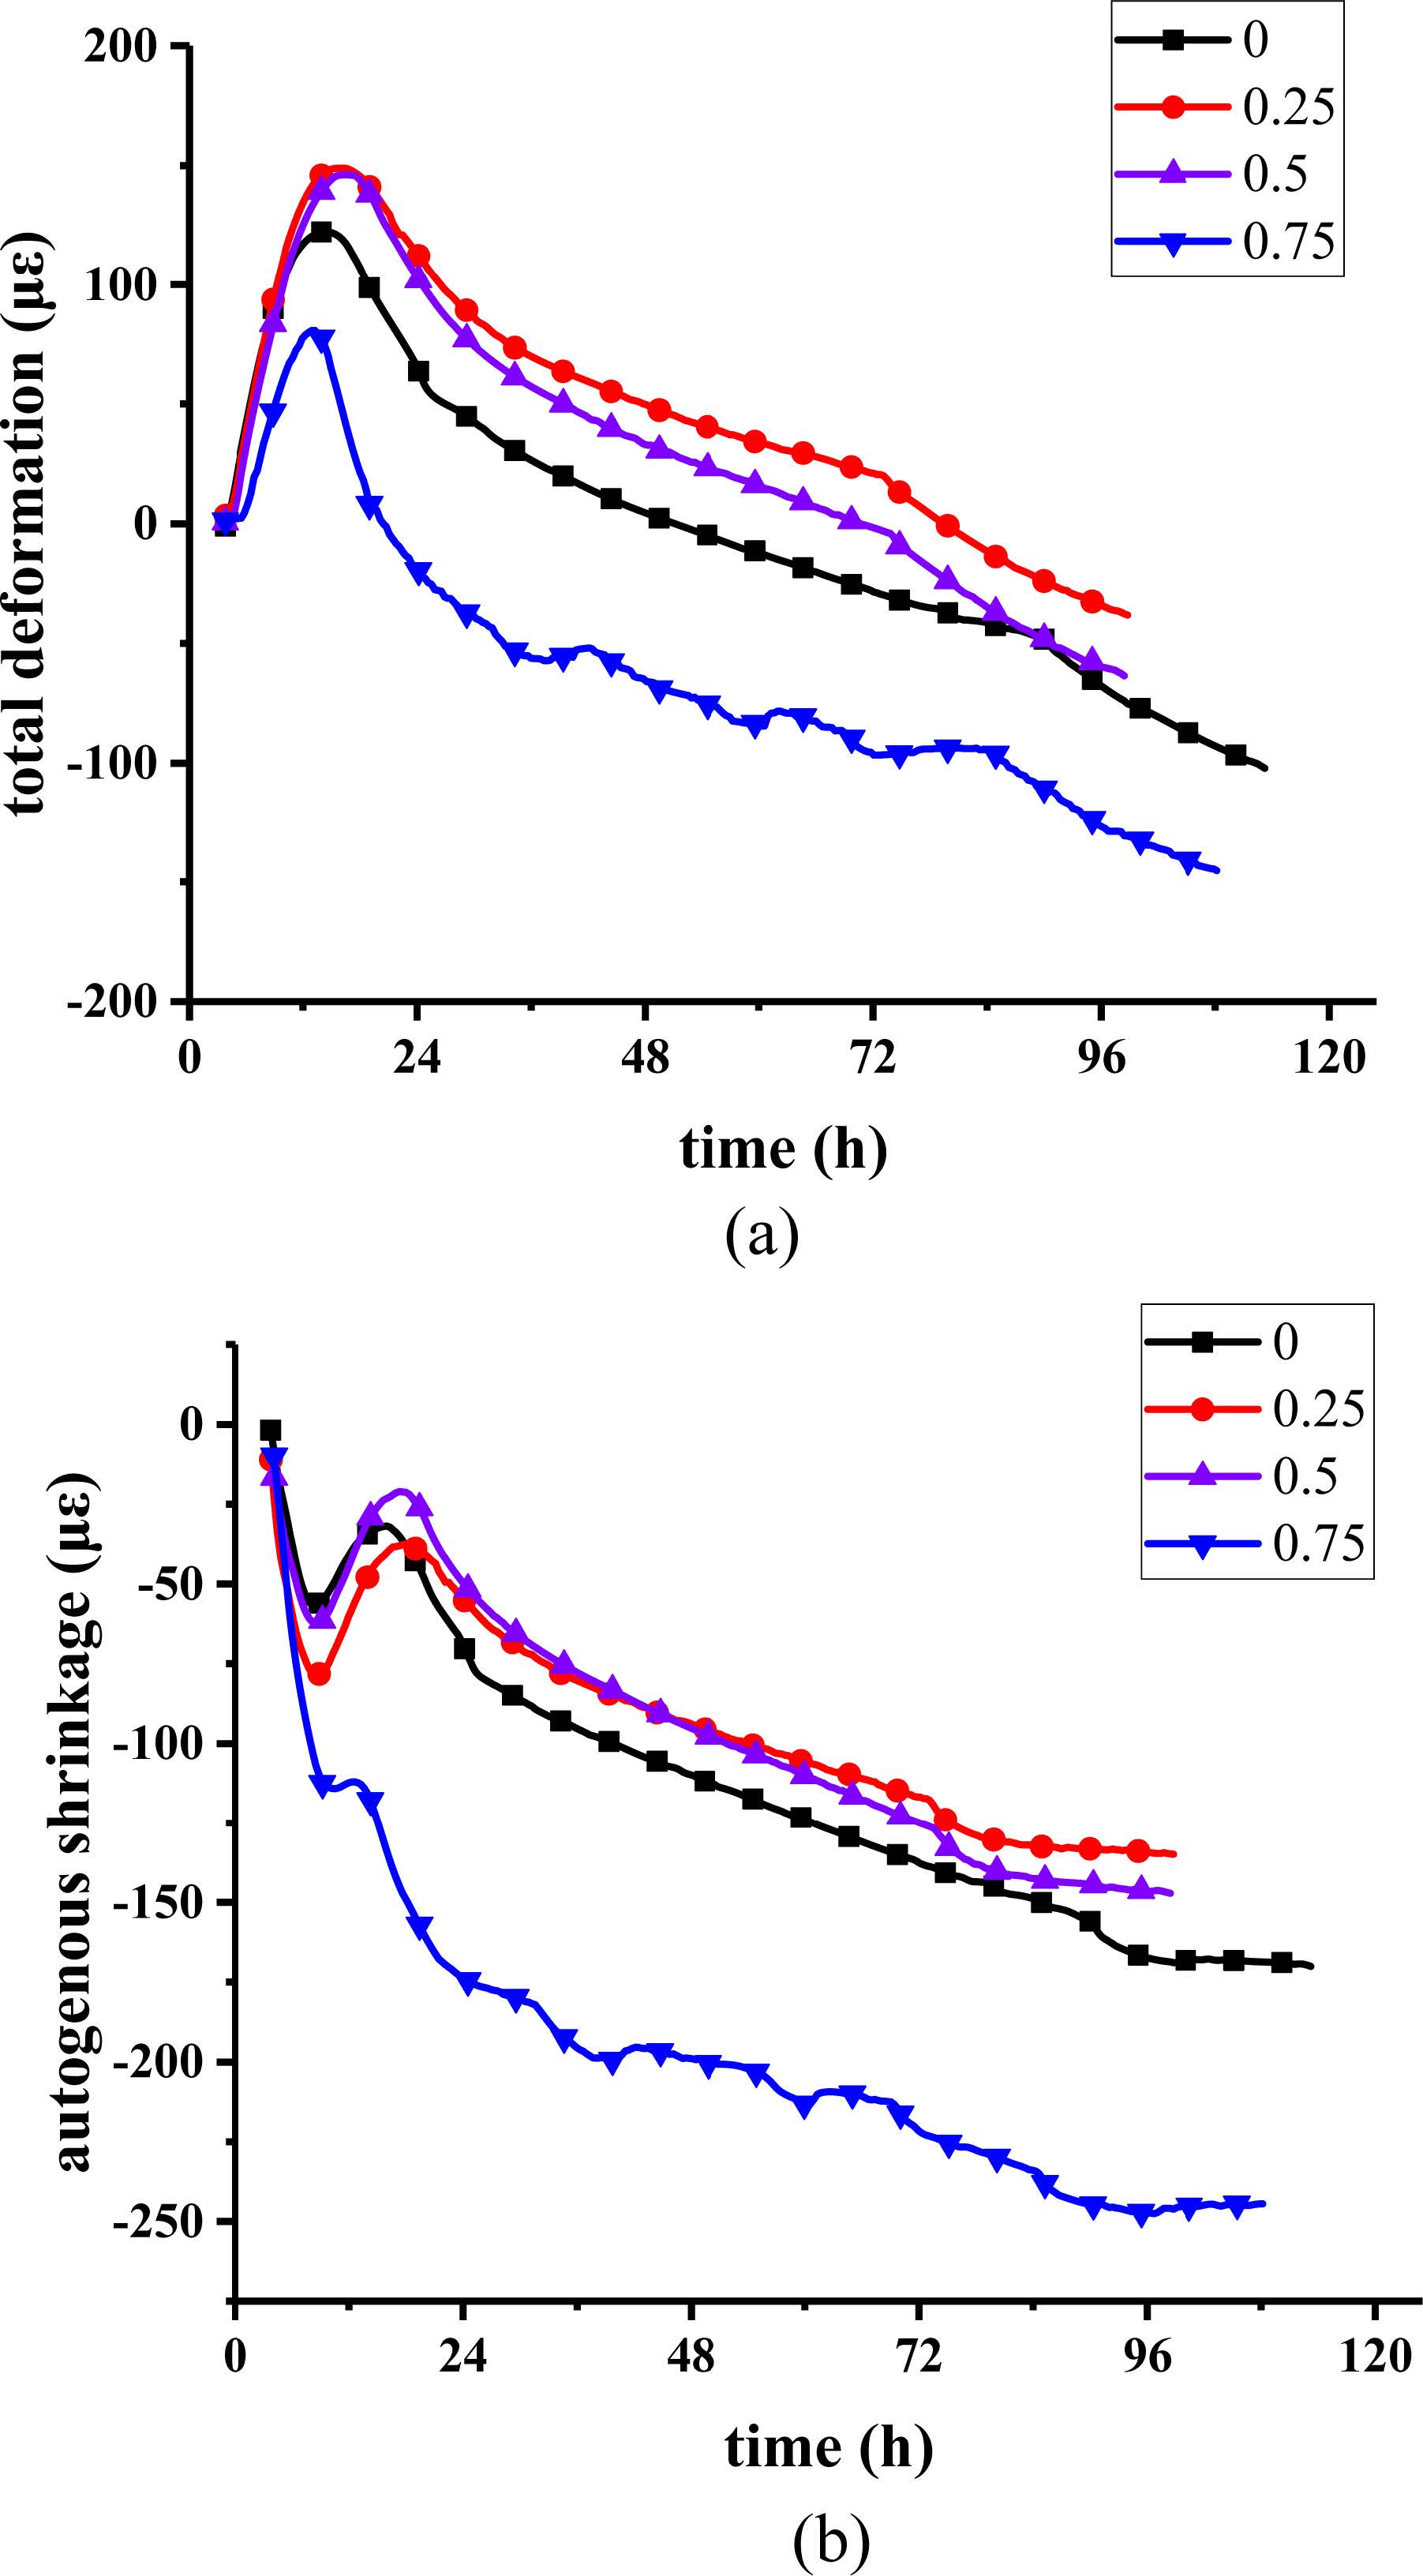
Fig. 7(a) shows the relationship between the total deformation of concrete and time with different content of fibers. It can be seen that the early expansion of the N36-0.25L and N36-0.5L specimens is greater than that of N36-L, and the early expansion of the N36-0.75L specimens is less than the expansion of N36-L. The expansion peaks of N36-L, N36-0.25L, N36-0.5L, and N36-0.75L were 122 μm, 148 μm, 146 μm and 80 μm, respectively, and the expansion rates at an early age were also approximately the same.
Fig. 7(b) shows the relationship between autogenous shrinkage of concrete and time by adding different content of fiber. The autogenous shrinkage stability values of N36-L, N36-0.25L, N36-0.5LL, and N36-0.75L were 169 μm, 134 μm, 146 μm, 244 μm, respectively. N36-0.5L autogenous shrinkage is always less than N36-L. N36-0.25L early autogenous shrinkage is greater than N36-L and N36-0.5L, and the late autogenous shrinkage is less than the N36-L and N36-0.5L. N36-0.75L demonstrated the largest autogenous shrinkage, which indicated that the incorporation of fibers can inhibit autogenous shrinkage, but it is related to the content. Excess fiber content will promote the development of autogenous shrinkage because PVA fiber is a hydrophilic material that absorbs the water of the fresh concrete, and the addition of the fiber also increases the number of holes in the concrete to a certain extent. The excessive addition of PVA fiber increases the capillary action in the concrete, thereby increasing autogenous shrinkage [5]. Therefore, to obtain the optimum content of PVA fiber to reduce autogenous shrinkage, further research is needed.
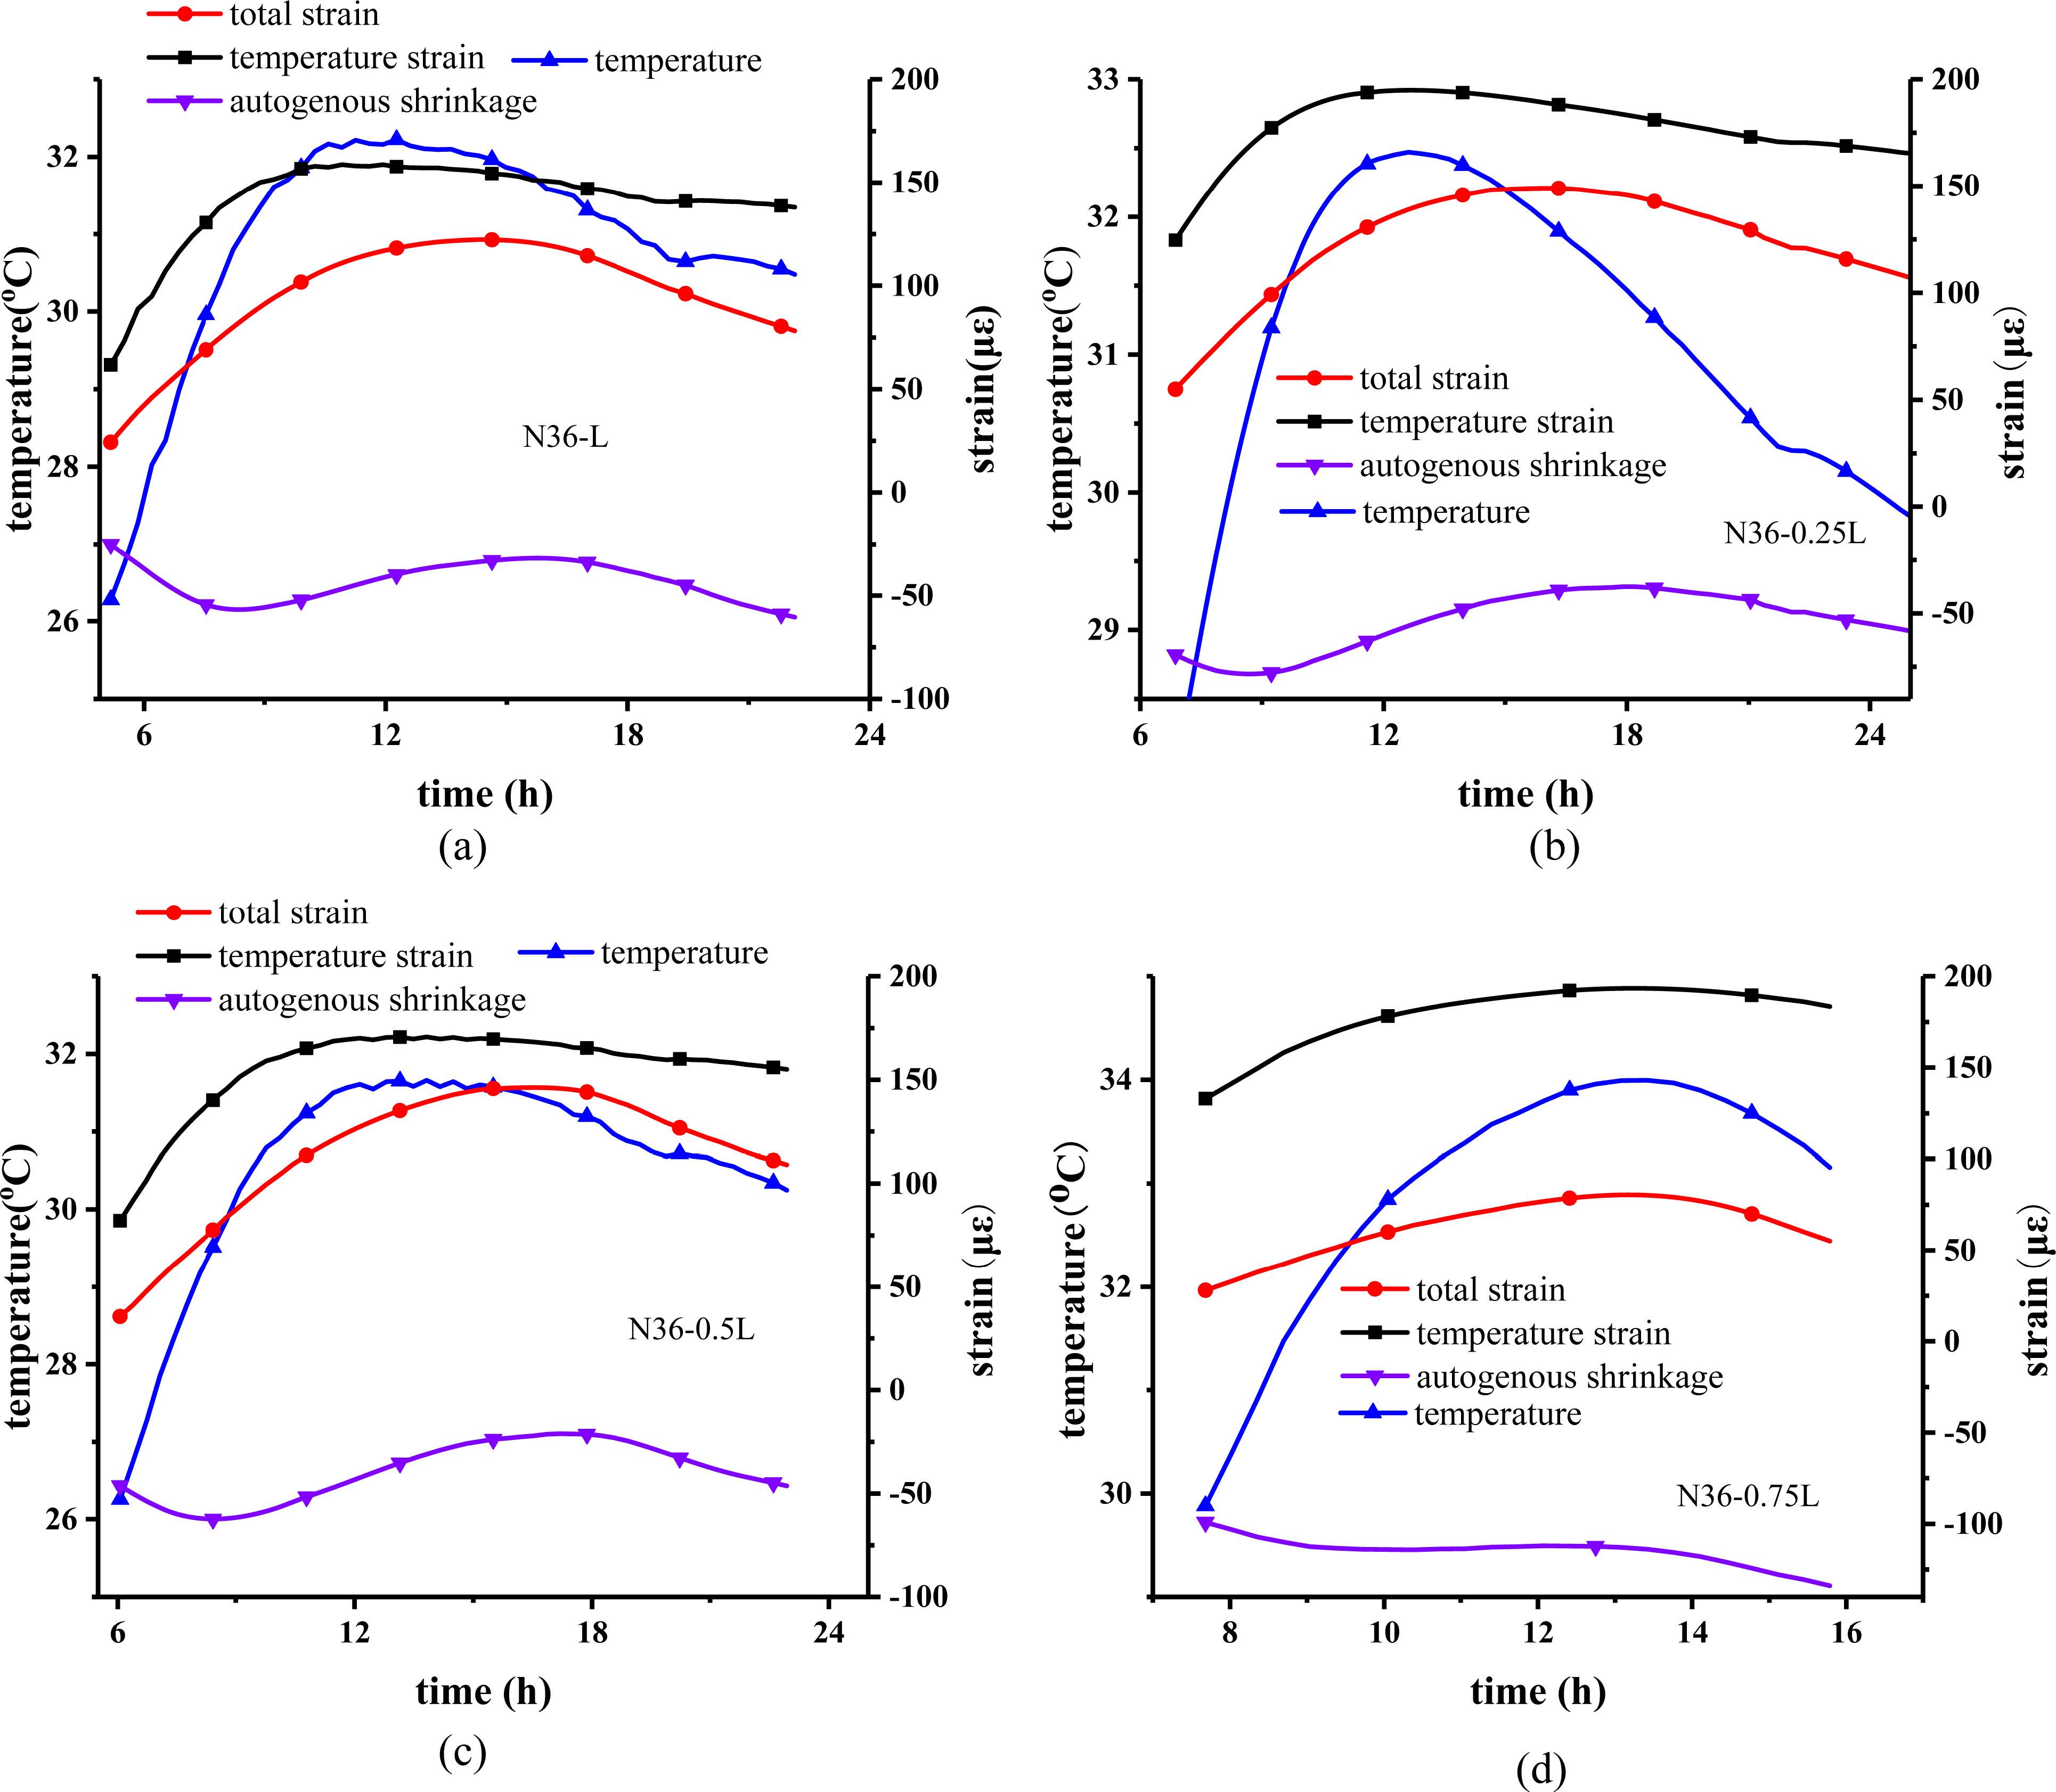
In the four sets of experiments, a period of expansion occurred in the prophase of autogenous shrinkage. Fig. 8 shows the partial enlargement of expansion of the different fiber content from early age autogenous shrinkage. It can be seen that this expansion mainly occurs near the temperature peak. In N36-L, N36-0.25L, N36-0.5L, the temperature reaches the temperature peak, and the total deformation does not reach the maximum point of expansion. After the temperature drops for a period, the total deformation peaks and begins to shrink. The total deformation and temperature are not synchronous changes. Total deformation lags behind temperature changes, and autogenous shrinkage produces expansion in this phase. In N36-0.75L, the total deformation is basically synchronized with the temperature change, and there is almost no expansion in this period. Whether the total deformation lags behind temperature change, autogenous shrinkage will produce expansion, and the cause of the total deformation lag, to understand these, further research is needed.
|
Fig. 6 Temperature and time relationship of different content of fiber concrete. |
|
Fig. 7 The relationship between the deformation of concrete and time with different content of fibers: (a) total deformation and time; (b) autogenous shrinkage and time. |
|
Fig. 8 The partial enlargement of expansion of the different fiber content from at early age autogenous shrinkage: (a) N36-L; (b) N36-0.25L; (c) N36-0.5L; (d) N36-0.75L. |
By analyzing the test data, the following conclusions can be obtained.
1. The autogenous shrinkage of concrete increases with a decrease in the w/c ratio. Under semi-adiabatic curing conditions, the maximum autogenous shrinkage values of N49, N36 and N29 specimens were 85 με, -300 με and -490 με, respectively. With a decrease in w/c ratio, the autogenous shrinkage increased by 252% and 476.5%, respectively. The rate of autogenous shrinking is also increasing, and the speed of the N29 is much higher than that of the N49. The autogenous shrinkage of the three test pieces increased rapidly in the first 24 hours and then stabilised.
2. The higher the temperature rise, the greater is the autogenous shrinkage of concrete. The natural curing and semi-adiabatic curing conditions caused the test pieces to form low temperature rise and high temperature rise respectively. In the case of low temperature rise, the maximum expansion value of the total deformation of the test piece was 122 με, and reached a stable value of 168 με at 96 hours. In the case of high temperature rise, the maximum expansion of the total deformation of the test piece is 356 με, and at 60 h, the autogenous shrinkage reaches a stable value of 265 με. In the case of high-temperature rise, the test piece began to shrink before the temperature reached the peak, and the autogenous shrinkage developed faster. The time required to reach the steady state was relatively short, and the autogenous shrinkage was large. In the case of low-temperature rise, the test piece began to shrink after the temperature reached the peak. The autogenous shrinkage developed slowly, and the time required to reach a steady state was longer. Meanwhile, the autogenous shrinkage was small.
3. On comparing the experimental data with predictions obtained from CEB-FIP, EN-1992, RILEM and Tazawa autogenous shrinking models, better accuracy was demonstrated by the Tazawa model. However, the Tazawa model still had some deviations in the prediction of the autogenous shrinking development of concrete under different curing conditions. In the high-temperature rise, autogenous shrinkage stability value prediction was too low, and the low-temperature rise and autogenous shrinkage stability value prediction were too large. Therefore, a coefficient related to the temperature rise of the concrete can be added to the Tazawa model to correct the model for more accurately predicting the autogenous shrinking development of the concrete.
4. Adding PVA fiber will affect the autogenous shrinkage of concrete. The autogenous shrinkage stability values of N36-L, N36-0.25L, N36-0.5L, and N36-0.75L were 169 με, 134 με, 146 με, and 244 με, respectively. In N36-0.5L, the autogenous shrinkage is always less than N36-L. In N36-0.25L, early autogenous shrinkage is greater than N36-L and N36-0.5L, and the late autogenous shrinkage is less than the two. N36-0.75L has the largest autogenous shrinkage. PVA fiber affects the development of autogenous shrinkage, but the incorporation of too much PVA fiber will increase the development of autogenous shrinkage. Therefore, to obtain the optimum content of PVA fiber to reduce autogenous shrinkage, further research is needed.
5. W/c ratio change leads to the maximum change autogenous shrinkage of concrete. So among the three influencing factors of w/c ratio, curing temperature and adding PVA fiber, the w/c ratio has the greatest influence on the autogenous of early age HPC.
In addition to the three influencing factors studied in this paper, fly ash, silica fume, shrinkage reducing agents, prewetted lightweight aggregates and expansion agents can effectively affect the autogenous shrinkage of early age HPC. In future work, single and comprehensive influences of these factors need to be further studied.
The financial assistance provided by National Natural Science Foundation of China (Grant number: 51378312) is deeply acknowledged. The testing was performed in the Guangdong Provincial Key Laboratory of Durability for Marine Civil Engineering at Shenzhen University.
- 1. N. Toropovsab, F. LoMontec, M. Wyrzykowskiad, B. Webera, G. Sahmenkob, P. Vontobele, R. Felicettic, and P. Luraaf, Cem. Concr. Res. 68 (2015) 166-173.
-

- 2. W. Sun, H. Chen, X. Luo, and H. Qian, Cem. Concr. Res. 31[4] (2001) 595-601.
-
- 3. D. Cusson, and T. Hoogeveen, Cem. Concr. Res. 37[2] (2007) 200-209.
-
- 4. Z. LIN, in “Quantitative Evaluation of the Effectiveness of Expansive Concrete as a Countermeasure for Thermal Cracking and the Development of Its Practical Application” (The University of Tokyo, 2006) p. 34-61
- 5. L. Wu, N. Farzadnia, C. Shi, Z. Zhang, and H. Wang, Constr. Build. Mater. 149 (2017) 62-75.
-
- 6. B. Persson, Mater. Struct. 30[5] (1997) 293-305.
-
- 7. A. Williams, A. Markandeya, Stetsko, K. Riding, and A. Zayed, Constr. Build. Mater. 120 (2016) 172-180.
-
- 8. CEB-FIP, in “Structural Concrete: Textbook on Behavior, Design and Performance, vol. 1” (Sprint-Druck Stuttgart, 1999) p. 43-46
- 9. European Standards, No. EN-1992-1-1 (2001) p. 230.
- 10. RILEM TC 119-TCE, Mater. Struct. 30 [202] (1997) 451-464.
- 11. E. Tazawa and Miyazawa. in “Autogeneous Shrinkage of Concrete” (E&FN SPON Press, 1999) p. 175.
- 12. K.M. Lee, H.K. Lee, S.H. Lee, and G.Y. Kim, Cem. Concr. Res. 36[7] (2006) 1279-1285.
-
- 13. J.E. Jonasson, and H. Hedlund, in Proceedings of the International RILEM Workshop on Shrinkage of Concrete, October 2000, edited by V. Baroghel-Bouny, AïtcinP-C (RILEM Publications SARL Press, 2000) p. 507.
- 14. H. Hedlund, in “Stresses in high performance concrete due to temperature and moisture variations at early ages” (Luleå University, 1996) p.238.
- 15. S.W. Yoo, S. J. Kwon, and H. J. Sang, Constr. Build. Mater. 34[3] (2012) 1-10.
-
- 16. M. Golias, J. Castro, and J. Weiss, Constr. Build. Mater. 35[10] (2012) 52-62.
-
- 17. A. Kyle, Riding, L. Jonathan, Poole, K. Anton, Schindler, C. Maria, G. Juenger, J. Kevin, and Folliard, ACI Mater. J. 106[5] (2009) 448-454.
- 18. T.J. Barrett, I. De la Varga, and W.J. Weiss, in Proceedings of the Structures Congress 2012, March 2012, edited by P.E. John Carrato (ASCE Press, 2012) p. 699.
- 19. D.J. Shen, J.L. Jiang, M. Zhang, P.P. Yao, and G.Q. Jiang, Constr. Build. Mater. 165 (2018) 451-461.
-
- 20. D. J. Shen, J. L. Jiang, J. X. Shen, P. P. Yao, and G. Q. Jiang, Constr. Build. Mater.i 99[12] (2015) 260-271.
-
- 21. R. Springenschmid, in “Prevention of Thermal Cracking in Concrete at Early-ages” (E&FN SPON Press, 1998) p.48.
-
- 22. K. Kovler, Mater. Struct. 27[6] (1994) 324.
-
- 23. Z. Lin, Industrial Construction. 33[7] (2003) 37-40.
- 24. Y. Wei, and W. Hansen, J. Mater. Civ. Eng. 25[9] (2013) 1277-1284.
-
- 25. T. Zhang, and W. Z. Qin, Cem. Concr. Res. 36 [3] (2006) 584-591.
-
- 26. S. A. Altoubat, and D. A. Lange, Aci Mater. J. 98[5] (2001) 386-393.
- 27. D.J. Shen, J.L. Jiang, M.Y. Zhang, P.P Yao, and G.Q. Jiang, Const. Build. Mater. 146 (2017) 410-418.
-
- 28. C. Jiang, Y. Yang, Y. Wang, Y. Zhou, and C. Ma, Constr. Build. Mater. 61[3] (2014) 260-269.
-
- 29. B. G. Kim, K. M. Lee, and H. K. Lee, Mag. Concr. Res. 55[6] (2003) 507-515.
-
- 30. P. C. Aïtcin, Concr. Int. 21[11] (1999) 54-56.
- 31. P. Lura, K. V. Breugel, and I. Maruyama, Cem. Concr. Res. 31[12] (2001) 1867-1872.
-
- 32. Ø. Bjøntegaard, T. A. Hammer, and E. J. Sellevold, Cem. Concr. Compos. 26[5] (2004) 427-435.
-
 This Article
-
2019; 20(S1): 77-85
Published on Jul 20, 2019
- Received on Dec 9, 2018
- Revised on Jun 12, 2019
- Accepted on Jun 12, 2019
Services
- Abstract
introduction
experimental program
test results and discussion
conclusions
- Acknowledgements
- References
- Full Text PDF
Shared
Correspondence to
- Weilun Wang
-
Guangdong Provincial Key Laboratory of Durability for Marine Civil Engineering; College of Civil Engineering, Shenzhen University, Shenzhen, P.R. China
Tel : ++86-755-26958863 - E-mail: wang_weilun@hotmail.com
Clean-Energy Research Institute(CRI), Hanyang University, 222, Wangsimni-ro, Seongdong-gu, Seoul, 04763, Korea
E-mail: jcpr@hanyang.ac.kr