


- Effect of lead sulfate on chloride ion transport properties in cementitious material
Xianfeng Wang, Yabin Yuan, Yingxin Huang, Tielin Han, Weilun Wang*, Jian Liu* and Feng Xing
Guangdong Key Laboratory of Durability in Coastal Civil Engineering, College of Civil Engineering, Shenzhen University, Shenzhen, Guangdong 518060, P.R. China
A novel microcapsule-based self-healing system was developed in Guangdong Key Laboratory of Durability in Coastal Civil Engineering to prolong the concrete service life, in which lead sulfate is used as the shell material of the microcapsules. The self-healing system is triggered by the reaction of lead sulfate with chloride ion. In this study, the effect of lead sulfate on chloride ion transport in cement-based materials was investigated. The bulk diffusion and rapid chloride migration tests were carried out. The time dependence of chloride diffusion was analysed based on the results of the Bulk diffusion test. The change in the microstructure of cement-based materials upon incorporation of lead sulfate was observed and analysed via mercury intrusion porosimetry and scanning electron microscopy. Results showed that chloride-binding was prevalent at an immersion period of less than 90 days, while sulfate attack superseded after 90 days. Therefore, the impact of both factors needs to be considered when utilizing lead sulfate as a shell material in cementitious materials.
Keywords: Chloride ion, Lead sulfate, Transport, Bulk diffusion, Rapid chloride migration (RCM), Time-dependent diffusion
Cracking of reinforced concrete structures is inevitable. However, cracks in concrete can accelerate the entry of moisture and air containing deleterious substances such as chloride ions into concrete, resulting in lack of concrete durability. The durability of concrete is very important to the construction industry [1, 2]. Concrete structures, especially marine structures, inevitably deteriorate over time. This deterioration occurs in different forms, e.g. concrete deterioration, steel corrosion, or a combination of both. The maintenance cost for the deterioration of concrete structures is very expensive, and the means and effect of repairing are limited. In order to overcome the deterioration of concrete structures, recently, microcapsule self-healing concrete based on the principle of bionics were proposed. With its intelligent perception and immediate healing characteristics, microcapsule self-healing concrete can effectively prolong the service life of marine structures.
Various types of microcapsule self-healing concrete were developed in the Guangdong Key Laboratory of Durability in Coastal Civil Engineering [3-10] since 2008. The microcapsule self-healing system was divided into physical systems, chemical systems, and microbial systems [11]. Current chemical systems are usually triggered by hydrogen ions. When the hydrogen ion content in the concrete environment reach a critical value, the wall of the microcapsule in the concrete is broken and flows out the repairing liquid to repair the inner microcrack of concrete. Although the embedded steel bars in concrete structures are protected by the highly alkaline environment [12] and the cover of concrete. However, when a concrete structure is exposed to chloride, the chloride invades the concrete matrix through the microcrack of concrete and accumulates near the surface of steel bars, and when the concentration of chloride ions reaches a critical value, pitting corrosion occurs, thus accelerating the corrosion of steel bars [13]. The trigger object that damages the microcapsules is not directly harmful to the steel bars. Chloride penetration is just a proven main and direct contributor to the corrosion of reinforcement steel bars in concrete [14]. Based on the chemical property of chloride, researchers proposed a concept of a chloride-triggered microcapsule self-healing system [15]. In an experimental case, lead sulfate was embedded on an organic compound such as hexadecane/poly-methyl methacrylate (PMMA) to form a chloride-responding microcapsule wall [16]. The self-repairing system of such microcapsules can directly trigger corresponding to the chloride ion content, which has obvious advantages compared with the former. However, lead sulfate can attack concrete. Sulfate attack is quite a complex process, which couples ionic transport to chemical reaction and mechanical damage [17, 18]. Moreover, sulfate attack has different deterioration phenomena for different positive ions associated with SO42-. Sodium sulfate attack will result in expansive reaction products, while magnesium sulfate attack will result in a reduction in strength [19]. Consequently, lead sulfate (PbSO4) may have a different effect due to the complex reaction between chloride, cement hydrates, and lead sulfate. The presence of sulfate leads to a higher chloride concentration, less chloride binding, and higher values of chloride diffusion coefficient, in general [20]. Furthermore, chloride penetration increases when the sulfate content increases during short immersion periods [21]. However, relatively few studies about the influences of lead sulfate on chloride transportation have been reported.
In order to study the effect of lead sulfate on chloride transport, it is necessary to understand the existence of chloride ions in concrete and how to measure the chloride ion content in concrete. Chloride in cement-based materials exist as either free or bound. Free chloride are chloride ions in the pore solution [22], while bound chloride are those chemically bonded to cement hydrates or physically adsorbed at the pore walls. Importantly, corrosion can only be initiated by free chloride ions [21]. In addition, free chloride has a linear relationship with the total chloride content [23, 24]. Several methods have been developed to measure the chloride ion content. Methods for the determination of total chloride ions in cement-based materials were standardized by Berman [25]. The standard method involves extremely accurate chemical analysis and cautious sample preparation. Two other methods used to determine the chloride ion content involve measuring free- and water-soluble chloride. The free-chloride content in a cement-based material and water-soluble chloride are different. Based on the method adopted, the amount of chloride ions released to the solution depends on factors like the fineness of the ground sample, the volume of water added, the temperature, agitation process, and time arranged [22]. However, given enough time and water, all chloride can be reclaimed by the solutions [26]. Hence, the relationship among free chloride, total chloride, and water-soluble chloride are yet unclear.
To understand the transport of chloride ions in concrete, several laboratory and field tests using experimental methods have been conducted. The transportation theory of chloride ions in concrete materials has been reported [27, 28] and the time-dependence of chloride diffusion coefficients had been discussed [29, 30]. For ionic diffusion, two common test methods, the salt ponding test in accordance with AASHTO T259 or ASTM C1543 and bulk diffusion test in accordance with NT Build 443 or ASTM C1556, were used to determine the chloride permeability of concrete. However, both methods are time-consuming. To shorten the test duration, alternative test methods based on the electro-migration of ions have been proposed. This involves the rapid chloride permeability (RCP) test in accordance with AASHTO T 277 [31] and the rapid chloride migration (RCM) test in accordance with AASHTO TP 64-03 [32]. Andrade and Whiting compared the chloride ion diffusion coefficients derived from concentration gradients with those from non-steady state accelerated ionic migration conforming to ASTM C 1202-05 2005. Ashish et al. [33] studied the effect of chloride on the ground granulated blast furnace slag concrete. It has been demonstrated that the mechanisms of transportation of chloride in concrete may be different in the presence of an applied electrical field.
Considering the low permeability of the aggregate, mortar specimens were employed in this study. The effect of lead sulfate on the permeability of chloride in cement-based materials was investigated through bulk diffusion (BD) test, at immersion periods of 70, 90, and 140 days. The influence of an external electric field on the chloride permeability of mortar specimens containing lead sulfate was investigated by conducting a rapid chloride migration (RCM) test. The effect of lead sulfate on the micro-pore structure of mortar and hydrates of cement were measured by mercury intrusion porosimetry (MIP) analysis and detected by environmental scanning electron microscopy (SEM). The time-dependent diffusion was determined based on the results of the BD test.
Three types of mortar were casted in this investigation. One was plain mortar without any admixture, while the other two were modified by the addition of different quantities of lead sulfate.
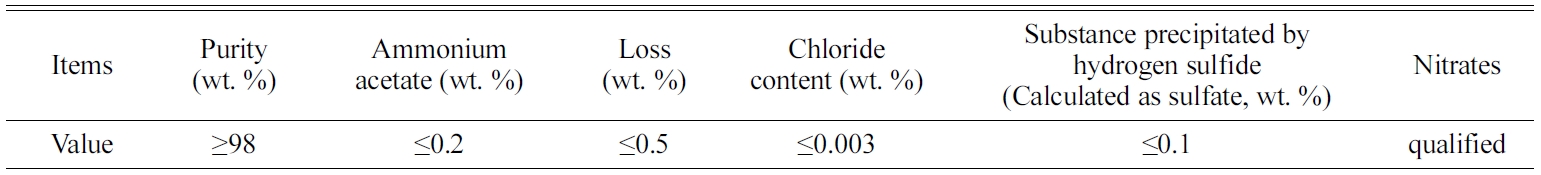
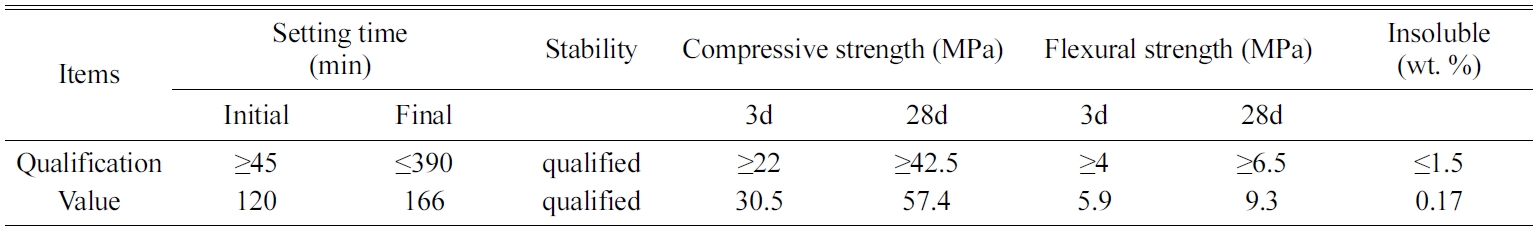
A Chinese standard 42.5 R type II Portland cement (similar to ASTM type one ordinary Portland cement) was used to produce all mortars. River sand with a fineness modulus of 3.0, made by Xiamen Isiou Corporation, was added as a fine aggregate. A class AR lead sulfate was supplied by Shanghai Zhanyun Chemical Corporation. The technical parameters of the lead sulfate are shown in Table 1. The chemical composition and physical properties of cement are presented in Tables 2 and 3, respectively.

Three kinds of mortar were prepared in this study. The first one is a plain mortar (P0) without lead sulfate. In the other two mixes (P4 and P6), sand is replaced partly with 4% or 6% lead sulfate (by cement mass). Ratios of water to cement and sand to cement were 0.5 and 1:3, respectively.
From each mortar mix, two sets of samples with different dimensions were cast at room temperature using different plastic moulds. Samples used for the BD test at immersion periods of 70, 90, and 140 days were 50 mm long and 100 mm in diameter. Another specification, with length and diameter both at 100 mm, was prepared for the RCM test. Each group contains three samples. All mortars were initially covered with wet burlap and plastic for 24 h. After demoulding, all the cylinders were cured at 20 ℃ and 95% relative humidity. After preparing and curing the specimen, a series of 100 mm cylinders were obtained for the BD and RCM tests. Test procedures are described in the following section.
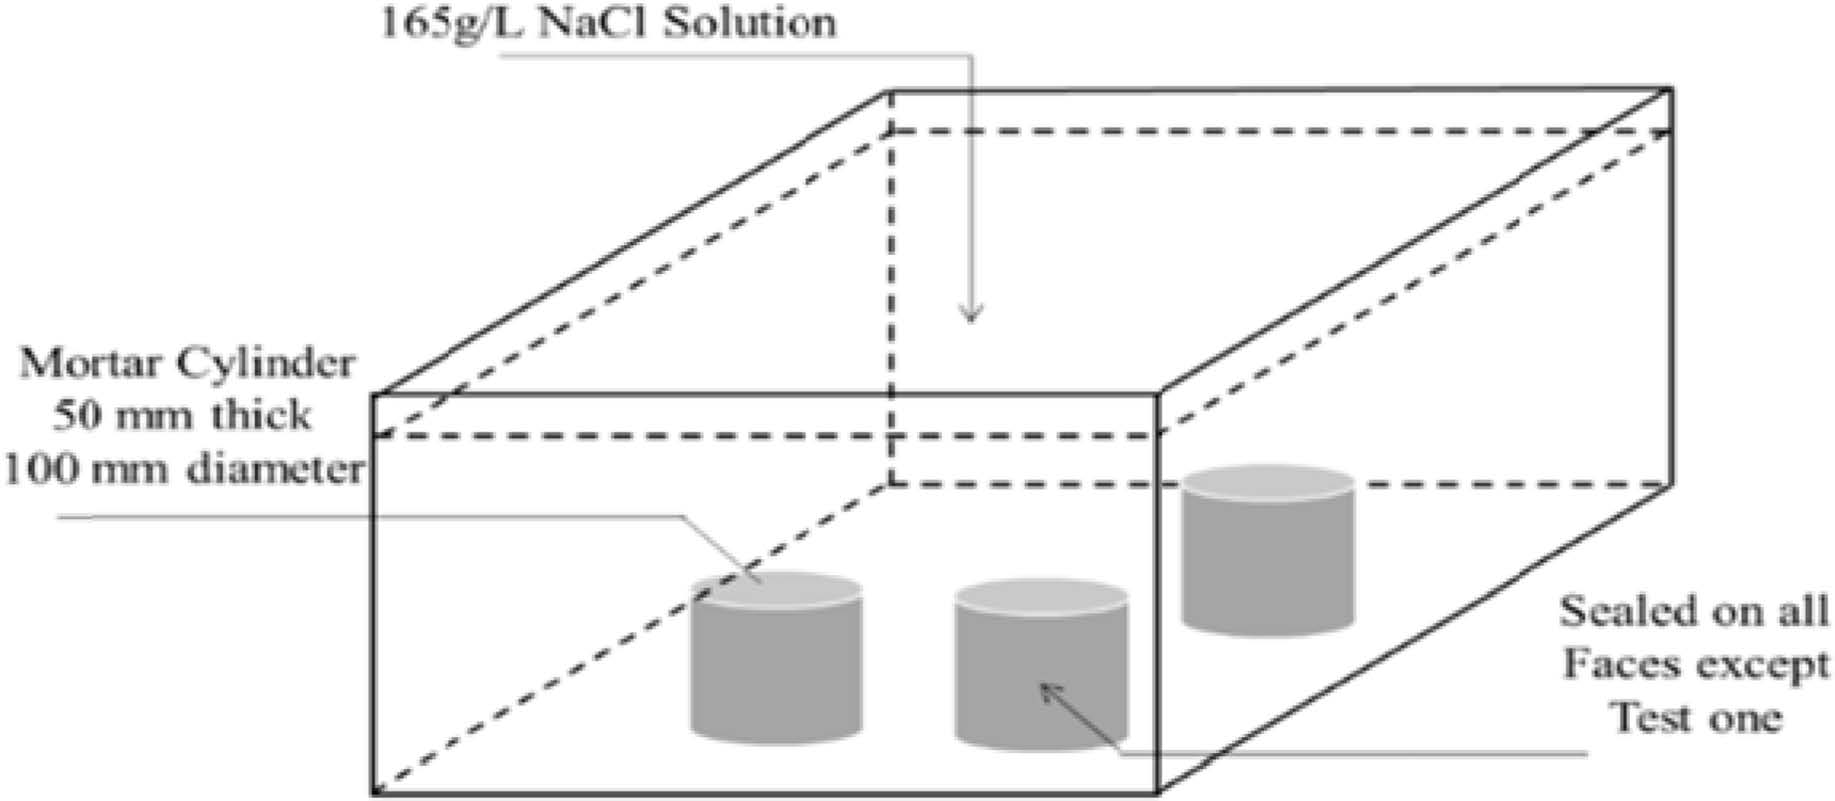
The apparent diffusion coefficient for each mortar mixture was detected using a BD test in accordance with NT Build 443. Here, three exposure periods of 70, 90, and 140 days were adopted. Epoxy was applied on all sides of the sample except for the test face. The samples were then saturated with water as described in NT BUILD443. This process prevents initial sorption when the solution first contacts the specimens. All mortars were sealed in plastic containers with the top face exposed to a 165 g/L NaCl solution at 23 ℃ (see Fig. 1) for specified periods.
After removing from sodium chloride solution, the samples were profile-ground on a milling machine using a 35-mm diameter diamond-tipped bit. The mortars were then profile-ground using different processing methods for different test periods. Samples from the 70-day BD test were ground until 15 mm from the surface with each layer at 1 mm. Samples from the 90-day BD test were ground until 20 mm from the surface with each layer at 1 mm. Lastly, specimens from the 140-day BD test were ground until 40 mm from the surface with 1-mm layers from 0 to 20 mm depth and 2-mm layers from the depth of 20 to 40 mm. The powdered samples were dried in an oven at 105 ℃ for 24 hrs. According to the method of AASHTO Designation: T 260-97, the samples were subjected to a water dissolution process, and then filtered to remove excess solids. The measurement of water-soluble chloride content at different depths was performed by automatic potentiometric titration of silver nitrate of the remaining solution. The resulting plot of chloride percentage content versus depth was fitted with the simple closed-form solution (see Eq. (1)) of Fick’s Second Law to determine the apparent diffusion coefficient, Da, and the surface concentration, Cs.
Furthermore, the background chloride concentration, i.e. the chloride in the original mix, was subtracted from the water-soluble chloride ion concentration determined for all depths. A curve-fitting procedure was used to determine Cs (surface concentration) and Da (apparent diffusion coefficient) from the data using a non-linear, least-squares methods, based on Eq. (1). The best-fit curve was determined by adjusting both unknowns to achieve the highest correlation coefficient,
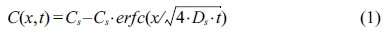
where, C(x,t) represents the chloride concentration at the depth x and time t in mortar %; Cs is the boundary condition at the exposed surface in mortar %; x refers to the depth under the exposed surface (to the middle of a layer) in m; t is the exposure time in s; Da refers to the apparent diffusion coefficient in m2/s; and erfc is the complementary error function.
|
Fig. 1 Bulk diffusion test setup. |
Each mortar mixture was removed from the standard curing room after 60 days. From these cylinders, samples of 50 mm in height were sliced for the RCM test (one sample from each cylinder, 50 mm of the outermost surface of each cylinder were cut off) and submerged in water. A day prior to the RCM test, all samples were saturated with limewater under vacuum conditions. The vacuum saturation was conducted according to the procedure described in ASTM C 1202-05: surface-dry samples were placed vertically in a desiccator connected to a vacuum pump and a pressure (4000 Pa) was applied for 3 hrs. Subsequently, samples were completely immersed in limewater. The vacuum condition was retained for an hour before allowing air into the desiccator. The samples were kept in the solution for 18 hrs.
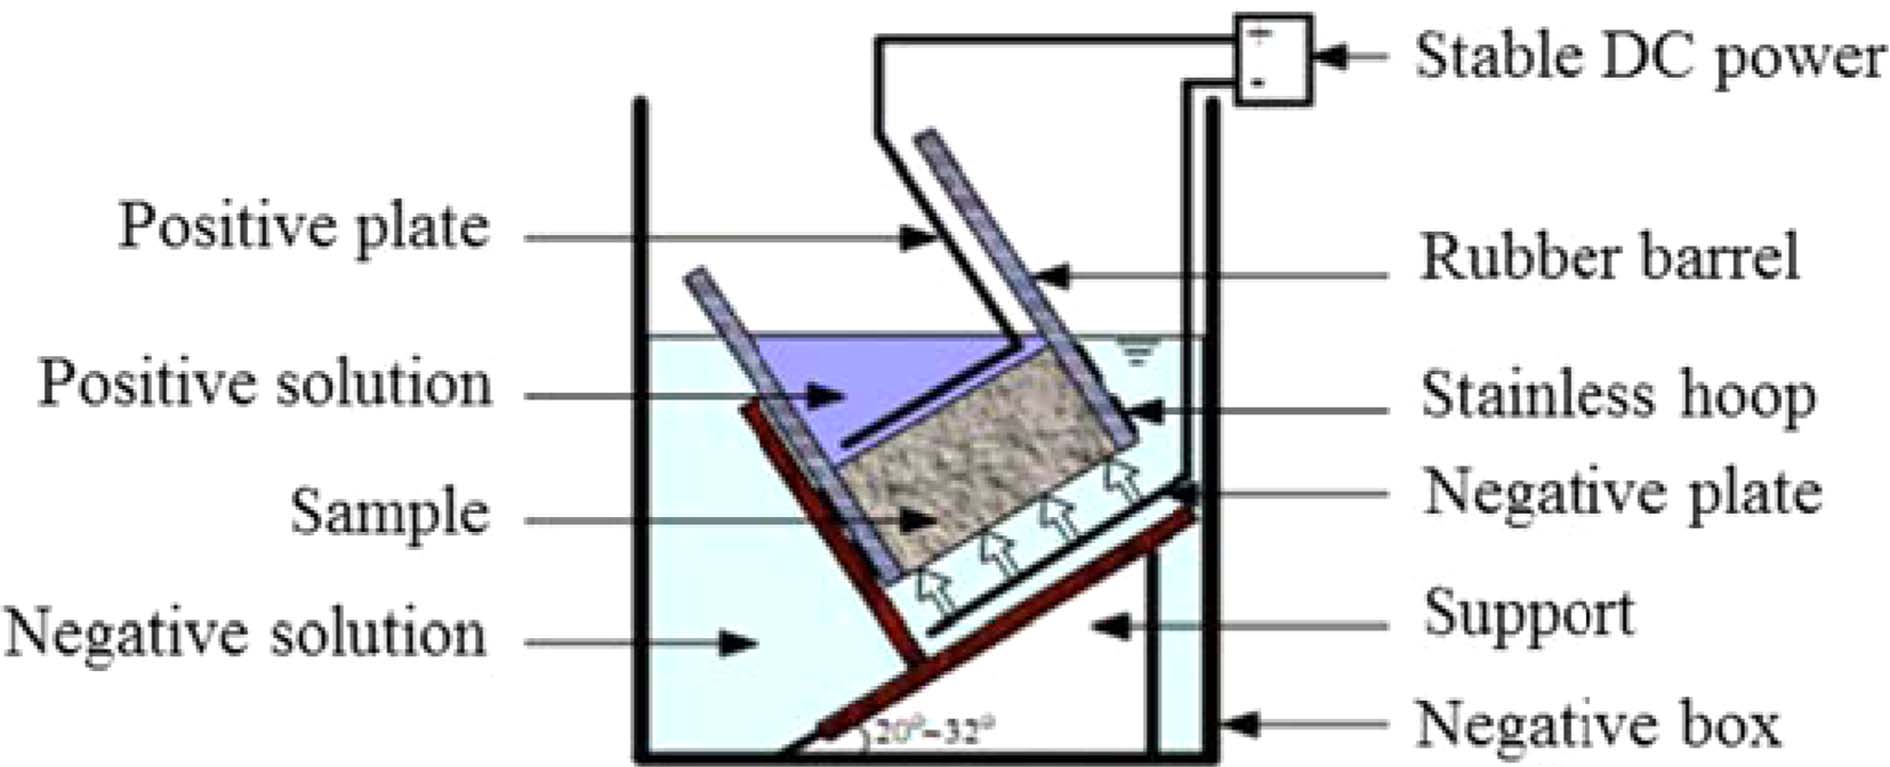
The RCM test was performed on the saturated samples after 61 days. A power source by Weiye Company (Beijing, China) designed for the RCM test according to NT BUILD492 was used in this study. The schematic diagram of the RCM test setup is shown in Fig. 2. All samples were tested simultaneously. A total volume of 14 L catholyte (10% sodium chloride solution) for all samples and approximately 0.3 L of the anolyte (0.3 M sodium hydroxide solution) for per sample were used.
After the migration test, three mortar samples were split into two. One piece was sprayed with a 0.1 M silver nitrate solution to determine the penetration depth of chlorides. The other piece was profile ground on the milling machine similar to the process described in the other Section. 10-mm diameter diamond-tipped bit was used to grind the samples. The grinding depth and layer thickness were set as follows: at 0-10 mm, 1 mm of each layer; and at 10-42 mm, 2 mm of each layer. Subsequently, chloride content was measured using the collected powder as described in the other Section 3.1.
The non-steady-state migration coefficient of chloride was calculated by employing the average penetration depth from Eq. (2) (NT Build 492),
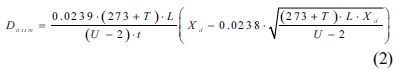
where Dnssm refers to the chloride non-steady-state migration coefficient at ×10-12 m2/s; T refers to the average value of the initial and final temperatures in the anolyte solution at ℃; U refers to the absolute value of the applied voltage in V; Xd refers to the average value of the penetration depths in mm; t refers to the test duration in h; and L refers to the thickness of the specimen in mm.
|
Fig. 2 Test setup for rapid chloride migration. |
The SEM observation was conducted using a Quanta TM 250FEG environmental scanning electron microscope from FEI. Samples with dimension less than 10 mm × 10 mm × 10 mm was cut from corresponding mortar specimens after immersing for 70, 90, and 140 days. The obtained samples were then immersed in anhydrous ethanol for a week to halt cement hydration. Thereafter, the samples were placed in an oven at 105 ℃ for 24 hrs to evaporate water. Before observation, the prepared samples were wrapped with a ribbon of conductive paper to strengthen their electrical conductivity. Finally, the cement-based materials were observed at 20K magnification.
Mercury intrusion porosimetry (MIP) is widely used for characterizing the pore size distribution in cementitious materials. The principle of MIP is based on the premise that a non-wetting liquid (liquid with a contact angle larger than 90 o) will only intrude the capillary under pressure. The relationship between the pressure and capillary diameter is described by Washburn [34] as
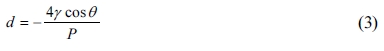
where d refers to the pore size in mm; γ refers to the mercury surface tension at 0.484 N/m; θ refers to the contact angle of the mercury with the pore wall at 117 o; and P is the mercury pressure of the injected sample in Pa. The pore size distribution was determined from the volume of liquid that intruded at each pressure increment. Total porosity was determined from the total volume of liquid that intruded.
Here, an Auto Pore 9500 type testing machine from Micromeritics Corporation (Norcross, GA, USA) was utilized. The samples were obtained by the same method described in the other Section. Both low-pressure and high-pressure analyses were performed. First, a vacuum condition of less than 40 mm Hg air pressure was obtained. The mercury then intruded at a low-pressure range of 0.54-29.98 psia. The corresponding pore sizes ranged from 6 to 350 mm. The high-pressure test was implemented in a similar manner. The pressure range of 36.4-29,906.6 psia corresponded to the measured pore size range of 6.05-4964 nm.
Chloride profiles from the bulk diffusion test and rapid chloride migration test
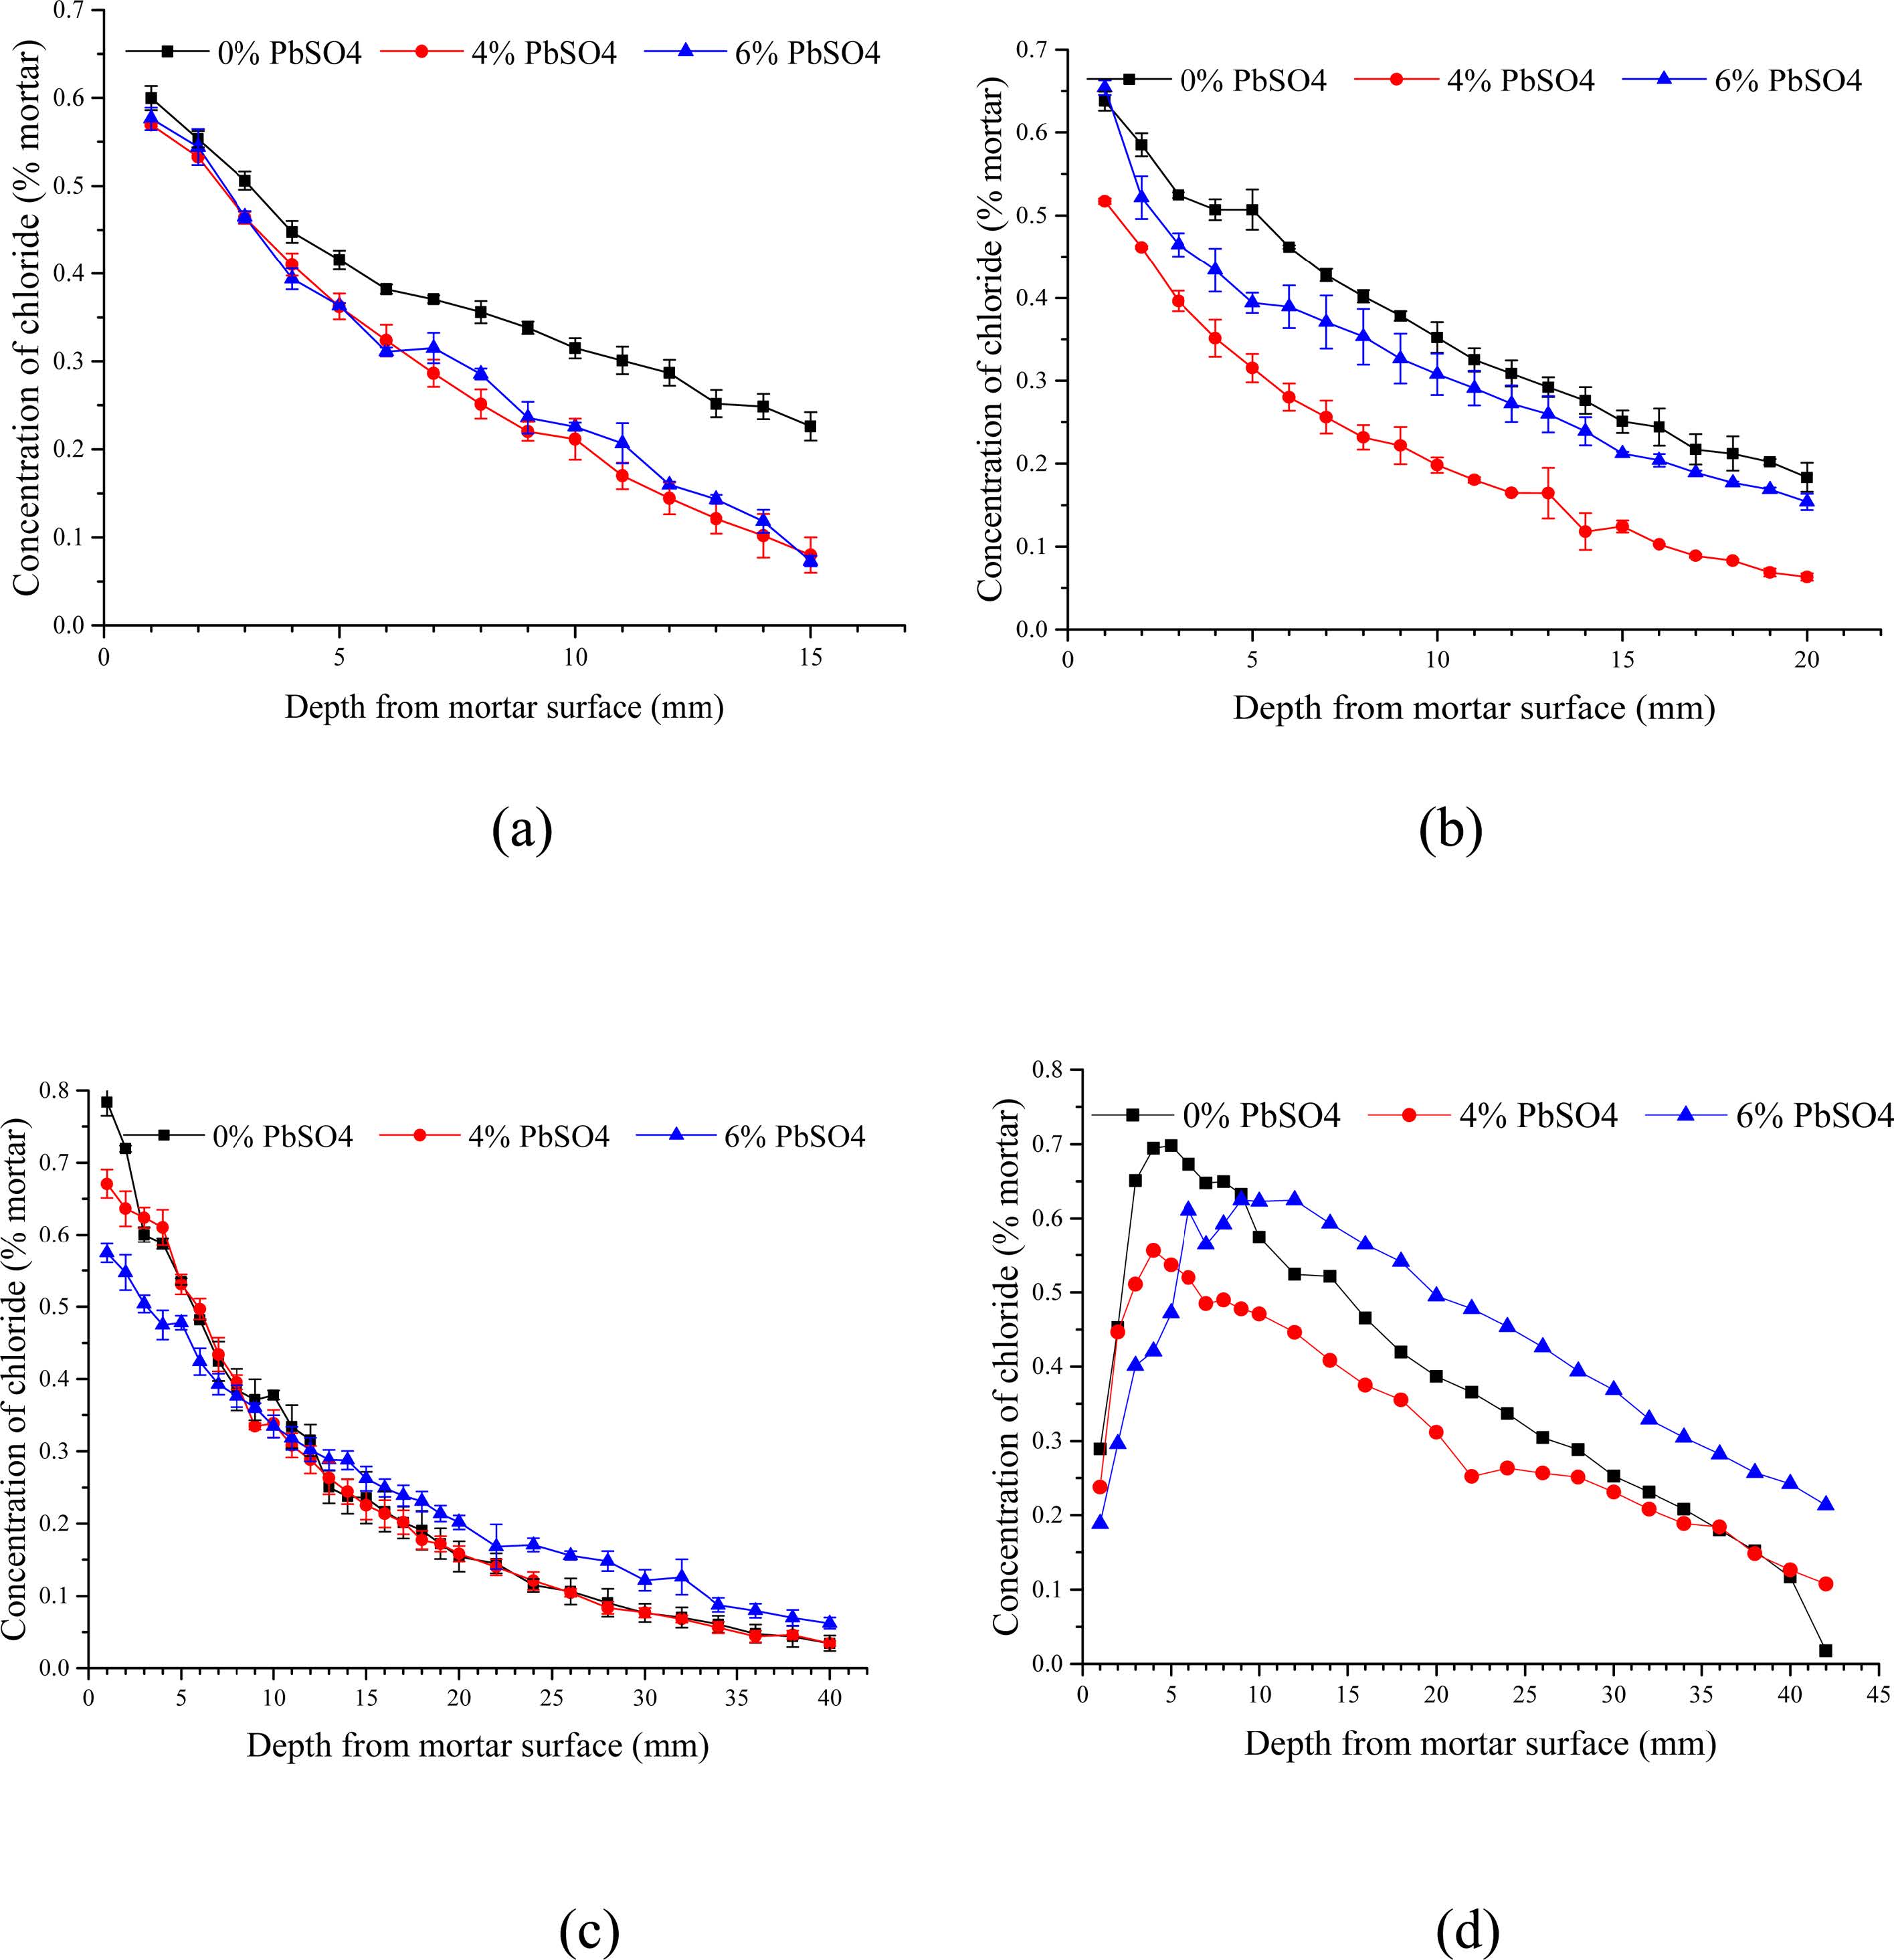
The chloride contents of powdered samples taken from both BD and RCM tests are shown in Fig. 3. Significant amounts of chloride diffused into the specimens over the period of the BD and RCM tests. Observably, all curves from the BD test declined drastically after measuring beyond the mortar surfaces.
Fig. 3(a) shows the chloride profiles of the 70-day immersion samples. Evidently, the lines of samples with and without lead sulfate have different shapes. Moreover, the chloride profile of the former at each depth is significantly smaller than that of the latter. In addition, the chloride content of samples with different quantities of lead sulfate were nearly constant. The chloride percentage of the 90-day immersion samples is shown in Fig. 3(b). Both P4 and P6 mortars have a lower value than P0 mortar. Unlike the 70-day immersion samples, the chloride profile of the P6 mortars is larger than that of the P4 mortars. Fig. 3(c) displays the chloride profile of the 140-day immersion samples. The relationship among the chloride percentage content of the P0, P4, and P6 mortars is notably different from those in the previous tests with different periods. The chloride percentage of the P6 mortar is larger than that of the other two mixes with that of the P0 mortar being next.
Unlike the BD test, curves of the RCM test have similar shapes; they all have a peak range from 5 to 10 mm depth followed by a sharp drop after the peak. The chloride profile of P6, P0, and P4 mortars are represented by the top, middle, and bottom curves, respectively.
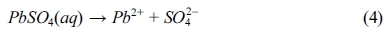
Chloride can react with lead sulfate (PbSO4), after it penetrates through the pores of the cementitious material. The chemical reaction is extremely complex. At first, water dissolves lead sulfate forming SO42- and Pb2+ (Eq. (4)). Pb2+ then appears to form a maximum of four consecutive chloride complexes in the solution (Eqs. (5) to (8)), though the reaction is reversible depending on the concentration. For a different medium environment, the chloride complexes are different [35, 36].
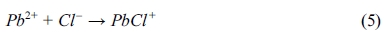
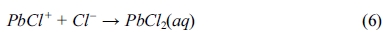
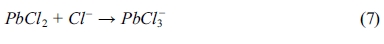
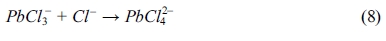
As shown in Eqs. (5) to (8), regardless of reaction mechanism, chloride ions would be bound to lead sulfate while sulfate ions are being released to the pore solution. Lead sulfate binding has a remarkable effect on the chloride distribution. It decreases the amount of free chloride. This explains the decrease of chloride content after the addition of lead sulfate in all the samples displayed in Fig. 3. However, there is an abnormal relationship between the P0 and P6 mortar in Figs. 3(c) and 3(d). This can be attributed to the time dependence of the sulfate attack. Observably, lead sulfate invades the pore solution while binding with the chloride. This will be further discussed in the following section of this paper.
|
Fig. 3 Chloride profiles of the mortars after 70day (a), 90day (b) and 140day (c) BD test. (d) Chloride profiles of the mortars after RCM test. |
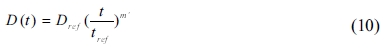
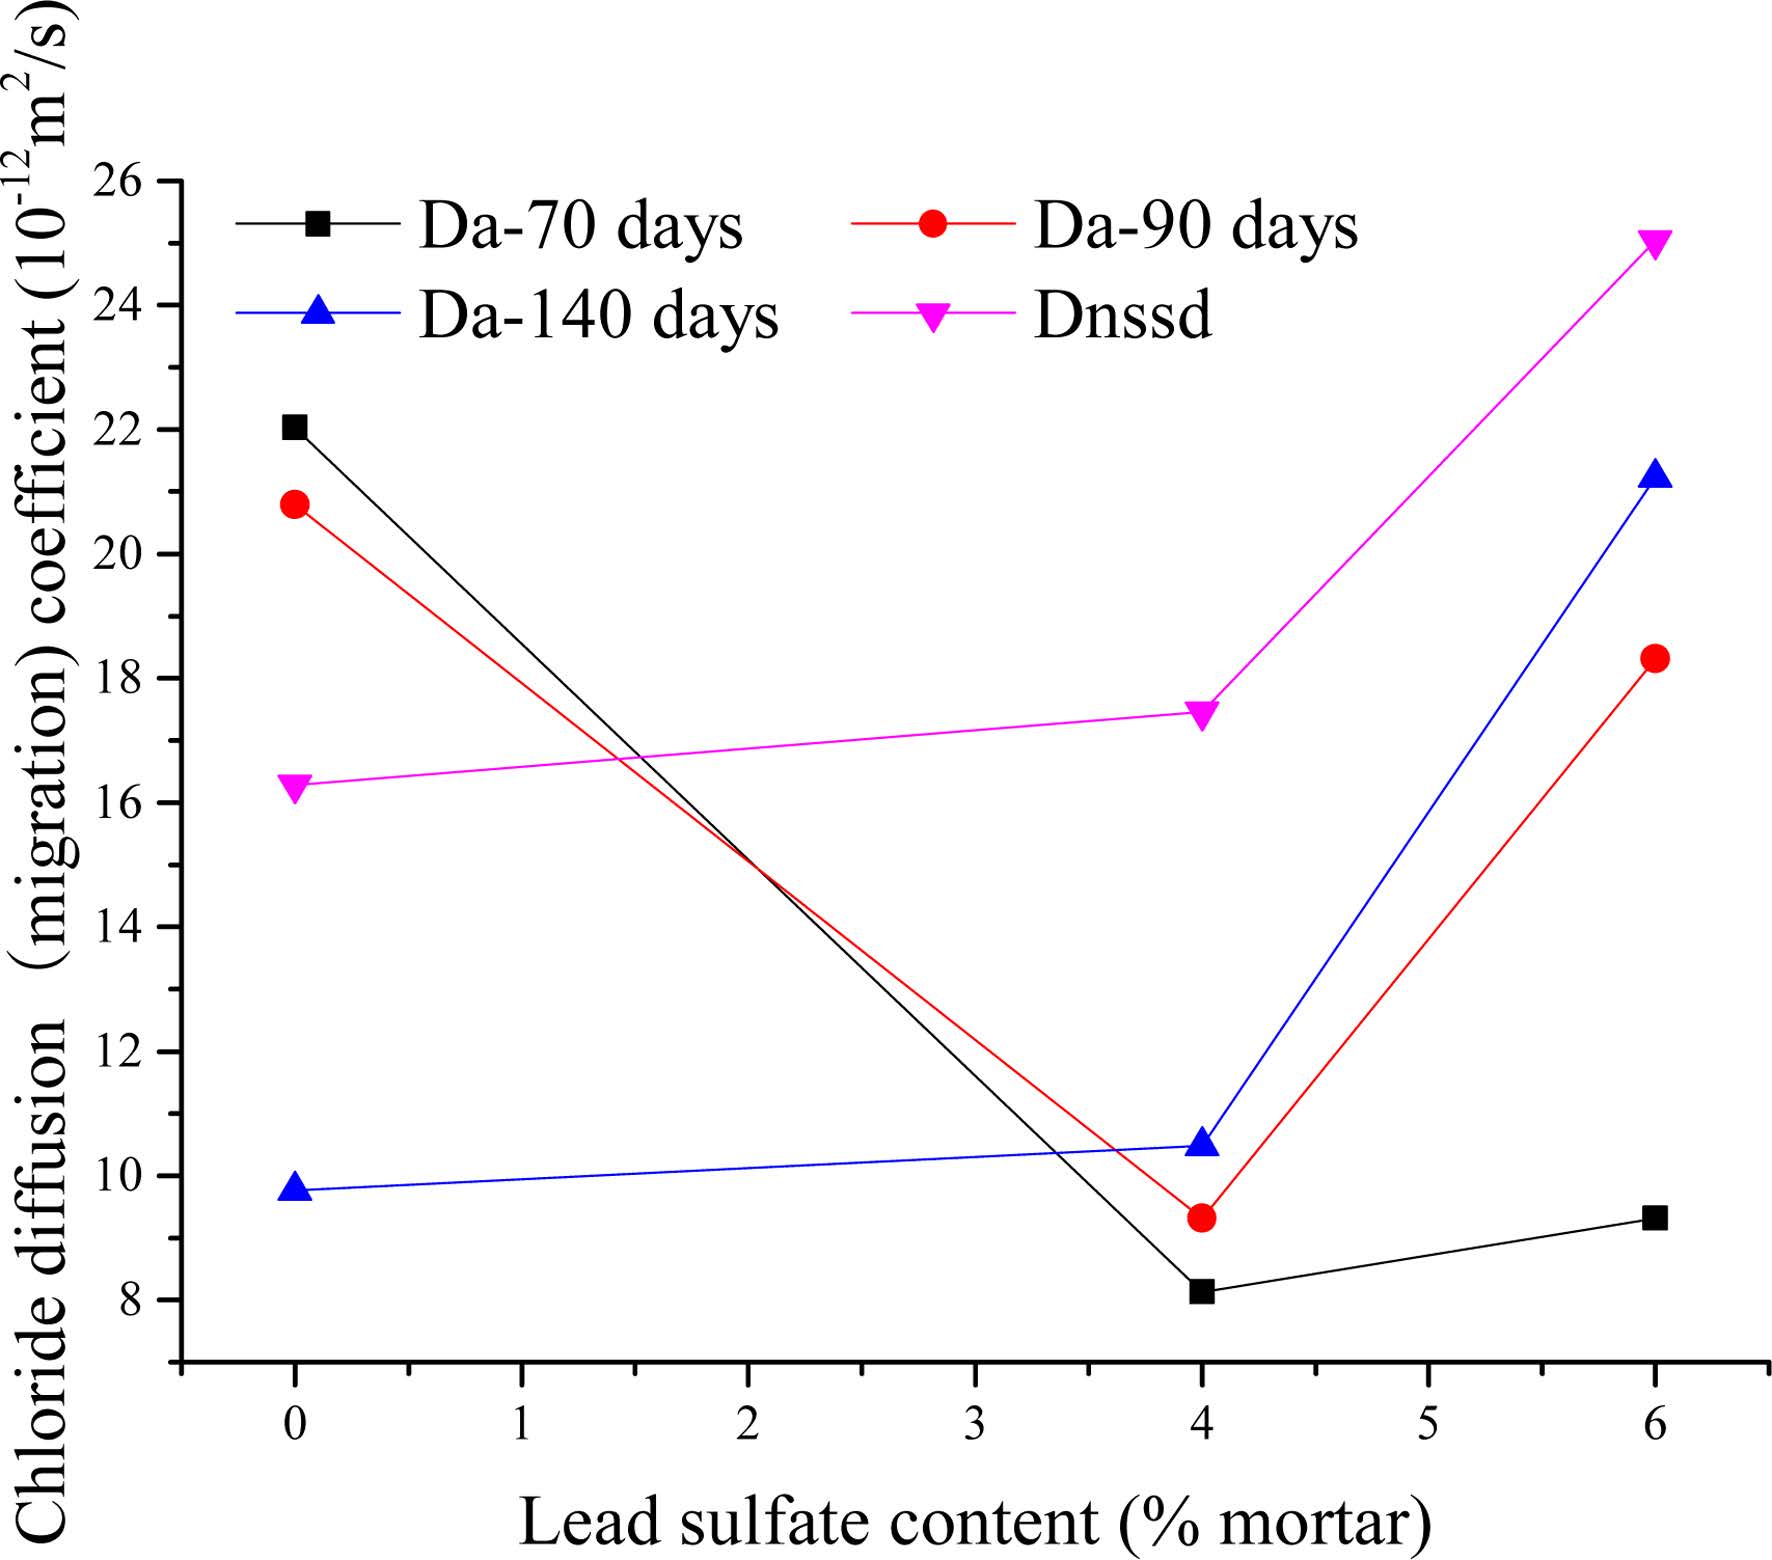
The chloride profiles of the bulk test mortars were used to calculate the apparent diffusion (Da) in accordance with Eq. (1). The average value of chloride diffusion depth (Xd) measured from the RCM test was employed in Eq. (2) to calculate the non-steady-state migration coefficient (0nssm). The values of Da and Dnssm are shown in the Fig. 4.
At 70 days of immersion time, when the relative amount of lead sulfate ranges from 0% to 6%, the apparent chloride diffusion coefficient decreases from 22.03 × 10⁻¹² m2/s to 8.13 × 10⁻¹² m2/s at first and then increases to 9.31 × 10⁻¹² m2/s. The 90-day immersion mortars exhibited a similar behaviour. Moreover, the diffusion coefficient values were larger than the 70-day mortars except for the sample without lead sulfate. Notably, the difference of coefficient values between P6 and P0 mortars in 90 days is larger than that in 70 days. The value of Da increases with the rise of lead sulfate content when the immersing time reaches 140 days.
Furthermore, the value of Da shows a declining trend when lead sulfate content is at 0%. Chloride diffusion coefficient varies with time exponentially given by [37]:
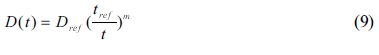
where D(t) is the diffusion coefficient at time t; Dref is the diffusion coefficient at some reference time tref; and m is the content, depending on the components of mixture.
The reduction coefficient m is determined using Eq. (9). The apparent diffusion values calculated using Eq. (1) were plotted versus time on a log-log scale. A linear regression analysis of the data was used to determine the value of m. Published values of m typically use the maturity achieved at the end of the exposure period as the time basis [38-40]. It is not accurate because the diffusion coefficient is regarded as a constant. In this paper, an intuitive approach was adopted to measure the reduction coefficient using Eq. (9). However, the average age is plotted while exposed to the chloride solution as time basis. For example, a specimen exposed for a 70-day period from 60 to 130 days would yield an average age of 95 days. The value of m for the P0 mix mortar is 2.74, larger than the value in Ref. [37]. The discrepancy may be caused by a non-containing coarse aggregate proportion and the high w/c ratio of the sample in this paper. The capillary pore system will be filled as hydration products continue to form [38].
As detailed in Fig. 4, it is unusual that the diffusion coefficient exhibits an upward trend when the lead sulfate content is held constant at 4% or 6%. As discussed in the above Section, chloride can react with lead sulfate resulting in sulfate degradation. This means a more complex pore microstructure exists in the mortars which will be discussed in the following Section. According to the diffusion coefficients calculated from P4 and P6 specimens, a new function was developed based on Eq. (9).
where D(t) is the diffusion coefficient at time t; Dref is the diffusion coefficient at some reference time tref; and m’ is the content (depending on the components of mixture).
The method of calculating the m’ value of P4 and P6 mortar is similar to that for the P0 mortar. The values of P4 and P6 mortars are 0.77 and 2.32, respectively. This demonstrates that higher lead sulfate contents results in a larger increment coefficient.
Bulk diffusion and rapid migration are controlled by the same principle and are both regulated by the diffusivity or mobility of ions. This means that if the electrolyte compositions are equal, movements of ions will follow the same pattern for bulk diffusion and for rapid chloride migration. This explains the resemblance in the shape of the curves of Da (140 days) and Dnssm. However, the value of Da (140 days) is larger than Dnssm, which can be attributed to the samples in 140 days bulk being older than that in the RCM test. Consequently, the capillary pore would be filled by cement hydrates more for the former.
|
Fig. 4 Chloride diffusion coefficients of BD test and RCM test. |
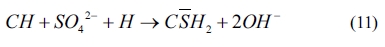
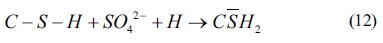
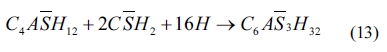
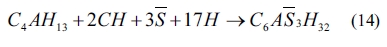
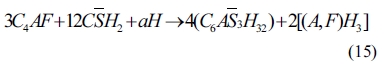
As shown in Eqs. (4) to (8), sulfates would be released and subsequently bind to chloride ions. The continuous consumption of lead ions promoted the reverse of reaction (4). However, the released sulfates would cause a sulfate attack on the cementitious materials as well. This results in an extremely complex system, which involves ionic transport, chemical reaction, and mechanical damage described in AASHTO T 260-97. Sulfate can react with calcium hydroxide to form calcium sulfate (gypsum). Calcium sulfate can subsequently react with C3A, usually via the formation of mono-sulfoaluminate, to form ettringites [39, 18] as shown in Eqs. (11) to (16). These two reaction products, gypsums and ettringites, lead to the reduction of strength, densification of the microstructure, and even expansion and cracking [41].
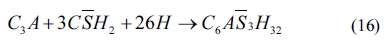
The ettringite crystal has a needle-like, hexagonal shape [18,42]. Fig. 5 shows needle-like crystals observed from SEM after the completion of the bulk test. Accordingly, relatively few needle-like substances appeared in the P0 mortar specimens across all the bulk test periods. However, a significant increase of needle-like products was observed in the P4 mortar mixture. Ultimately, P6 specimens presented the greatest number of hexagonal products. Results reveal that higher lead sulfate content produces more needle-like crystals. Furthermore, Fig. 5 suggests that needle-like hexagonal crystals increase with immersing time at equal lead sulfate content. After 90 days, pores in these mortars were filled by needle-like crystals. With further exposure, these crystals continue to be produced in the pores, resulting in crack formation. From Fig. 5, we can see that (P6)140d mortars have the most needle-like substances. Therefore, the cracking of these mortars accelerates chloride diffusion explaining the abnormal relationship between P6 and P0 chloride profile in 140-day BD and RCM tests.
|
Fig. 5 SEM images of the specimens after bulk diffusion test under 10μm scale bar. |
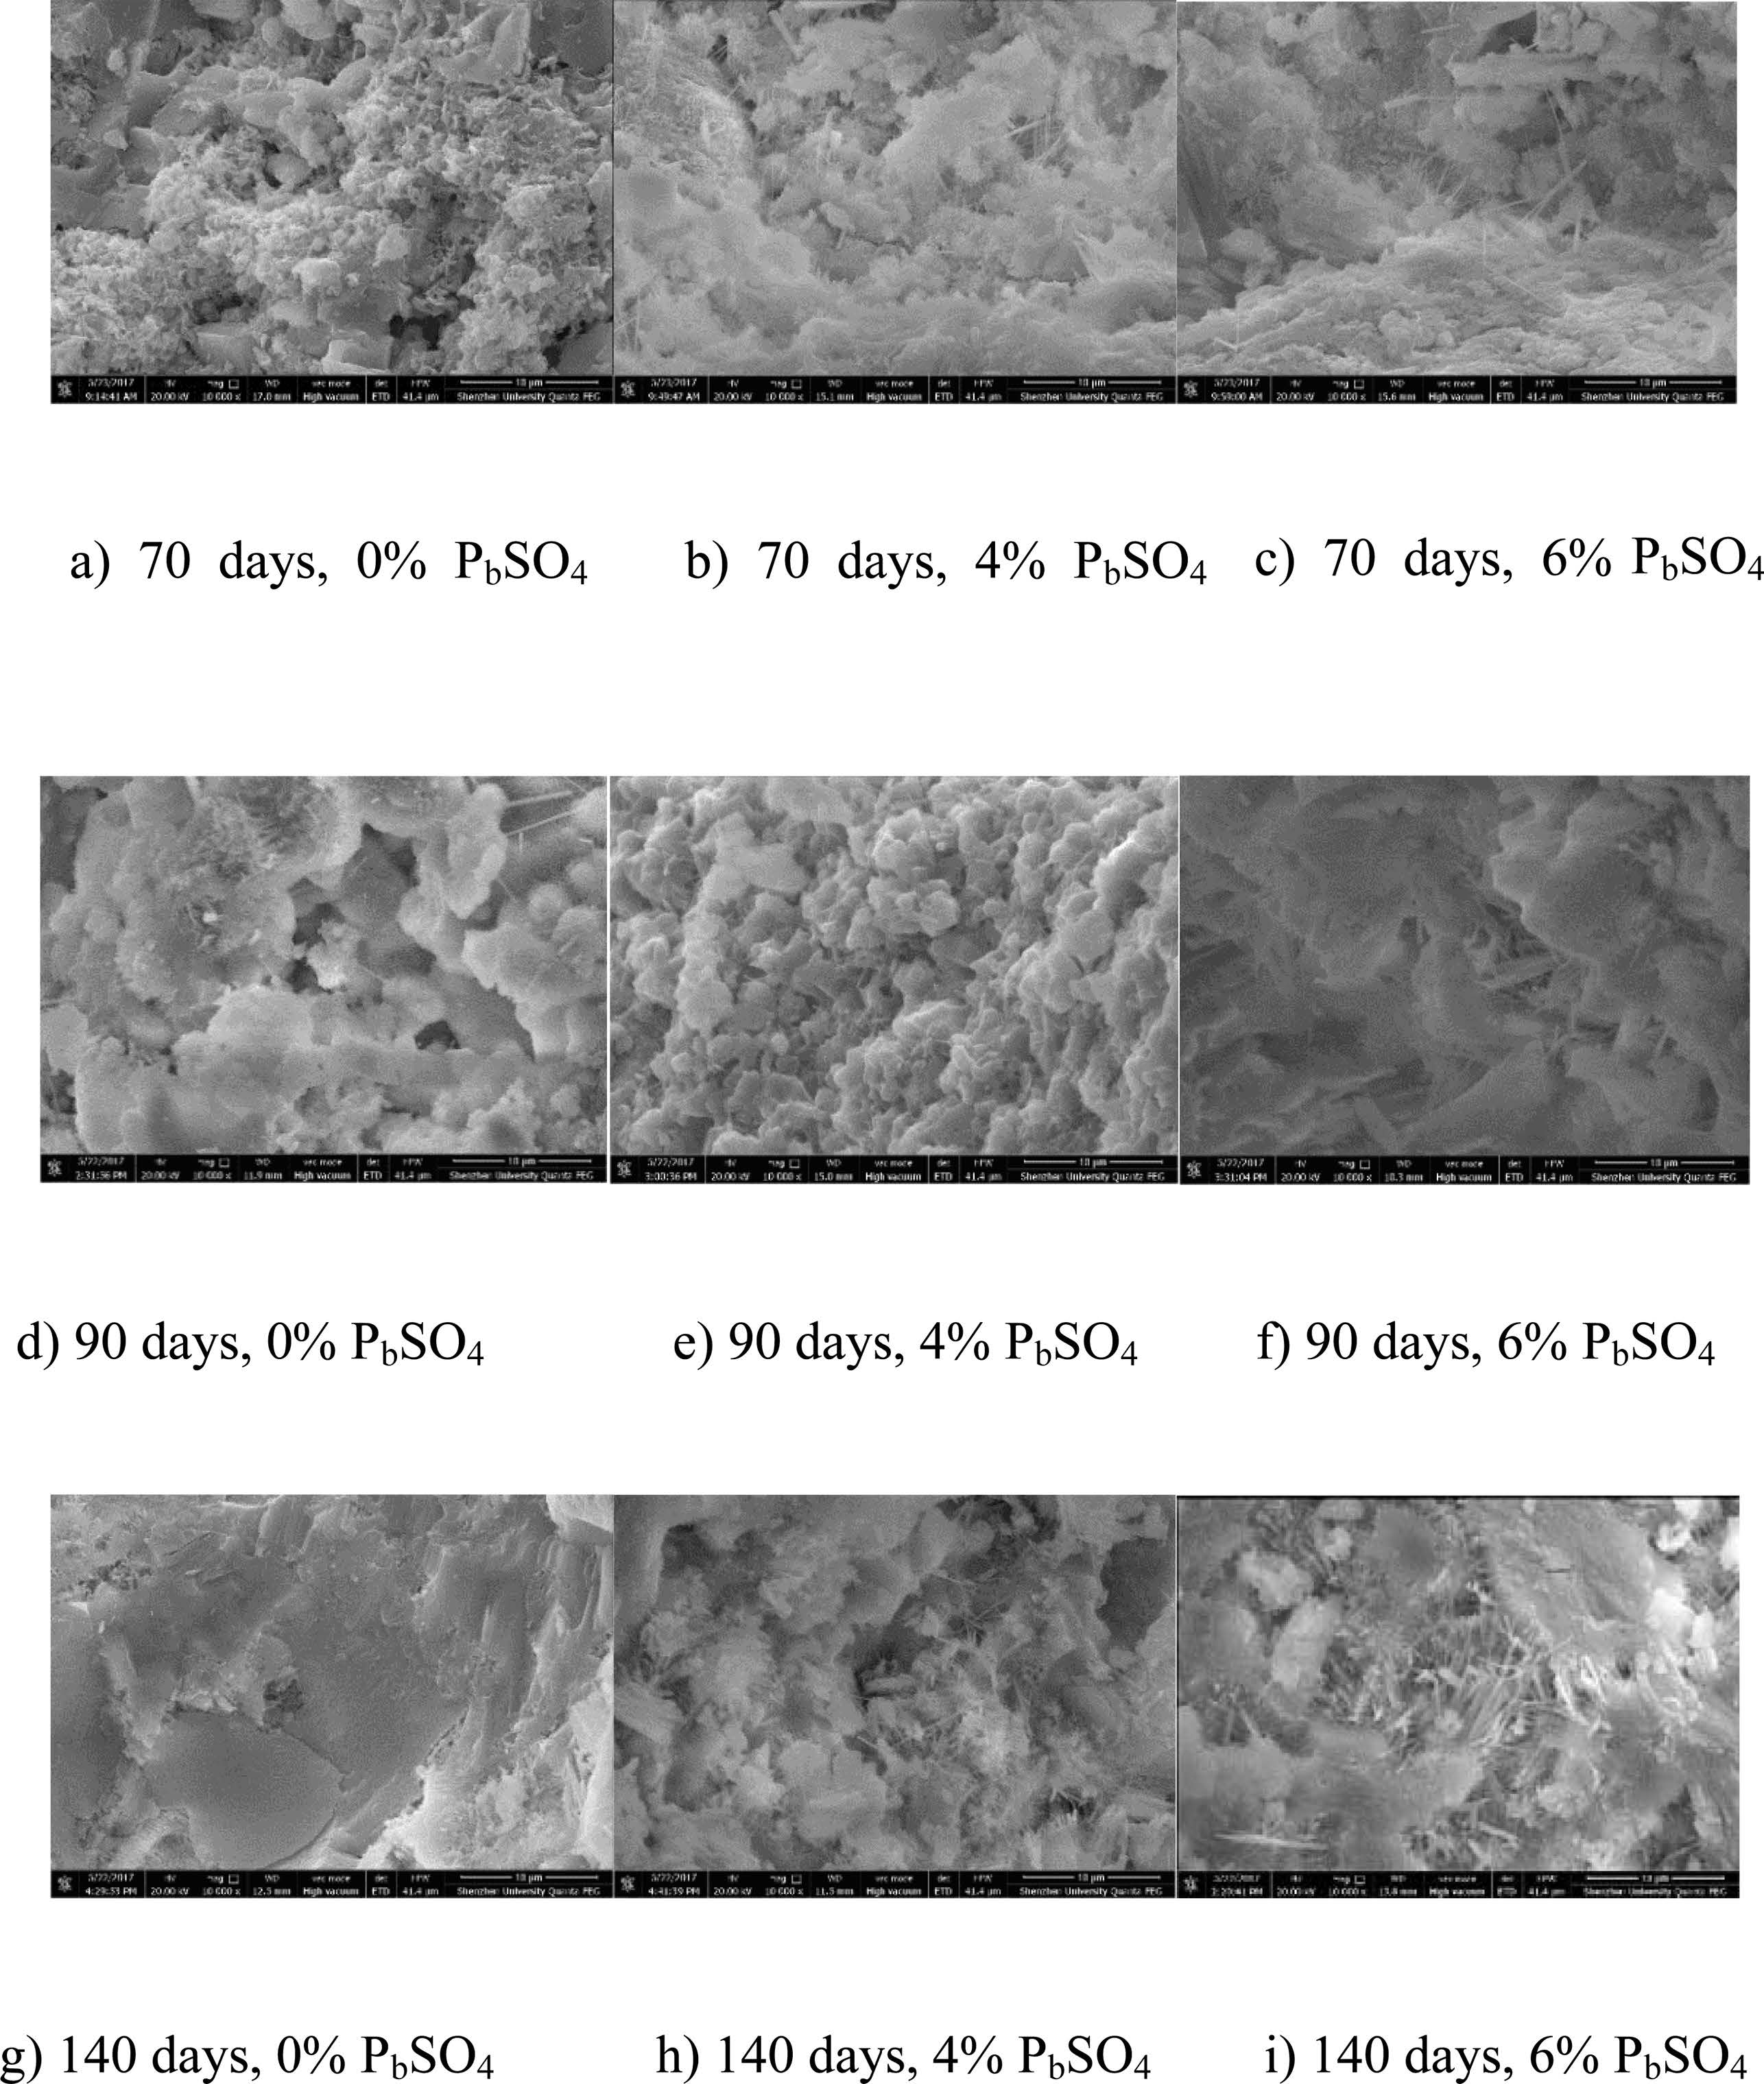
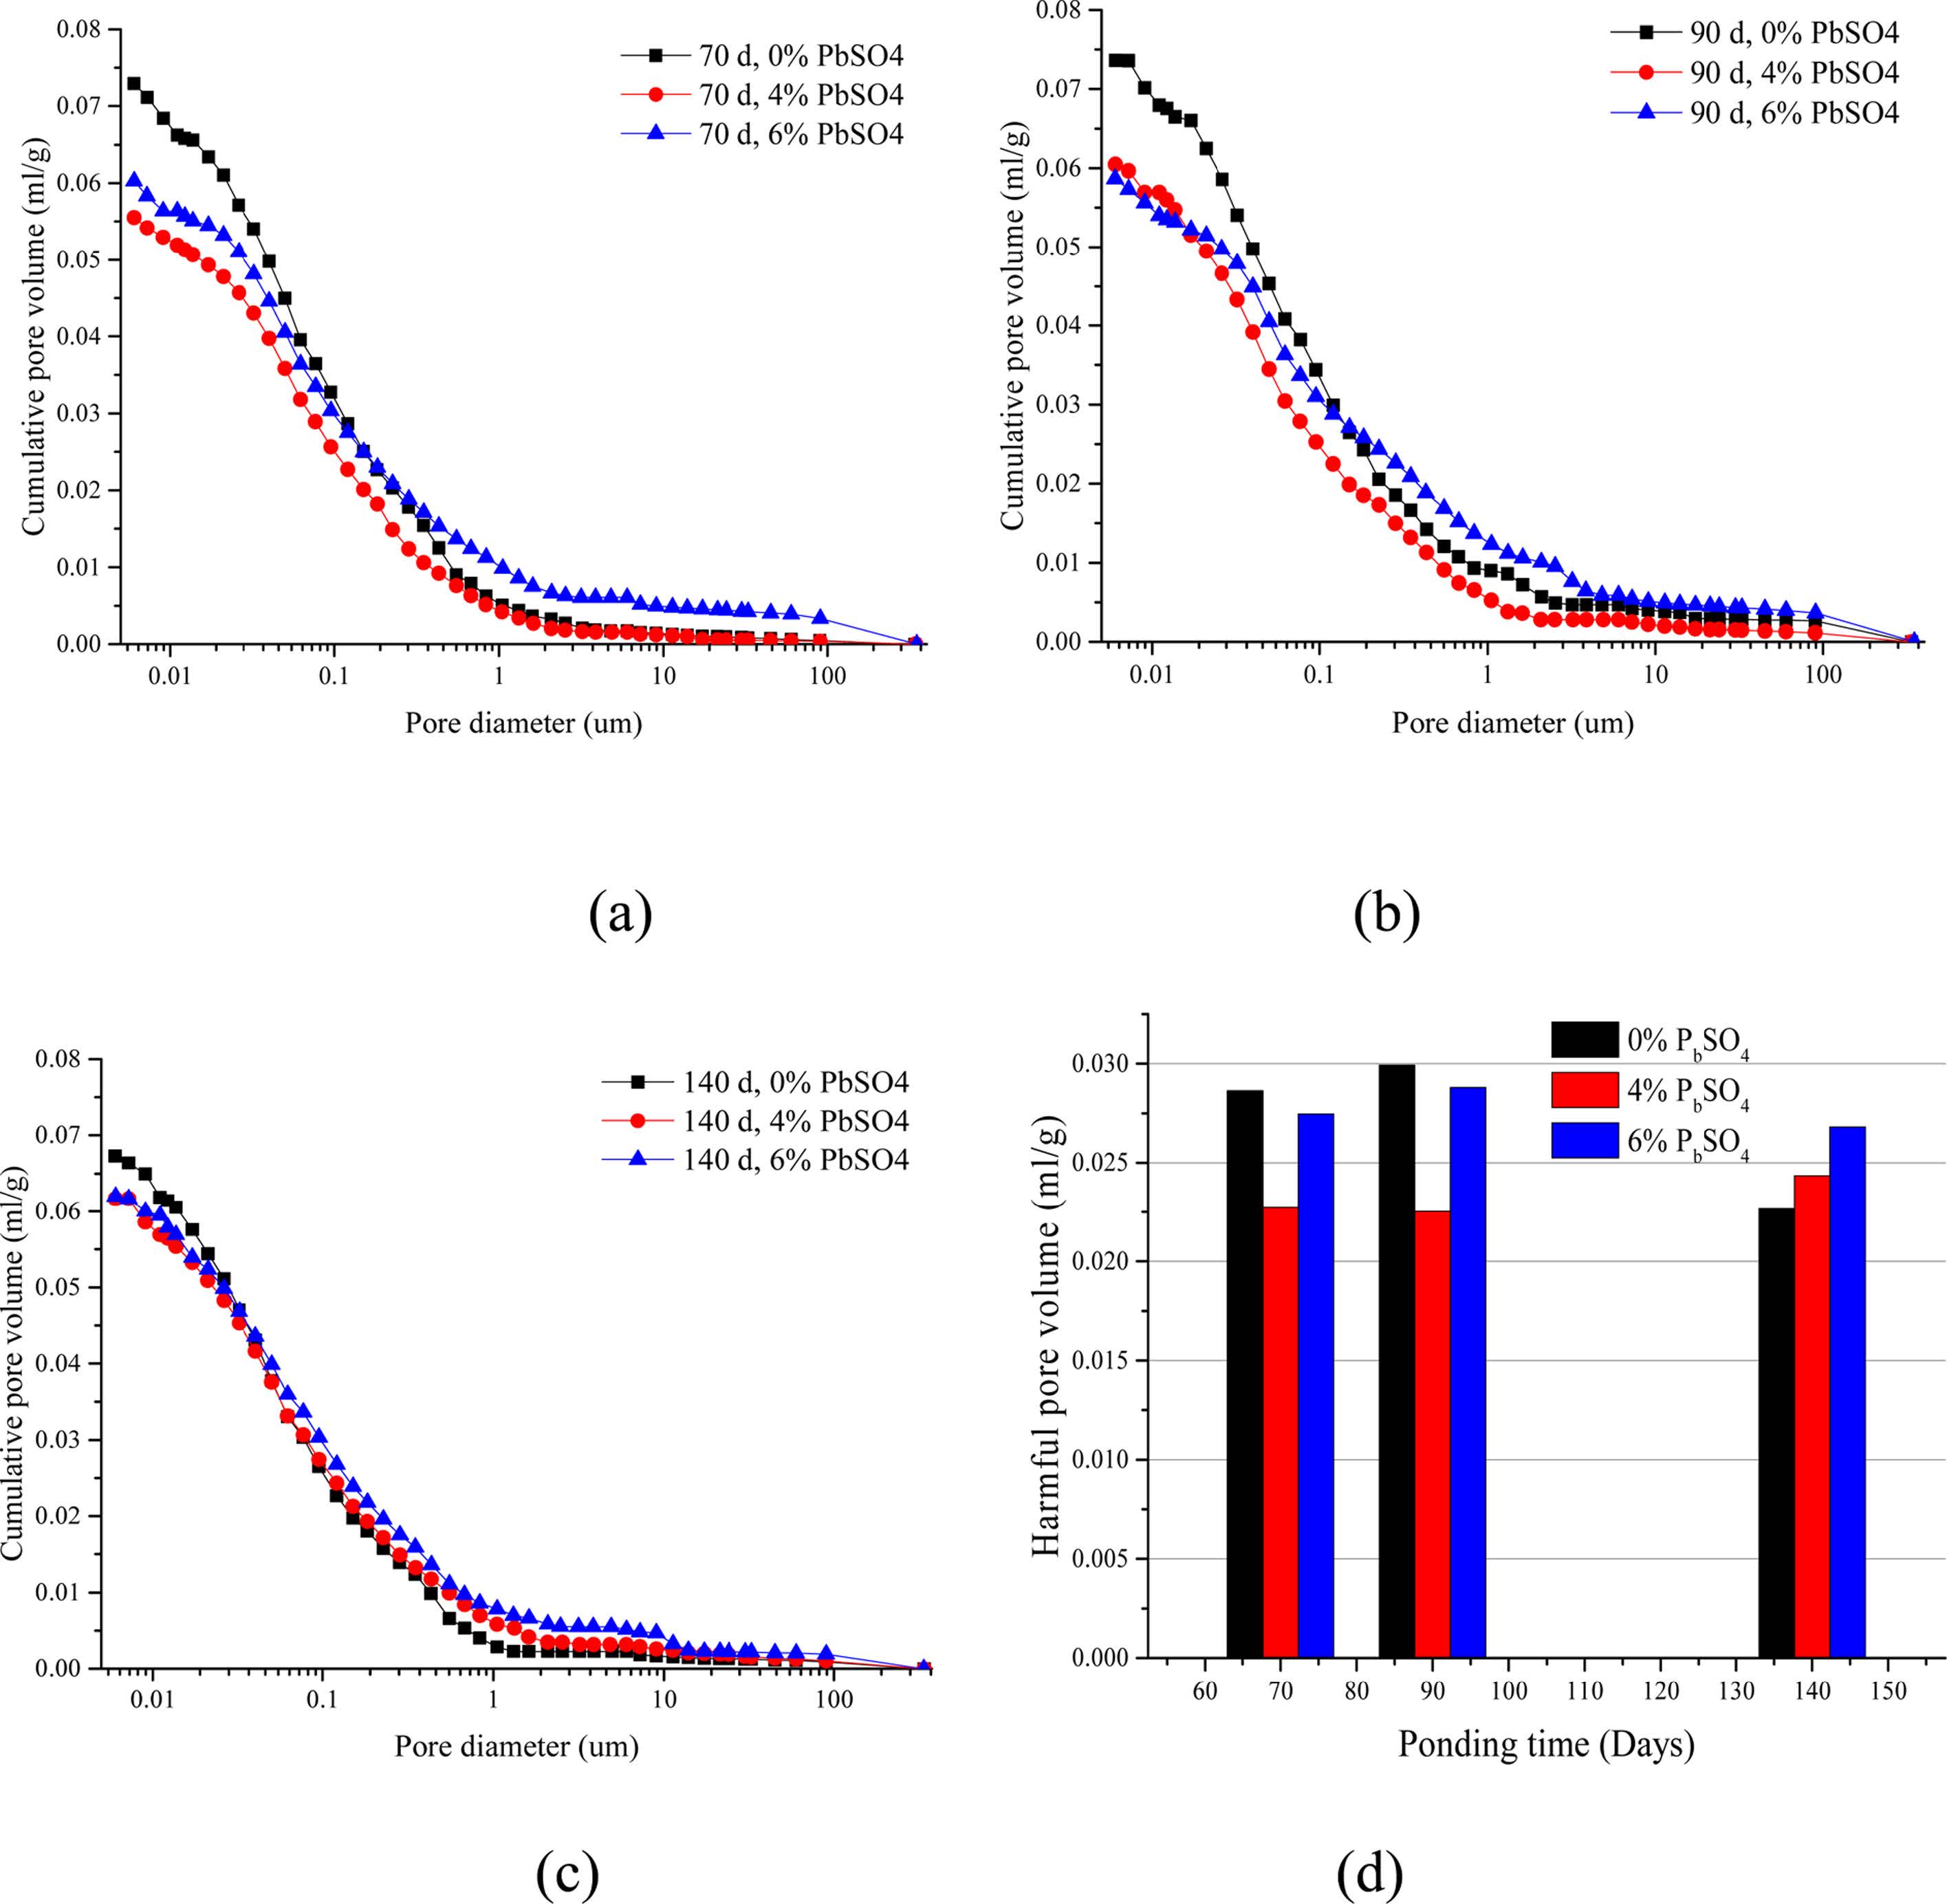
The identification of cement-based material microstructure (pore size distribution) is essential to understand ion transport mechanisms such as diffusion and migration. Cumulative intruded pore volume curves are provided in Figs. 6(a), (b) and (c). It is reported that pores of cementitious material with a diameter larger than 0.01 mm is attributed to the diffusion (migration) of ions in cement-based materials [43,44]. The volume of pores with diameters larger than 0.01 mm was extracted from the pore size distribution as shown in Fig. 6(d).
It is reported that ettringite as a product between sulfate and cement hydrates can form under a sulfate environment, which will fill the pores in the cement-based materials [18]. Fig. 6 shows that the cumulative pore volume of the mortar specimens decreases after the incorporation of lead sulfate. This explains the chloride content reduction in P4 and P6 mortars. It can also be observed from the SEM images of P4 and P6 mortar samples that more ettringites exist in the samples containing lead sulfate. Thus, it can be demonstrated that ettringite forms and then fills the capillary pore after the lead sulfate is added into the mortar specimens.
The final intruded pore volumes obtained from mortars with different contents of lead sulfate at the same period are considerably close. However, the shape of the intrusion curves varies only slightly depending on the incorporation quantity of lead sulfate. It can be observed from Fig. 6 that the volume of pores with diameters larger than 0.01 mm is different in P4 and P6 mortar samples. Thus, it can be concluded that the total mercury porosity is significantly influenced by the lead sulfate content. However, the pore size distribution, especially for pores larger than 0.01 mm is influenced by the lead sulfate content. It could be inferred that relatively less ettringites and gypsums form in P4 samples, which means pores are filled but no micro-expansion occurs. On the contrary, there are more ettringites and gypsums in P6 samples, resulting in micro-expansion.
Fig. 6 shows that the cumulative pore volume and volume of pores with diameter larger than 0.01 mm do not change much at different periods when the samples have the same amount of lead sulfate except for the P0 specimen. The data of P0 show a sharp drop when the test period reaches 140 days. Given enough time, cement-based materials can repair their properties [45, 46]. This is attributed to the continuous hydration of cement. In the P0 mortar samples, only the self-healing effect works, both the porosity and volume of pores with diameter larger than 0.01 mm decreases at the 140-day mark. In contrast, both sulfate attack and the self-healing effect operate in P4 and P6 samples. Thus, the results of Fig. 6 are almost unchanged.
|
Fig. 6 Cumulative pore volume after (a) 70, (b) 90 and (c) 140 day BD test and (d) pore volume with diameter larger than 0.01 m. |
Chloride ions could be bound by lead sulfate in cementitious materials. This reaction prevents the ingress of chloride ions to some extent.
The addition of lead sulfate could induce a sulfate attack which results in the formation of ettringites. The quantity of ettringite increases with the immersion time and lead sulfate content. Moreover, the formation of ettringites changes the microstructure of cementitious material.
In the bulk diffusion test, increasing the amount of lead sulfate causes the volume of pores with diameters larger than 0.01 mm for samples immersed for relatively short days, e.g. 70 and 90 days, to decrease firstly and then increase afterwards. However, samples immersed for 140 days experienced a constant increase with increasing lead sulfate content. A numerical simulation procedure for predicting directional typhoon wind fields over complex terrain has been proposed in this study.
The research described in this paper was financially supported by the General Program of the National Natural Science Foundation of China (No.51478272, 51378312), the joint funds of the National Natural Science Foundation and Guangdong Province of China (U1301241), the Science and Technology Foundation for the Basic Research Plan of Shenzhen City (JCYJ20160422095146121), and the Collaborative Innovation Research Centre for Environment-Friendly Materials and Structures in Civil Engineering, Southeast University.
- 1. T. Jena and K.C. Panda, Adv. Concr. Constr. 6[1] (2018) 47-68.
-

- 2. B. Zehtab and A. Tarighat, Adv. Concr. Constr. 4[4] (2016) 305-317.
-
- 3. X.F. Wang, F. Xing, M. Zhang, N.X. Han N and Z.W. Qian, Mater. 6[9] (2013) 4064-4081.
-
- 4. X.F. Wang, P.P. Sun, N.X. Han and F. Xing, Mater. 10[1] (2017) 1-18.
-
- 5. X.F. Wang, F. Xing, Q. Xie, N.X. Han, T. Kishi and T.H. Ahn, J. Ceram. Proc. Res. 16 (2015) 74-82.
- 6. X.F. Wang, J.H. Zhang, W. Zhao, R. Han, N.X. Han and F. Xing, Constr. Build. Mater. 165 (2018) 149-162.
-
- 7. X.F. Wang, Y.D. Guo, J.F. Su, X.L. Zhang, N.X. Han and X.Y. Wang, Nanomaterials-Basel 8[6] (2018) 364.
-
- 8. X.F. Wang, C. Fang, D.W. Li, N.X. Han and F. Xing, Cem. Concr. Comp. 92 (2018) 216-229.
-
- 9. X.F. Wang, R. Han, T.L. Han, N.X. Han and F. Xing, Mater. Chem. Phys. 215 (2018) 346-354.
-
- 10. X.F. Wang, R. Han, J. Tao, T.L. Han, G.M. Zhu, J.N. Tang, N.X. Han and F. Xing, Comp. Part B: Eng. 158 (2019) 249-258.
-
- 11. N.X. Han and F. Xing, Mater. 10[1] (2016) 2.
- 12. A. Poursaee and C.M. Hansson, Cem. Concr. Res. 37 (2007) 1127-1233.
-
- 13. C.L. Page and M.M. Page, Durability of concrete and cement composites, 1st ed., Woodhead press, Cambridge England, 2007.
-
- 14. P.S. Mangat and K. Gurusamy, Cem. Concr. Res. 17[3] (1987) 385-396.
-
- 15. W. Xiong, J.N. Tang, G.M. Zhu, N.X. Han, E. Schlangen, B.Q. Dong, X.F. Wang and F. Xing, Sci. Rep-UK 5 (2015) 10866.
-
- 16. Y.X. He, G.M. Zhu, Z.P. Wu and Y.M. Zhou, J. Func. Mater. 46 (2015) 2144-7, 2152.
- 17. J. Marchand, E. Samson, Y. Maltais and J.J. Beaudoin, Cem. Concr. Comp. 24[3-4] (2002) 317-329.
-
- 18. P.K. Mehta, Cem. Concr. Res. 13[3] (1983) 401-406.
-
- 19. O.S.B. Al-Amoudi, Build. Environ. 33[1] (1998) 53-61.
-
- 20. K. Sotiriadis, E. Rakanta, M.E. Mitzithra, G. Batis and S. Tsivilis, J. Mater. Civil Eng. 29[8] (2017) https://doi.org/10.1061/(ASCE)MT.1943-5533.0001895.
-
- 21. M. Maes and N. De Belie, Cem. Concr. Comp. 53 (2014) 59-72.
-
- 22. C. Arya and J.B. Newman, Mat. Struct. 137 (1990) 319-330.
-
- 23. T.U. Mohammed and H. Hamada, Cem. Concr. Res. 33[9] (2003) 1487-1490.
-
- 24. X.Y. Lu, C.L. Li and H.X. Zhang, Cem. Concr. Res. 32[2] (2002) 323-326.
-
- 25. H.A. Berman, J. Mater. 7[3] (1972) 330-335.
- 26. F.M. Lea, The chemistry of cement and concrete, 3rd Ed., Edward Arnold Ltd. press, London, England, 1970.
- 27. M. Collepardi, R. Turriziani and A. Marcialis, J. Am. Ceram. Soc. 55[10] (1972) 534.
-
- 28. A. Atkinson and A.K. Nickerson, J. Mater. Sci. 19[9] (1984) 3068-3078.
-
- 29. K. Audenaert, Q. Yuan and G.D. Schutter, Constr. Build. Mater. 24[3] (2010) 396-402.
-
- 30. L.P. Tang and J. Gulikers, Cem. Concr. Res. 37[4] (2007) 589-595.
-
- 31. D. Whiting, Public Roads 45[3] (1981) 101-112.
- 32. L.P. Tang and L.O. Nilsson, Am. J. Geriatri. Psychiatry 89[1] (1993) 49-53.
- 33. D.K. Ashish, B. Singh and S.K. Verma, Adv. Concr. Constr. 4[2] (2016) 107-121.
-
- 34. A.B. Abell, K.L. Willis and D.A. Lange, J. Colloid Interf. Sci. 211[1] (1999) 39-44.
-
- 35. H. Nikol, A. Becht and A. Vogler, Inorg. Chem. 31 (1992) 3277-3279.
-
- 36. K.J. Powell, P.L. Brown, R.H. Byrne, T. Gajda, G. Hefter, A.K. Leuz, S. Sjoberg and H. Wanner, Pure Appl. Chem. 81[12] (2009) 2425-2476.
-
- 37. M. Nokken, A. Boddy, R.D. Hooton and M.D.A. Thomas, Cem. Concr. Res. 36[1] (2006) 200-207.
-
- 38. P.S. Mangat and B.T. Molloy, Mater. Struct. 27[170] (1994) 338-346.
-
- 39. P.B. Bamforth, Mag. Concr. Res. 51[2] (1999) 87-96.
-
- 40. L.P. Tang and L.O. Nilsson, Nord. Concr. Res. 11 (1992) 162-171.
- 41. N. Cefis and C. Comi, Cem. Concr. Res. 93 (2017) 57-70.
-
- 42. J. Zuquan, S. Wei, Z. Yunsheng, J. Jinyang and L. Jianzhong, Cem. Concr. Res. 37[8] (2007) 1223-1232.
-
- 43. C.C. Yang, S.W. Cho and L.C. Wang, Mater. Chem. Phys. 100[2-3] (2006) 203-210.
-
- 44. S. Mindess, J.F. Young and D. Darwin, Concrete, 2nd Ed., Prentice Hall Press, New Jersey, USA, 2003.
- 45. C. Edvardsen, Aci. Mater. J. 96[4] (1999) 448-454.
- 46. X.F. Wang, M. Zhang, F. Xing and N.X. Han, Appl. Sci. 8[11] (2018) 2241.
-
 This Article
-
2019; 20(S1): 36-45
Published on Jul 20, 2019
- Received on Dec 9, 2018
- Revised on Jan 11, 2019
- Accepted on Jan 11, 2019
Services
- Abstract
introduction
experimental materials and specimens
experimental programs
results and discussions
conclusions
- Acknowledgements
- References
- Full Text PDF
Shared
Correspondence to
- Weilun Wang, Jian Liu
-
Guangdong Key Laboratory of Durability in Coastal Civil Engineering, College of Civil Engineering, Shenzhen University, Shenzhen, Guangdong 518060, P.R. China
Tel : +86-755-2695-8836, +86-755-2673-2827
Fax: +86-755-2695-8836, +86-755-2673-2827 - E-mail: wwl0610@szu.edu.cn, liujian@szu.edu.cn
Clean-Energy Research Institute(CRI), Hanyang University, 222, Wangsimni-ro, Seongdong-gu, Seoul, 04763, Korea
E-mail: jcpr@hanyang.ac.kr