


- Optimization of Friction Stir Welding Parameters for AA5052-AA2014 Joints Using Critic and Marcos Methods: Evaluation of Mechanical Properties and Tool Pin Profiles
Satishkumar P.a,*, Abdulrahman Khamajb, Abdulelah M. Alic, Rajasekaran Saminathand, Madhuri S. Bhagate, Sumant. K. Kulkarnif and Dhananjay R. Dolasg
aDepartment of Mechanical Engineering, Rathinam technical campus, Coimbatore, Tamilnadu, India
bIndustrial Engineering Department, College of Engineering and Computer Science, Jazan University, Saudi Arabia
cIndustrial Engineering Department, College of Engineering and Computer Science, Jazan University, Saudi Arabia
dMechanical Engineering Department, College of Engineering and Computer Science, Jazan University, Saudi Arabia
eAssistant Professor, Department of Civil Engineering, Yeshwantrao Chavan College of Engineering, Nagpur
fSchool of Civil Engineering, REVA University, Bengaluru, Karnataka 560064, India
gAssociate professor in Mechanical Engineering, Jawaharlal Nehru Engineering College, MGM University Aurangabad, Maharashtra, IndiaThis article is an open access article distributed under the terms of the Creative Commons Attribution Non-Commercial License (http://creativecommons.org/licenses/by-nc/4.0) which permits unrestricted non-commercial use, distribution, and reproduction in any medium, provided the original work is properly cited.
Friction stir welding (FSW) is an innovative technique for joining both similar and dissimilar aluminum materials, extensively utilized in the automotive and aerospace sectors to mitigate problems like as porosity, hot cracking, and elemental loss related to fusion welding methods. This study investigates the amalgamation of two distinct materials, AA5052 and AA2014 and evaluates their mechanical properties concerning the influence of FSW process variables, such as welding speed (WS), tool rotational speed (TRS), and axial load (AL), on the integrity of the weld nugget zone formation. The critical functions of various tool pin profiles are also highlighted. The selection criteria are determined by the evaluated mechanical parameters, which encompass yield strength (YS), ultimate tensile strength (UTS), percentage of elongation, and hardness (HV). The CRITIC (criteria importance through intercriteria correlation) technique was employed to obtain the significance of criteria for performance assessment. The application of MARCOS (Measurement of Alternatives and Ranking according to Compromise Solution) for ranking assessment indicates that the sixteenth samples exhibit the most advantageous mechanical features. The findings demonstrate that defect-free weld joints are attained at a WS of 16 mm/min, a TRS of 1600 rpm, and an AL of 8 N using a hexagonal pin profile, resulting in a UTS of 227 MPa, an YS of 215 MPa, a percentage of elongation of 8.5, and a hardness of 96 HV. The confirmation of the ranking through various decision-making instruments illustrates the dependability and efficiency of the suggested methodology.
Keywords: Aluminum alloys, Mechanical properties, Friction stir welding, CRITIC, MARCOS.
Friction Stir Welding (FSW) is a revolutionary solid-state joining method that is widely acknowledged for its capacity to surmount problems associated with
conventional fusion welding processes, including elemental loss, heated cracking, and porosity. This method has been extensively used in the aerospace and automotive industries as a result of its ability to produce joints that are high-strength and defect-free. FSW of AA2014-T6 and AA6061-T6 with a cylindrical pin tool at varying rotational speeds was characterized using optical microscopy. Microstructure was used to analyze the fracture behavior, and the mechanical properties were correlated with grain structure improvements [1]. FSW of AA2014 and a hybrid AA7075 composite was studied with microstructural characterization (grain size, shear textures). Flexural strength and mechanical properties were evaluated at optimal welding speed of 12.5 mm/min [2]. Investigation was conducted on the FSW process parameters for AA2014-T6 and AA7075-T6, using SEM and optical microscopy for microstructure and fracture analysis. Focused on asymmetric hardness profiles and mixed-mode tensile failure [3]. Optimization was conducted on the FSW parameters for AA2014 and AA6061 using factorial design and ANOVA. Mechanical characteristics were assessed with tensile and hardness tests, with grain size evaluated per ASTM E112 [4]. Used Taguchi Mixed Factorial Design (TMFD) and Response Surface Methodology (RSM) with AUGMECON to optimize FSW factors (traversal speed, tilt angle, tool profile, rotating speed) for AA2219 and AA2014. Microstructural, SEM, and XRD analyses for strength and intermetallic characterization was conducted for the composites [5].
Abrasive Flow Machining (AFM) is used to mill Al 6082/WC composites with 30-70% WC, optimized for MRR and ΔRa using Taguchi's approach. Extrusion pressure significantly influences MRR and surface roughness [6]. Ultrasonic vibration and squeeze pressure affect Ti/Al composites during solidification, enhancing hardness and strength. Increasing squeeze pressure reduces grain size but coarsens microstructures at higher levels [7]. AA5052/B4C MMCs fabricated via powder metallurgy show wear resistance decreases at high reinforcement volume due to particle dislodgment.
Hardness improves uniformly, but no correlation with wear resistance is observed [8]. AA7178/ZrSiO4 nanocomposites show improved hardness and strength using powder metallurgy techniques. Uniform nanoparticle distribution enhances properties, but clumping at >2.5% reinforcement degrades performance [9]. AMMCs with AA5083 were reinforced with alumina and titanium carbide (4-12 wt.%) using stir casting. The reinforcements improved tensile and compression strengths, and various tests assessed their mechanical and tribological properties [10,42]. AA2024/SiC composites (0-12 wt.%) were fabricated using stir casting and aged to enhance mechanical properties. AA2024/9 wt.%SiC showed optimal strength, density, and hardness, with EDM parameters optimized using GRA [11]. The machining of AA6082/ZrSiO4/SiC alloy using ECM was analyzed for MRR and SR, optimized via Taguchi and ANN models. ANN predictions showed high accuracy with an R value of 0.98003 and SEM confirming improved surface finish [12]. AZ31 hybrid nanocomposites (SiC/Gr) were tested for wear behavior. ANOVA and S/N Ratio analysis identified optimal parameters to minimize wear rate and COF, with SEM and EDS characterizing wear surfaces. [13]. The mechanical and metallurgical behavior of dissimilar FSW joints between AA5052-H32 and AA5053-H11 was studied. Using a square pin tool and varying speeds (800-1200 rpm), optimal properties were achieved at 1000 rpm with 87.67% joint efficiency. Microhardness improved by 12.86%, with tool speed as the dominant factor [14]. FSW of AA1100 aluminium was investigated using response surface methodology and multiple regression modeling. Results showed square pin geometry and increased feed/axial load enhanced tensile strength. ANOVA confirmed significant influence of tool shape and load on joint strength [15]. UFSW of AA8011/5%SiC was optimized using Taguchi L9 and MCDM methods (MEREC & MARCOS). Optimal parameters—1000 rpm, 20 mm/s, hexagonal pin—yielded TS: 108.88 MPa, HV: 98, IS: 10 J.ANOVA showed tool pin profile (81.44%) as the dominant factor; microstructure revealed fine grains and uniform flow [16].
FSW of AA2014 and AA7075 was performed using butt welding perpendicular to the rolling direction. Tests included thermal cycle analysis, hardness tests, and microstructural analysis using SEM/EDS to evaluate precipitates. Optimal parameters were set to 840 rpm and 30 mm/min [17]. Secondary heating in FSW using a gas torch was analyzed via electron backscatter diffraction and texture analysis for AA6061-AA7075 and AA7075-AA2014. Material flow, grain boundary, and hardness were assessed, with texture evolution correlating to additional heating and plastic deformation [18]. FSW of AA6082 and AA2014 involved testing mechanical and metallurgical properties using tensile, impact, hardness, and SEM fractography tests. Variables like traverse speed, rotational speed, and axial force were studied [19]. FSW of AA2014-T6 used mild steel and titanium backing plates to evaluate the effects of thermal conductivity on grain size, hardness, and precipitate distribution. MS backing plates yielded superior strength and hardness due to higher conductivity and Al2Cu precipitate density [20]. Cryogenic FSW (CFSW) of AA2014-T6 and AZ31B was performed using liquid nitrogen to maintain low temperatures. Taguchi and MOORA techniques optimized the factors like tool pin, rotating speed, and welding speed. Microstructural analysis and metallic elements were analyzed using SEM/EDS [21].
FSW of AA2014 and AA6082 with TiB₂ particles as fillers improved tensile strength and hardness through grain refinement and pinning effects. Process parameters like rotational speed, feed rate, and penetration depth were optimized [22]. Three cooling techniques were employed during FSW of AA2014 and AA7075. Microstructure,
grain refinement, and mechanical properties were assessed, showing WFC as the most effective for improving tensile strength and hardness [23]. Nano-TiO₂ reinforcement was applied during FSP of AA2024 and AA2014, resulting in a fine-grained, homogeneous microstructure. SEM, Vickers hardness, and tensile tests assessed improvements in hardness, tensile strength, and wear resistance [24]. Numerical and experimental analyses of FSW joined AA7075 and AA2014 examined the temperature distribution and grain size using a 3D multi-physics model. Experiments T9 and T11 were conducted using CNC machines and thermocouple-based temperature measurements. Microstructure was analyzed by SEM and optical microscopy, with hardness variation observed across the zones [25].
Fabricated Al-MWCNT-GR composites by stir casting using Taguchi-CRITIC-MOORA for optimization. Parameters like graphene reinforcement, die/melt temperature, and stir speed were evaluated. Optimized conditions improved hardness (31.77%) and reduced wear rate (36.33%) with self-lubricating properties [26]. Assessment were conducted on the cutting forces and shape deviations (circularity, cylindricity) of AA6026-T9 in dry and MQL conditions. The most significant factors were feed rate and depth of incision, as revealed by Taguchi and MOORA-CRITIC. The cutting efficiency was improved by the optimal MQL settings (600 m/min, 0.1 mm/rev, 1 mm, 25 rake) [27]. Taguchi L9 OA and MARCOS-based techniques were employed to maximize resistance spot welding of dissimilar materials (50HS stainless steel and AA1200 aluminum alloy). The particle diameter and tensile-shear strength were most significantly influenced by the welding current. The optimized parameters were validated by confirmatory experiments [28]. Hybrid nanocomposites of AA7175 and AA6061 reinforced with 10% WC and 10% B4C were fabricated by stir casting and machined using EDM. Taguchi L9 OA and MARCOS optimization determined the impact of pulse-on time, voltage, and current, on machining time, surface roughness, and MRR. Voltage and current were the most important factors, with improved tensile strengths for both composites [29].
Vibration-assisted μ-FSW with SiC nano-reinforcement was used to improve weld properties. Coin-type vibrators ensured uniform particle dispersion, reducing welding time by half. Mechanical properties, including tensile strength and elongation were enhanced, with more uniform hardness and smaller particle size achieved [30]. FSW of AA5052-H32 aluminum alloy and polycarbonate dissimilar materials was performed using a taper threaded tool pin. RSM optimized parameters, and SEM/optical microscopy analyzed bonding mechanisms. The best joint strength (14.86 MPa air-cooled, 12.47 MPa water-cooled) was achieved at 1118 rpm, 48 mm/min, and 2 tilt angle [31]. The impact of a brass C360 electrode on micro-EDM drilling of AA6061 were examined in relation to capacitance, voltage, feed rate, and rotating speed . The optimal parameters were identified through hybrid CRITIC optimization and ANOVA, resulting in a 92.36% increase in grey relational grade (GRG). [32].
The optimization of dilution, weld penetration, and heat input was achieved by using CRITIC and ROV methodologies to investigate pulse MIG welding and CMT of AA2099-T86. Welding speed was identified as the most influential factor, and Taguchi's L9 array was implemented. Superior weld beads were demonstrated by CMT with a reduced heat input [33]. Hybrid AMMCs with LM6 matrix and SiC, bagasse ash, and fly ash were fabricated by stir casting. Drilling operations were optimized using Taguchi L9 and MCDM methods (MOORA and CoCoSo) revealed CoCoSo as more effective, achieving better material removal rate (MRR) and surface roughness (Ra) at optimized parameters [34].
FSP was employed to post-process dissimilar materials AA5052 and AA5083 that were TIG-welded. In comparison to unprocessed TIG joints (192.5 MPa, 70 HV), the mechanical properties (TS 224.5 MPa, HV 104 HV) and grain refinement in the FS zone were substantially enhanced. [35]. Friction stir welding of AA5052-H32 was performed using three pin profiles (two-flat, three-flat sides, cylindrical) and different preheat temperatures (150-300 °C). Optimal outcomes (15.3% bending, 12.2% tensile strength, 11.2% hardness enhancements) were attained using a three-flat-sided pin at a preheat temperature of 250 °C, hence preventing grain coarsening at elevated temperatures [36].
While prior studies have investigated friction stir welding (FSW) of dissimilar aluminum alloys, most have focused on single-response optimization or employed conventional methods such as Taguchi, TOPSIS, or MOORA, without addressing complex multi-response trade-offs. Moreover, limited literature is available on FSW of the specific AA5052-AA2014 alloy combination, and the effect of different tool pin profiles has not been thoroughly evaluated using robust optimization techniques. To address this gap, a hybrid CRITIC-MARCOS multi-criteria decision-making approach for optimizing key FSW process parameters and tool pin geometries. The integration of objective weight determination (CRITIC) with an advanced ranking method (MARCOS) enables simultaneous consideration of tensile strength, yield strength, elongation, and hardness. Additionally, the influence of three distinct tool pin profiles (cylindrical, square, hexagonal) is systematically analyzed and ranked. This integrated framework offers a novel and comprehensive approach to optimizing dissimilar aluminum FSW joints, which has been explicitly emphasized in the revised manuscript to improve clarity and impact.
Preparation of materials and samples
This research uses AA5052 and AA2014 sourced from Matrics enterprises, Nagercoil, Kanyakumari, Tamil Nadu. The exceptional corrosion resistance and structural applications in aerospace of the alloy AA2014 account for its utilization. The mechanical characteristics of the parent materials were tested under ambient conditions without any heat treatment. A 1 kg weight was used to conduct the hardness test.
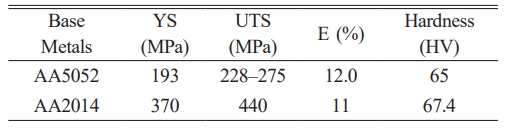
The FSW studies were conducted on AA5052 and AA2014 with dimensions of 100 × 50 × 6 mm. Table 2 describes the mechanical behaviors of the AA5052 and AA2014, whereas Table 1 describes the chemical composition of AA5052 and AA2014 assessed through spark analysis in accordance with standard protocols utilizing an Optical Emission Spectrophotometer. The AA5052 plate was assigned to the retracting side, while the AA2014 alloy is allocated to the advancing side.
FSW tool designed and developed
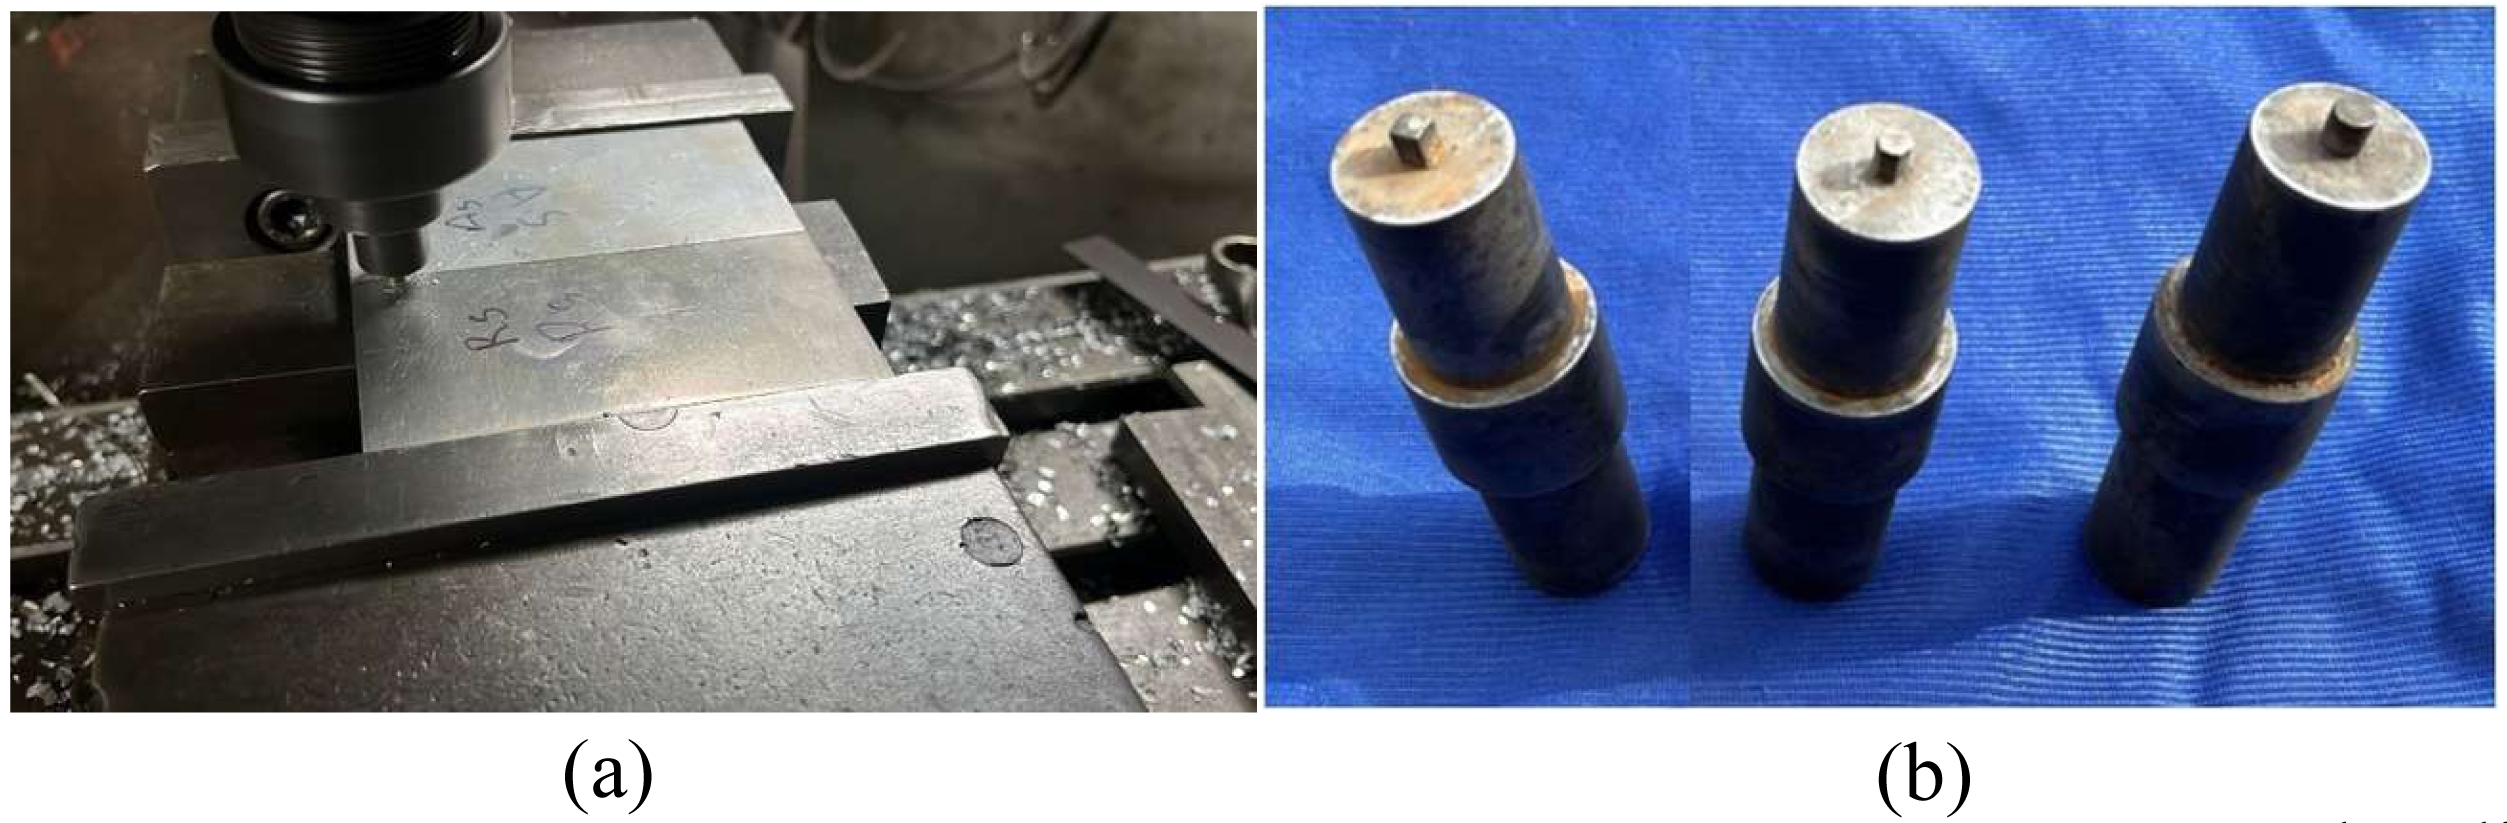
The geometry of the FSW tool is a critical component in attaining uniformity in dissimilar welding joints and ensuring effective pin stirring to create a robust joint between two different materials. Friction Stir Welding investigations employed an accessible and cost-effective H13 (HCHCr) tool; nevertheless, numerous trial welds demonstrated that the H13 material was unsuitable for connecting the 5XXX series because of inadequate heat formation during the friction stir welding method. To address these challenges, the FSW tool constructed from maximum -speed steel features a three types of pins configuration including hexagonal (H), circular (C), and square (S) pins, each with a length of 5.9 mm. The selected specifications include a plate thickness of 6 mm, a pin diameter of 6 mm, and a tool shoulder diameter of 18 mm, as per the existing literature.
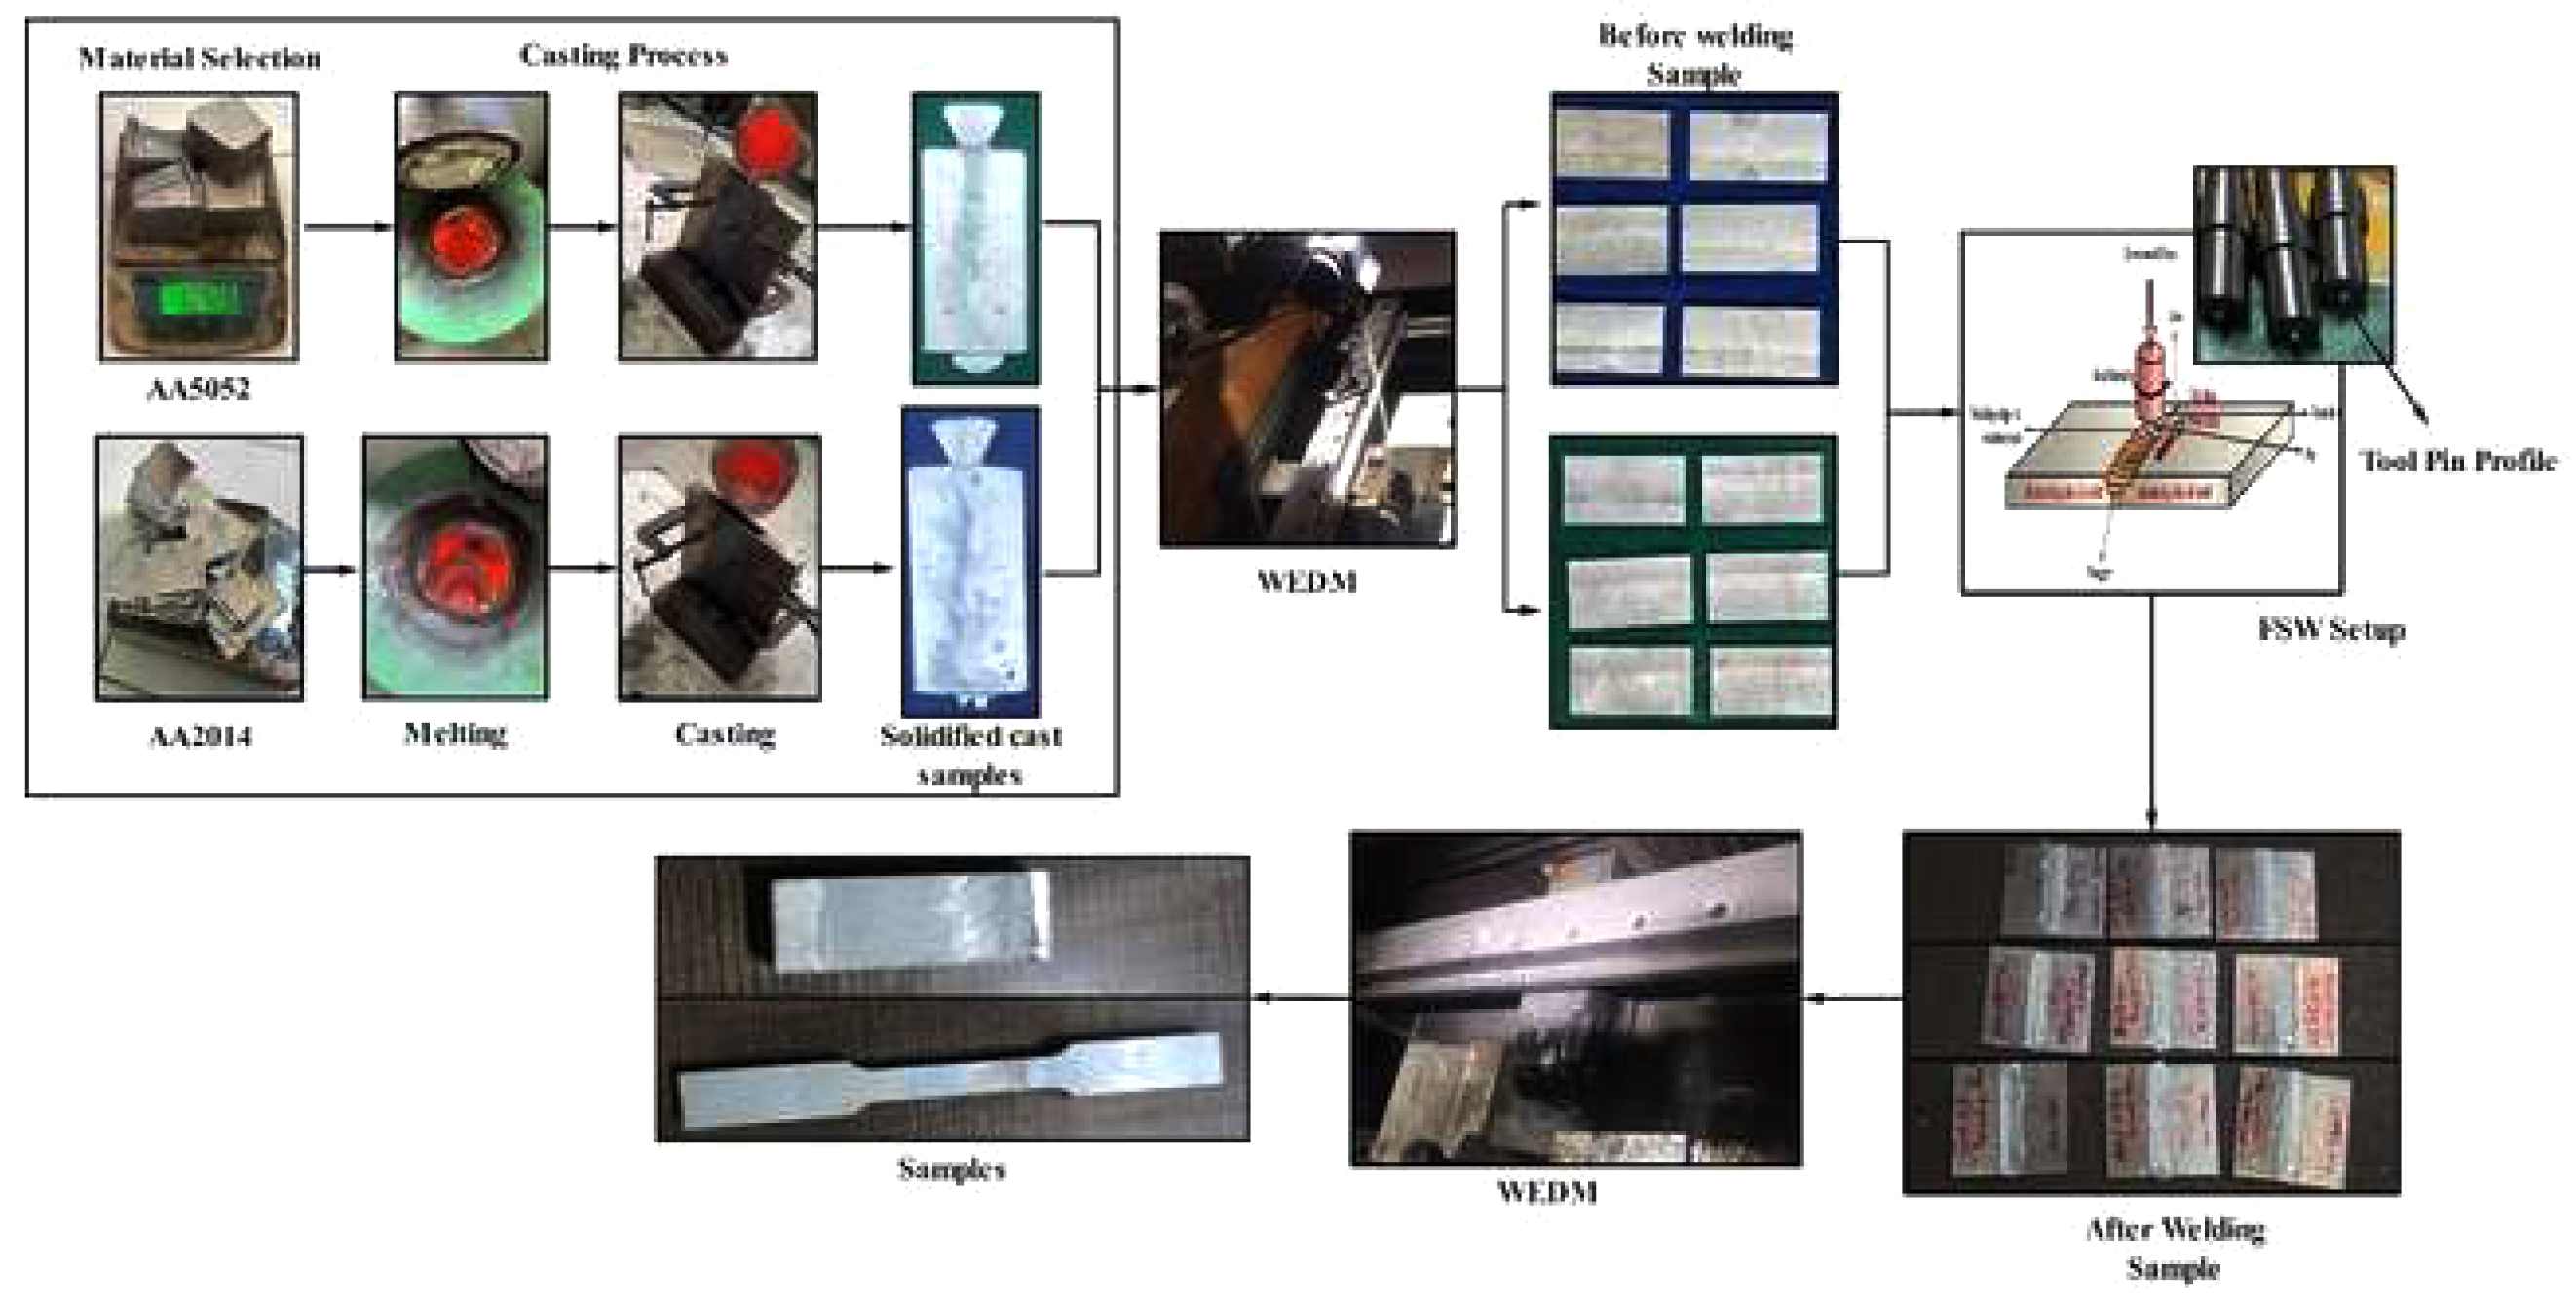
Figure 1(a) illustrates the fabrication of composite material using dissimilar materials. A data collection system is included with the FSWM30-600 load and positioning controller: Y-axis travel: 300 mm; Z-axis travel: 300 mm; Z-axis highest load: 30 kN; Z-axis speed: 1000 mm/min; X-axis travel: 600 mm; highest spindle speed: 3000 rpm; X-axis speed: 3000 mm/min.
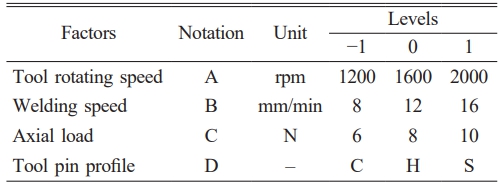
Determining the limits of the Friction Stir Welding process factors
The maximum and minimum limits of process factors were determined by many trial welds conducted on AA5052 and AA2014 aluminum alloys. The studies were initially performed on AA5052 with a WS of 8-16 mm/min, a TRS of 1200-2000 rpm, and an AL of 6-10 N.
The findings indicate that a reduced TRS diminishes metal transfer, whereas an increased welding speed results in inferior weld quality. The trial weld suggests the necessity to enhance the TRS and decrease the WS. The input factors and its levels of the friction stir welding process variables shown in Table 3 show that the chosen variables were intended to provide a perfect welded junction.
Experiments performed according to the design matrix
The trials were executed according to the Taguchi design matrix presented in Table 4. It has 27 sets of Taguchi conditions organized into four factors and three levels.
Welding response
The strength and hardness of the created FSW joints are examined as the welding outcomes. The ASTM E8/E8 M-2016 guidelines were followed in the preparation and arrangement of the tensile test samples. Gauge length was 25 mm and crosshead speed was 1 mm/min. The shoulder of the FSW tool was supposed to be 18 mm, while three pin shapes were continued at 6 mm, which is the same thickness as the base material selected for this research. Fig. 2(a) show the photographic view of friction stir welding machine and Fig. 2(b) illustrates the different tool profiles.
The YS, elongation percentage and welding strength were recorded during the experiment, which was conducted along the direction of the welded junction. The ASTM E-38-2017 standard was followed to conduct the Vickers hardness test at three distinct locations on each welded sample to characterize the hardness profile of the welded joints. A load of 1 kgf and dwell time of 10 seconds was used.
CRITIC-MARCOS optimization
The CRITIC-MARCOS approach was selected due to its superior ability to handle multi-response optimization with objective weighting and robust ranking. Unlike traditional MCDM methods such as TOPSIS, MOORA, or VIKOR, which often rely on subjective weight assignment or Euclidean distance, CRITIC objectively determines criteria weights based on contrast intensity and inter-criteria correlation. This eliminates user bias in weighting. MARCOS (Measurement Alternatives and Ranking according to Compromise Solution) further enhances decision-making by considering both ideal and anti-ideal solutions, leading to more stable and discriminative ranking results. Together, CRITIC-MARCOS offers a systematic and accurate optimization framework suitable for complex engineering problems involving multiple conflicting performance metrics.
CRiteria Importance Through Intercriteria Correlation (CRITIC) method
The CRITIC method utilizes criteria distribution and conflict severity as factors for weighting. The degree of dispersal measures the level of variability in assessment criteria. The level of conflict reflects the extent of similarities among the different condition. A greater degree of dispersal and discord between criteria necessitates an increased the weight. The following stages are employed to implement the CRITIC approach.
Step 1: Decision-making involves creating a matrix: A decision matrix is established by specifying a set of p choices and q condition, which are incorporated into multi-criteria models as described.
Pij is the ith alternative rating for the jth evaluation condition.
Step 2: Normalization: The structured decision matrix is standardized for both advantageous and disadvantageous criteria.
Step 3: The following formula is used to determine the standard deviation (Sj) for each criterion used to evaluate the degree of dispersion:
where ∇j represents the mean of the Jth criterion, determined as follows:
Step 4: Calculate the correlation coefficient (θjk) for a pair of criteria utilizing the subsequent equation (Equation (5)).
Step 5: Assessment of the conflict level between criteria using the subsequent equation.

Where, θjk indicates the correlation coefficient between the ith and jth condition.
Step 6: Weight assessment
The formula for calculating the jth condition weight is as follows [37]:
Measurement of Alternatives and Ranking according to Compromise Solution (MARCOS) method
Stevic and Goran Popović developed the MARCOS MCDM technique for healthcare supplier prioritizing. The MARCOS technique is employed to address various decision-making issues due to its simple calculations. The further phases of the MARCOS technique are outlined.
Step 1: Decision-making matrix: The basic choice matrix (|Zij|pxq) is augmented by include the best value (IV) and the worst value (AIV), resulting in the following representation.
The AIV and IV are calculated using the following equations.
Step 2: The following formulae are used to normalize the revised decision matrix within the interval of 0 to 1.
Step 3: The following equation is used to calculate a weighted normalized decision matrix.

Step 4: The following equation is used to calculate the sum of the weighted normalized matrix values.
Step 5: Assessment of the utility value of alternatives. The utility degrees for AIV and IV are calculated using the following formulae.
Step 6: The following equations are used to compute the utility functions with respect to the AIV and IV [38].
Step 8: Calculation of Ranking: The choices are prioritized from best to worst based on descending (ki) values.
Microstructural analysis
Welded joints were sectioned, ground with SiC papers up to 1200 grit, polished with alumina slurry, and etched using Keller’s reagent. Prior to SEM imaging, samples were sputter-coated with gold to enhance conductivity. SEM analysis was conducted using a ZEISS microscope at BIT, Sathyamangalam, Erode, Tamil Nadu, India, with 15 kV and 1 kV accelerating voltages, offering resolutions of 0.8 nm and 1.6 nm, respectively. Images were taken at 500×-2000× magnification across NZ, TMAZ, and HAZ. Macrostructural analysis was performed using a ZEISS optical system (ZEISS GEMINI) in Sathyamangalam to assess weld flow and defects.
|
Fig. 1 Fabrication of composite materials. |
|
Fig. 2 (a) Friction stir welding machine (b) Square, Hexagon and Cylindrical tool profiles. |

Single response optimization using Taguchi technique
After completion of the tensile testing in accordance with the experimental design, the findings are acquired. The experimental material properties are derived from the results using mathematical formulas and graphical techniques. The ideal variables have been identified for the examination. This is accomplished by examining the Taguchi design and assessing the proportion contribution of each element to the material attributes. The design analysis was conducted using the statistical program MINITAB 20. Upon the addition of the experimental design into the tool, the suitable response is chosen from the four acquired material attributes, followed by a comprehensive examination of each response.
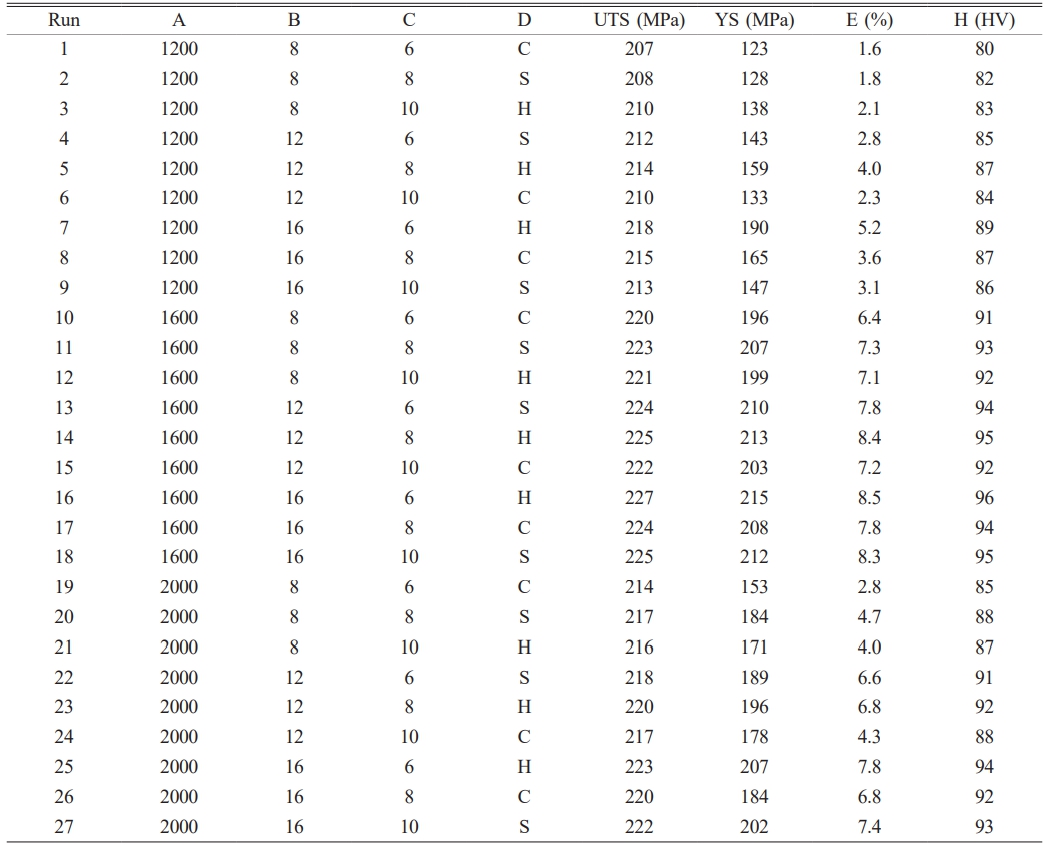
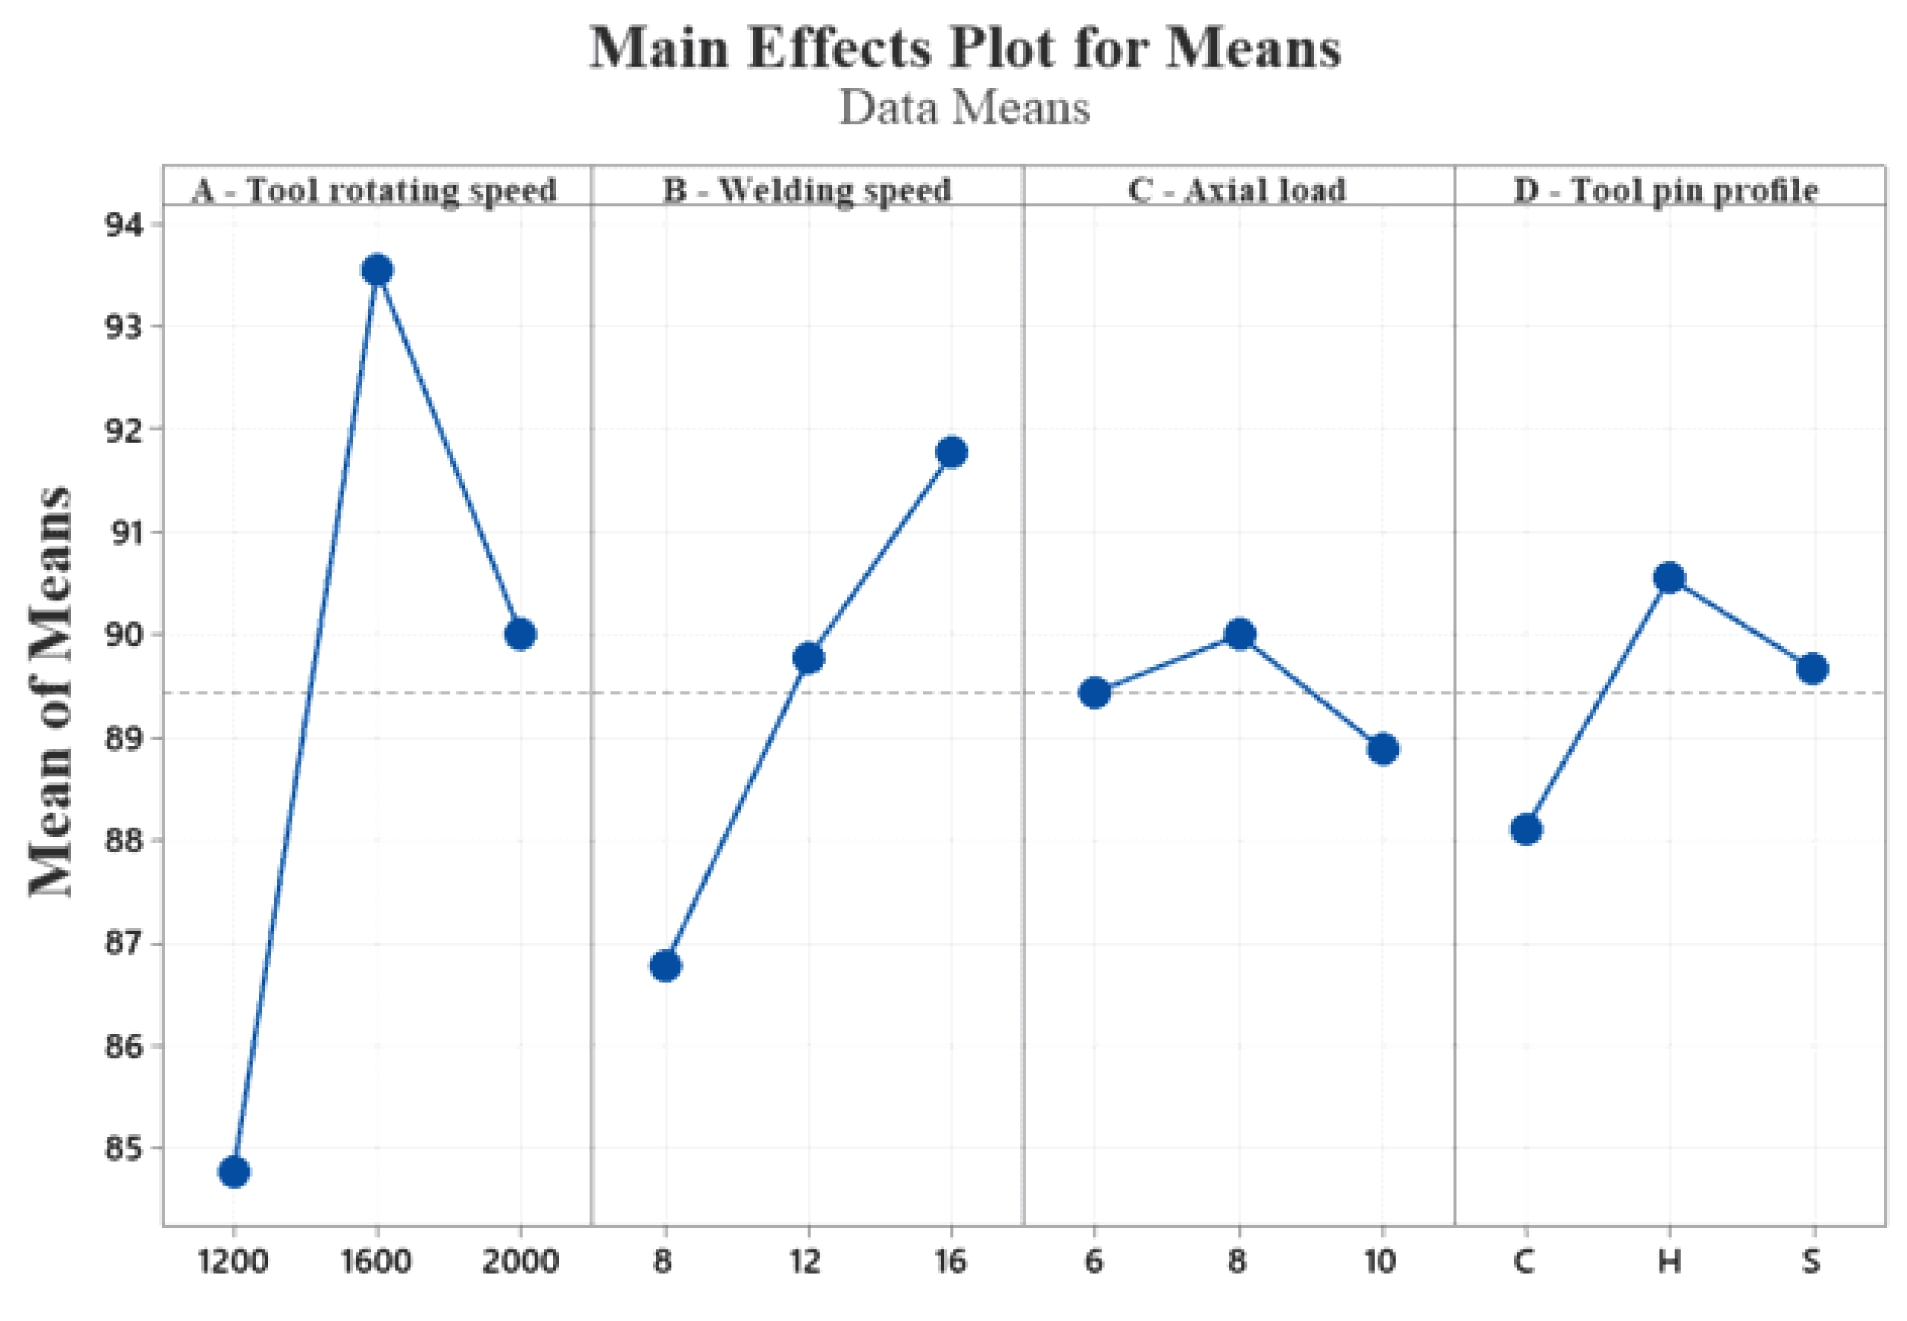
Ultimate tensile strength (UTS)
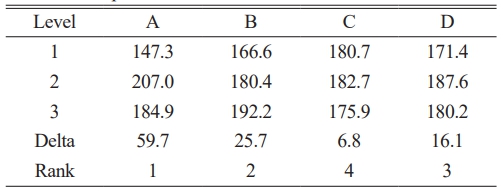
The response table was derived from the data shown in the main effects plot, as showed in Tables 5-8. Fig. 3 illustrates the Main Effects Plot, indicating that the ideal parametric factors for maximum ultimate tensile strength are specified in Table 6.
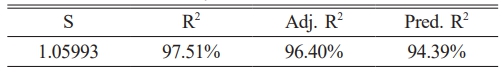
The ANOVA indicates that tool rotation speed significantly influences ultimate tensile strength, contributing 74.68%. Additionally, the model summary in Table 8 shows an R-squared value of 97.51%, indicating excellent optimization.
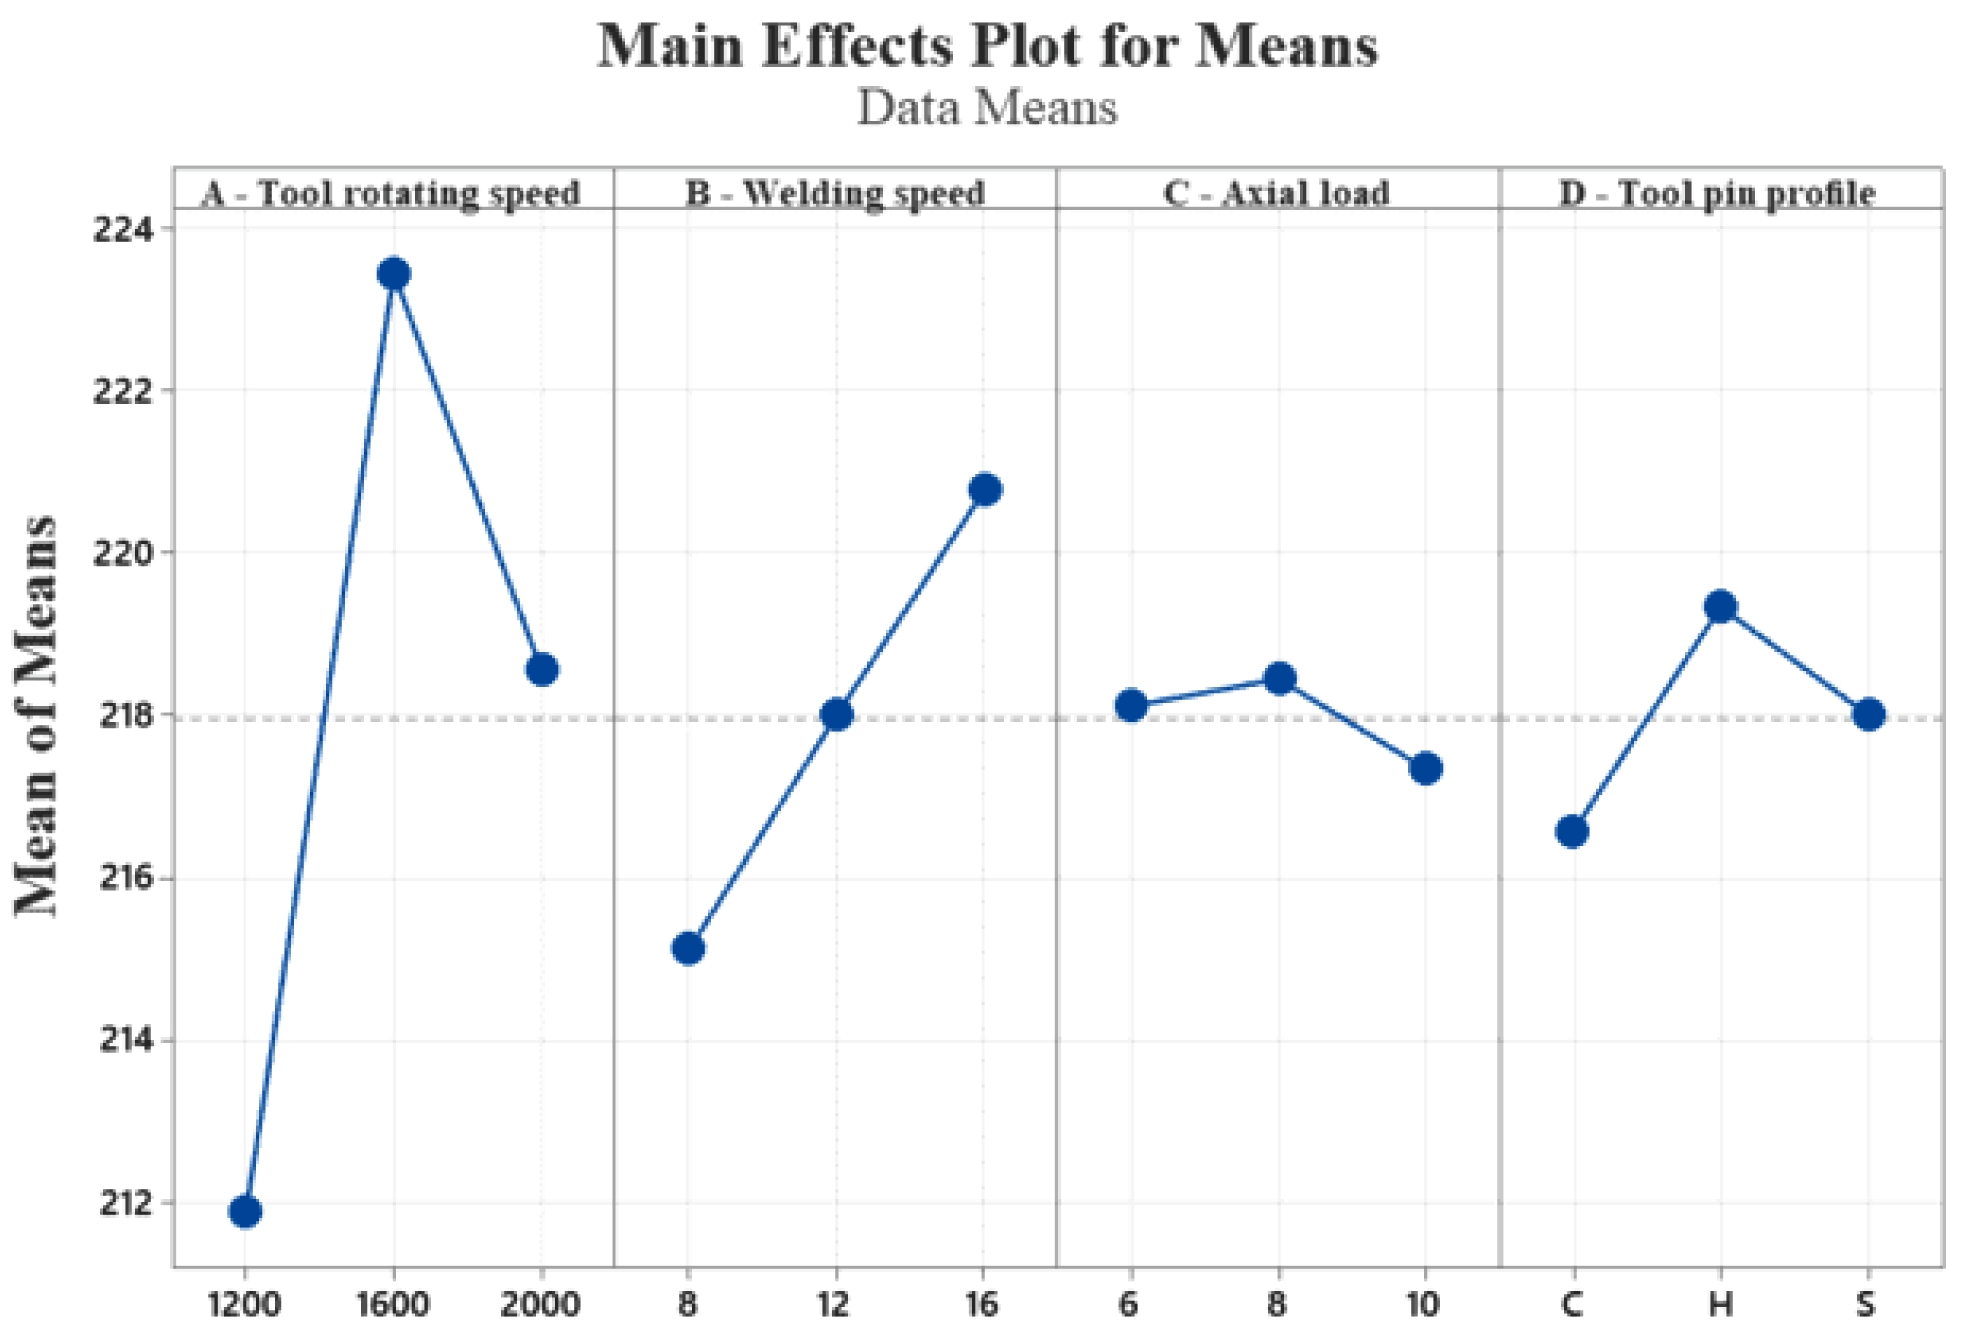
Yield strength (YS)
The response table derived from the data shown in the main effects plot as displayed in Tables 9-12. Fig. 4 demonstrates that the optimal parametric settings for highest yield strength are detailed in Table 10.
The ANOVA indicates that tool rotational speed significantly influences yield strength, contributing 72.98%. Additionally, the model summary in Table 12 shows an R-squared value of 92.41%, suggesting excellent optimization.
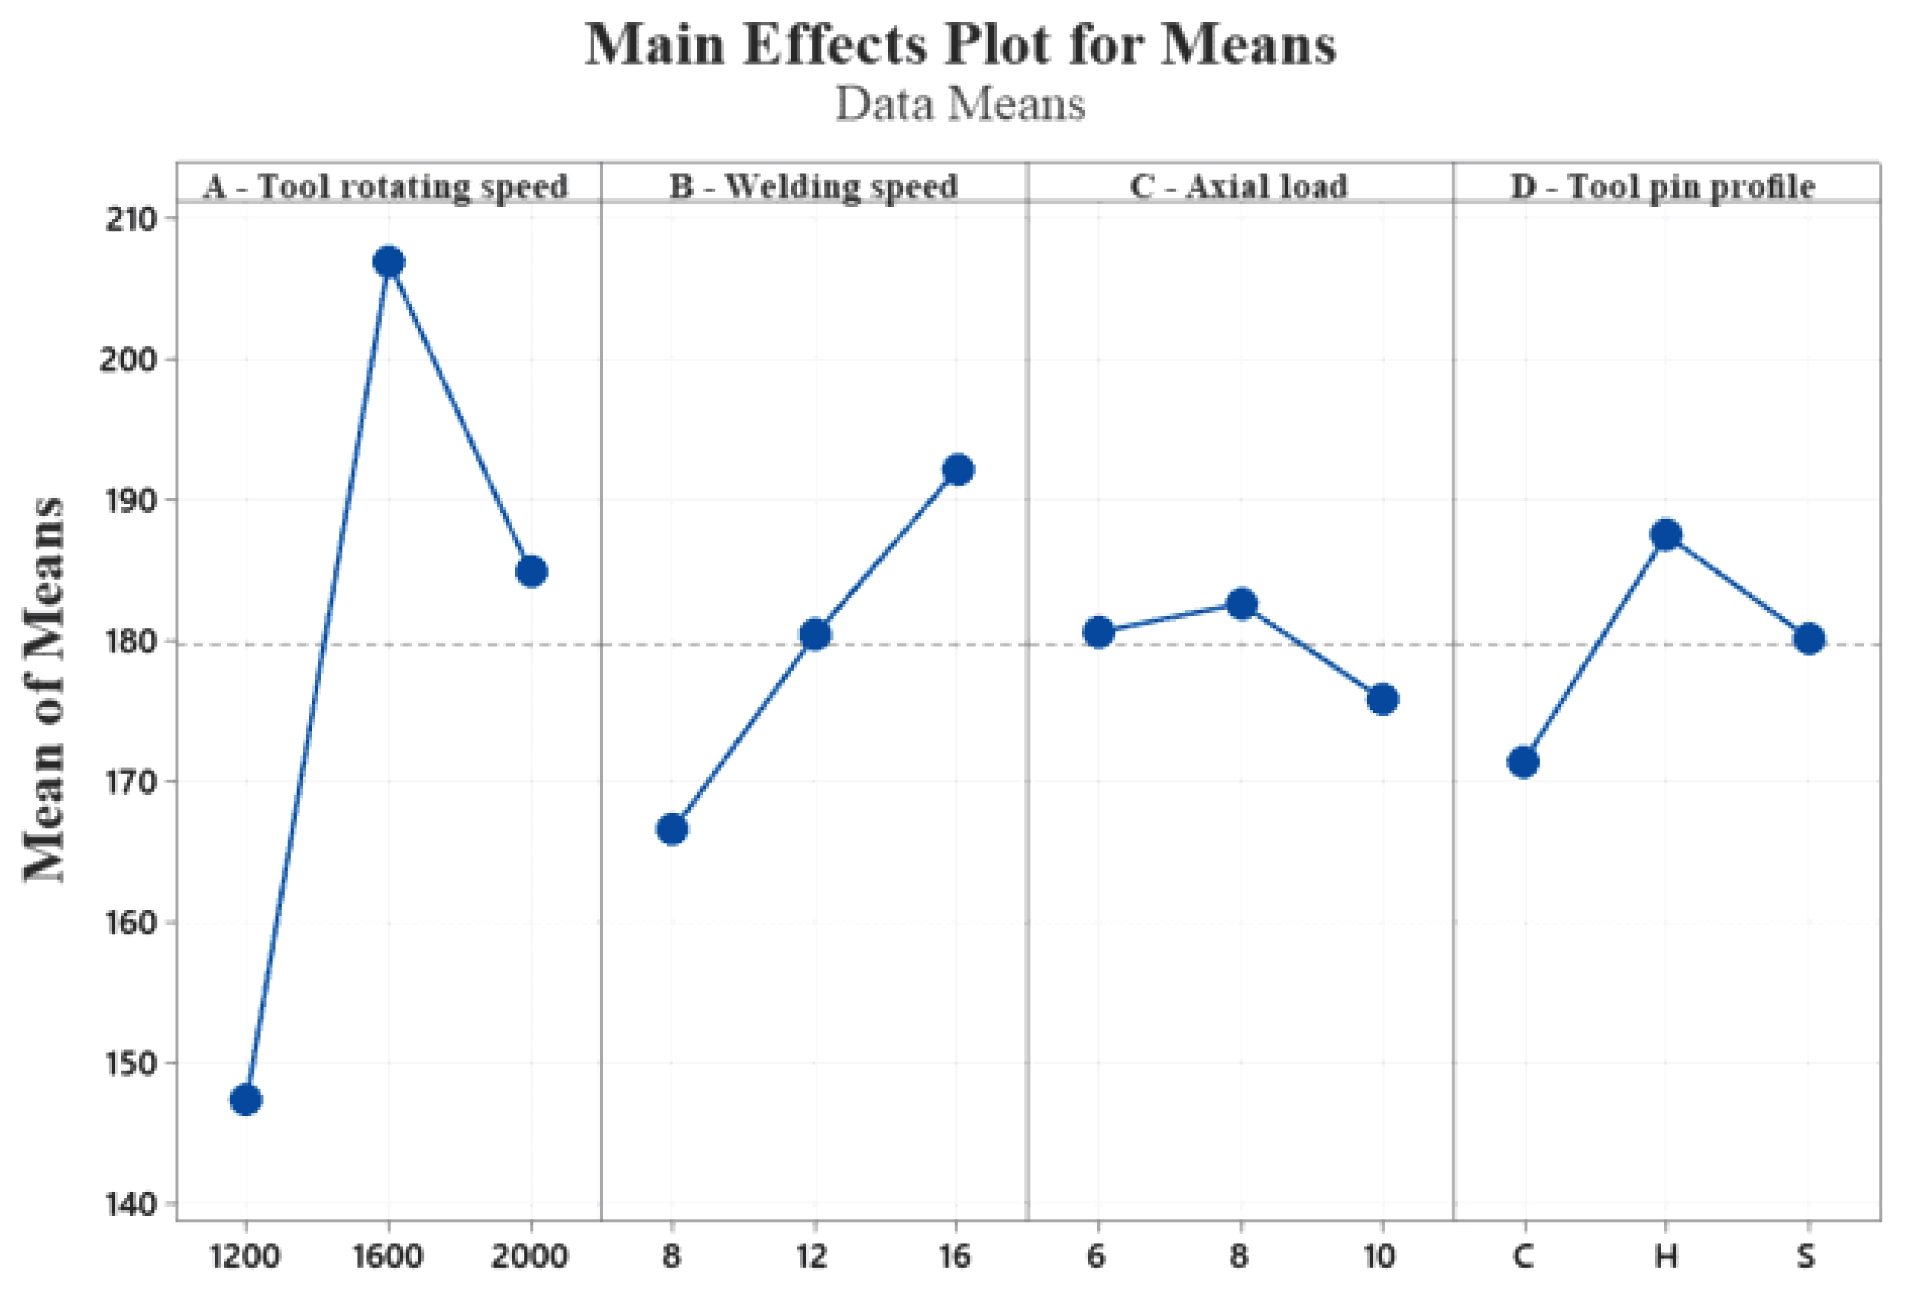
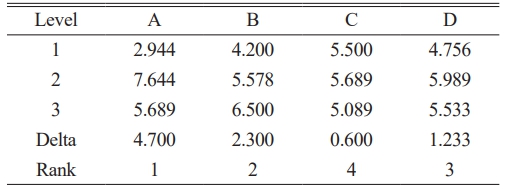
Percentage elongation (% El)
The response table is derived from the data shown in the main effects plot, as tabulated in Tables 13-16. Fig. 5 demonstrates that the optimal parametric settings for maximum elongation are detailed in Table 14.
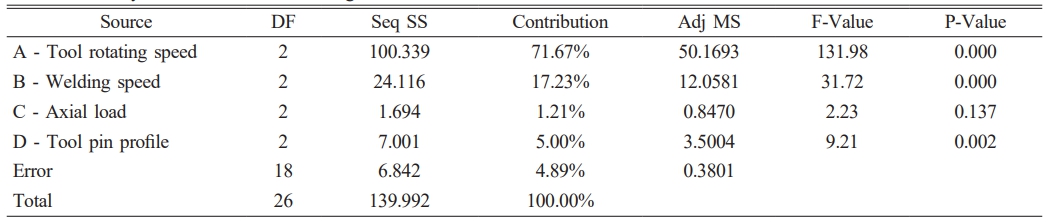
According to the ANOVA presented in Table 15, tool rotational speed exerts the greatest influence on percentage of elongation value, contributing 71.67%, followed by temperature, which also affects the percentage of elongation. The model summary in Table 16 indicates an R-squared value of 95.11%, suggesting that the optimization is satisfactory.
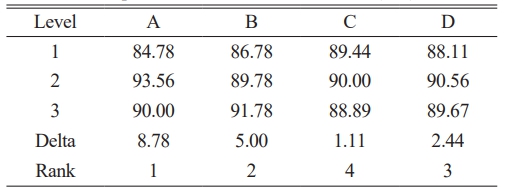
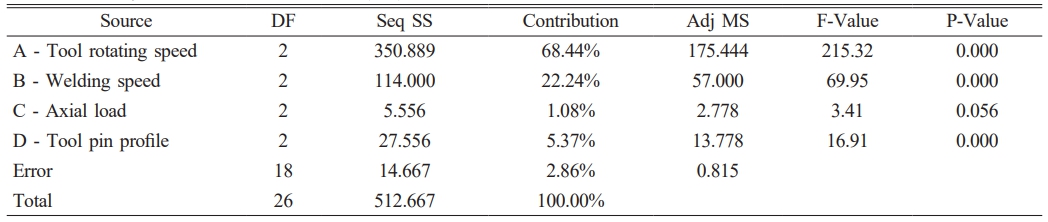
Hardness (HV)
The response table is based on the data shown in the main effects plot, as demonstrated in Tables 17-20. Fig. 6 showed the main effects plot, indicating that the ideal parametric values for maximal elongation are specified in Table 18.
According to the ANOVA presented in Table 19, tool rotational speed significantly influences the hardness (HV) value, contributing 68.44%, followed by temperature, which also affects hardness (HV). The model summary in Table 20 indicates an R-squared value of 97.14%, suggesting a satisfactory level of optimization.
CRITIC - MARCOS Optimization Result
The TRS, WS, AL, and tool profile parameters for each scenario dictated by the Taguchi L27 array are tabulated in Table 4. The alteration of process parameters (TRS, WS, AL, and tool pin profile) and FSW from AA 2017 distinctly affects the resultant responses. Initially, an appropriate process parameter is established to maximize the UTS, YS, elongation percentage, and hardness of the joint, aiming to produce flawless, high-quality weld joints. Square pin profiles with 1100 rpm and 60 mm/min were optimized using Taguchi method, yielding the highest tensile strength (181 MPa) with ductile failure observed in SEM fractography [39].
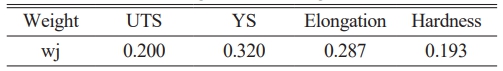
Similarly, the decision matrix for the CRITIC weighting approach was normalized utilizing Equation (2) [40]. Following normalization, the values of standard deviation (Sj), correlation coefficient (θjk), and information measure (j) were calculated using Equations (3) to (5). The attribute weight (w-j) was ascertained using Equation (7) and is presented in Table 21.
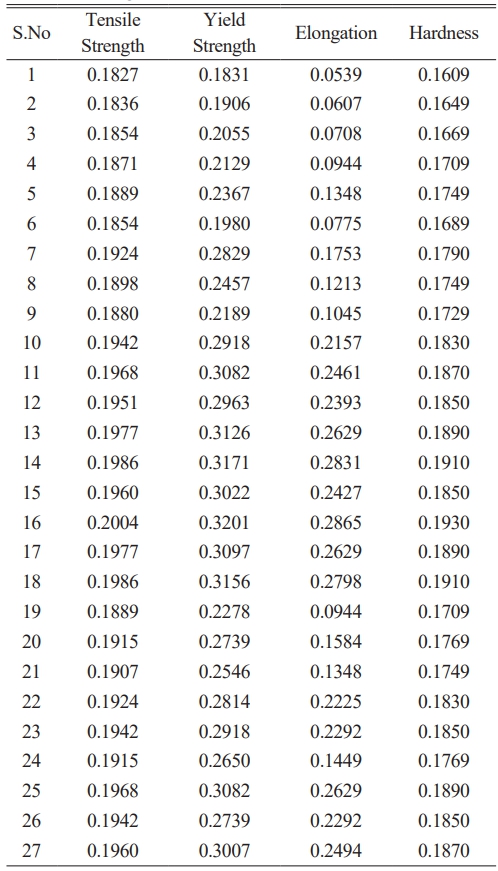
The choice matrix is constructed after establishing the best value (IV) and worst value (AIV) using Eq. 9 and 10. The organized decision matrix employed in the MARCOS study for the designated criteria and alternatives is illustrated in Table 4. According to the MARCOS technique, each value is normalized using Equations (11) and (12). Table 22 displays the normalized decision matrix for the MARCOS study.
The weights presented in Table 21, derived from the MEREC methodology are subsequently used to construct the weighted decision matrix utilizing Equation (13). Table 23 illustrates the weighted decision matrix.
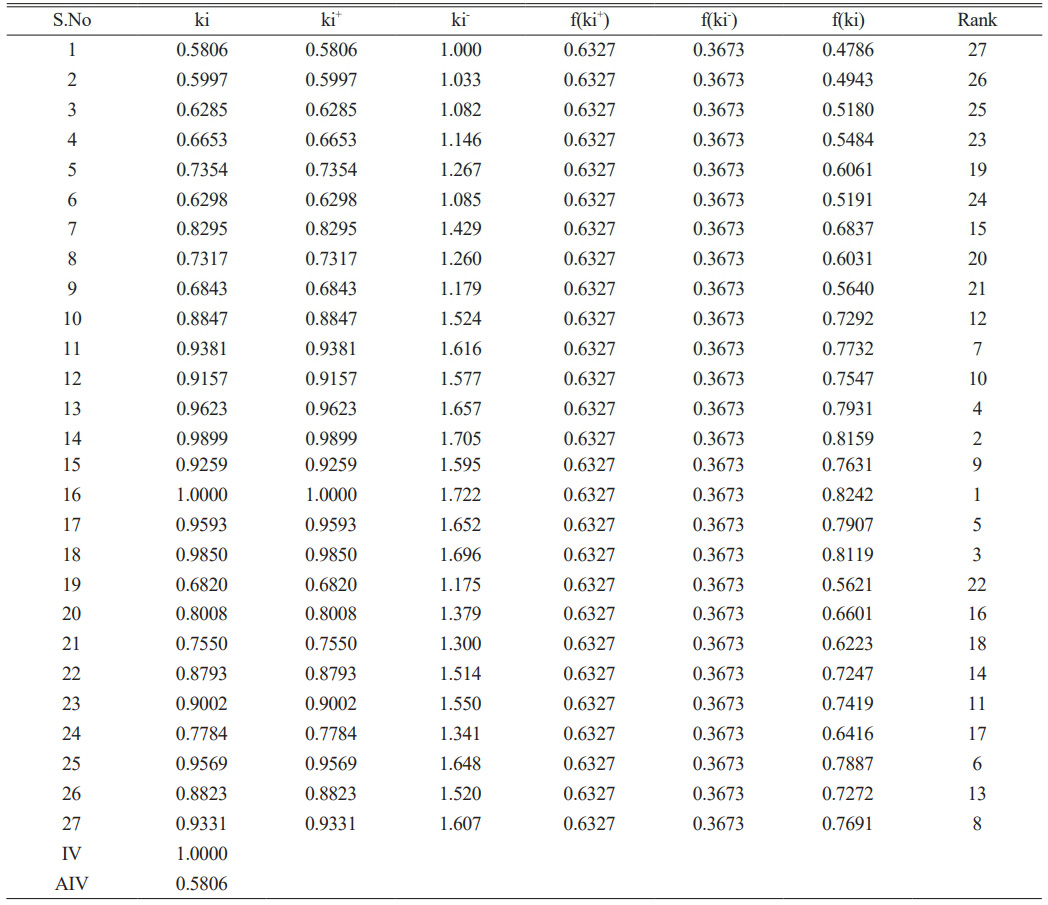
Subsequently, Equations (13)-(15) of the MARCOS technique are employed to derive the utility degrees (ki+, ki-) and the utility functions (f(ki+, ki-) and the utility functions (f(ki+), f(ki-)) for the alternatives. Subsequently, the ultimate utility function f(ki)) for each option is established utilizing Equation (16). The findings of the MARCOS investigation are encapsulated in Table 24.
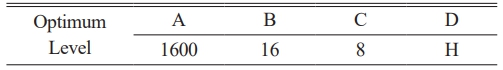
The possibilities are ranked based on the acquired (ki) values. The optimal FSW process factors derived from the MCDM techniques (CRITIC and MARCOS) include a WS of 16 mm/min, a TRS of 1600 rpm, an AL of 6 N, and the most effective tool pin profile is hexagonal, yielding an YS of 215 MPa, a UTS of 227 MPa, an elongation of 8.5%, and a hardness of 96 HV. Micro-FSW (-FSW) of AA6061-T6 and AA5052-H32 was performed with different backing plates (cordierite ceramic, titanium, copper) to assess heat loss effects. Process factors were 9000 rpm, 300 mm/min, and 0 tilt, it achieved the highest tensile strength (222.63 MPa) [41].
Finding of ideal parameters
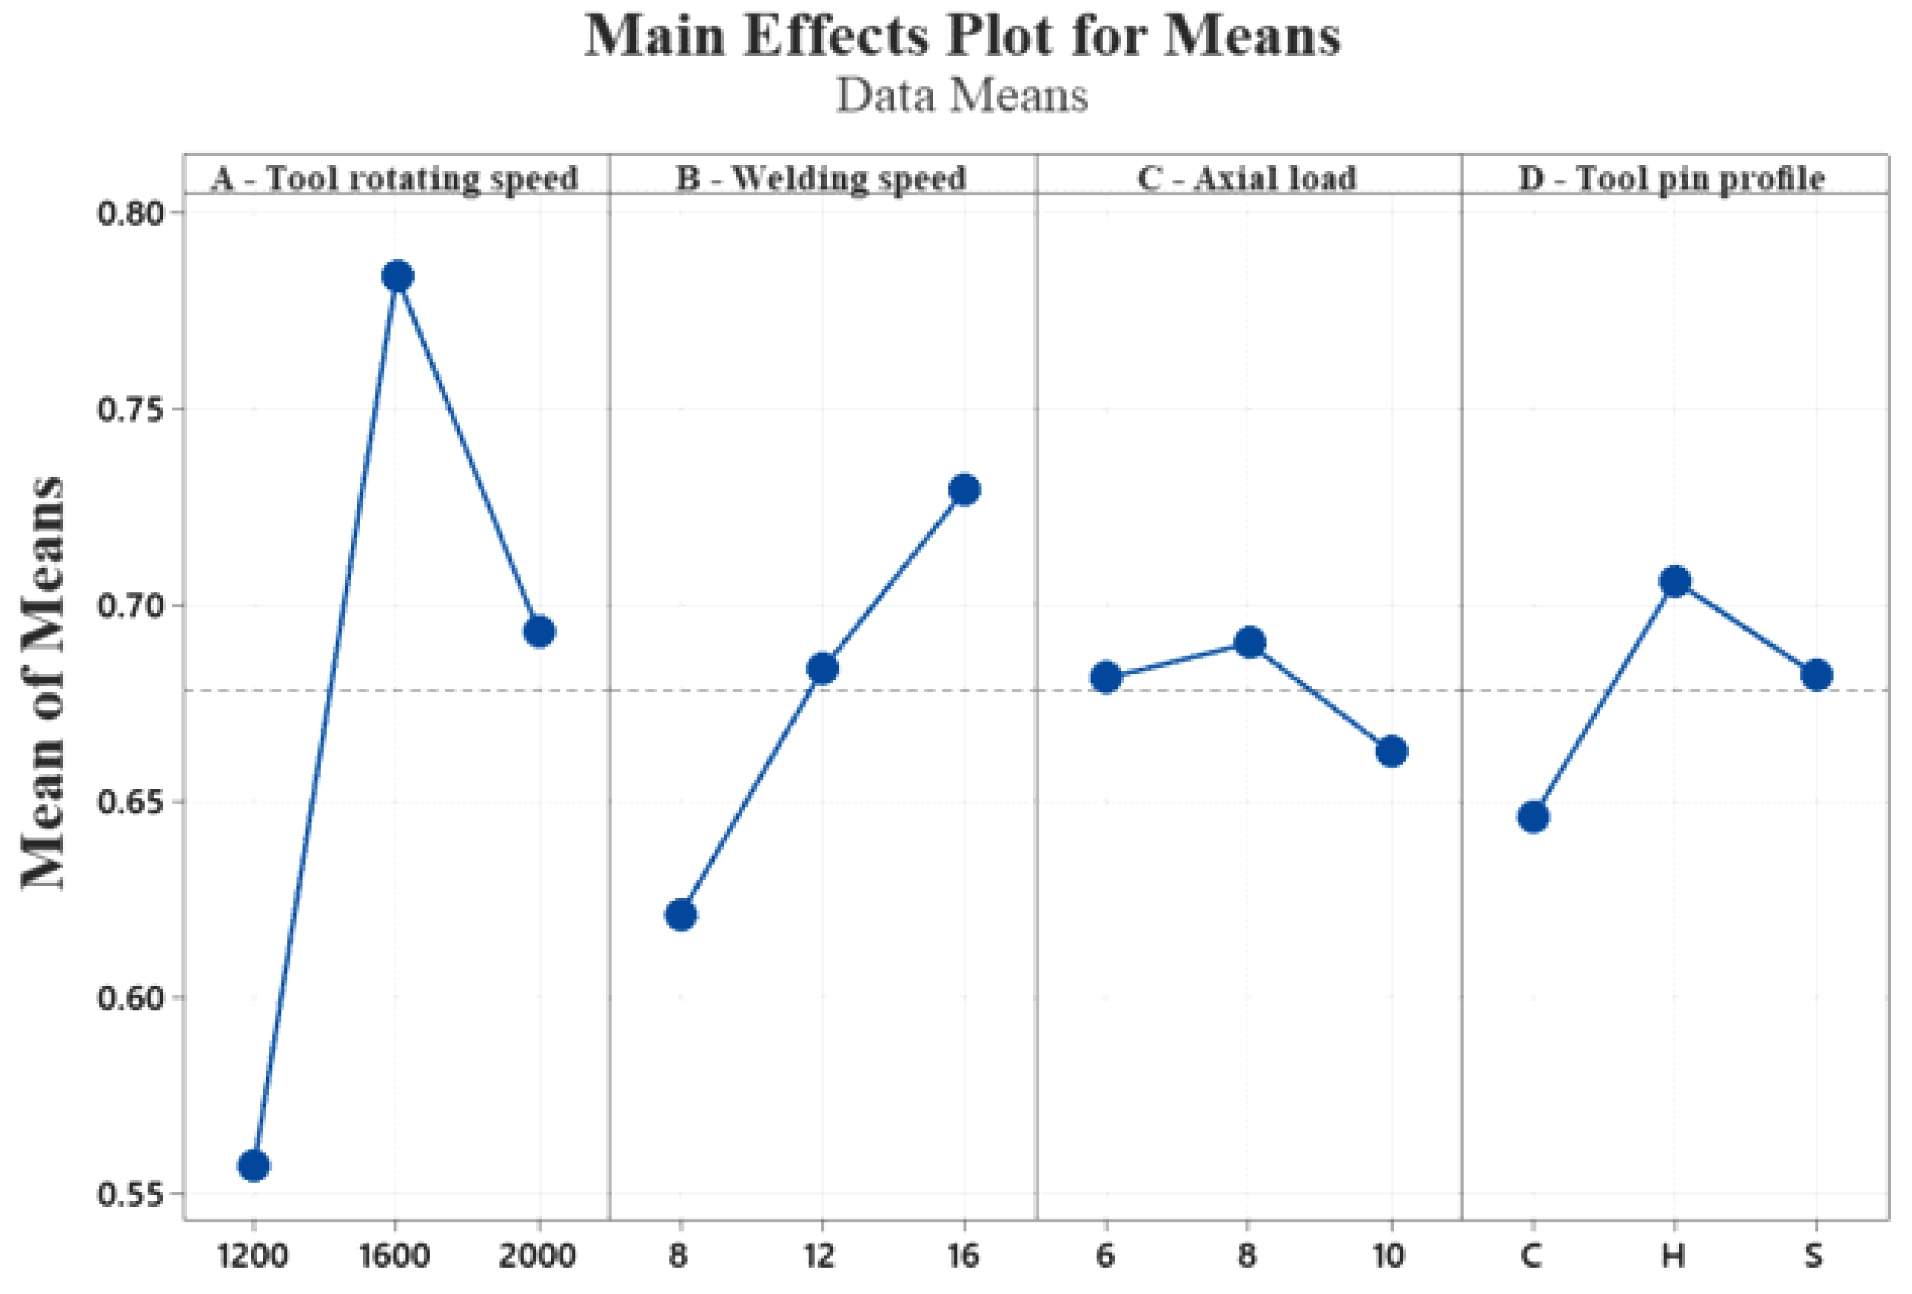
Comparing the utility functions (f(ki)) of multi-objective optimization with the optimum order is essential for identifying the ideal set of process variables and assessing the importance of every variable combination. The greatest f(ki) value, near to unity, denotes the ideal amalgamation of response quality and process variables. Experimental run 16 indicates the highest f(ki) value of 0.8242, indicating it as the optimal configuration of utility functions (f(ki)) and their variables within the defined experimental framework. This factors combination guarantees optimal quality attributes for the weld joint created by the FSW method. The levels of the FSW process variables, established according to the average utility functions (f(ki)) are computed and displayed in Table 7.
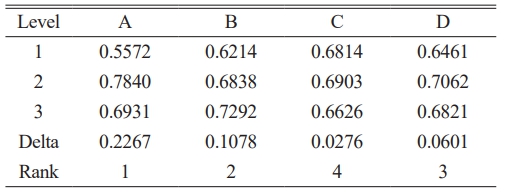
The TRS (A) significantly influences the quality characteristic, followed by WS (B), tool pin profile (D), and axial load (C). Through the examination of utility function values (f(ki)) and the use of main effects plot for means, the optimal configuration of process factors—such as TRS, WS, axial load, and tool pin profile—can be assessed to attain the ideal combination of quality attributes.
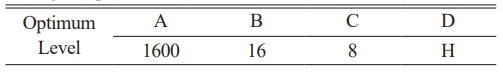
According to the results shown in Table 24, the main response of the process factors is illustrated in Fig. 7, which plots the mean utility functions (f(ki)) values against the levels of the process factors. Analyzing Table 25 alongside the main effect plot enables the identification of the ideal combination of process factors. The ideal parameter combination is determined to be 1600 rpm for TRS (A2), 16 mm/min for WS (B3), 8 kN for AL (C2), and Hexagon for tool pin profile (D2). Consequently, an ANOVA is conducted to estimate the impact of the welding factors on the aggregated welding results.
ANOVA analysis and optimization
An analysis of variance (ANOVA) is implemented to identify the causes of change in the objective function. The impact of each variable on the process can likewise be determined using this method. The F-value, P-value, or contribution (%) values can be used to evaluate the impact of welding factors on the output of the utility function f(ki).
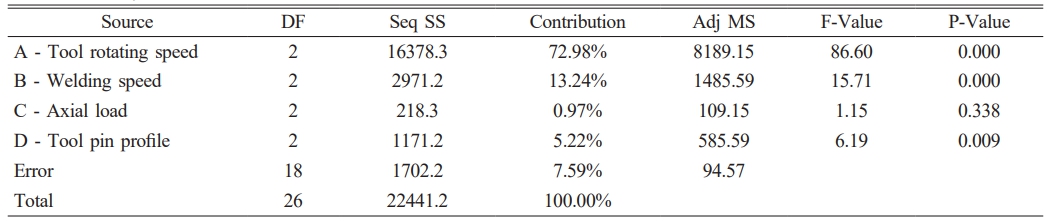
Table 26 illustrates the contributions and relative importance of the process variables, ascertained using analysis of variance of the specified utility function values (f(ki)). The primary factor is the tool rotational speed, accounting for 72.91% of the contribution. The welding speed is 16.40%, whereas the tool profile pin is 5.12%. The R2 is 99.55%, signifying that all the process variables were statistically significant at the 95% confidence level. Moreover, at the 95% confidence level, with a P value (see Table 8) below 0.05 for each process variable, it is clear that all the welding variables are significant. In contrast, the model demonstrates a R2 = 99.55% and an adjusted R2 = 93.57%, indicating a robust correlation between the observed and predicted results. ANOVA is a statistical method utilized to determine the elements most likely to influence the results of an experiment. ANOVA in welding helps determine the welding variables that significantly affect weld quality. ANOVA results can enhance the welding process by optimum welding variables.
To assess the importance of the adjusted mean of the utility functions (f(ki)), the ANOVA was compared and detailed in Table 26. The model accurately depicts the relationship between the objective function and the parameters, as evidenced by its highly significant F-value. The R2 for the model is 99.55%, above the adjusted R² = 93.57%. This signifies a robust correlation between the experimental and expected outcomes. Thus, the proposed model is deemed appropriate and efficient in forecasting the reaction within an acceptable error range.
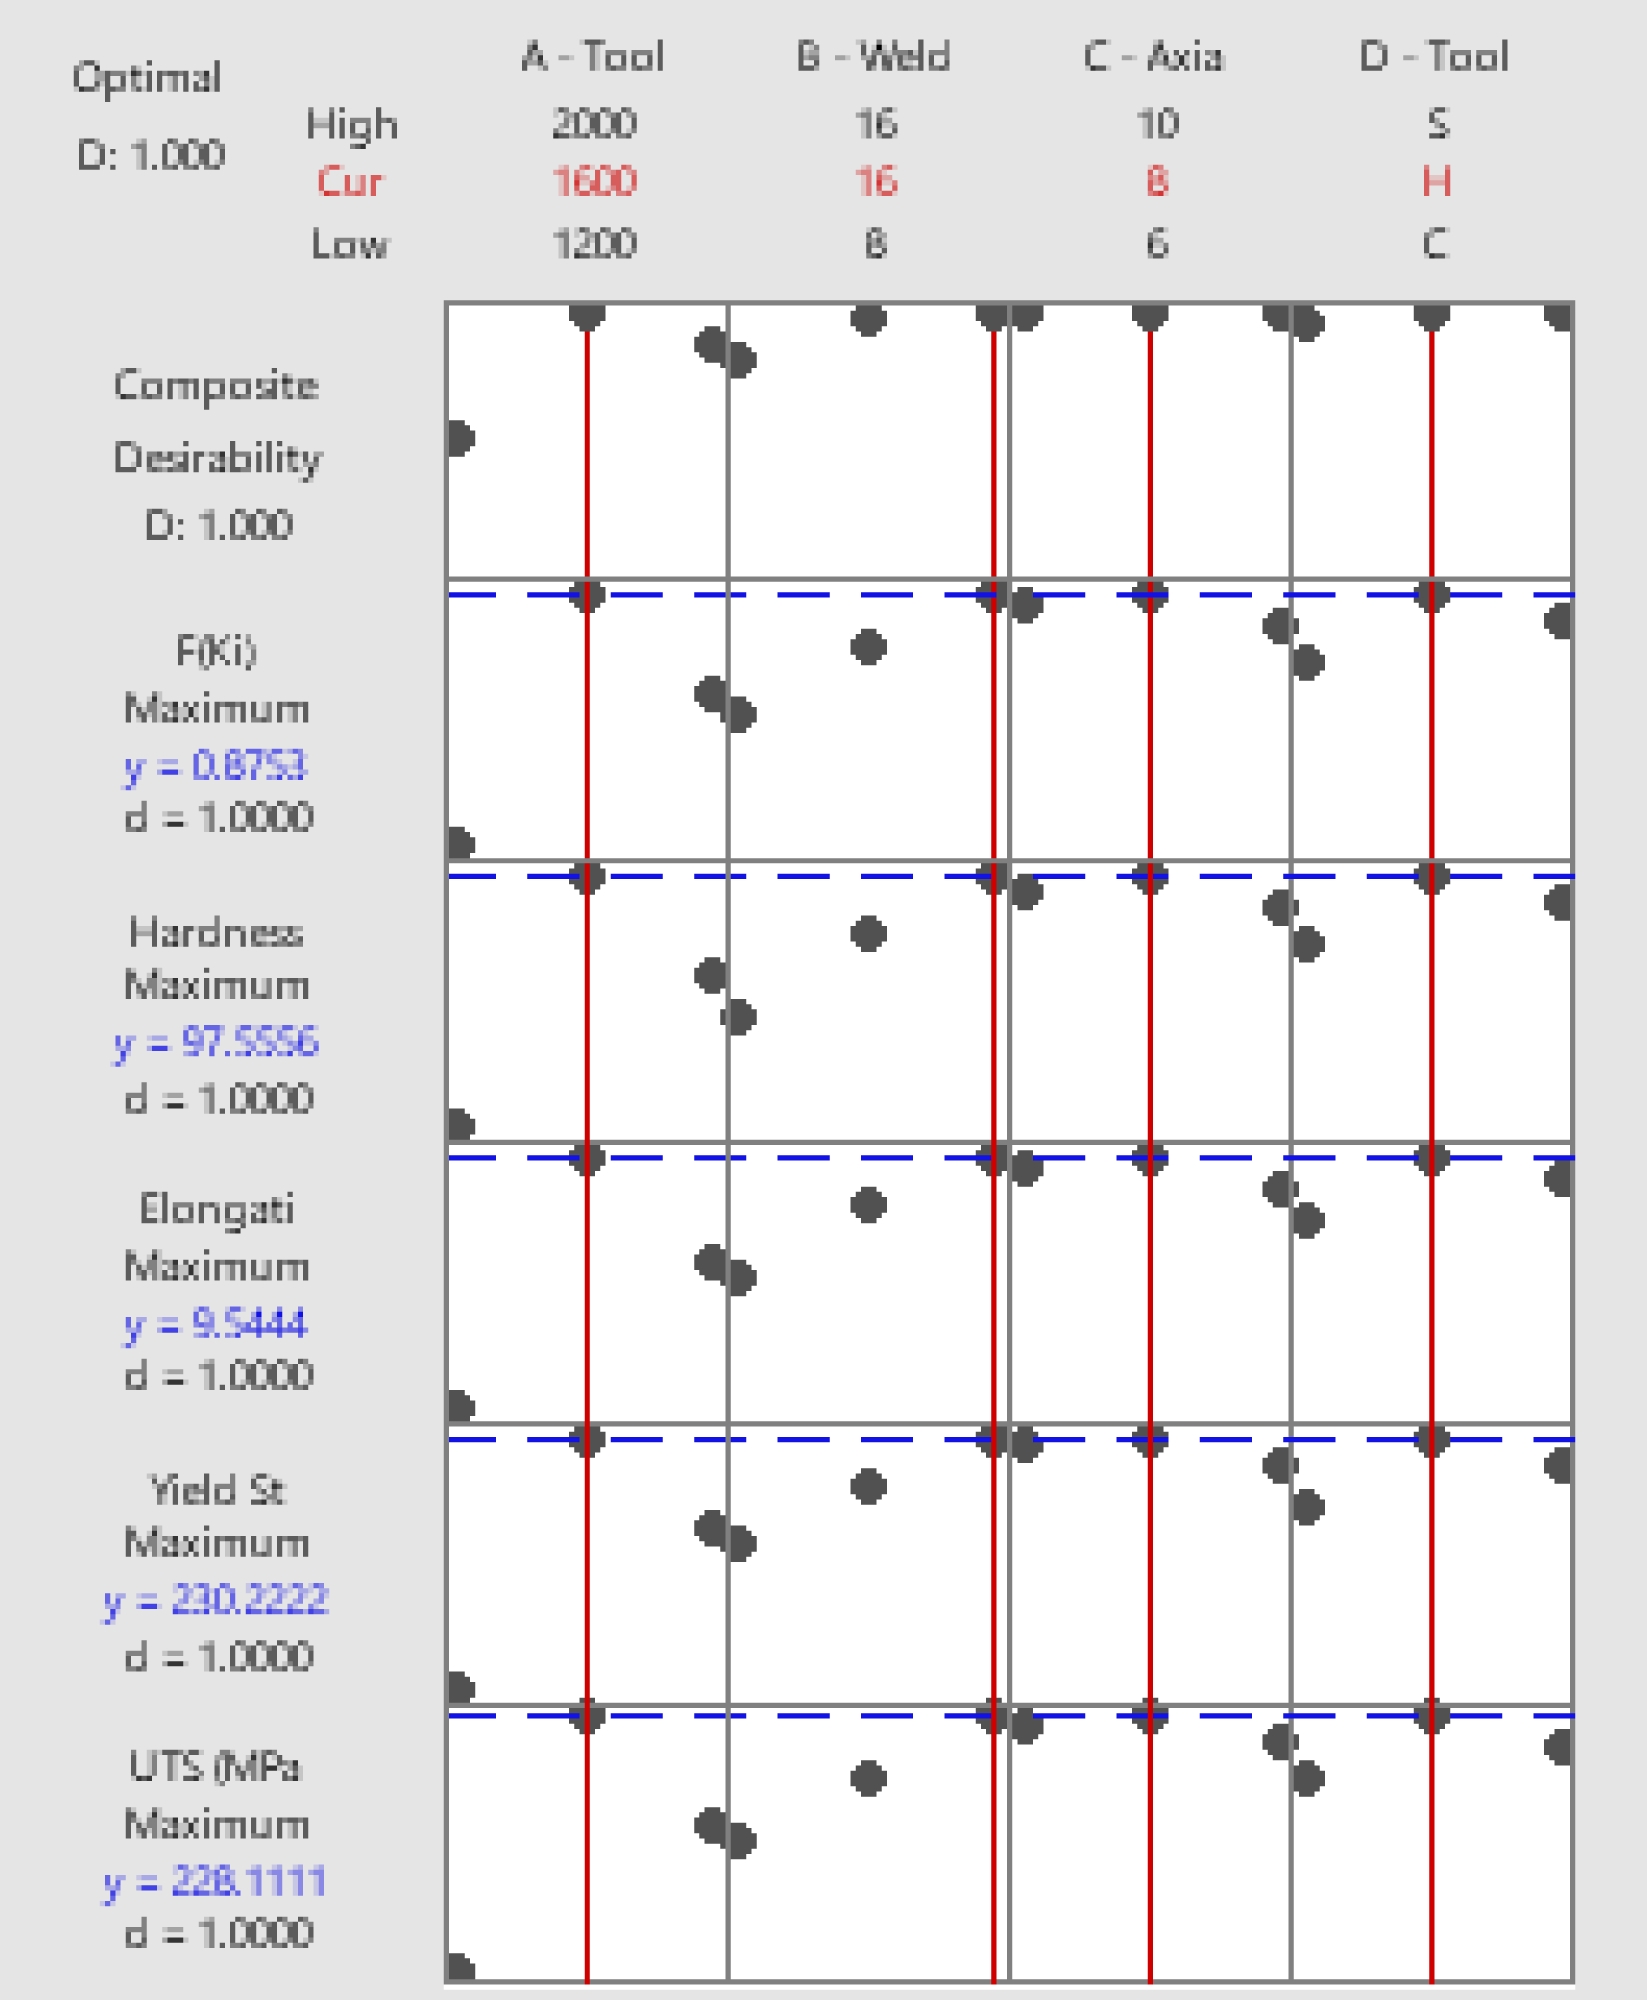
Confirmation tests
Two weld runs are conducted with varying WS, TRS, and AL, in addition to the standard design matrix parameters. The mean of the optimized factors was determined from the response optimizer plots for each response (Fig. 8). The findings obtained are satisfactory, and the outcomes are displayed in Table 27.
Microstructure Analysis
Macrograph Characterization of the Weld joints
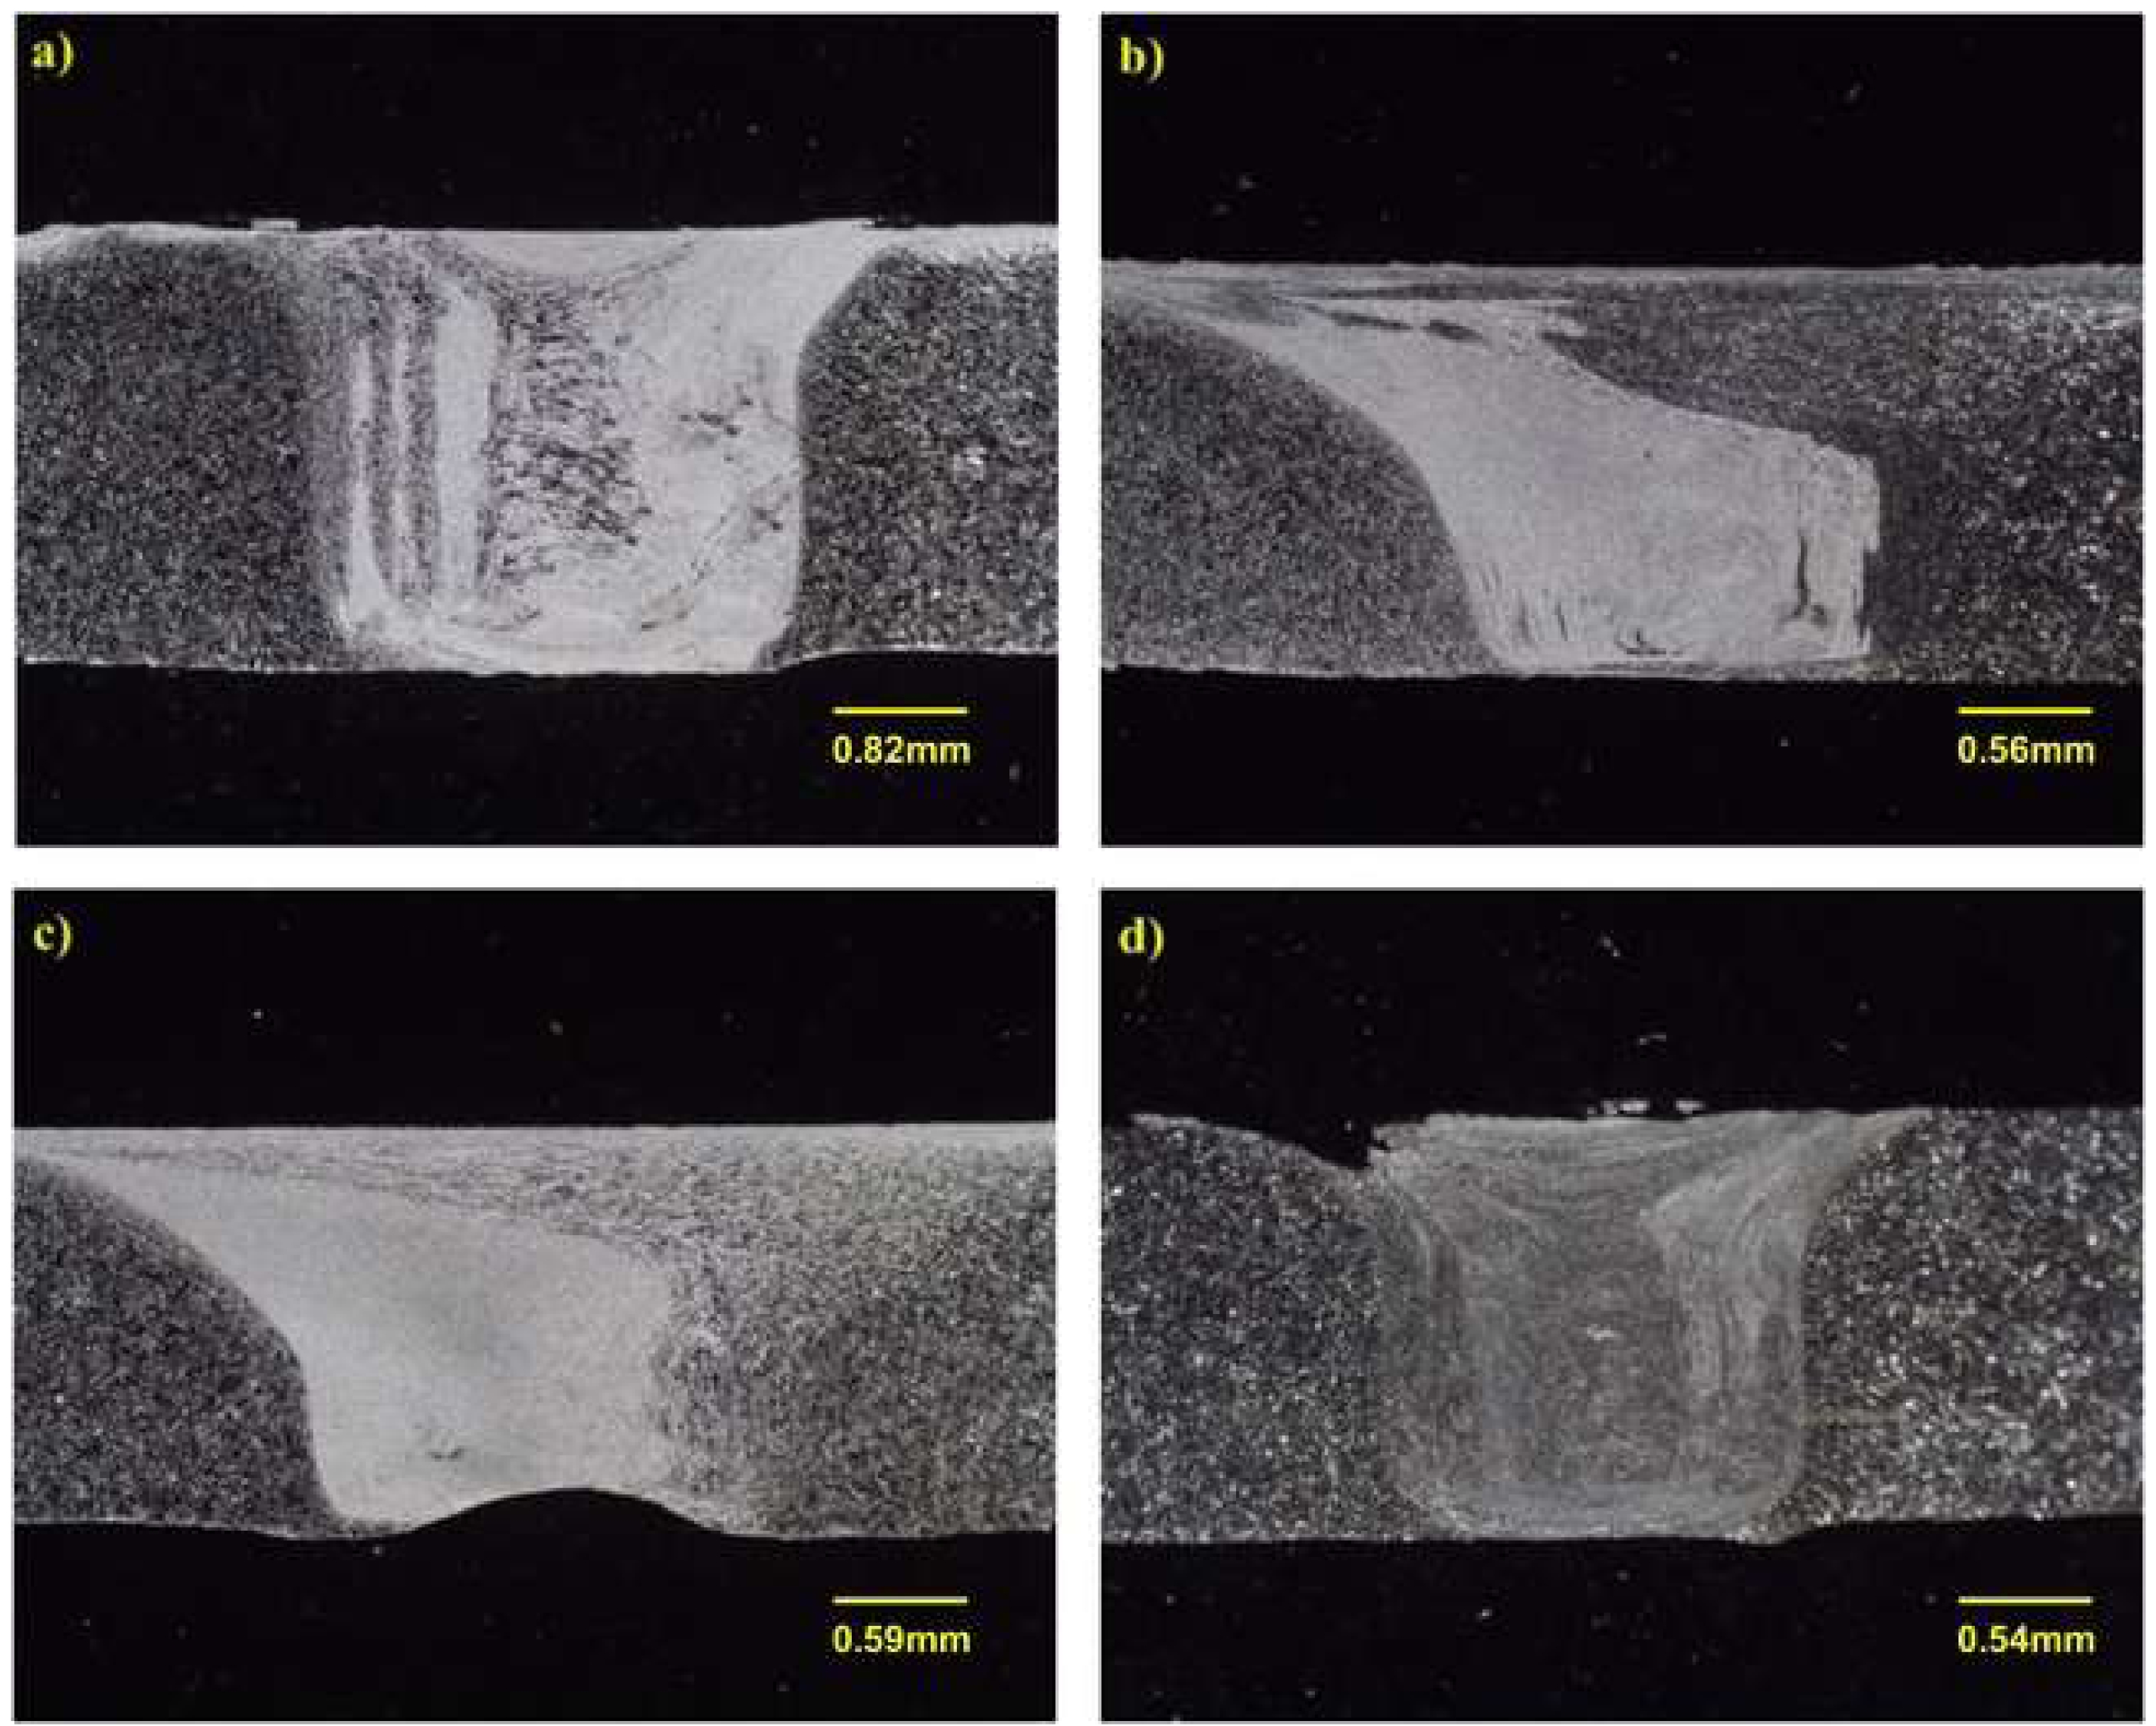
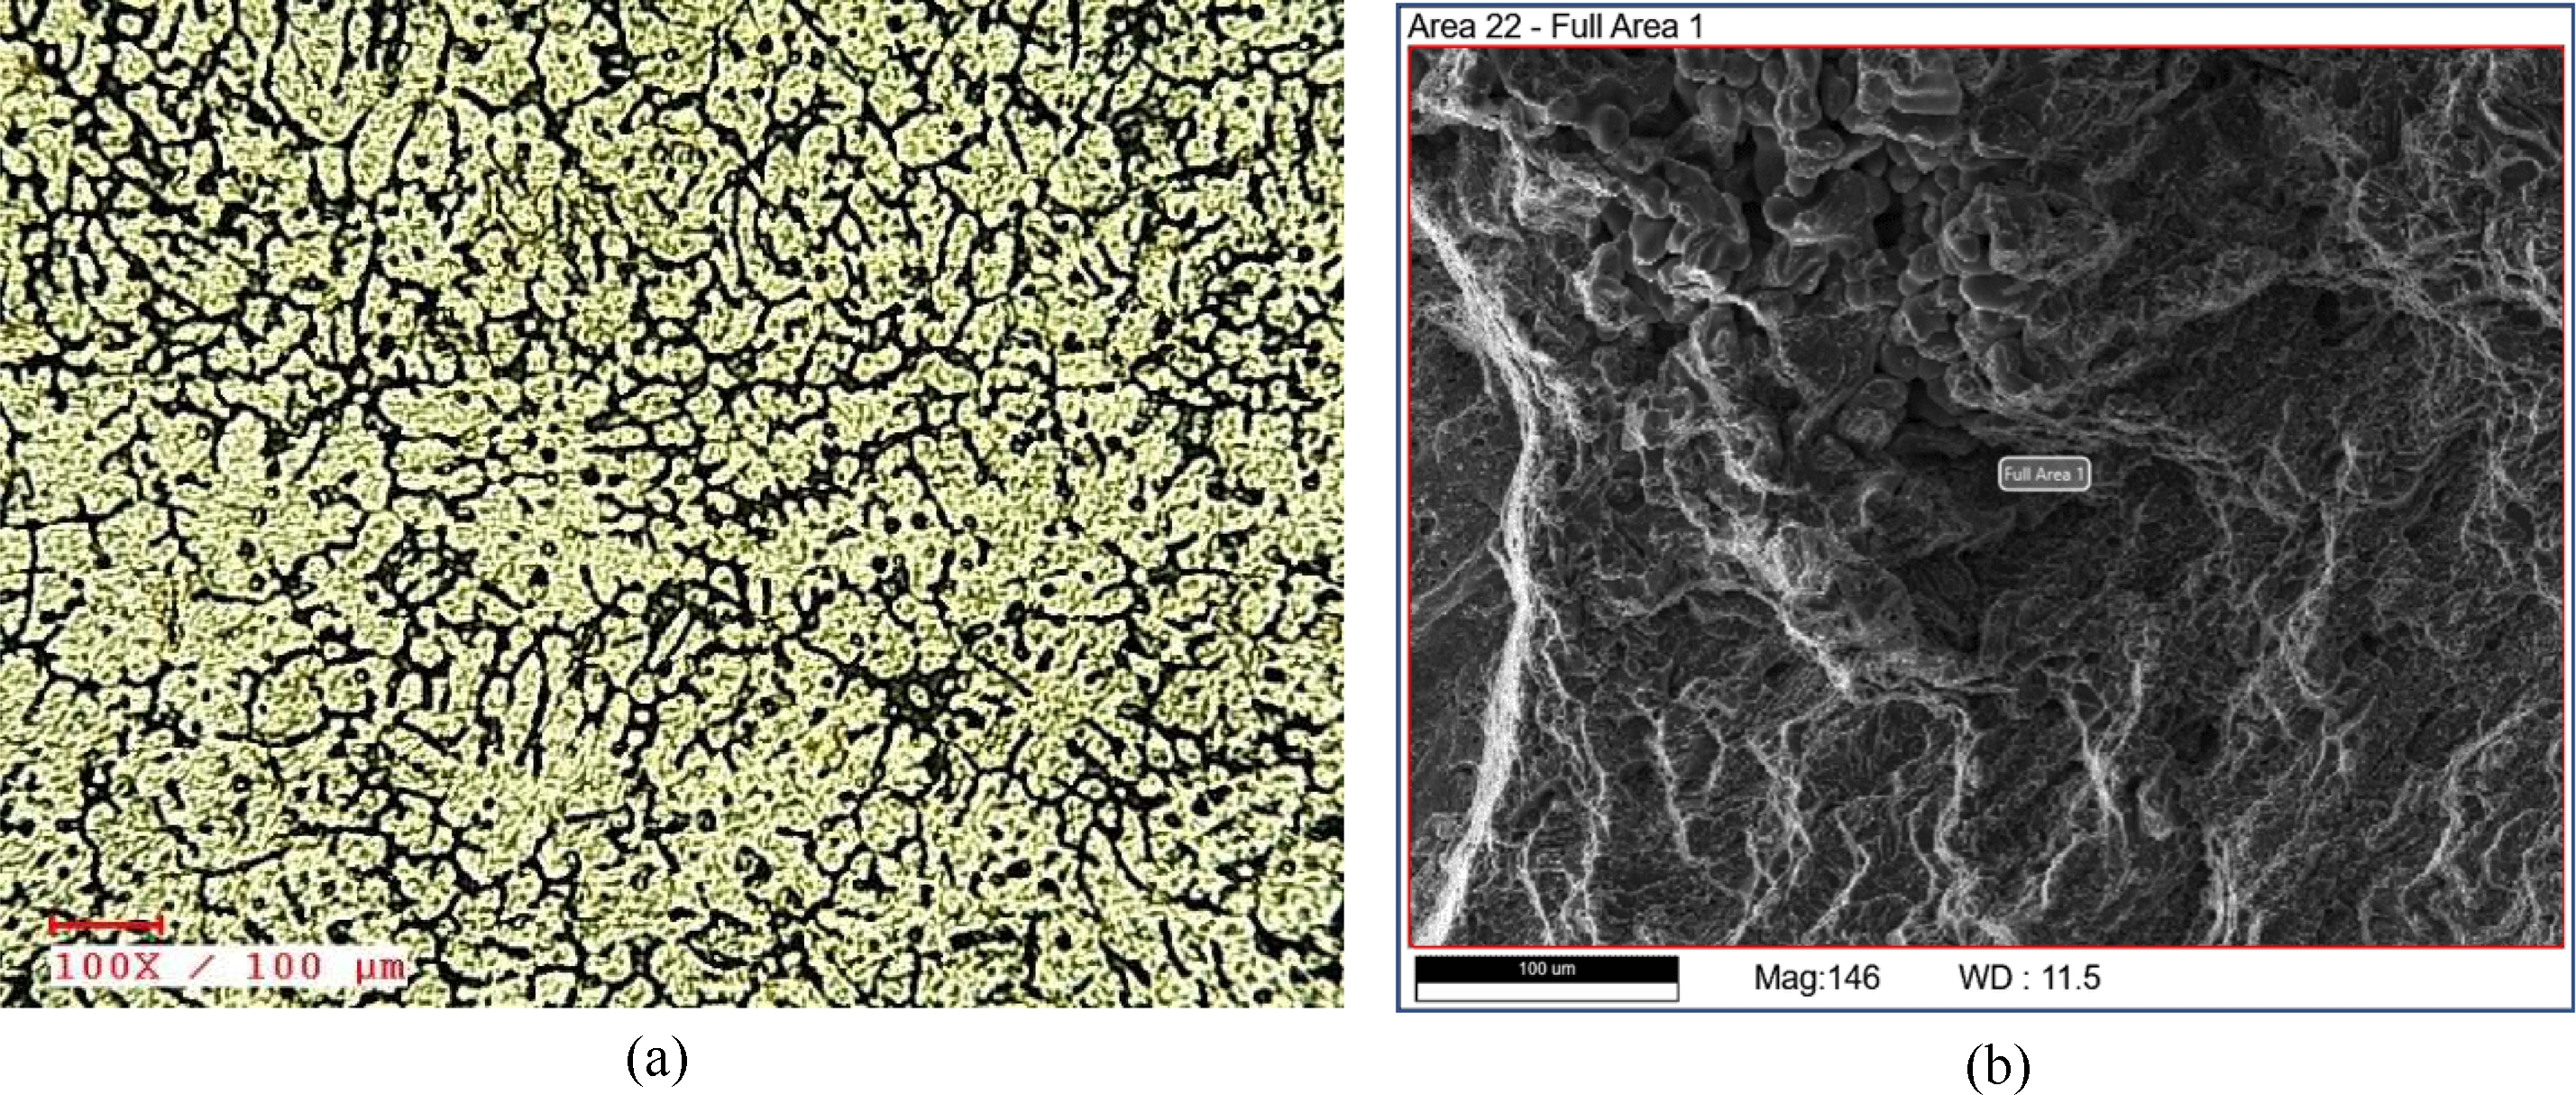
Figure 9 presents the macrostructural views of weld joints fabricated through underwater friction stir welding (UFSW) using different pin profiles and process parameters, all at a constant tool rotational speed of 1600 rpm. Fig. 9(a), corresponding to the circular pin profile at 8 mm/min traverse speed and 6 N axial force, exhibits noticeable internal defects such as tunnel voids and insufficient material flow, indicating poor consolidation due to the low stirring efficiency of the circular pin. In contrast, Fig. 9(b), formed using a hexagonal pin at 12 mm/min and 8 N, shows significant improvement in weld quality with better material mixing and defect-free nugget formation. The sharp edges of the hexagonal pin enhance plastic flow and promote uniform stirring. Fig. 9(c), produced using a square pin at 16 mm/min and 10 N, reveals a relatively sound joint with extensive material flow, though some asymmetry and excessive plasticization may be observed due to the aggressive stirring action caused by the higher axial force. Finally, Fig. 9(d), created with a hexagonal pin at 16 mm/min and a lower axial force of 6 N, demonstrates the most uniform and defect-free weld nugget, highlighting the efficiency of the hexagonal pin in promoting sufficient stirring and consolidation even under reduced axial load. Overall, the macrographs confirm that the tool pin profile, especially the hexagonal design, plays a pivotal role in determining weld quality, with optimal results achieved by balancing feed rate and axial force.
Micrographic Analysis of the Welds
Among the 16 welded joints, the hexagonal tool demonstrated an optimal value of approximately 0.8242 at 1600 rpm, 16 mm/min, and 6N. The hexagonal tool displayed an optimal UTS of 227 MPa, YS of 208 MPa, elongation percentage of 7.8, and hardness of 94 HV. Micro and macrographs were obtained for the aforementioned three combinations, and their characterization is provided below.
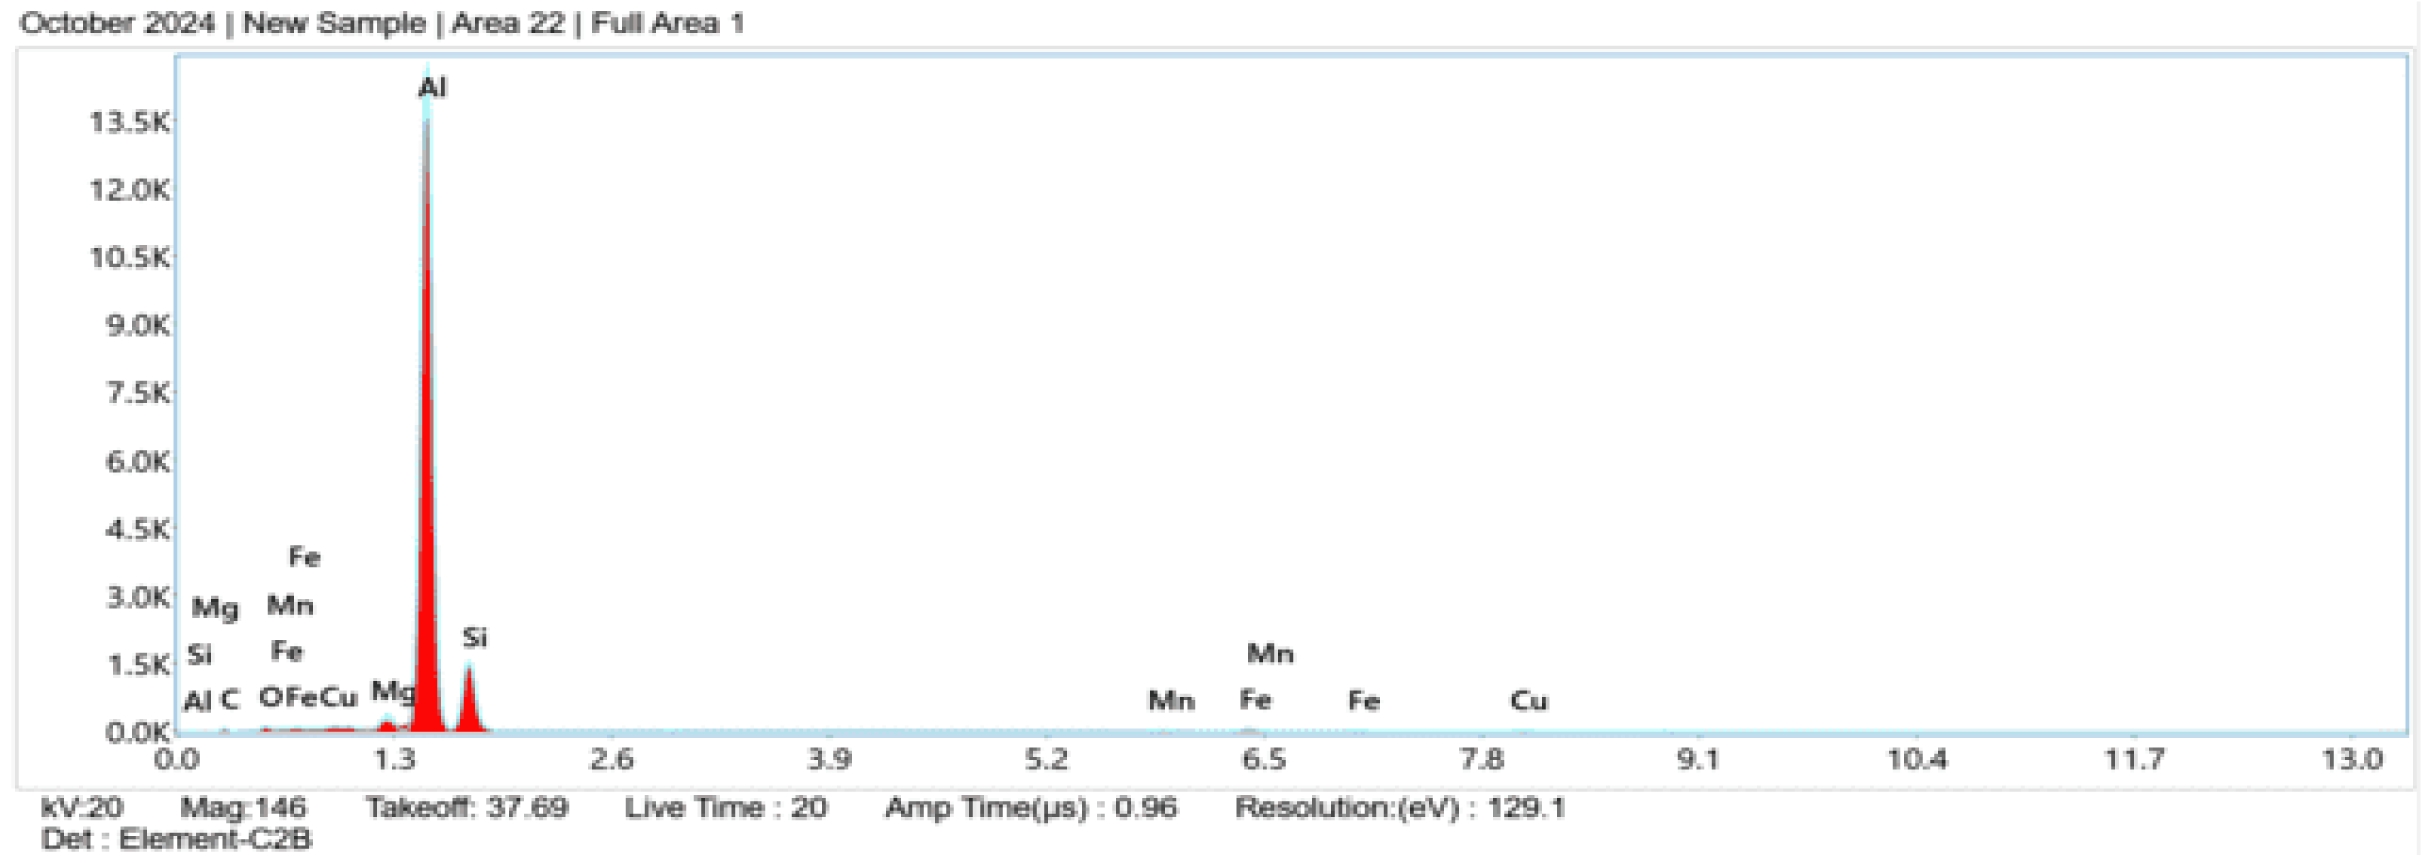
Figures 10 a and b depict the macrostructure and microstructure of the weld joint interface produced at 1600 rpm, 16 mm/min, and 6 N, employing the hexagonal tool. Fusion was seen in the friction stir welded zone where alternating layers of AA5052 and AA2014 alloys were present. The macro structure illustrates the agglomerated particles of AA5052 and AA2014, which have increased in size due to thermal and mechanical stress. Fig. 10 b of the SEM image illustrates the nugget zone where effective fusing of the AA5052 alloy and AA2014 results in the formation of alternating layers with tiny grains. The broad band corresponds to AA5052, whereas the lighter, dull regions signify the AA2014 alloy. Fig. 11 illustrates that the nugget region of the weld is uniformly distributed with alloying elements in both the aluminium alloys, as detected by the EDAX analysis. The parallel and striations groups in the macrostructure show the infiltration of AA 2014 into AA 5052 at the welding area resulting from pin rotation. The hexagon tool effectively amalgamates the AA 2014 into AA 5052 at 1600 rpm, while the reduction in grain size transpires at a WS of 16 mm/min, due to an elevated strain rate that triggers supplementary stress - strain nucleation centres, thereby augmenting the recrystallized grain size and enhancing mechanical properties.
In the nugget region, striations and parallel bands in the macrostructure show that AA 2014 has infiltrated AA 5052 as a result of pin rotation. The hexagon tool effectively blended the materials at 1600 rpm, 16 mm/min, and 6 N, resulting in superior tensile strength compared to alternative combinations. The tensile strength increases from 1200 to 1600 rpm and subsequently decreases with further increases in TRS.
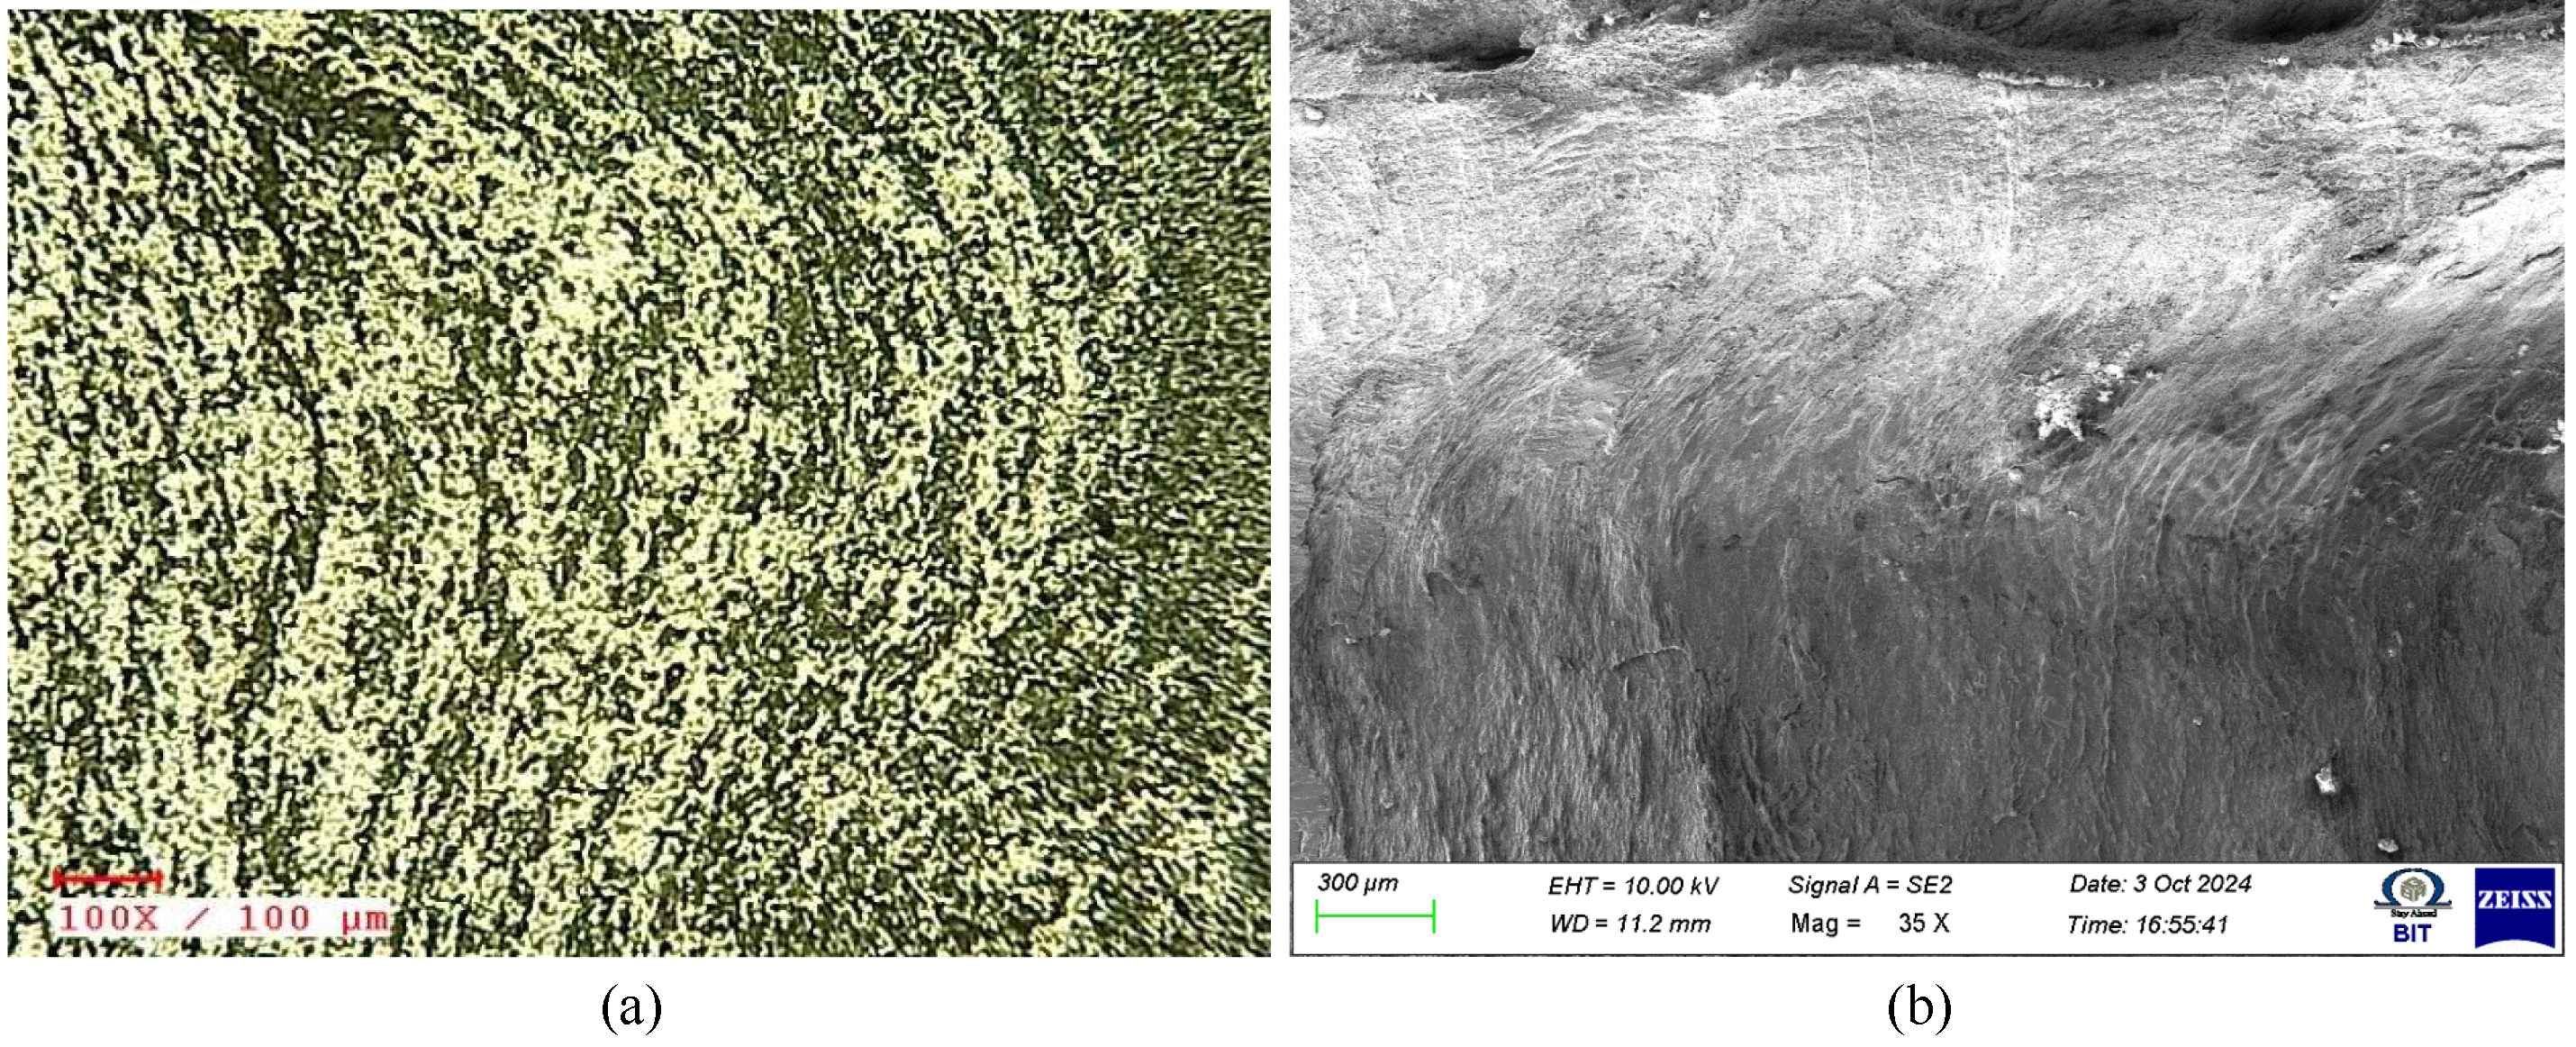
Figures 12 a and b illustrate the macrostructure and microstructure of the joint surface of the weld created at 1600 rpm, 16 mm/min, and 6 N using a hexagon tool pin profile.
|
Fig. 3 Main effects plot for means of Ultimate tensile strength. |
|
Fig. 4 Main effects plot for means of YS. |
|
Fig. 5 Main effects plot for means of % elongation. |
|
Fig. 6 Main effects plot for means of Hardness (HV). |
|
Fig. 7 Main effects plot for means of utility functions (f(ki)). |
|
Fig. 8 Response optimizer plot for UTS, YS, % elongation, hardness values and utility functions (F(ki)). |
|
Fig. 9 Macrograph of weld generated at a) 1600 rpm, 8 mm/min and 6N for circular pin profile, b) 1,600 rpm, 12 mm/min and 8N for hexagon pin profile, c) 1600 rpm, 16 mm/min and 10 N for square pin profile and d) 1600 rpm, 16 mm/min and 6N for hexagonal pin profile. |
|
Fig. 10 a) Macro analysis, b) microstructure of the joining contact in the welding region of the weld formed at 1600 rpm, 16 mm/ min and 6N for hexagon profile. |
|
Fig. 11 EDAX study in the nugget region of the weld generated at 1600 rpm, 6 mm/min and 6N for hexagonal profile. |
|
Fig. 12 a) Macrostructure b) microstructure of the joint contact in the nugget region of the weld formed at 16 mm/min, 1600 rpm, and 6N for hexagonal pin profile. |
|
Table 6 Optimal variables identified for Ultimate Tensile Strength (optimal level). |


This study examines the FSW of 6 mm thick AA5052 and AA2014 plates, utilizing a variety of different variables to analyze the influence of WS, TRS, AL, and different pin profiles on the mechanical characteristics of the joints. The experimental outcomes can be adjusted with an enhanced linear model to estimating the optimal variables. From the optimized results, the principal findings are as follows.
1. The general linear model established at a 95% confidence level indicates that the hexagonal pin profile yields superior UTS and elongation percentage due to increased pulsation, whereas the square and circular tools result in diminished tensile strength.
2. Response optimizer plots and main effect plots for each result were generated to analyze the impact of FSW process factors on mechanical behaviors. This clearly demonstrates the interaction result of process factors on mechanical behavior.
3. Experiments conducted by FSW have shown that changes in the rotation speed of the tool have an effect on the welding speed, which in turn affects the mechanical behavior and the heat input to the weld.
4. The increase in axial load of the mechanical characteristics also enhances performance, while elevated axial load may similarly be influenced by inadequate formation of the transferred material.
5. The Friction Stir Welding joints were developed using three types of pin profiles, with the hexagonal pin profile demonstrating superior UTS (228.11 MPa), yield strength (230.22 MPa), elongation percentage (9.5), and hardness (97.56 HV) at a WS of 16 mm/min, a TRS of 1600 rpm, and an AL of 6 N.
6. The relationship between input factors for friction stir welding of different aluminum alloys has been established using CRITIC-MARCOS, the model's adequacy assessed using ANOVA testing and contour diagrams, and deemed satisfactory.
7. The optimal FSW process parameters determined through MCDM techniques (CRITIC and MARCOS) include a WS of 16 mm/min, a TRS of 1600 rpm, an AL of 8 N, and the most effective tool pin is hexagonal, yielding a UTS of 227 MPa, an YS of 215 MPa, an elongation of 8.5%, and a hardness of 96 HV.
8. According to the EDAX research, the nugget zone for the three combinations that result in the best mechanical properties include the elements of AA5052 and AA2014.
9. The SEM images indicate a uniform distribution of the two different materials (AA5052 and AA2014) throughout the nugget zone for the factors of 1600 rpm, 16 mm/min, 16N, and hexagonal pin profile.
- 1. T. Ramanathan, S. Karthick, and S. Nandhakumar, Chiang Mai J Sci. 49[2] (2022) 487-495.
-

- 2. V. Pandian and S. Kannan, Func. Compos. Stuct. 6[4] (2024) 045006.
-
- 3. R. Kumar, V. Upadhyay, J.P. Misra, and C. Sharma, Proc Inst Mech Eng C J Mech Eng Sci. 236[20] (2000) 10496-10507.
-
- 4. M. Ramamurthy, P. Balasubramanian, and R. Kumar, Int. J. Veh. Struct. Syst. 12[2] (2020) 166-169.
-
- 5. V. Rajagopal, D.K. Rajendran, and S. Muthukumaran, Indian J. Eng. Mater. Sci. 30[6] (2023) 766-779.
-
- 6. R. Manikandan, P. Ponnusamy, S. Nanthakumar, A. Gowrishankar, V. Balambica, R. Girimurugan, and S. Mayakannan, Mater Today Proc. 2023.
-
- 7. R. Srinivasan, S. Muthukumarasamy, P.K. Singh, K. Meshram, S. Mayakannan, B. Sasikumar, and V.P. Sundramurthy, Int. Res. J. Multidiscip. Technovation 6[3] (2024) 296-307.
-
- 8. D. Dinesh Kumar, A. Balamurugan, K.C. Suresh, R. Suresh Kumar, N. Jayanthi, T. Ramakrishnan, S.K. Hasane Ahammad, S. Mayakannan, and S. Venkatesa Prabhu, J. Chem. 2023 (2023) 2554098.
-
- 9. R. Srinivasan, S. Karunakaran, M. Hariprabhu, R. Arunbharathi, S. Suresh, S. Nanthakumar, S.K.H. Ahammad, S. Mayakannan, and Mani Jayakumar, Adv. Mater. Sci. Eng. 2023 (2023) 3085478.
-
- 10. M. Vadivel, S. Seenivasan, P. Satishkumar, S. Gomkale, and R. Saminathan, Interactions 245[1] (2024) 365.
-
- 11. M.S. Bhagat, S. Seenivasan, P. Satishkumar, R. Saminathan, and T. Ishwarya, Interactions 245[1] (2024) 210.
-
- 12. K. Srividya, S. Ravichandran, M. Thirunavukkarasu, I. Veeranjaneyulu, P. Satishkumar, K. Bharadwaja, N. Srinivasa Rao, Ram Subbiah, and Javvadi Eswara Manikanta, Int. J. Interact. Des. Manuf. 18[3] (2024) 1459-1473.
-
- 13. I. Veeranjaneyulu, V. Haripriya, R. Saminathan, B.V.V Naidu, J.J.M. Hillary, A.S.V. Prasad, P. Satishkumar, B. Ch Nookaraju, and Ram Subbiah, Int. J. Interact. Des. Manuf. 18 (2024) 1373-1386.
-
- 14. R. Crushan and P. Ashoka Varthanan, J. Ceram. Process. Res. 22[6] (2021) 620-628, 2021.
-
- 15. R. Girimurugan, J. Bensamraj, and S. Karthick, J. Ceram. Process Res. 23[4] (2022) 553-557.
-
- 16. M. Sivaperumal, R. Thirumalai, S. Kannan, and Yarrapragada KSS Rao, J. Ceram. Process Res. 23[3] (2022) 404-408.
-
- 17. M. Adil and J. Mukhopadhyay, The Minerals, Metals & Materials Series. Springer, Cham. (2020) 370-379.
-
- 18. M. Raturi and A. Bhattacharya, Mater. Sci. Eng., A 825 (2021) 141891.
-
- 19. K. Praneetha, M. Apoorva, T. Prasanna Laxmi, S. Ravi Sekhar, and S. Sravan Sashank, Mater. Today: Proc. 62[6] (2022) 3397-3404.
-
- 20. S. Raja, R. Manikumar, R. Benruben, and S. Ragunathan, Mater. Today: Proc. 45 (2021) 895-899.
-
- 21. S. Boopathi, Mater Today Commun. 33 (2022) 104937.
-
- 22. S.R. Dakarapu, S.R. Karri, A.K. Shaik, P.C. Maddili, and N.D. Chinta, Int. J. Interact. Des. Manuf. 18 (2024) 5533-5545.
-
- 23. R. Kumar, V. Upadhyay, and C. Sharma, Proc. Inst. Mech. Eng., Part E 236[3] (2022) 1083-1095.
-
- 24. S.P. Dwivedi, S. Sharma, C. Li, Y. Zhang, A. Kumar, R. Singh, S.M. Eldin, and M. Abbasal, J. Mater. Res. Technol. 26 (2023) 1872-1881.
-
- 25. V. Pandian and S. Kannan, J. Manuf. Process 54 (2020) 99-108.
-
- 26. K. Shivalingaiah, V. Nagarajaiah, C.P. Selvan, S.T. Kariappa, N.G. Chandrashekarappa, A. Lakshmikanthan, M.P.G. Chandrashekarappa, and E. Linul, Metals 12[8] (2022) 12081297.
-
- 27. M. Abas, B. Salah, Q.S. Khalid, I. Hussain, A.R. Babar, R. Nawaz, R. Khan, and W. Saleem, Materials 13[19] (2020) 1-21.
-
- 28. B.S. Kamilla, B.B. Sahoo, A. Barua, S. Jeet, K. Kumari, D.K. Bagal, and B.P. Panda, Lect. Notes Mech. Eng. (2023) 135-142.
-
- 29. S. Biswal, B.B. Sahoo, S. Jeet, A. Barua, K. Kumari, B. Naik, and S. Pradhan, Mater. Today: Proc. 74[4] (2023) 587-594.
-
- 30. S. Kim, J. Hong, Y. Joo, and M. Kang, J. Manuf. Process 82[1] (2022) 860-869.
-
- 31. B.M. Nagarajan and M. Manoharan, J. Manuf. Process 82 (2022) 390-402.
-
- 32. R.K. Singh, S.K. Tiwari, S.C. Srivastava, and B. Kumar, Teh Vjesn. 30[3] (2022) 804-814.
-
- 33. S. Singh, N. Yuvaraj, and R. Wattal, Multidiscip. Model. Mater. Struct. 20[3] (2024) 466-485.
-
- 34. A. Baraily, S. Das, G. Sapkota, R. Anand, and R.K. Ghadai, J. Phys. Conf. Ser. 2818 (2024) 012028.
-
- 35. A.P. Dhanaraj and S. Kumarasamy, Metall. Res. Technol. 118[3] (2021) 304.
-
- 36. N. Muhayat, M.S. Harjono, Y.P.D.S. Depari, A.R. Prabowo, T. Triyono, E.D.W.S. Putri, and T. Tuswan, Metals 12[1] (2022) 12010004.
-
- 37. M. Abas, L. Sayd, R. Akhtar, Q.S. Khalid, A.M. Khan, and C.I. Pruncu, J. Mater. Res. Technol. 9[5] (2020) 10916-10940.
-
- 38. T. Ahmad, N.Z. Khan, M. Mohsin Khan, N.F. Lone, A.N. Siddiquee, B. Ahmad, S. Ahmad, Z.A. Khan, and S.S. Ul Islam, Adv. Mater. Process. Technol. 9[3] (2022) 1340-1355.
-
- 39. S. Balamurugan, K. Jayakumar, and K. Subbaiah, Arab. J. Sci. Eng. 46[12] (2021) 11985-11998.
-
- 40. A. Anand, S.K. Tiwari, V. Prakash, R.K. Singh, and K. Kumar, Int. J. Interact. Des. Manuf. 19 (2024) 3933-3945.
-
- 41. S. Park, Y. Joo, and M. Kang, Metals 10[7] (2020) 1-9.
-
- 42. K.M. Senthil Kumar, T. Ramanathan, S. Murugesan, and V. Thangamuthu, J. Ceram. Process. Res. 22[6] (2021) 731-738.
-
 This Article
-
2025; 26(6): 916-932
Published on Dec 31, 2025
- 10.36410/jcpr.2025.26.6.916
- Received on Jun 12, 2025
- Revised on Jul 24, 2025
- Accepted on Aug 25, 2025
Services
Shared
Correspondence to
- Satishkumar P.
-
Department of Mechanical Engineering, Rathinam technical campus, Coimbatore, Tamilnadu, India
Tel : 9791927002 - E-mail: sp.sathishkumar10@gmail.com
Clean-Energy Research Institute(CRI), Hanyang University, 222, Wangsimni-ro, Seongdong-gu, Seoul, 04763, Korea
E-mail: jcpr@hanyang.ac.kr