


- Fiber laser micro machining of stainless steel - process parametric optimization by integrated taguchi and grey relation analysis technique
C. Gopinatha,*, S.D. Dhanesh Babub and S. Kanthasamya
aDepartment of Mechanical Engineering, St Joseph College of Engineering, Sriperumbudur, Kanchipuram, Tamilnadu-602 117, India
bDepartment of Mechanical Engineering, Chennai Institute of Technology, Chennai, Tamilnadu, IndiaThis article is an open access article distributed under the terms of the Creative Commons Attribution Non-Commercial License (http://creativecommons.org/licenses/by-nc/4.0) which permits unrestricted non-commercial use, distribution, and reproduction in any medium, provided the original work is properly cited.
Industrial advancements of recent times explores miniature components for complicated features embedded within, in order to address the requirements of sophisticated Electronics, Biomedical and Nuclear applications. Fiber laser micromachining (FLMM) is an emerging non-traditional laser machining technology for producing micro-nano scale components. High strength and high pitting resistance makes micromachining of SS 201 complex in terms of accomplishing accuracy, difficulty in machining and lesser productivity while working with conventional machining techniques. On deploying FLMM with appropriate process parametric ranges helps to overcome the limitations. This paper presents the investigations carried out the process parameter optimization for machining of SS 201 with FLMM. The output responses like Surface texture (Ra), Heat affected Zone (HAZ), and Metal Removal Rate (MRR) are analyzed using Taguchi (L9 Array) integrated with grey analysis. The varying parameters like MRR, HAZ and Ra are studied using ANOVA. Confirmatory test performed with parameters having optimized values showed an increase in the grey improvement level of 5.198%. SEM images are used to identify high quality micro holes and Surface Roughness was measured by three dimensional surface measurement tester to understand the trend of roughness.
Keywords: Fiber laser micro machining, SS 201, Taguchi, GRA, SEM, 3D roughness.
Sophistication in Medical, and industrial automations with robots and precision systems, lead to difficulties in micro fabrication, miniaturization and multi-functional operating technologies in Manufacturing [1-4]. Miniaturization is a significant trend in numerous modern technologies. Micromachining of Nano levels at high speed is an innovation utilized across industries. This technique can be found in manufacturing the cutting-edge microproducts for biotechnological, microelectronics, telecommunication, MEMS, and clinical applications. Ability to make a micro hole in large quantities of applications in biomedical implant, micro clinical filters, tooth implantation, micro nozzle, turbine blades using heat rejection and micro fluid system. Further, it is extrapolated for fuel cells, micro batteries, chemical micro reactors, micro dies and micro devices in daily life gadgets such as smart phone, analog and digital watch, compact disc player and ink-jet printer [5-9]. In all industrial sectors, home appliances, hardware, and electronics, there is currently a growing desire for smaller, higher-quality, more affordable products. The need for manufacturing strategies tailored to the micro systems method that are more accurate, affordable, scalable, and environmentally friendly is critical. Experts have looked into a variety of methods for producing tiny parts [10]. The focus of the current shift in micro manufacturing is increasingly on miniaturizing conventional and unconventional techniques for creating tiny products. The types of energies utilized in the process itself, such as chemical, electrochemical, mechanical, laser, and electrical energy, may also be used to characterize manufacturing processes [11]. There is emergent demand in numerous industrial areas for equipment’s and instruments with a very high degree of precision, to which lasers provide the optimal solution. Laser micro machining offer a wider range of wave lengths, extended pulses (from fem to seconds to microseconds), and speeds (up to MHz). With a power consumption of less than 1 kW, this system can transmit pulse beams with high precision, low surface damage, universal applicability, rapid mass production, and accuracy [12-15]. However, laser micro-machining of Dual phase duplex stainless steels 2205 is a very tough and challenging process. Laser machining are of two main types: which uses Nd: YAG system and CO2 system. The Nd: YAG property is studied widely, well understood by all Solid-state laser media [16-21]. The latest techniques in solid state laser technology uses materials with higher efficiency and the pumping threshold has been reduced significantly. Similarly, the semiconductor laser diodes, which acts as an alternative material to lamps, are being used in compact solid-state lasers for pumping (flash lamp or, more often, CW arc lamps) [22, 23]. A high-performance diode laser pump is recently developed, also they are maintenance free throughout their lifetime, because flash lamps or diodes need not to be replaced [24]. Fiber laser micro machining considered as challenging in machining towards creating micro-profile precisely such as holes, grooves, channels with micron level dimensions. Fiber laser technology offers several advantages for industrial users [25]. Performing the experiment on Laser Beam Machine, the optimum machining parameters like power of laser, speed of cutting, pressure of gas, distance of nozzle, focal length, frequency, width of the pulse, which affects the surface finish of the work piece and the effects of machining parameters on SN ratio was studied [26-29]. Hybrid approach of genetic algorithm and neural network are used towards optimizing the laser micromachining quality characteristics of Ti-6Al-4V in which quality characteristics of taper and surface roughness were improved considerably [30, 31]. The suitable method to optimize the parameters is multi-response problem into a single-response problem by Taguchi based GRA [32, 33]. Duplex stainless steel (DSS) provides exceptional resistance characteristics against corrosive work environment. DSS predominantly used in oil/gas piping units, chemical processing industries, aerospace components and nuclear power plants [34, 35]. Kar et al., adopted Micromachining by fiber laser ablation for fabricating nano/micro scaled features in the field of miniaturized applications. The authors optimized the parameters of fiber laser machining on 6061 grade Aluminium alloy. They chosen parameters like scanning speed, pulse frequency, number of passes and laser power and suggested that 300 mm/s, 35%, 30 kHz , and 200 are the optimum limits respectively [36]. Bifi et al., the authors investigated micro-drilling on titanium sheets of 0.5 mm thickness using fiber laser because of its promising tool qualities. They adopted the laser pulse of 120 and concluded that the fiber laser is best suited for micro-machining. They analyzed the hardness of material surrounding the hole also [37]. Venkata Rao et al., involved in an investigation of machining AISI 304 with laser beam. They used the process parameters as power (1, 1.5 and 2 kW), laser frequency (6, 8 and 10 kHz), cutting speed (2, 2.5, and m/min) and nozzle tip distance (0.8, 1, and 1.2 mm) for their study. They machined a 6 mm thick sheet with trials based on L9 orthogonal array with these parameters by considering the width of the kerf rate of metal removal and surface roughness as the responses. They studied the results of vibrating workpiece in lateral and longitudinal directions and concluded that the longitudinal vibration yielded favoring results [38]. Rajesh et al., They examined the machining behavior of SS304 stainless steel using a laser beam, varying key process parameters including laser power (1, 1.5, and 2 kW), laser frequency (6, 8, and 10 kHz), cutting speed (2, 2.5, and 3 m/min), and nozzle tip distance (0.8, 1, and 1.2 mm) throughout their investigation. They machined a 3 mm thick sheet with trials based on L27 orthogonal array with these parameters by considering the width of the kerf and surface roughness as the responses. They concluded that the power and speed of cutting have greater influence on roughness and kerf width. They achieved 82.07% accuracy in surface roughness and 71.67 % in width of the kerf concerning prediction [39]. Buj-Corral et al., the authors investigated the output responses like thickness of the burr, roughness in surface, accuracy of dimensions while machining stainless steel 304 sheet of 0.8 mm thickness. They used Nd-YAG laser for machining the sheet and concluded that the surface roughness, dimensional error and burr thickness are highly influenced by frequency, pulse width. The speed has no influence on the responses [40]. B S Wardhana et al., The authors machined SS316 material using laser with parameters of speed of cutting as 60-100 mm/minute and pressure of gas as 17-21 bar and they concluded that the hardness is affected by pressure and roughness is influenced by speed. They also pointed out that the surface quality was affected by the thickness of the material. The surface quality was inversely proportional to the thickness [41]. Pattanayak et al., examined the machining of implants made of SS316L for producing micro engraves and analyzed the heat affected zones, deposition of debris, cracks and recasting layers. They optimized the parameters like pulse frequency (50-65 kHz), scanning speed (25-55mm/s), number of passes (15-30), laser power (70-100%) using Taguchi-GRA. They concluded that the fiber laser is preferable for the micro level machining stainless steel and power is the predominant influencing factor to obtain machining quality [42]. Turkkan et al., The authors examined the machining characteristics of SS304L of 20 mm thickness as a novel attempt and in their literature survey they elaborated different types of laser used for machining stainless steel and their impacts on the response factors. They also pointed out that fiber laser is more suitable for micromachining of stainless steel. They used Cutting Speed between 250–310 mm/min, Focal Position 11 to 14 mm, Frequency of 45–105 Hz, Duty Cycle of 50–80% as their process parameters and their levels. They carried out Taguchi GRA with L16 and concluded that the duty cycle is the most influencing factor [43]. Pattanayaka et al., studied the tapered micro drilling of SS316L for medical applications, using Nd:Yag laser with process parameters of A-Diode current of range 21-24 A, B – Speed of scan of range 18-24 mm/sec C - Pulse frequency 3-12 kHz, D -Pulse width of range 5–20%, E - Focal Plane Position of range 0.3–3 mm. They conducted Taguchi GRA with L16 and concluded that it was possible to machine tapered hole with a bending the laser beam and is limited to greater than one millimeter only. They analyzed the machinng using argon as an assist gas during drilling and reported a reduction in the thickness of the recast layer and the HAZ breadth [44]. Ravanneswarran et al., investigated the machining characteristics of a shape memory alloy using fiber laser and they elaborated the importance of machining materials with fiber laser which are meant for precise and prolonged applications [45]. Jain et al., in their review reported that laser based machining can be used to create micro machining [46]. Liu et al., investigated the machining of shape memory alloy and reported that fiber laser machining is more preferable than EDM due to its tooling capabilities [47]. Biffiy et al., explained the high degree of accuracies and effectiveness of using fiber laser for micro machining [48]. The primary concern, influencing the choice of SS 201 grade duplex stainless steel is its increasing industrial significance due to cost- conscious applications such as kitchenware and medical appliances. and micro-domain applications. Additionally, it is a cost-effective substitute for other stainless steels like SS 304 and 316 due to its relatively reduced nickel content. Processing-wise, SS 201 has fascinating behavior during laser processing because of its dual-phase (austenite-ferrite) microstructure, which affects solidification behavior and melt pool dynamics. It is a strong contender for assessing laser-material interactions and refining laser processing parameters because of these features [49-53]. Hence, it is necessary to examine the micromachining characteristics of SS 201. This study aims at selection of optimum Fiber laser micro machining (FLMM) process parameters in machining Duplex Stain less Steel (SDSS). The most important parameters implicated in FLMM on Material Removing Rate (MRR), Surface Roughness (SR), and HAZ and over cut such as Laser power, pulse frequency, scanning speed and duty cycle are chosen as a process parameters. The machining of micro hole on a thin work piece 50×50×0.4 mm is used for the experimentation. The ranges and levels for the process parameters are selected based on the literature review and preliminary trials. The levels for scanning speed and Duty cycle are chosen by averaging the levels found in the literature (commonly chosen in many investigations), the levels for power and frequency are fixed by trial and error method, conducted by varying one parameter and fixing other parameter. By varying one by one the lower and upper limits are determined and the levels are fixed in between the limits in a standard increment. The trials are made with SS201 of 0.4 mm thick sheet. The levels are chosen based on the accuracy in diameter obtained during machining in comparison with the laser beam diameter. Taguchi method with L9OA is used to design the experiential procedure towards optimizing various machining factors to obtain better output responses.
Fiber laser machining (material set-up)
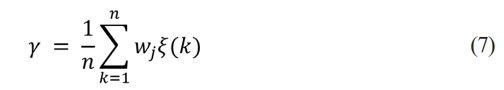
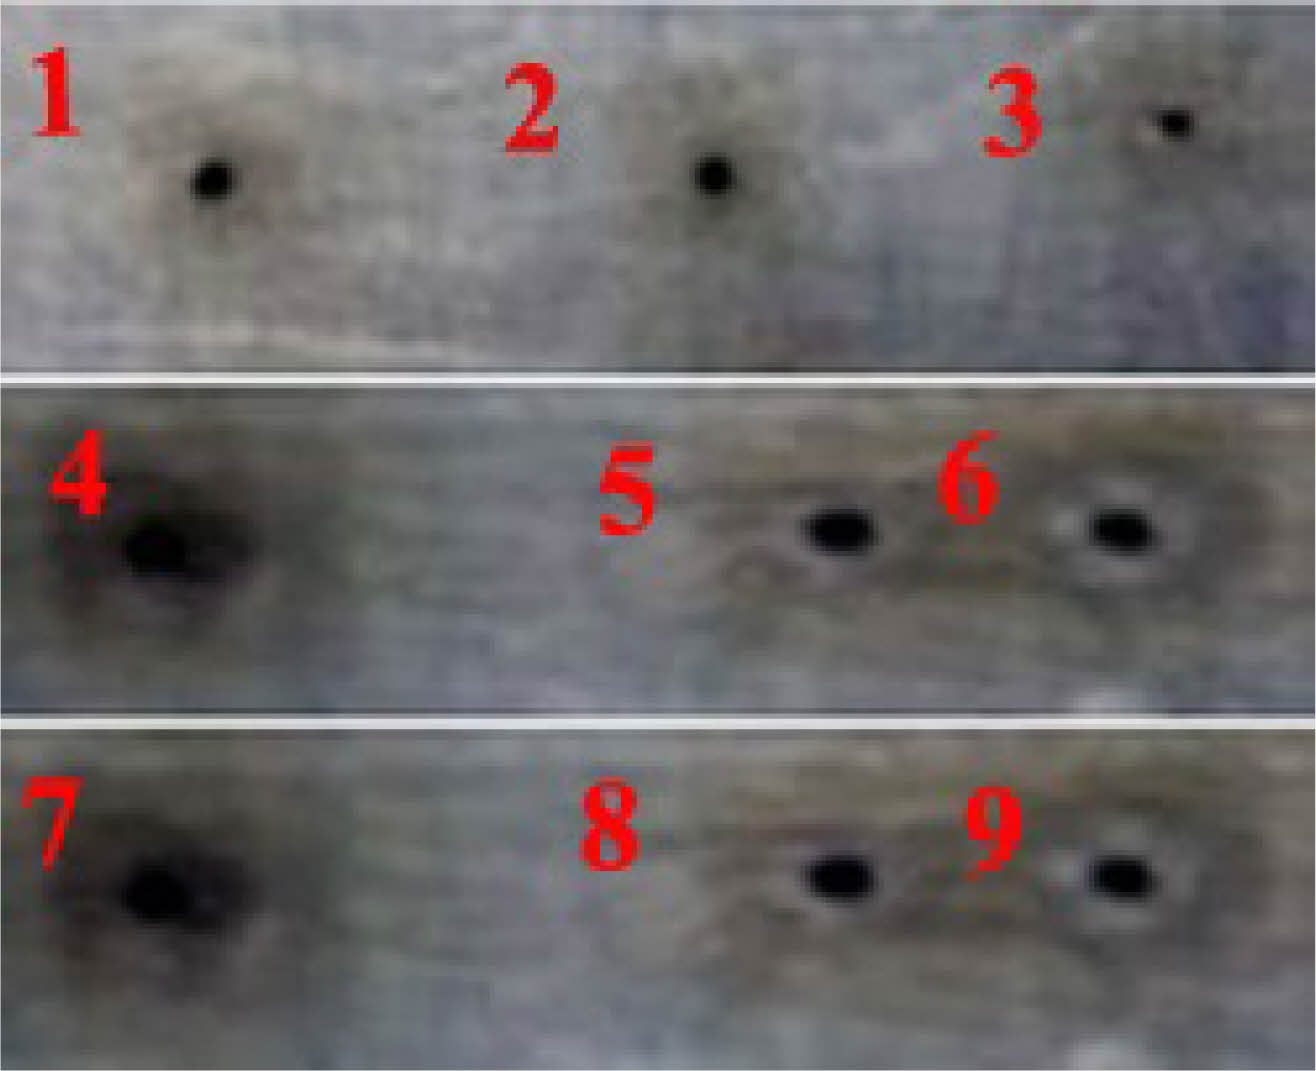
FLMM system utilized for the experimental purpose as shown in Fig. 1. In this FLMM system having four units such as Unit for Source unit, Unit for control, Unit for cooling and work station. The variable factors like power, frequency, scanning speed and duty cycle [Ton and Toff] control by the integrate computer in FLMM system. Micro cutting hole design feed in the integrate computer. The work piece is SS 201 (50×50×0.44 mm). Work station is used to fix and aligning the work pieces. The various machining parameters that influence laser removal directly affects the energy acting on the material. The laser micro machining process is controlled by a various machining parameter like power intensity, scanning speed, frequency and duty cycle. The micro-machined work sample using FLMM with beam diameter 300 µm is presented in Fig. 2. The following parameters concerning laser can be varied in the selected machine: power, pulse frequency, duty cycle (Ton and
Toff), and speed of scanning. The pre mass and post mass of the sample were measured and Material removal rate is found using difference in mass. The 3D images of surface texture is taken for evaluating the average values of roughness (Ra) at the adjacent surface of the top of the micro-holes. The diameter of the micro-holes drilled were measured using the images from scanning electron microscope (SEM).
Stainless Steel (SS201)
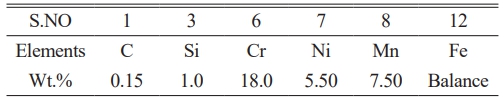
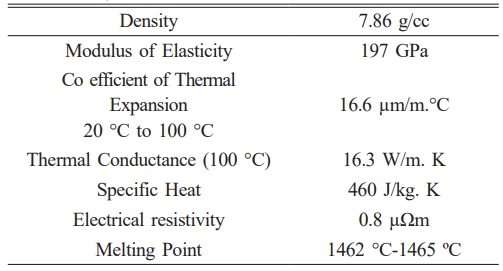
This unique dual phase combination structure, provide high corrosion resistance particularly stress corrosion damage. Dual phase SS 201 offers good hardness, great toughness, low thermal conductivity, and high levels of work hardening. SS 201, for which the chemical composition (wt.%), properties of mechanical and physical are presented in the Tables 1, 2 and 3.
Design procedure for Experimental
Step1: Experiment Design
The first step of experimental design explains the selection of experimental structure for conducting trails. The Traditional Process parameter design is complex. In this process, the number of experimental trails increases multifold as the process parameter increases. Taguchi method is popularly used to minimize the requirement of large number of trials towards optimization.
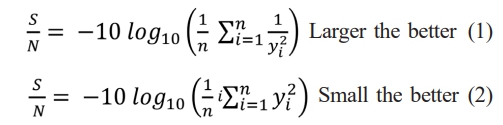
Step2: Calculation of S-N:
The output parameters can be achieved by following below criteria;
Minimizing the response: - Choose smaller the better S-N ratio
Maximizing the response: -Choose larger the better S-N ratio
Step 3: Grey relational generation
In this step, GRA reduction of deviation is associated with various measurement dimensions and units by the normalization of raw data, which is commonly referred to as grey relational analysis. As the ranking is affected by the normalization process, the sensitivity of the normalization on the sequence of results is analyzed. Therefore, the value of the S-N is used to normalize the data in the GRA. Hence data normalization process we choose the desired data to beneficial attribute and non-beneficial attribute.
If the Output value is larger-the-better then,
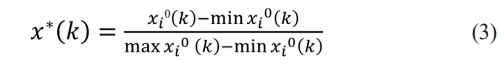
If the Output value is lesser-the-better then,
Where, i = 1 to m and k = 1 to n.
In which, m- Total number of experimental data items, n- Total number of parameters;
X0i(k) - The original sequence and X*i(k) - the data preprocessing sequences,
min X0i(k)- the smallest of X0i(k) and max X0i(k) the largest value of X0i(k).
Step 4: Reference sequence
Post GRA process, the performance data values are scaled size as (0, 1) and reference sequences x_0 as (x_01, x_02, x_03, x_on. . , x_om) = (1,1,1 1). Then objective is to discover the alternative values with comparability sequence and the corresponding reference sequence are close to each other.
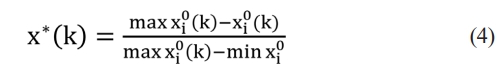
Step 5: Calculation of Grey relational coefficient
The grey relational coefficient which is used to find out the actual data and ideal normalized value scan be calculated by grey formula
Where,
Δoi = Deviation
Δ0,j = |X*0(k) - X*i(k)|the difference of the absolute value X*0(k) and X*i(k)
X*n(k) - The reference sequences,
X*j(k) - The comparative sequences
ζ - Identification distinguishing co-efficient, ζ∈[0, 1]
A value of ζ = 0.5 is generally used.
Step 6: grey relational grade calculation:
Gray relation grade is calculating the correlation level inter between the data of reference sequence and data of comparability sequence and the weight of attribute it depending on the weight of problem and structure. Usually taken ∑nj=1, wj = 1 the GRG is indicating the degree of contribution between the data of reference sequence and data of comparability sequence. The highest grey relation grade is influence of comparability sequence with reference sequences.
Where,
Γi - GRG value determined for ith experiment,
n - The total number of performance characteristics. After the optimal level of the factor is determined using GRG, the last step is the prediction of quality characteristics by equation (8):
Where,
γo - The maximum average GRG for optimal factor
γm - The average GRG.
q -
The total number affecting factors for response value.
Step 7: ANOVA
ANOVA technique is typically used to investigate the parameters of machining which are essentially influenced the characteristics of performance. The statistical basis for experimental design and analysis of variation (ANOVA) is first introduced by Sir Ronald A, Fisher, and British biologist [54-58].
ANOVA is a method of dividing the total change from a particular source of variation in an experiment. ANOVA is routinely used to establish confidence levels. This method does not analysis data directly
The degrees of freedom in the statistical sense are associated with all available information calculated from the data. It is a measure of the amount of information that can be determined uniquely from a particular data set. DOF for coefficient data is one less than the number of levels, DOF=N-k.
The F-test checks whether the effect is significantly different due to factors or not. The F-test value is calculated by dividing the variance / error deviation / mean squared. However, the multi-factor design in a random or mixed effects model, the denominator for calculating the F value is determined by calculating the expected mean squared [59-63].
Design of Experiments
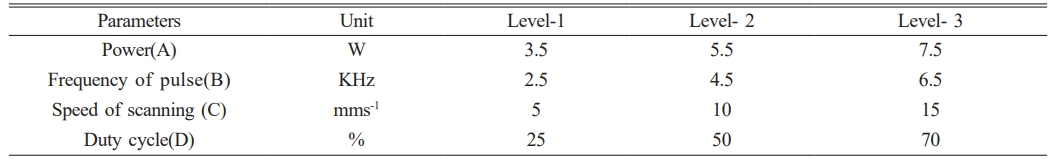
This paper presents, the effects of four influencing process parameters for FLMM process is studied by design of experiment. Namely power, pulse frequency, scanning speed and duty cycle with three levels to observe the out responses like MRR, HAZ, Ra in micro hole (300 µm) operation of SS 201 alloy.
The orthogonal array is more efficient when compared to many other statistical techniques. The less number of runs calculated by using Taguchi approach based on the degrees of freedom method. Initially, degrees of freedom can be calculated after that orthogonal array is selected.

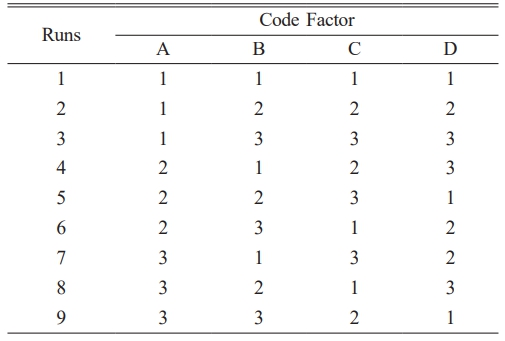
Where, Number of degrees of freedom (N) and number of experiments (L). Thus, an orthogonal array based on Taguchi was chosen. Experimental layout shown in Table 5. Thus, nine experiments were conducted to test the effects of the above processing input parameters. Each experiment replicate three times to reduce experimental errors. Table 4 presents the factors, levels of experiment. The ranges and levels for the process parameters are selected based on the literature review and preliminary trials. The levels for scanning speed and Duty cycle are chosen by averaging the levels found in the literature (commonly chosen in many investigations), the levels for power and frequency are fixed by trial and error method, conducted by varying one parameter and fixing other parameter. By varying one by one the lower and upper limits are determined and the levels are fixed in between the limits in a standard increment. The trials are made with SS201 of 0.4 mm thick sheet. The levels are chosen based on the accuracy in diameter obtained during machining in comparison with the laser beam diameter.
|
Fig. 1 (a & b): Fiber laser micro machining setup. |
|
Fig. 2 Machined work piece by fiber laser micro machining |

Effect Factor on MRR
The mass of the machined sample are measured using a precision microbalance was used and the MRR is calculated using the following formula.
MRR(mg/Second) = (Initial Mass-Final Mass)/Time of machining in Seconds
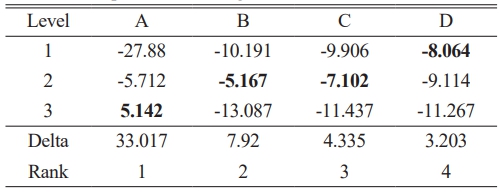
The calculated values of MRR are presented in Table 6. Transformed as S-N ratio by Minitab software. The delta statistics shows the dominant control factor using S-N Ratio. The delta statistics are calculated with respect to the difference among highest value and lowest value of each factor. Ranking was determined by the values of delta and the parameter with higher delta value is placed in the first rank, also the dominant factor affecting MRR. Table 7 shows Response table for Signal - Noise Ratio of MRR.
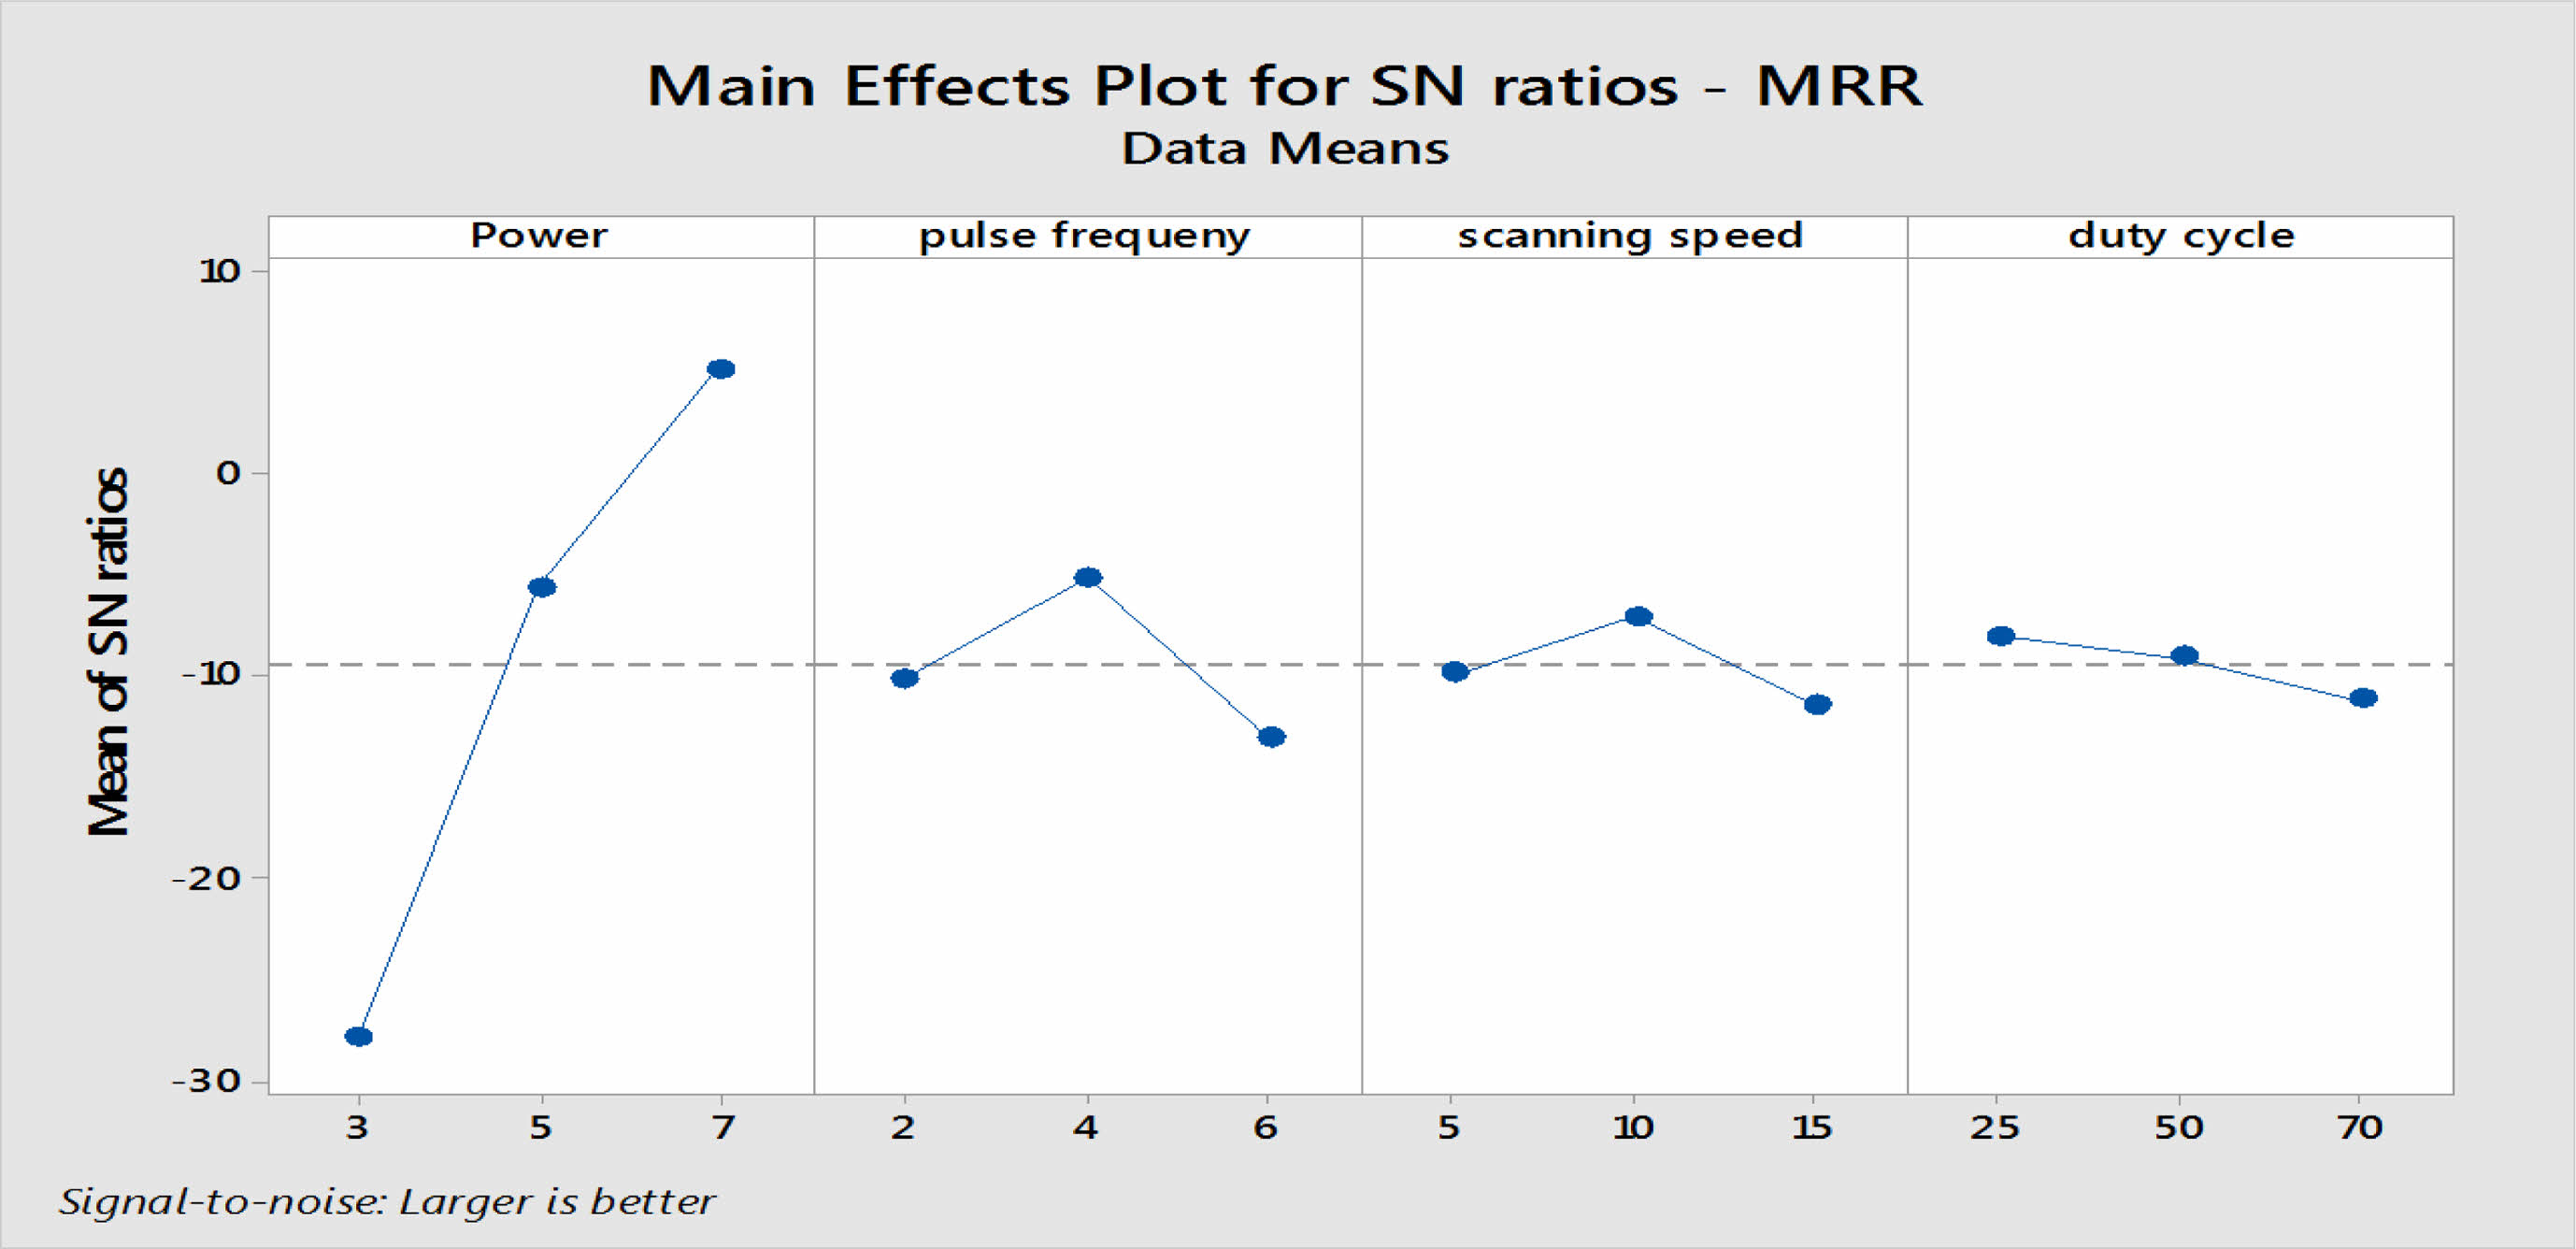
In this observation of FLMM machining when the MRR increases with increases in the quantity of power applied. In Fig. 3 the MRR vertically increasing trend of S-N ratio from 3W to 7 W, the relationship between pulse frequency and S-N ratio shows that initially increases and mid decreasing trend for frequency from 2 KHz to 6 KHz and similarly speed of scanning from 5 to10 mm/s. The plot of duty cycle shown a decrement in Signal - Noise Ratio from 25% to 70%. Regardless of quality characteristic when analyzing the Signal - Noise Ratio and larger Signal - Noise Ratio concerning the better value in the results of experiments, in this case were achieved higher MRR.
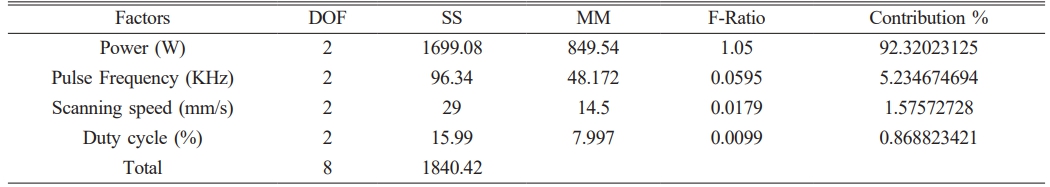
The Table 7 presented their responses, the main effects plot for S-N ratio in Fig. 4 suggest that A3B2C2D1 factors for achieving higher S-N ratio, higher MRR. After calculating the factor levels, ANOVA was performed (shown in Table 8) for obtaining the contribution percentage of the influence of every factor to MRR. It is known that the given power has the greatest influence on MRR with a contribution of 92.32%, followed by pulse Frequency of 5.23%, scanning speed of 1.5 % and duty cycle of 0.86%.
Effect Factor on HAZ
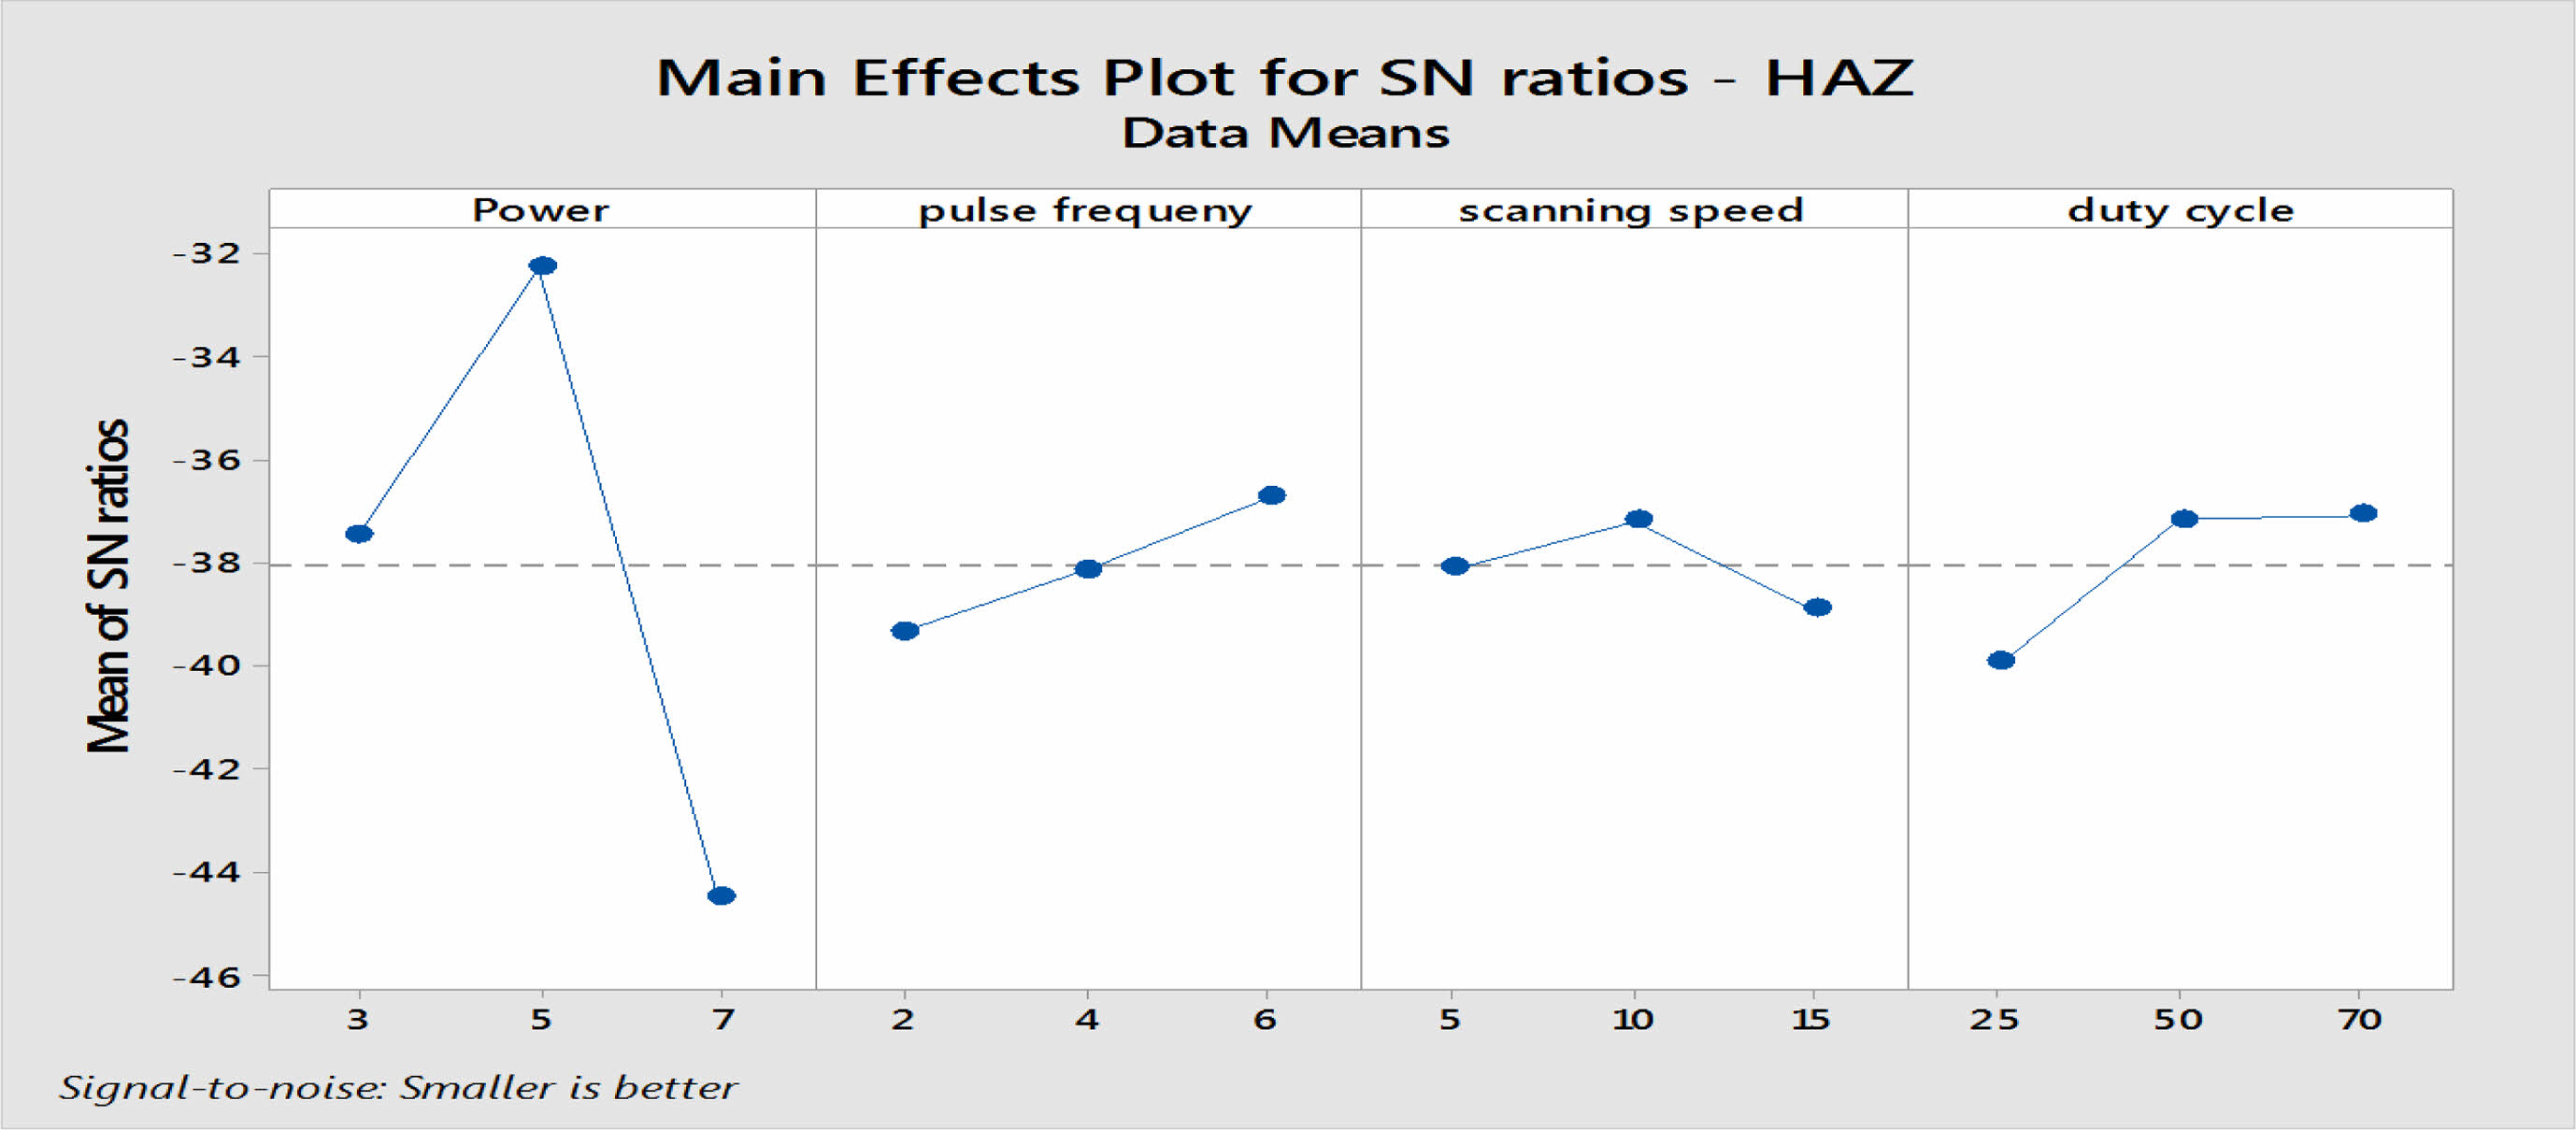
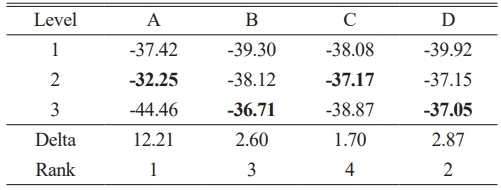
The heat affected zone and S-N ratio was calculated as presented in Table 6. In this analysis were used smaller - the –better method to check whether the considered effect factor. For the characteristics of the Taguchi method, a response Table 9 shows that S-N ratio of HAZ is generated. The results shown that the applied delta Power of 12.21 had the greatest effect on HAZ, duty cycle of 2.87 and followed by pulse frequency and Scanning speed with delta 2.60 and 1.70, respectively. Response table for the Signal - Noise Ratios are used to illustrate the main effects plot of HAZ, as shown in Fig. 5. Again, the most influence factor is power as the S-N ratio increases the power till the mid and decreases that the power increases. In the case of duty cycle sudden increase in trend of S-N ratio for HAZ from 25% to 50% and the ratio decreases slightly between 50% to 70%, shown in Fig. 5 in addition the frequency, the delta statistics in Table 9 shows that HAZ is mainly affected by the Power, duty cycle followed by the frequency and scanning speed.
The Table 9 presented responses of S-N ratio, Fig. 4 suggest that A2B3C2D3are desired levels for attaining higher Signal - Noise Ratios and lesser values of HAZ.
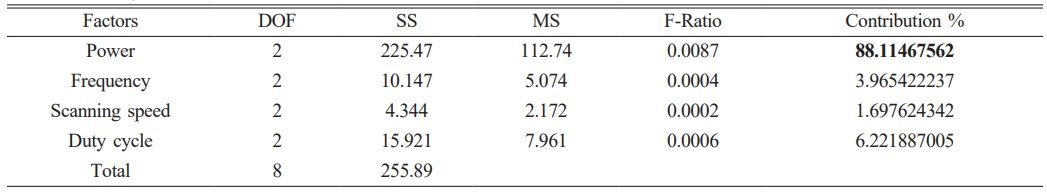
Subsequently, significant factors and percentage Fcontribution of each factor was carried out and tabulated (Table 10) which shows that Power has the highest contribution as 88.11% followed by duty cycle 6.22%, frequency of 3.965 % and scanning speed 1.697%.
Effect Factor on Ra
Surface roughness was measured using a 3D optical method with an Azimuth profilometer, which has a spatial resolution of 1.2 µinches. This instrument was used to study the surface topography and determine the Ra values.
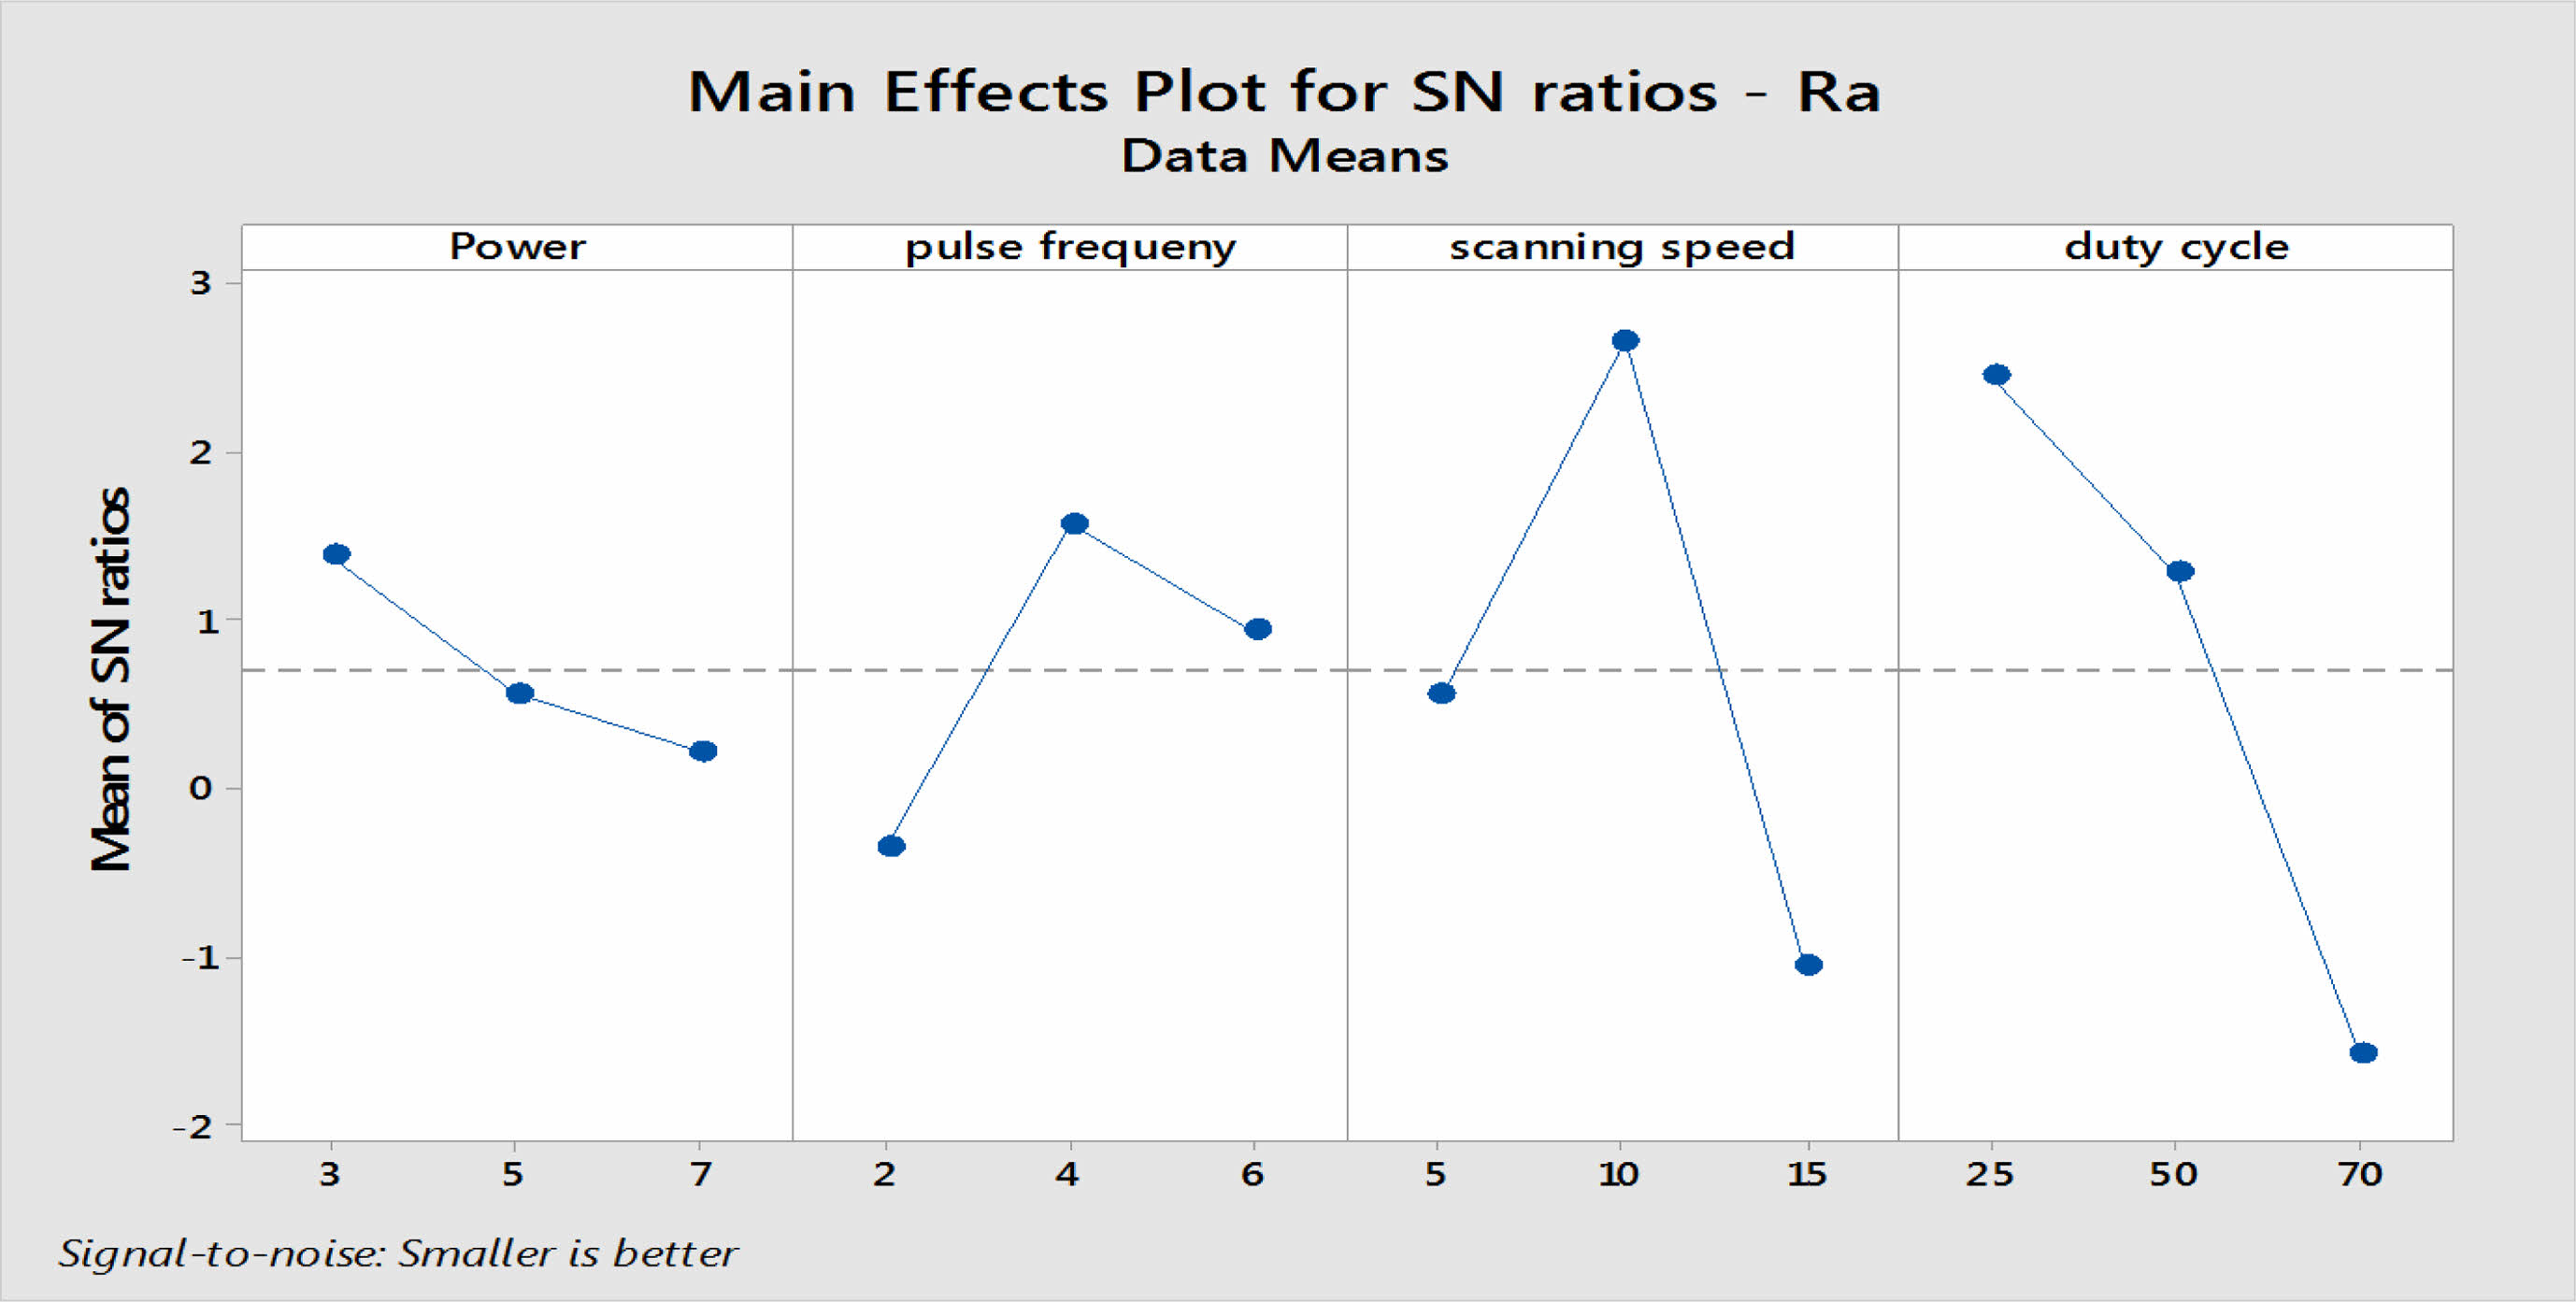
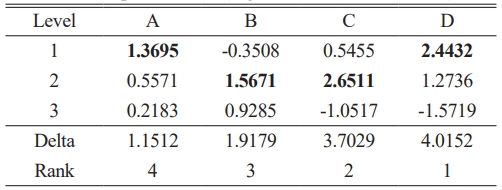
The experimental data and S-N ratios of surface roughness was calculated as shown Table 6. The Signal - Noise Ratios of Ra responses, delta ranks were generated as shown in Table 11. The most influencing factor of surface roughness is duty cycle with delta value 4.0152, and scanning speed 3.7029 followed by frequency 1.9179 and power 1.1512.
The Table 11 shows that responses for S-N ratio and main effects plot as shown in Fig. 5 suggest that A1B2C2D1 are the desired levels for attaining high S-N ratios and lesser values of Ra.
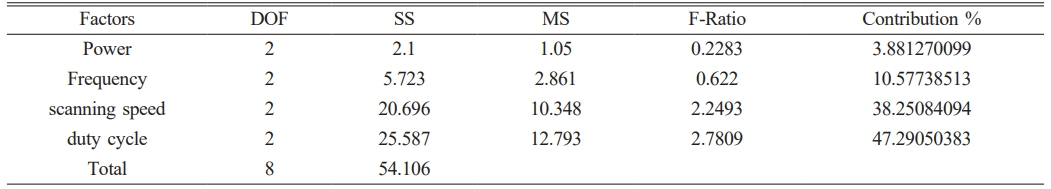
Concerning the ANOVA as shown in Table 12. Highest percentage contribution is Duty cycle 47.29%, Scanning speed 38.25%, followed by frequency 10.57% and power 3.88%.
The S-N ratio method described in above three sets of best input parameters for each of the three responses. In practical applications, however, it is important to calculate a single combination of optimum parameter for multiple responses. Therefore, in this works grey relation analysis (GRA) for these four factors and three responses. There is usually a larger MRR value, a smaller HAZ and Ra value are needed with the data sequence having the characteristics of the "smaller-the-better" and “larger-the-better" methodology.
The normalization of the Signal - Noise Ratio for MRR, HAZ, Ra are calculated using Equations (3, 4) is used to data pre-process.
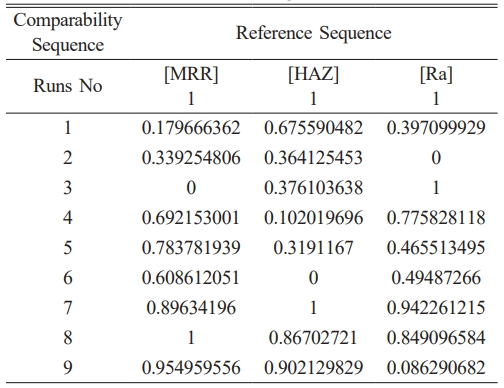
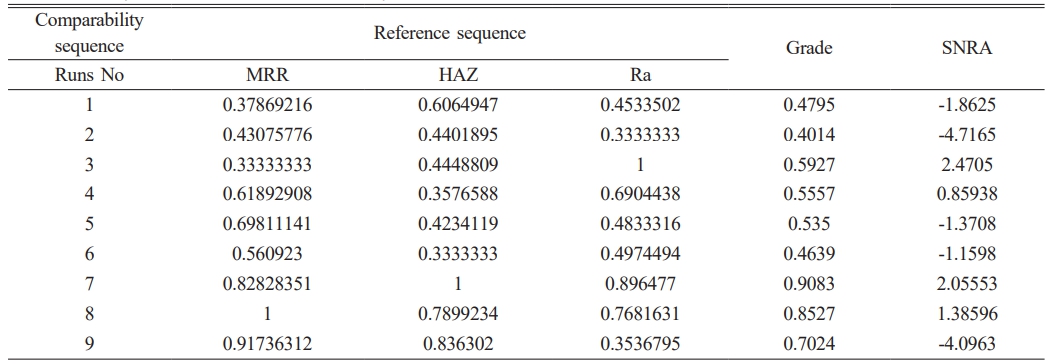
The values of MRR, HAZ and Ra are defined as the sequence of reference x0(0)(k), k = 1–3. In addition, the nine experiments are the sequences for comparability xi*(k), i = 1, 2 ... 9, k = 1-3. The sequences of data pre-processing is implemented using equation (3, 4) as shown Table 13. The reference and comparability sequences are defined as x0*(k) and xi* (k), respectively. The deviation of ∇oi, ∇oi max(k) and ∇oi min(k) for i = 1–9, k = 1-3 can also be evaluated. The deviation sequences ∆01 (1) can be evaluated as:
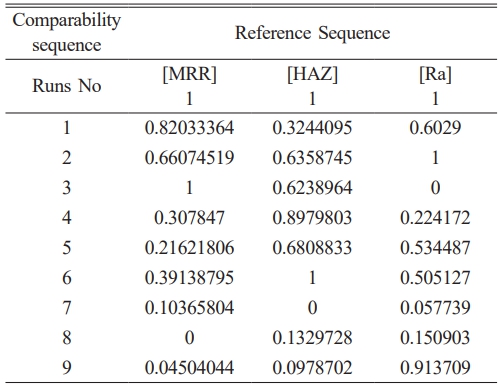
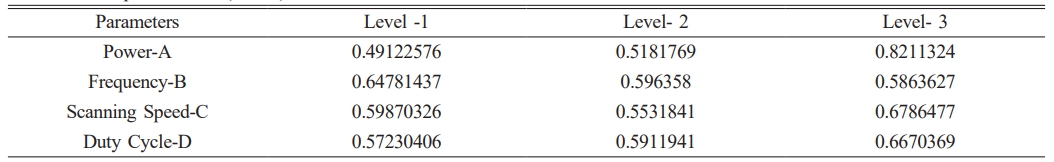
The calculated deviation sequence as shown in Table 14. The distinguishing coefficient can be used in grey relationship coefficient for the normalized value of the S-N ratio and grey relationship grad is calculated using equations (5, 7) are shown Table 15. Finally, grades estimates are taken into account to optimize the multiple response parameter design problem. This study used the response table from Taguchi methodology to determine the mean GRG value for each level, also the higher GRA grades indicate the level of concurrence between the sequences of reference and comparability, as shown in Table 15 estimated the selected average GRG values.
The GRADE provided in the response tables are serving as a measure of the correlation between the sequences of reference and the sequences of comparability. Whereas strong correlation has been achieved with higher average GRG value of GRA.
Therefore, from the main effect ploy for GRG presented in Fig. 6 possibility to obtain the optimum combinations of parameters that provides the maximum overall response and obtained maximum grey relational grade for A3B1C3D3.
In summary, the optimum settings for the favourable micro machining of the Dual phase SS 201 material are the applied Power to 7 W, the frequency 2 KHz, Speed of scanning as 15 mm/s and with 70% duty cycle.
ANOVA for GRG
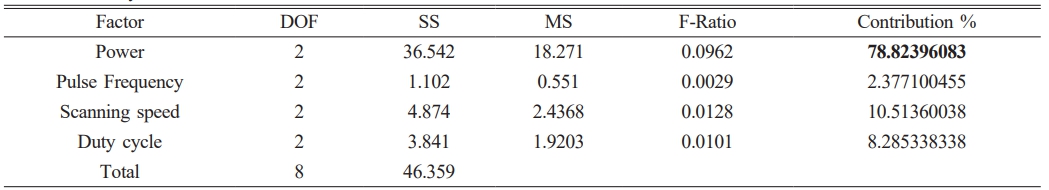
In order to examine the multiple responses of MRR, HAZ and Ra Fiber laser micro machining of the dual phase SS 201 material, an ANOVA is performed for the grey relational grade to calculate the percentage contribution in each factor. Table 17 shows that the power has the most effect factor, of 78.82%, on investigate the GRG, scanning speed of 10.51% the Duty cycle, with 8.28% and Frequency, with a minimal influence of 2.37%, for minimizing the Heat affected zone, roughness of the surface and maximizing the Material removal Rate, when considered simultaneously. The probability plot for GRG Showing the confidence level 95% is presented in Fig. 7.
Confirmation Tests
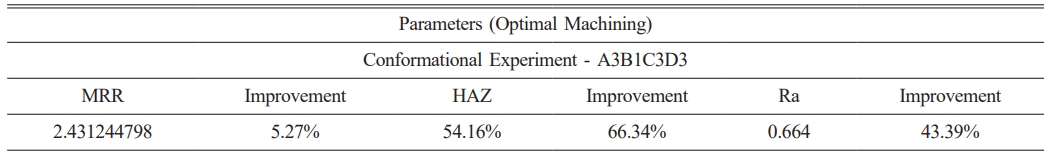
Once the optimal setting is decided, then the last step of GRA is to anticipate and establish performance improvements. The confirmatory tests performed to validate the analysis results and the values are presented in Table 18. The improvement of the experimental results When compared to the highest of OA responsesconfirms the validity of the Taguchi method combined with GRA to improve the Micro Machining of the Dual Phase SS 201.
Dimensional Analysis Machined Surface Morphology:
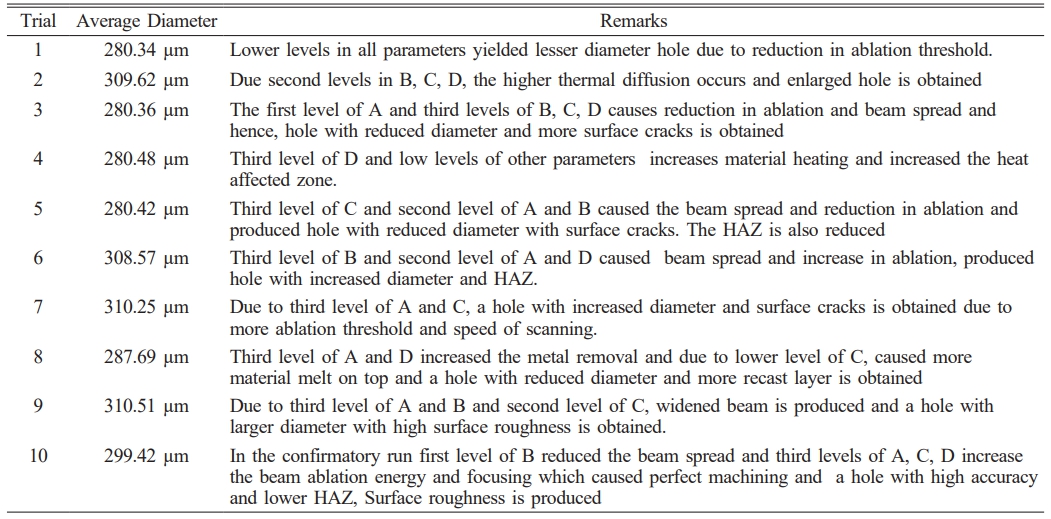
The actual hole diameters achieved ranged from approximately 280 μm to 310 μm, depending on the laser parameters such as pulse energy, number of pulses, and repetition rate and speed.
The final hole size compared to the beam diameter can be attributed to the following laser–material interaction mechanisms:
i. The central region of the beam exceeds the material’s ablation threshold. This results in a smaller effective ablation zone than the full beam diameter.
ii. The lower energy and fewer pulse conditions, ablation is confined to the center. With increased pulse overlap or higher pulse energy, thermal diffusion contributes to wider melt zones, slightly enlarging hole diameters.
This investigation analyzes the quality of machined hole. The set of each level of combination factors can be varied, that produce different type of micro hole. In the morphology study to investigate surface damage such as HAZ, recasting layer, surface debris and micro cracks with help of SEM analysis and surface roughness measured by the non-contact 3D Surface roughness measurement equipment. ImageJ software was used for the SEM-based measurement of micro-hole diameter. To improve dimensional accuracy, an averaging technique was employed. The diameter was measured in three directions across each hole using SEM images, and the average value was reported. The SEM images and 3D surface roughness images of the holes made using trials and confirmatory run are presented in Fig. 8. The Table 19 presents the summary of relationship between the hole diameter and the laser energy.
The SEM images and the 3D surface roughness images of the holes made are studied and the SEM images indicated as (a) of the corresponding trials show the Heat Affected Zone, Recast layers and cracks present. These are indicated by different coloured markings in the images itself. The 3D surface roughness images show the ranges of roughness peaks with varying colours. The surface roughness band width is higher for third level of all the parameters. It ranges from 40-50 µm. Cracks and recast layers are predominantly observed in higher values of power and duty cycle. The SEM image of the machined area with optimized parameter displays almost no cracks and very less heat affected zone. The roughness image shows the roughness band of 0 to 10 µm surrounding the machined area and is 40 µm lesser than the other trials.
|
Fig. 3 Main Effects plot for Signal - Noise Ratio (MRR). |
|
Fig. 4 Plot of Main Effect (Signal - Noise Ratio of HAZ). |
|
Fig. 5 Plot of Main Effects - Signal - Noise Ratio (Ra). |
|
Fig. 6 Plot of Main Effects - Signal - Noise Ratio (GRG). |
|
Fig. 7 Probability plot of GRG showing 95% confidence level |
|
Fig. 8 Images resulted from Trial |
This work presents feasibility studies to ablate a Dual phase SS 201 material by using the FLMM. Moreover, the paper analysis MRR, HAZ and Ra of micro- Hole fabrication on SS 201 in short pulse fiber laser micro machining process.
•
It is concluded that SS 201 material and micro hole geometries achieved may have good applications in biomedical technologies and other fields. Four influence parameters are selected and studied, Taguchi L9 orthogonal array is used for machining trials. The GRA method is used to enhance the better process parameters with the following conclusions.
• Optimization of parameters by Grey Relationship Analysis is done and the optimal parameters are Power 7.5 W(A), Frequency of pulse 2.5 KHz.(B), Speed of scanning 15 mms-1 (C), Duty cycle 70% (D)
• The improvement in GRG is 5.67% and the power has 78.82% of influence with respect to GRG.
• Power plays the key governing role on the MRR and HAZ. Increase in power generally led to increase in material removal rate, higher metal removal rate of 2.303236997 µm3/s for the trial 8 is obtained due to the third level of Power and Duty cycle which caused more cracks and metal removal surrounding the hole. The same trend is observed in Trial 9 and 7 for the same reasons. This is clearly visible in the SEM images.
• The duty cycle has major effect on the surface roughness. To achieve high surface quality, minimize surface roughness to set optimal combination levels of duty cycle and scanning speed factors. Frequency and Power has small impact on surface roughness. This can be seen from the SEM images resulted from the Trials. The roughness band of 60-80 µm is observed for Trial 8 which higher than all other trials,
• The analysis of machined surface Morphology images under the initial and optimal parameters were compared, micro-cracks were found at few locations, minimµm recasting layer and less heat affected zone in the surface machined using optimµm parameters. Whereas, huge heat affected zone, recasting layer and long cracks are observed in the surface machined using initial parameters.
- 1. X. Luo, W. Chang, and J. Sun, Micromachines 9 (2018) 564.
-

- 2. S.Z. Chavoshi and X. Luo, Precis. Eng. 41 (2015) 1-23.
-
- 3. Y. Cai, W. Chang, and X. Luo, Precis. Eng. 52 (2018) 266-275.
-
- 4. K. You, G. Yan, and X. Luo, J. Manuf. Process. 58 (2020) 677-692.
-
- 5. Zhao, H. Wang, and X. Liu, Front. Mech. Eng. 12 (2017) 155.
- 6. H. Kim, J. Lee, and H. Nam, Micro Nano Syst. Lett. 9 (2021).
- 7. Z. Yang, J. Li, J. Zhang, and Q. Chen, RSC Adv. 12 (2022) 33660.
- 8. S. Bruening, K. Du, M. Jarczynski, and A. Gillner, J. Laser Appl. 32 (2020) 012003.
- 9. S. Gunasekaran, S. Periyagounder, and M. Subramaniam, J. Ceram. Process. Res. 24, (2023) 705.
-
- 10. K.T. Metz, F. Civelek, and A. Zimmermann, Micromachines 16 (2025) 606.
-
- 11. Yi Qin, A. Brockett, Y. Ma, A. Razali, J. Zhao, C. Harrison, W. Pan, X. Dai, and D. Loziak, Int. J. Adv. Manuf. Technol. 47 (2010) 821.
-
- 12. Y. Zhang, Z. Zhang, D. Liu, J. Wu, Y. Huang, and G. Zhang, J. Adv. Res. 30 (2021) 39.
-
- 13. N. Ackerl, M. Warhanek, J. Gysel, and K. Wegener, J. Eur. Ceram. Soc. 39 (2019)1635.
-
- 14. M. Hajri, J. Pfaff, H. Buettner, M. Voegtlin, R. Kaufmann, and K. Wegener, Procedia CIRP 77 (2018) 654.
-
- 15. B. Jaeggi, S. Remund, R. Streubel, B. Goekce, S. Barcikowski, and B. Neuenschwander, J. Laser Micro/Nanoeng. 12 (2020) 267.
- 16. S. Xu and X. Wang, J. Therm. Stresses 46 (2023) 345.
-
- 17. M.H. Abidi, M.K. Mohammed, M.K. Aboudaif, and H. Alkhalefah, Adv. Mech. Eng. 14[1] (2022) 6.
-
- 18. S. Sivaraos, M.S. Kasim, M.A. Md Ali, R.I.R. Abdullah, and T.J.S. Anand, J. Mater. Sci.: Mater. Eng. 10 (2015) Art. 2.
-
- 19. O.F. Ugbine, O.B. Akhabue, P.O. Blessing, A.-B.S. Mobisayo, J.O. Egbunu, and V.O. Dauda, World J. Adv. Res. Rev. 23 (2024) 744.
-
- 20. S. Anand, J. Res. Mech. Eng. 7 (2021) 1.
- 21. A. Nigade, A.S. Nemade, N.A. Argiddi, S.S. Anjarlekar, and P.P. Kharche, J. Emerg. Technol. Innov. Res. 8 (2021) 1.
- 22. U. Brauch, C. Röcker, T. Graf, and M.A. Ahmed, Appl. Phys. B 128 (2022) Art. 58.
-
- 23. Y. Yan, Y. Zheng, H. Sun, and J. Duan, Front. Phys. 9 (2021) 669591.
-
- 24. J. Han, J. Zhang, X. Shan, H. Peng, and L. Wang, Chin. Opt. Lett. 20 (2022) 081401.
-
- 25. F. Preusch, B. Adelmann, and R. Hellmann, Micromachines 5 (2014) 1051.
-
- 26. M.A.N. Rashid, T. Saleh, W.I. Noor, and M.S. Mohamed Ali, Int. J. Adv. Manuf. Technol. 114 (2021) 709-723.
-
- 27. D.J. Kotadiya, J.M. Kapopara, A.R. Patel, C.G. Dalwadi, and D.H. Pandya, Mater. Today Proc. 5 (2018) 5384-5390.
-
- 28. T. Muthuramalingam, R. Akash, S. Krishnan, N.H. Phan, V.N. Pi, and A.H. Elsheikh, J. Manuf. Process. 62 (2021) 1-6.
-
- 29. A. Patel and S.N. Bhavsar, Mater. Today Proc. 43 (2021) 28-35.
-
- 30. S.A. Bagherzadeh, M. Shamsipour, M.J. Kholoud, and M.H. Razavi Dehkordi, J. Laser Appl. 33 (2021) 012056.
-
- 31. M. Shafaie, M. Khademi, M. Sarparast, and H. Zhang, Int. J. Adv. Manuf. Technol. 123 (2022) 4385-4398.
-
- 32. S. Kanthasamy and T.S. Ravikµmar, Aust. J. Mech. Eng. 21 (2021) 1198-1217.
-
- 33. S. Kanthasamy and T.S. Ravikµmar, Aust. J. Mech. Eng. 22 (2022) 652-665.
-
- 34. N. Haghdadi, C. Ledermueller, H. Chen, Z. Chen, Q. Liu, X. Li, G. Rohrer, X. Liao, S. Ringer, and S. Primig, Mater. Sci. Eng. A 846 (2022) 142695
-
- 35. S. Patra, A. Agrawal, A. Mandal, and A.S. Podder, Trans. Indian Inst. Met. 74 (2021) 1089-1098.
-
- 36. T. Kar, S.S. Deshmukh, S. Datta, and A. Goswami, Materials Today: Proceedings 82 (2023) 96-102.
-
- 37. C.A. Biffi, N. Lecis, B. Previtali, M. Vedani, and G.M. Vimercati, Int. J. Adv. Manuf. Technol. 54 (2011) 149-160.
-
- 38. K. Venkata Rao, L. Suvarna Raju, G. Suresh, J. Ranganayakulu, and J. Krishna, Opt. Laser Technol. 169 (2024) 110146.
-
- 39. K. Rajesh, R.V. Murali Krishnam Raju, S. Rajesh, and N. Sudheer Kumar Varma, Mater Today: Proc. 18 (2019) 2065-2072.
-
- 40. I. Buj-Corral, L. Costa-Herrero, and A. Domínguez-Fernández, Metals 11 (2021) 1224:1-13.
-
- 41. B.S. Wardhana, K. Anam, R.M. Ogana, and A. Kurniawan, IOP Conf. Ser.: Mater. Sci. Eng. 494 (2019) 012041.
-
- 42. S. Pattanayak and S.K. Sahoo, Opt. Fiber Technol. 63 (2021) 102479.
-
- 43. Y.A. Turkkan, M. Aslan, A. Tarkan, Aslan, C. Yavuz, and N. Yavuz, Metals 13 (2023) 132:1-13.
-
- 44. S. Pattanayak, S.K. Panda, and D. Dhupal, J. Manuf. Process. 52 (2020) 220-234.
-
- 45. G.R. Ravanneswarran, L. Poovazhagan, S. Santosh, and M.P. Ananth, Mater. Manuf. Process. 40 (2025) 1183-1196.
-
- 46. S. Jain and V. Parashar, Mater. Manuf. Process. 36 (2021) 1701-1724,
-
- 47. J.F. Liu and Y.B. Guo, Procedia Manuf. 1 (2015) 904-914.
-
- 48. C.A. Biffiy, J. Fiocchi, and A. Tuissi, J. Mater. Res. Technol. 19 (2022) 472-506.
-
- 49. N. Haghdadi, C. Ledermueller, H. Chen, Z. Chen, Q. Liu, X. Li, G. Rohrer, X. Liao, S. Ringer, and S. Primig, Mater. Sci. Eng. A 846 (2022) 142695.
-
- 50. Z. Ouyang, J. Wang, H. Su, X. Wang, Y. Xie, and T. Wu, J. Mater. Eng. Perform. 33 (2024) 12682-12690.
-
- 51. W. Chuaiphan and L. Srijaroenpramong, J. Adv. Join. Process. 1 (2020) 100016.
-
- 52. H. Vashishtha, R.V. Taiwade, S. Sharma, and A.P. Patil, J. Manuf. Process. 25 (2017) 49-59.
-
- 53. Agrawal and D. Kamble, J. Braz. Soc. Mech. Sci. Eng. 41 (2019) 4.
-
- 54. S. Patra, A. Agrawal, A. Mandal, and A.S. Podder, Trans. Indian Inst. Met. 74 (2021) 1089-1098.
-
- 55. B. Somasundaram, K.T. Anand, D. Kirubakaran, P. Ganesh, S. Kannan, A.H. Seikh, and A. Ghosh, J. Ceram. Process. Res. 24 (2023) 626-633.
-
- 56. K. Rajesh Kumar, K.K. Dama, and V. Venkatasatyanarayana, J. Ceram. Process. Res. 25 (2024) 151-158.
-
- 57. P.P. Shantharaman, V. Anandakrishnan, S. Sathish, and M. Ravichandran, J. Ceram. Process. Res. 23 (2022) 589-594.
-
- 58. K. Rajesh Kumar, K.K. Dama, and V.V. Satyanarayana, J. Ceram. Process. Res. 24 (2023) 439-445.
-
- 59. S. Murugesan, V. Thangamuthu, R.M. Shivaji, and R. S. Kµmar, J. Ceram. Process. Res. 23[3] (2022) 367-372.
-
- 60. T. Tamilanban, T.S. Ravikµmar, C. Gopinath, and S. Senthilrajan, J. Ceram. Process. Res. 22 (2021) 629-635.
-
- 61. P. Saravana Kumar, S. Kumar, S. Pradeep, T.Y. Badgujar, B. Krishnaveni, G. Mahendran, D. Poosapadi, M. Premalatha, G.S.V. Seshu Kumari, and K.K. Arun, J. Ceram. Process. Res. 26 (2025) 502-506.
-
- 62. R. Prakash, R. Thirumalai, K. Venkatesh, and C. Natarajan, J. Ceram. Process. Res. 26 (2025) 280-285.
-
- 63. T. Suresh, P. Suresh, and M. Prabu, J. Ceram. Process. Res. 25 (2024) 192-201.
-
 This Article
-
2025; 26(5): 870-885
Published on Oct 31, 2025
- 10.36410/jcpr.2025.26.5.870
- Received on Jul 7, 2025
- Revised on Jul 25, 2025
- Accepted on Aug 13, 2025
Services
- Abstract
introduction
experimental planning
result analysis and discussion
conclusion
- References
- Full Text PDF
Shared
Correspondence to
- C. Gopinath
-
Department of Mechanical Engineering, St Joseph College of Engineering, Sriperumbudur, Kanchipuram, Tamilnadu-602 117, India
Tel : +91-7845992376 - E-mail: gopinath.chr@gmail.com
Clean-Energy Research Institute(CRI), Hanyang University, 222, Wangsimni-ro, Seongdong-gu, Seoul, 04763, Korea
E-mail: jcpr@hanyang.ac.kr