


- The effect of sintering temperature on the strength and electrical properties of Porcelain Alumina Ceramic Insulator (PACI) materials
Wahyu Garinas*, Ahmad Fauzi, Haerul Hidayaturrahman*, Yanto Sudiyanto, Wahyu Hidayat, Nur Ikhwani, Yeni Novitasari, Vany Nursanti, Arif Suryanegara and Fajar Yudi Prabawa
Mining Technology Research Center, National Research and Innovation Agency, Serpong, Indonesia
This article is an open access article distributed under the terms of the Creative Commons Attribution Non-Commercial License (http://creativecommons.org/licenses/by-nc/4.0) which permits unrestricted non-commercial use, distribution, and reproduction in any medium, provided the original work is properly cited.
The synthesis process of Porcelain Alumina Ceramic Insulator (PACI) material was carried out from various compositions of kaolin, ball clay, feldspar and alumina. The composite samples were prepared through mechanical milling and compaction processes to obtain three ceramic composites C1, C2 and C3. The sintering process on the composite samples was carried out at temperatures of 1200 oC and 1300 oC for 3 hours. All sample ware tested for morphology, crystal structure, elemental composition using SEM, XRD and XRF as well as compressive strength test and electrical properties. In sample C1, XRD results show that increasing the sintering temperature increases the crystallite size by about 71.65% with the dominant phase being mullite and a little quartz making the ceramic stronger and better as an electrical insulator. Likewise, Increasing the sintering temperature of ceramic composites, especially C3, can increase their strength to around 46.27 MPa with a stable density of around 1.56 gr/cm3, while the combination of kaolin and alumina and sintering treatment also produce good electrical properties, with an optimum dielectric value at C1 of around 9.27 kV/mm. Therefore, the experimental results show that the sintering process at a temperature of 1300 oC makes the porcelain insulator stronger and has better electrical properties.
Keywords: Porcelain Alumina Ceramic Insulator (PACI), Corundum, Material strength, Insulating properties.
The electrical industry is fundamental to sustaining human life, particularly in rapidly developing regions such as Indonesia, where energy demands are projected to escalate significantly. By 2060, Indonesia is expected to require approximately 1,413 Terawatt Hours (TWh) of electricity, reflecting the country's robust economic growth and increasing energy consumption patterns [1, 2]. This growing demand necessitates the development of high-voltage transmission systems to ensure reliable electricity distribution across the archipelago [3]. To achieve safe and efficient transmission from the state electricity company, PLN (Perusahaan Listrik Negara), to various consumers, the implementation of insulators is critical. Insulators serve to prevent the unintended flow of current from high-voltage lines to the ground, thereby safeguarding infrastructure and enhancing the reliability of the electrical grid [4]. The importance of these safety measures cannot be overstated, as they are essential for maintaining the integrity of the electrical supply and protecting both human life and equipment from electrical hazards [5]. Porcelain Alumina Ceramic Insulators (PACI) have emerged as a leading solution for high-voltage transmission systems due to their exceptional properties, including high mechanical strength, excellent dielectric, and thermal insulation capabilities. However, the production of these advanced ceramic materials requires careful control of the sintering process, as the temperature can significantly impact the final properties of the insulator. The production of PACI in Indonesia can be significantly enhanced through the utilization of local raw materials such as kaolin, ball clay, feldspar, and quartz sand. These materials are essential for the manufacturing of high-quality porcelain insulators, which are crucial for electrical applications [6].
PACI is produced using natural ceramic raw materials such as ball clay, kaolin, feldspar, and quartz, which are essential for achieving the desired electrical insulation properties. The selection of these raw materials is critical, as they undergo various physical changes and chemical reactions under thermal conditions during the production process [7]. The quality of these raw materials significantly influences the performance of the final product, particularly during the composite and sintering processes, which are vital for ensuring effective insulation properties [7, 8]. Ball clay (Al2Si2O5(OH)4), when in a wet state, serves as a binder for the other materials in the composite, imparting plasticity that facilitates shaping and molding [7]. Feldspar [KxNa1-x (AlSi3)O8] acts as a flux and provides an alternative source of alumina and silica, which are crucial for the vitrification process during firing [7]. Additionally, quartz (SiO2) is utilized as a filler material, contributing to the structural integrity of the porcelain alumina ceramic insulator during the heating process [7]. The interplay of these materials is essential for achieving the desired mechanical and electrical properties of PACI, as the sintering temperature and conditions can significantly affect the microstructure and, consequently, the insulation performance [8]. The modification process for high-quality PACI often relies on the availability of high-quality ball clay, which can be challenging to source. As a result, ongoing research and development efforts focus on utilizing locally sourced ball clay from natural materials to enhance the production of PACI [9].
PACI are essential components in high-voltage distribution and transmission systems, necessitating specific properties such as high resistivity, excellent dielectric characteristics, and robust mechanical strength to ensure reliable performance [10]. The dielectric and mechanical strength of PACI are critical factors that determine their quality and effectiveness as insulators [11]. These properties are significantly influenced by the primary phases present in the ceramic structure, particularly the mullite and glassy phases, which develop during high-temperature sintering processes [12]. The mullite phase, characterized by the chemical formula Al6Si2O3, is derived from ball clay and forms a crystalline aluminosilicate structure, contributing to the mechanical strength of the insulator [13]. Conversely, the glassy phase originates from the sintering of feldspar within the composite, which aids in the compaction of the ceramic body [14]. However, an excessive glass phase can lead to increased ionic mobility within the porcelain body, adversely affecting its electrical insulation properties [15]. Therefore, careful control of the composition and sintering temperature is crucial to optimize the mechanical properties while maintaining effective insulation [16]. To achieve high mechanical and electrical (dielectric) strength properties in PACI, variations in the composition of local Indonesian natural materials such as kaolin, feldspar, ball clay, and alumina are explored. This approach aims to enhance the insulating properties of PACI while ensuring the materials used are locally sourced and sustainable. The study of these variations is vital, as it can lead to significant improvements in the performance of PACI, making them suitable for the demanding conditions of high-voltage applications.
Raw Material Source
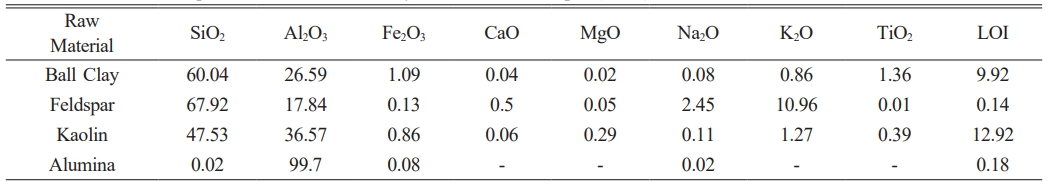
The raw materials used in synthesizing Porcelain Alumina Ceramic Insulator (PACI) in this study are ball clay and alumina from the province of West Kalimantan, feldspar from the province of Lampung, kaolin taken from Belitung Island. The chemical composition of the raw materials ball clay, alumina, feldspar and kaolin are shown in Table 1.
Synthesis of Porcelain Alumina Ceramic Insulator (PACI)
The processing of raw materials involves several critical stages, including drying, crushing, grinding, and sieving, each contributing to the final material characteristics. Initially, raw material chunks are dried at 60 oC for 12 hours to reduce moisture content, which is essential for preventing clumping and ensuring efficient subsequent processing. Following drying, the material is crushed using a jaw crusher, which reduces the size of the chunks to facilitate further size reduction. The crushed material is then ground in a pulverizer to achieve a fine particle size of 325 mesh, corresponding to approximately 44 micrometers in diameter. The resulting materials are mixed according to the desired composition plan as given in Table 2. The composition is designed based on previous research with slight modifications by considering the grain size. The mixed materials are mixed using a mechanical milling process for 10 hours. The sample is molded using a hydraulic press at a pressure of 70 Bar with a diameter of 5 cm and a thickness of 1 cm and then the sample that has been formed into a coin is sintered at a temperature of 1200 oC and 1300 oC for 6 hours using a furnace. The sintering temperature was chosen based on previous research [7] on the effect of sintering temperature on the crystal structure and formation of the mullite phase in porcelain insulators.
Characterization of Porcelain Alumina Ceramic Insulator (PACI) Material
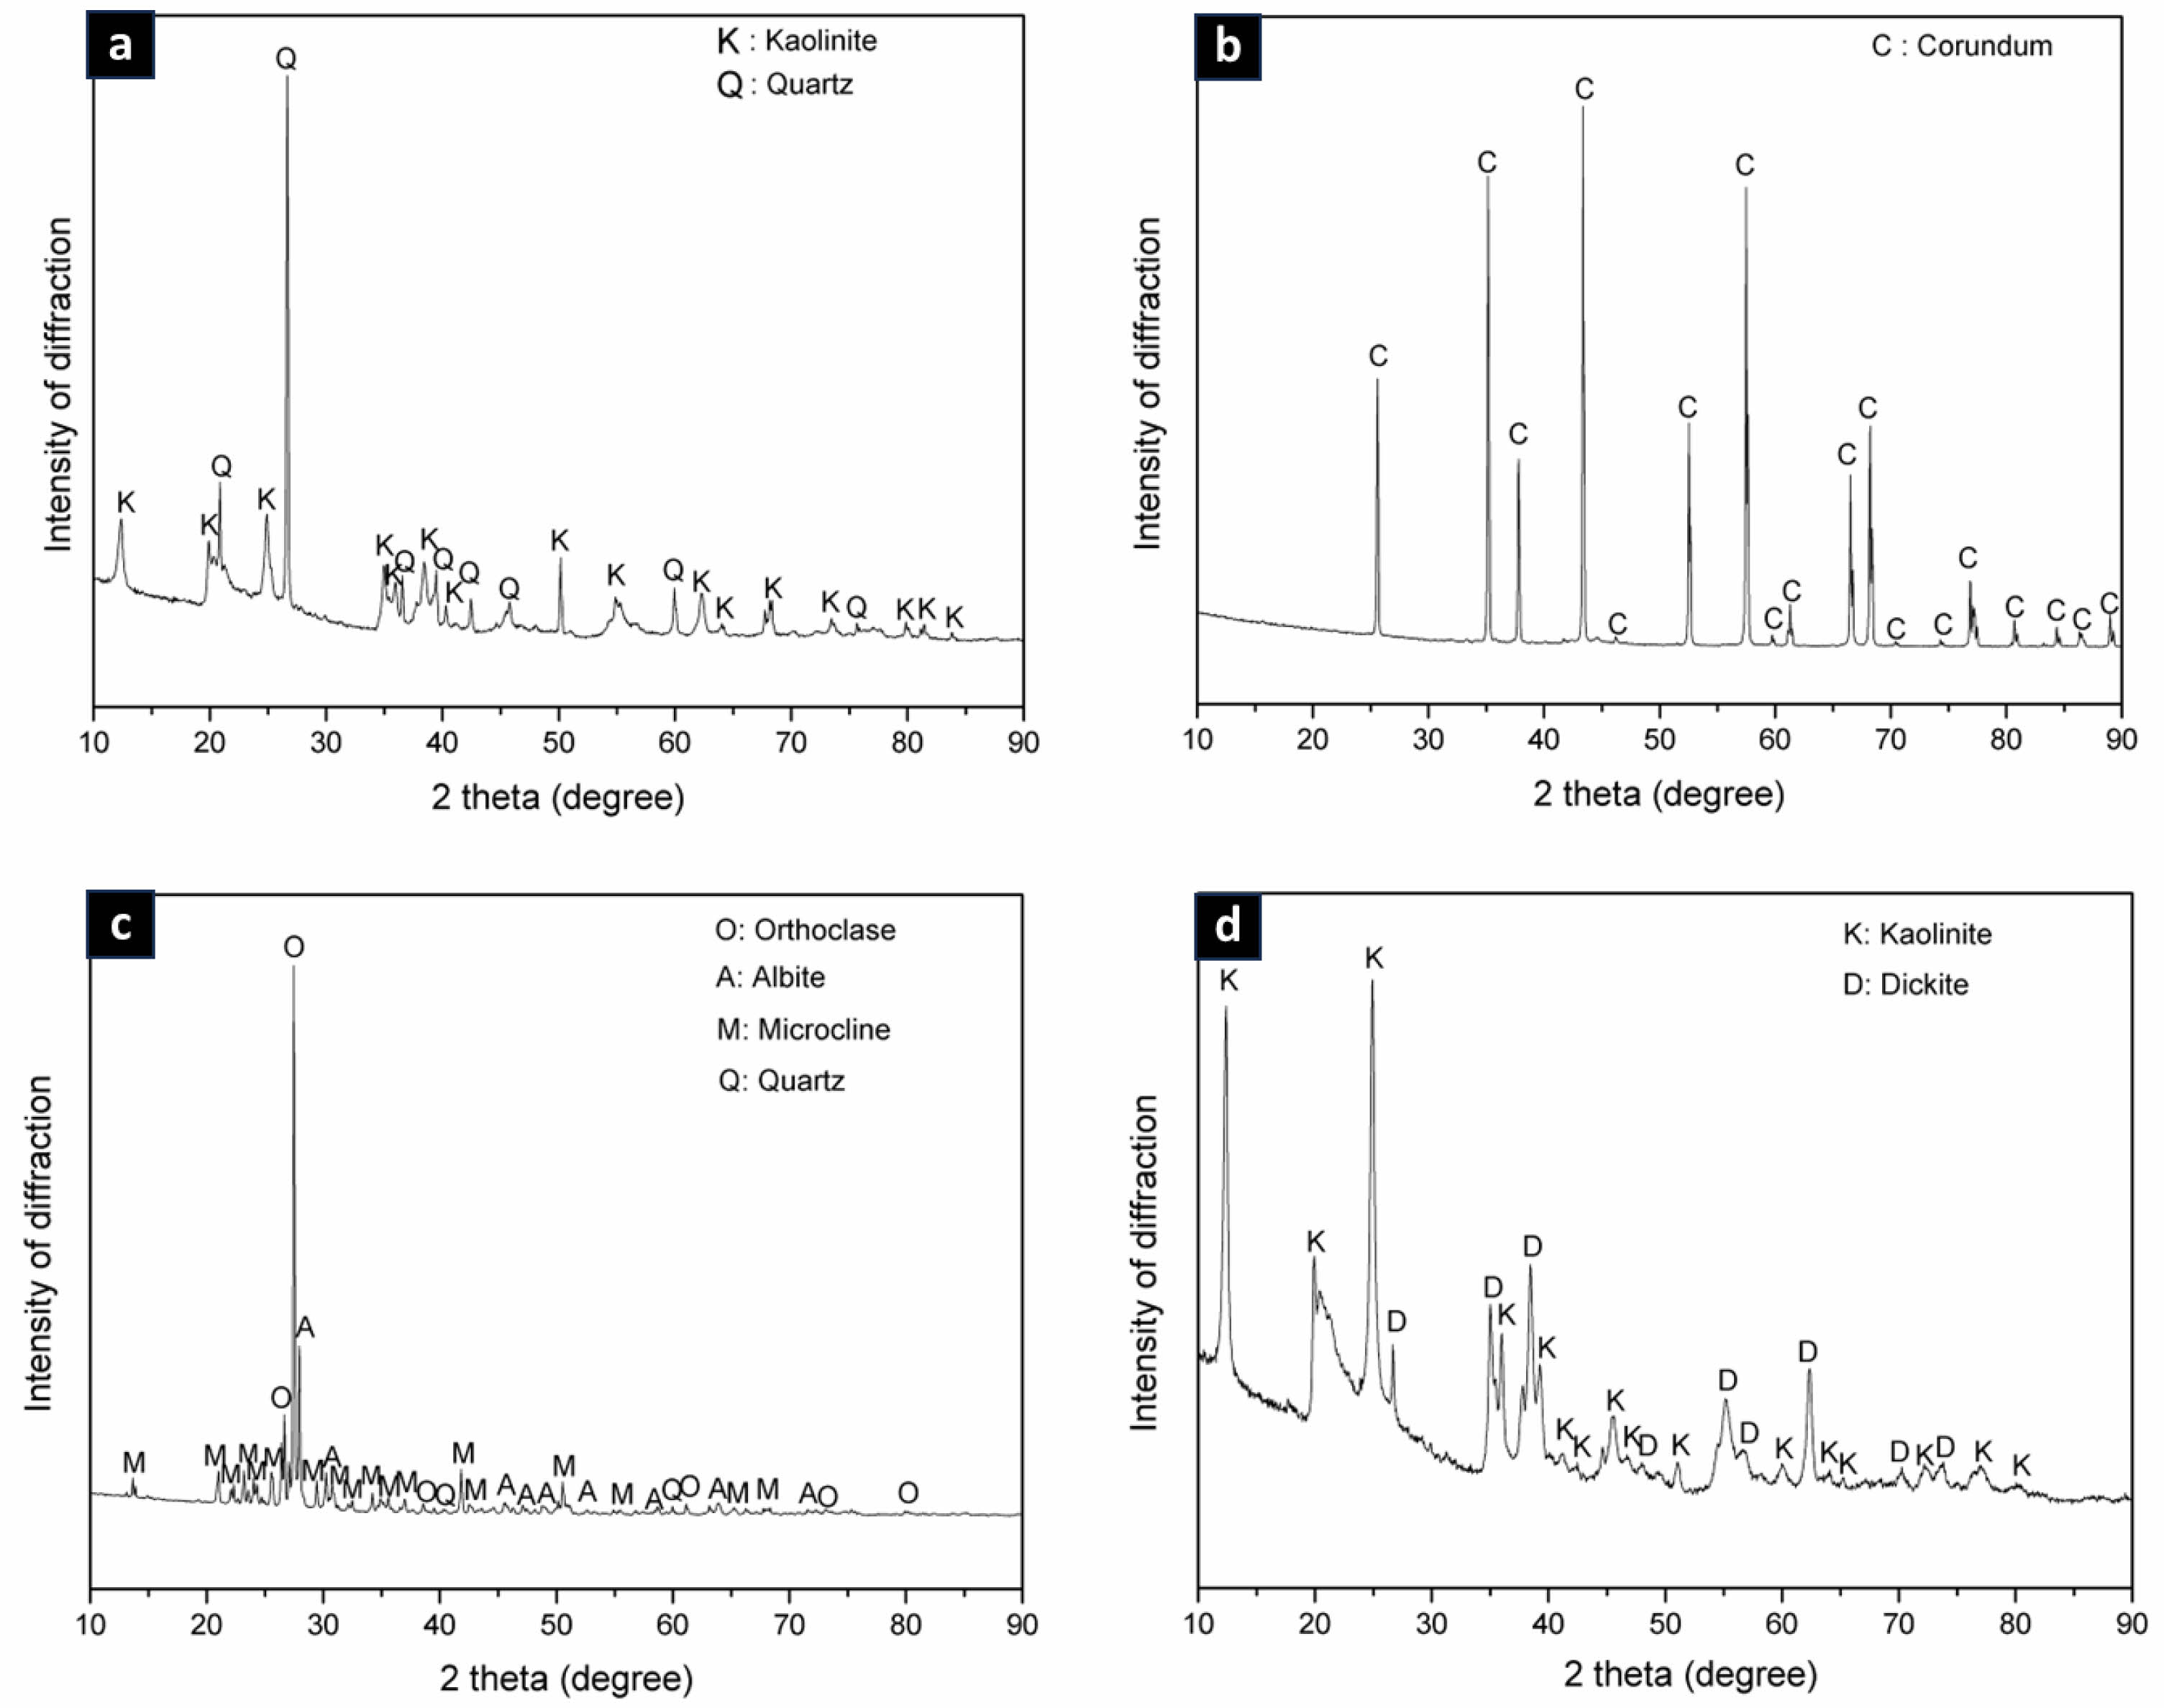
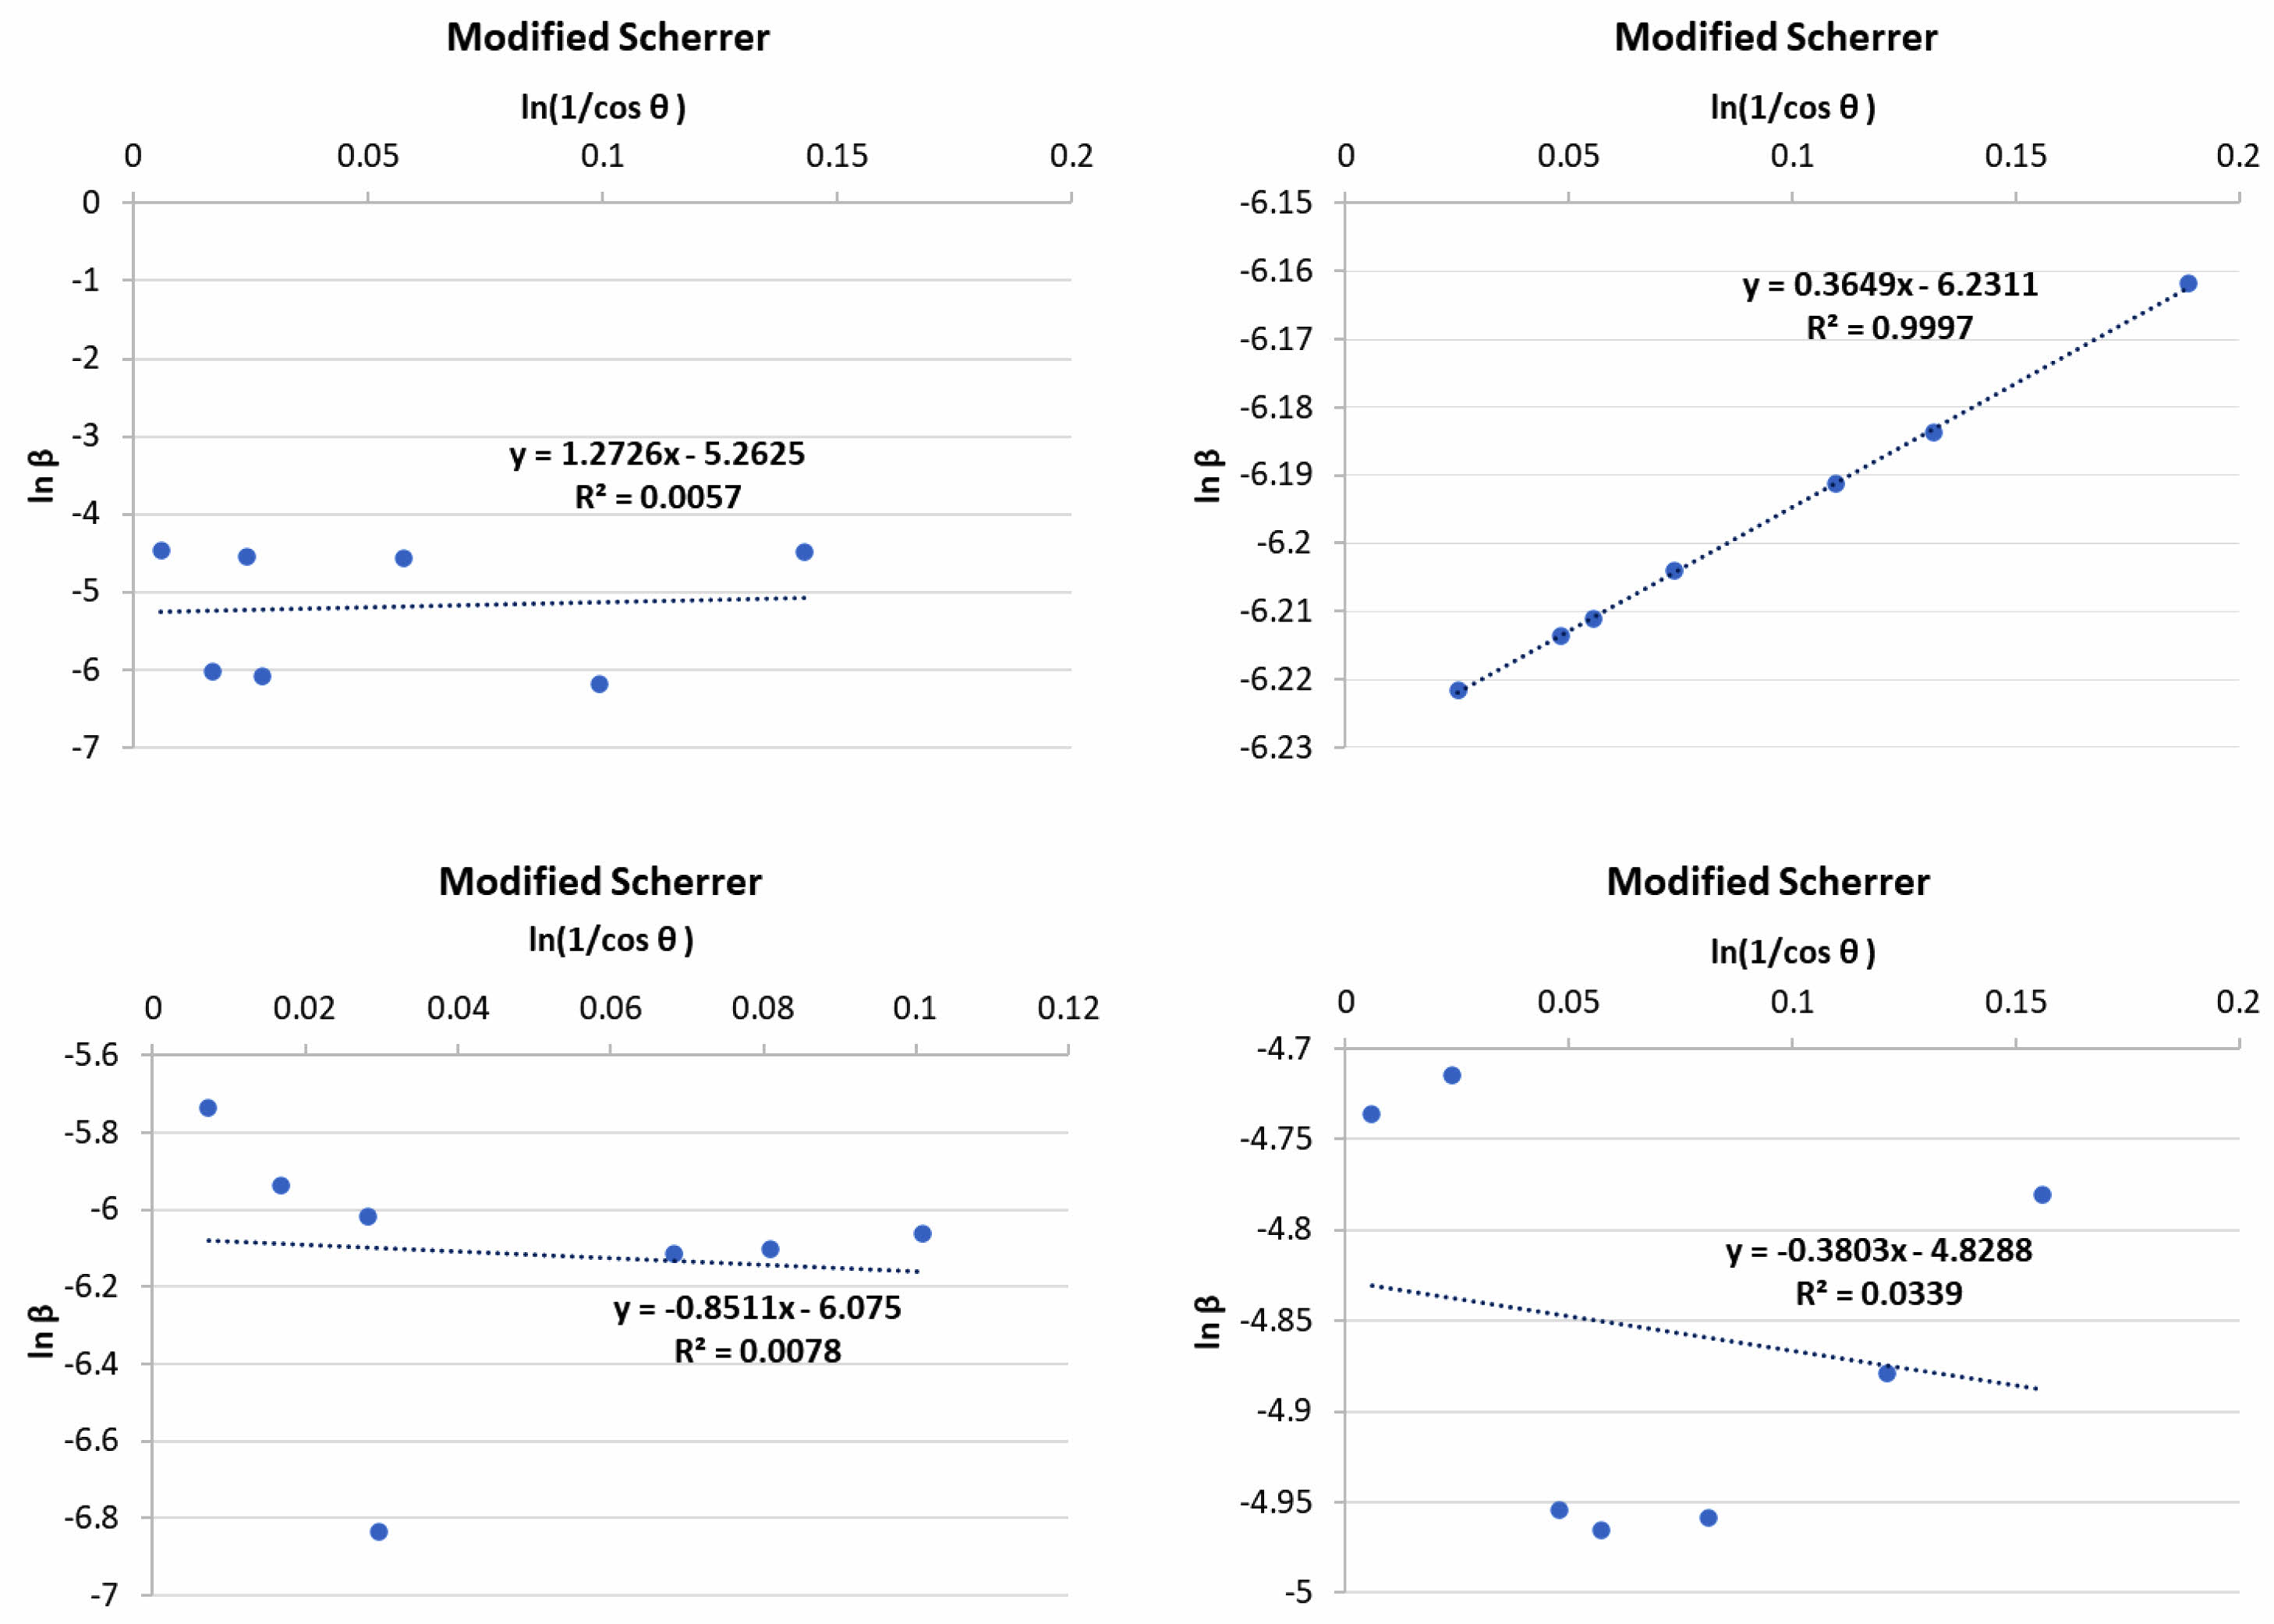
PACI material in the form of composite samples was characterized by crystal structure properties using an X-ray diffractometer (Rigaku Miniflex 600 θ-2θ) with Cu K-α radiation of 1.5406, operated at 40 kV and 40 mA. The modified Scherrer's equation was used to calculate the crystallite size of the X-ray diffractometer results as follows:
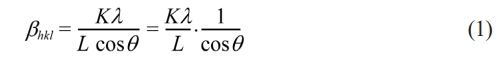
Which came to be called the Scherrer modification equation. Furthermore, equation (1) is written in a logarithmic form as:
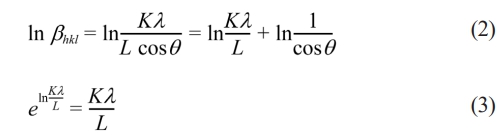
By plotting the curve ln βhkl vs ln(1/cosθ), the crystallite size can be determined from the y-intercept. Having K = 0.9 and λ (such as λCukα1 = 0.15405 nm), where L is crystallite size, λ is the X-ray wavelength, θ is the Bragg's angle and βhkl is the line broadening, based on full-width at half maximum (FWHM) in radians. After done calculation size crystallite, XRD results can analyzed in a way quantitative with method rietveld refinement using highscore plus software for obtain the lattice parameters, density and volume of the unit cell as well as Goodness of fitting value.
PACI material can be characterized by the strength properties of the material can be seen from the hardness value using the Vickers method with a compressive strength tester (Shimadzu TEC N-300). Hardness can be seen from the resistance of the material to penetration or resistance to deformation of the material surface. In this study, the measurement of the hardness of ceramic samples can be determined by the following equation:
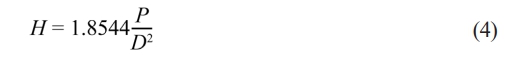
Where P is the applied load and D is the diagonal length of the indenter trace and H is the hardness. To find out the effect of sintering temperature given to the ceramic composite sample on the hardness value of a material can be expressed geometrically as follows:

Where H is the hardness value of the material, a is the dimensional thickness of a material and b is the diameter of a material while T is the sintering temperature given to the ceramic composite sample. While the sintering temperature of a ceramic material will have an effect on the electrical properties, the electrical properties can be seen from the dielectric strength value of the ceramic sample. Measurement of dielectric strength in ceramics is calculated by applying an electric voltage to the sample so that the break down voltage value will be obtained using a testing machine (Phenix Technologies Accident Maryland, USA). The break down voltage value in the ceramic sample is then calculated using the dielectric strength equation as follows:
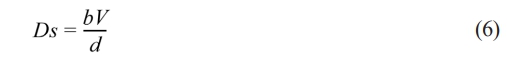
Where Ds is the dielectric strength value (kV) and bV is the break down voltage value (volt) and d is the thickness value of the ceramic sample (mm). while the ceramic sample will also be characterized by the morphological form of a ceramic composite with a scanning electron microscopy (SEM) (Phenom ProX) and the SEM analysis results can calculate the particle size using ImageJ software or can be confirmed by testing the particle size using the PSA (Particle Size Analyzer) tool. While to determine the chemical composition of the ceramic composite using the X-ray fluorescence (XRF (Rigaku NexCG) tool. To find out if there is a change in the mullite phase so that changes in endothermic and exothermic process conditions are carried out Differential Thermal Analysis (DSC) - Thermogravimetry Analysis (TGA) testing.
|
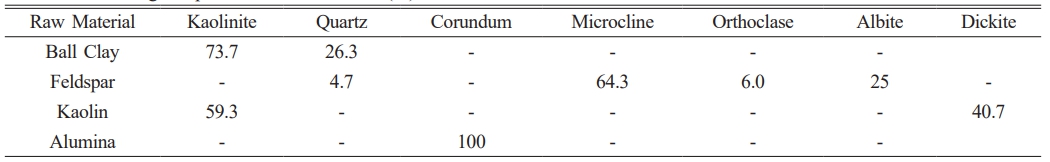
Table 1 Chemical composition of kaolin, ball clay, alumina and feldspar (wt %). |
|
Table 2 Composition of Porcelain alumina ceramic insulator composite samples (wt %). |
Characteristics of Raw Material Crystal Structure
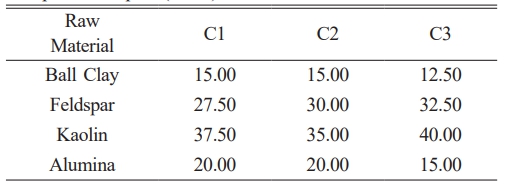
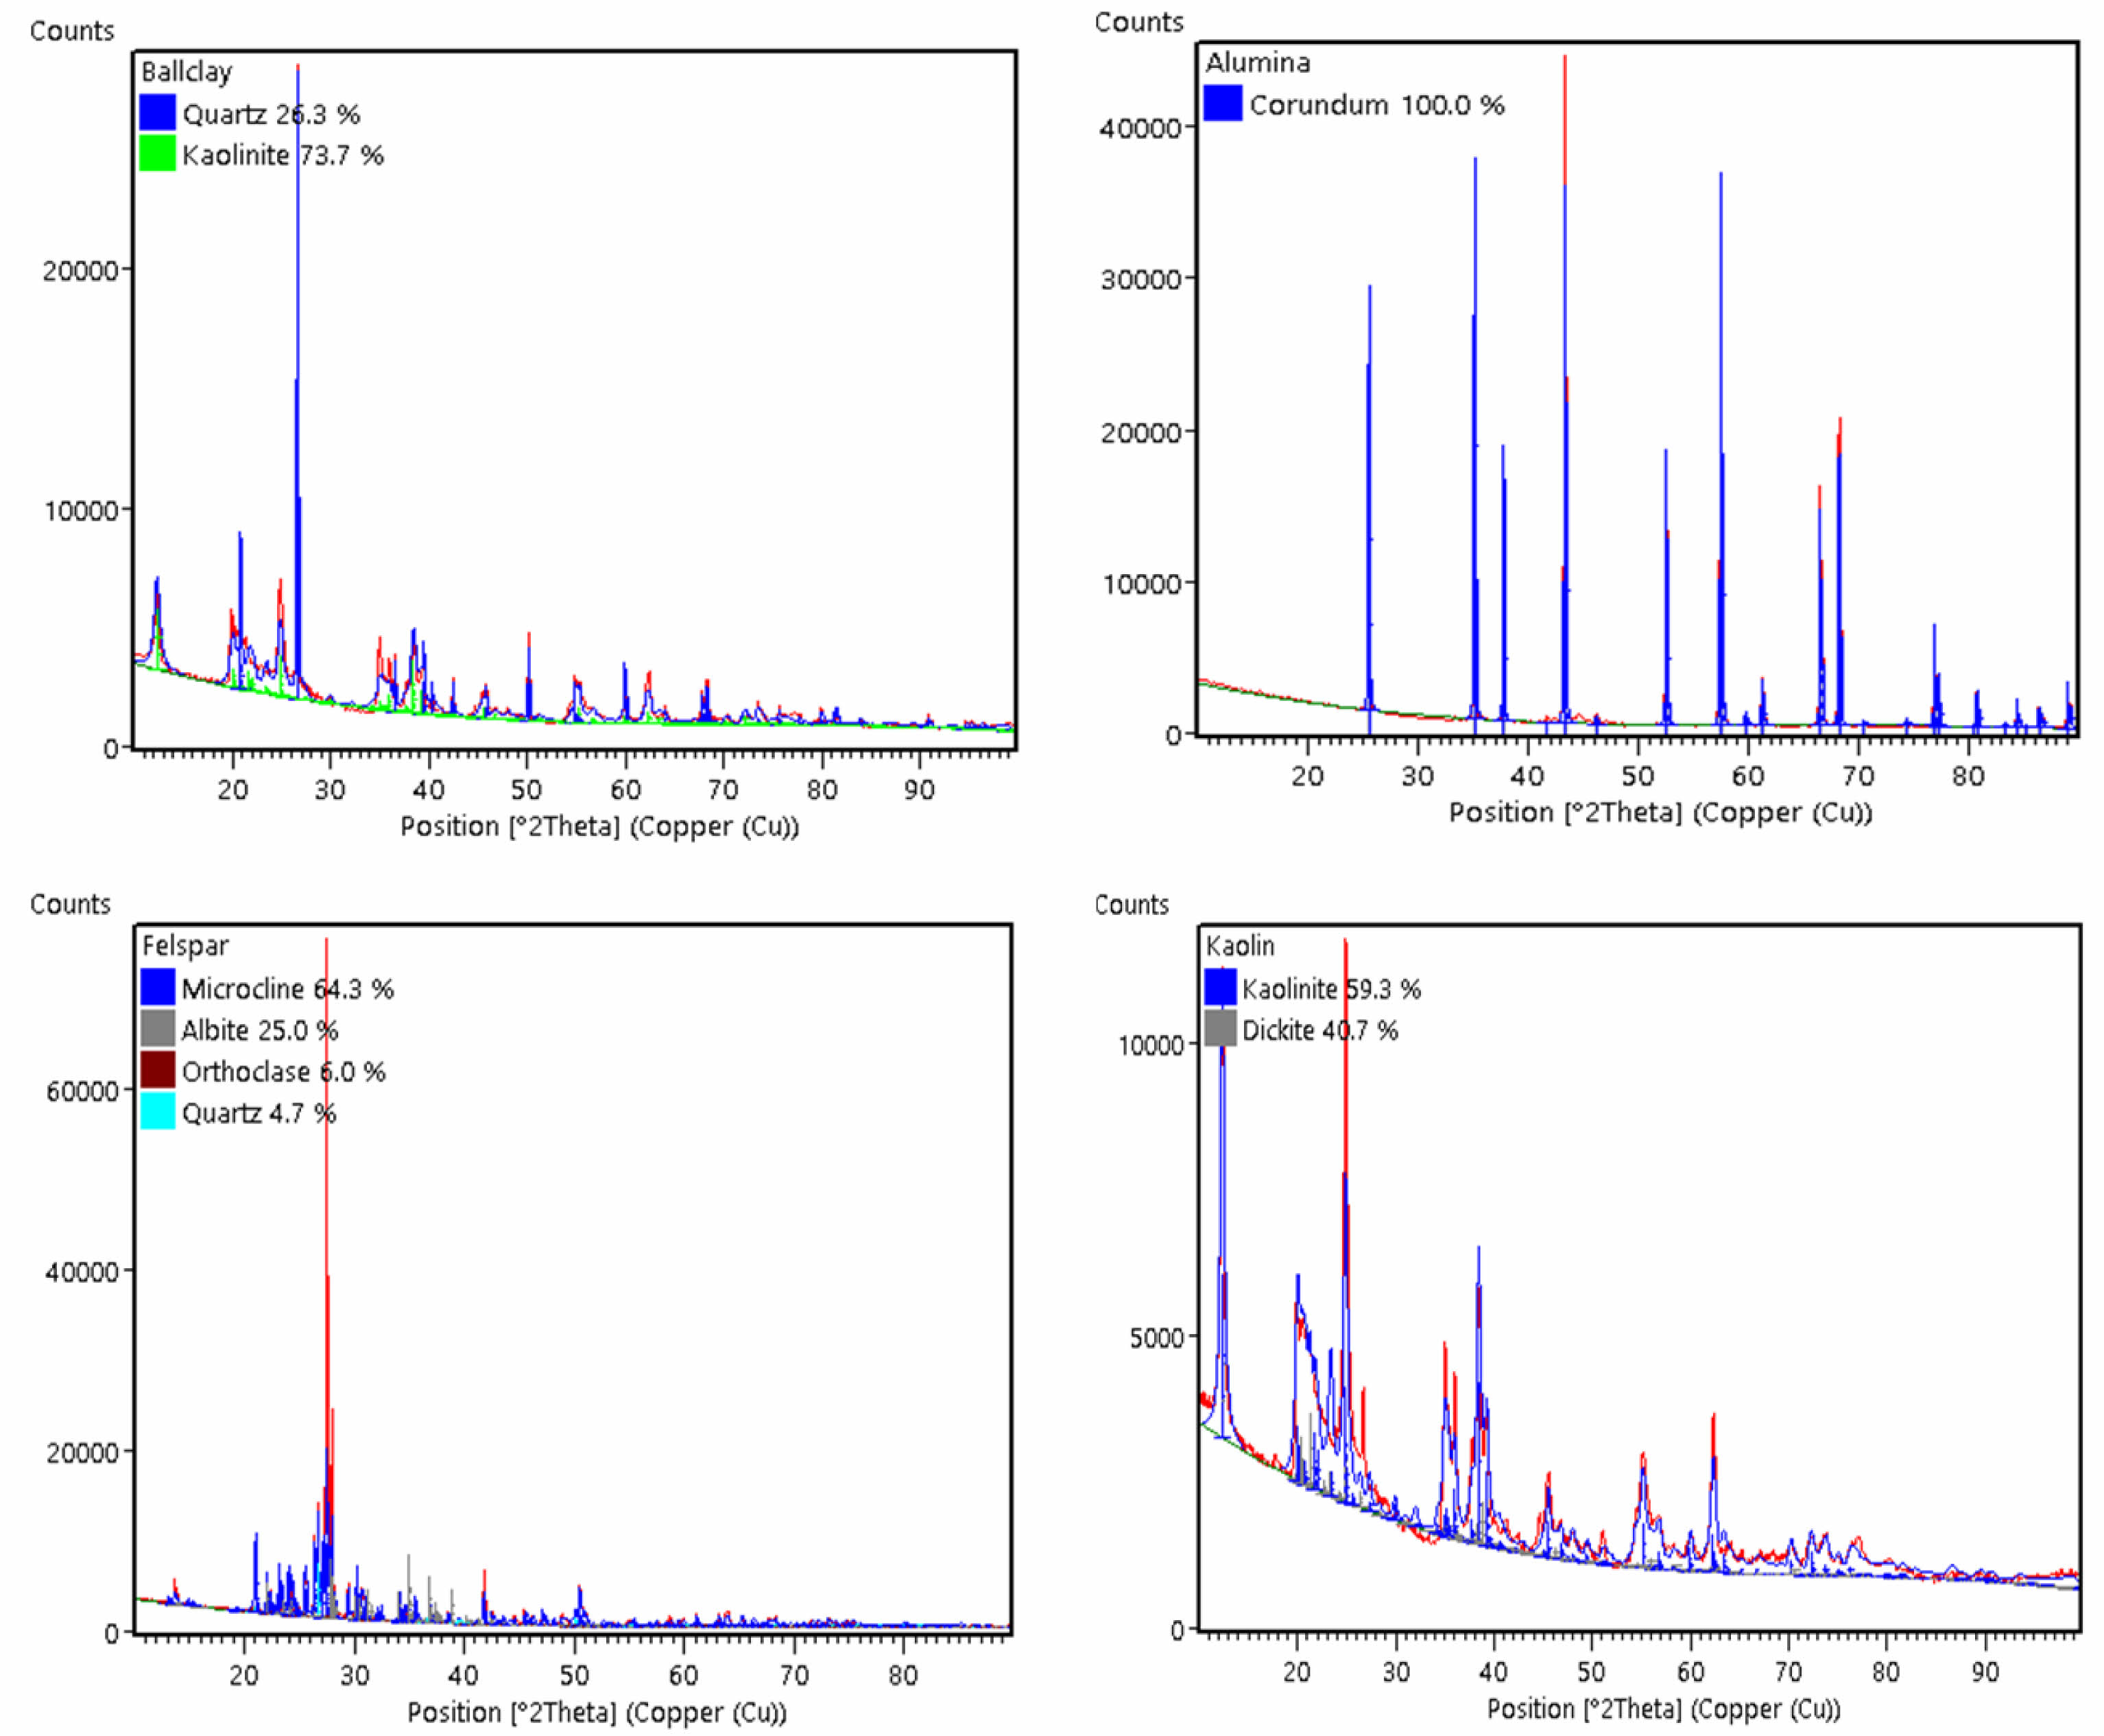
Analysis of data and followed by the presence of minor phases, namely quartz according to COD data #9009666 (Fig. 1a). The results of XRD analysis on alumina raw material show that the dominant phase is corundum which refers to the COD database #9007634 and there are no minor phases following it (Fig. 1b).
Analysis XRD pattern on feldspar raw material shows phase microcline dominant with intensity peak low diffraction according to the COD database #9004191 and one peak diffraction own high intensity that is orthoclase phase and other minor phases are albite and quartz (Fig. 1c). Analysis results There are XRD patterns on the raw kaolin material phase dominant namely kaolinite which matches the COD database #9014999 followed by minor phase, namely dickite, which is shown in Fig. 1d.
The analysis of X-ray diffraction (XRD) patterns is a critical method for determining the phase composition of ceramic materials, particularly in the context of kaolinite and its transformation into metakaolin and subsequently into mullite. The presence of kaolinite in raw materials is well-documented, and upon sintering, it undergoes a structural transformation to metakaolin, which is a precursor to mullite formation. This transformation is significant because mullite is a key phase that contributes to the mechanical and thermal properties of ceramic materials, making it a determining factor in their performance [17, 18]. The quantitative phase analysis of XRD patterns can be effectively performed using Rietveld refinement techniques, which allow for the extraction of detailed structural information from the diffraction data. This method provides insights into the relative proportions of different phases present in the sample, such as corundum and quartz, which can combine to form mullite when subjected to appropriate thermal treatments [19, 20]. The Rietveld refinement process involves fitting the observed diffraction pattern to a calculated pattern based on a proposed structural model, thereby yielding quantitative phase percentages and other crystallographic parameters [21]. Recent studies have highlighted the importance of these transformations and the role of mullite in enhancing the properties of ceramic materials. For instance, the work by Qin et al. emphasizes the significance of mullite in high-temperature applications due to its favorable properties such as low thermal expansion and high refractoriness [17]. Additionally, research by Mahņicka-Goremikina et al. discusses the modification of mullite ceramics for improved thermal insulation, further underscoring the material's versatility and importance in various applications [22].
Table 3 shows that percentage the phases owned by the raw material ball clay are dominated by kaolinite phase of 73.7% which will give contribution to phase meta kaolinite when sintered at temperatures above 1000 oC and followed with quartz phase, while the percentage of corundum contained in the raw material alumina by 100%, this corundum phase will increase quartz phase so that later will to form mullite phase [23]. This mullite phase will provide mechanical strength and insulating properties to ceramic composite samples [24]. For feldspar raw materials, the percentage of the dominant microcline phase is around 64.3% followed by the percentage of other minor phases such as albite of 25%, orthoclase of 6.0% and quartz of 4.7% while kaolin raw materials have a percentage of kaolinite phase of 59.3%. After the Rietveld refinement analysis, the crystallite size calculation was carried out on each raw material.
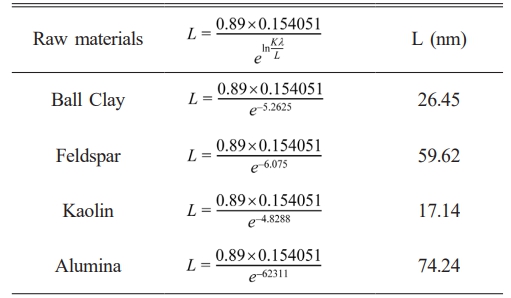
Analysis results XRD pattern is plotted graphically with use FWHM value and angle diffraction so that obtained linear equation y = mx + c (Fig. 2), value constant c is done substitution to equality exponential so that obtained mark size crystallites shown in Table 4. The results show that crystallite sizes in alumina raw materials are larger, around 74.24 nm, compared to other raw materials. This is because alumina has a single phase, consisting of 100% corundum, whereas the other raw materials are multiphase. The corundum phase in alumina contributes to the formation of the mullite phase when it interacts with the quartz phase present in other raw materials [25]. Next analysis structure crystals in raw materials are carried out rietveld refinement using highscore plus software was obtained Goodness of Fit (GOF) value. If the GOF value is obtained small show that the measured XRD data results will approaching the universal XRD database. The GOF value is obtained from the fitting process shown in the universal XRD database line with the XRD result line measurements that can be seen in Fig. 3.
GOF value obtained from results Reitveld refinement turns out to be raw material ball clay, alumina and kaolin own GOF value is almost the same range of 21.65 to 27.57 while the feldspar raw material has far GOF value bigger around 104.33 can be seen in Fig. 3. The GOF value is higher small the show universal conformity of XRD data to measurement XRD data almost approach appropriate and also shows that the raw material is single phase while the raw material feldspar shows multiphase. If the raw material has a single phase, it will be easier to composite with other materials [26].
Morphological Characteristics of Raw Materials
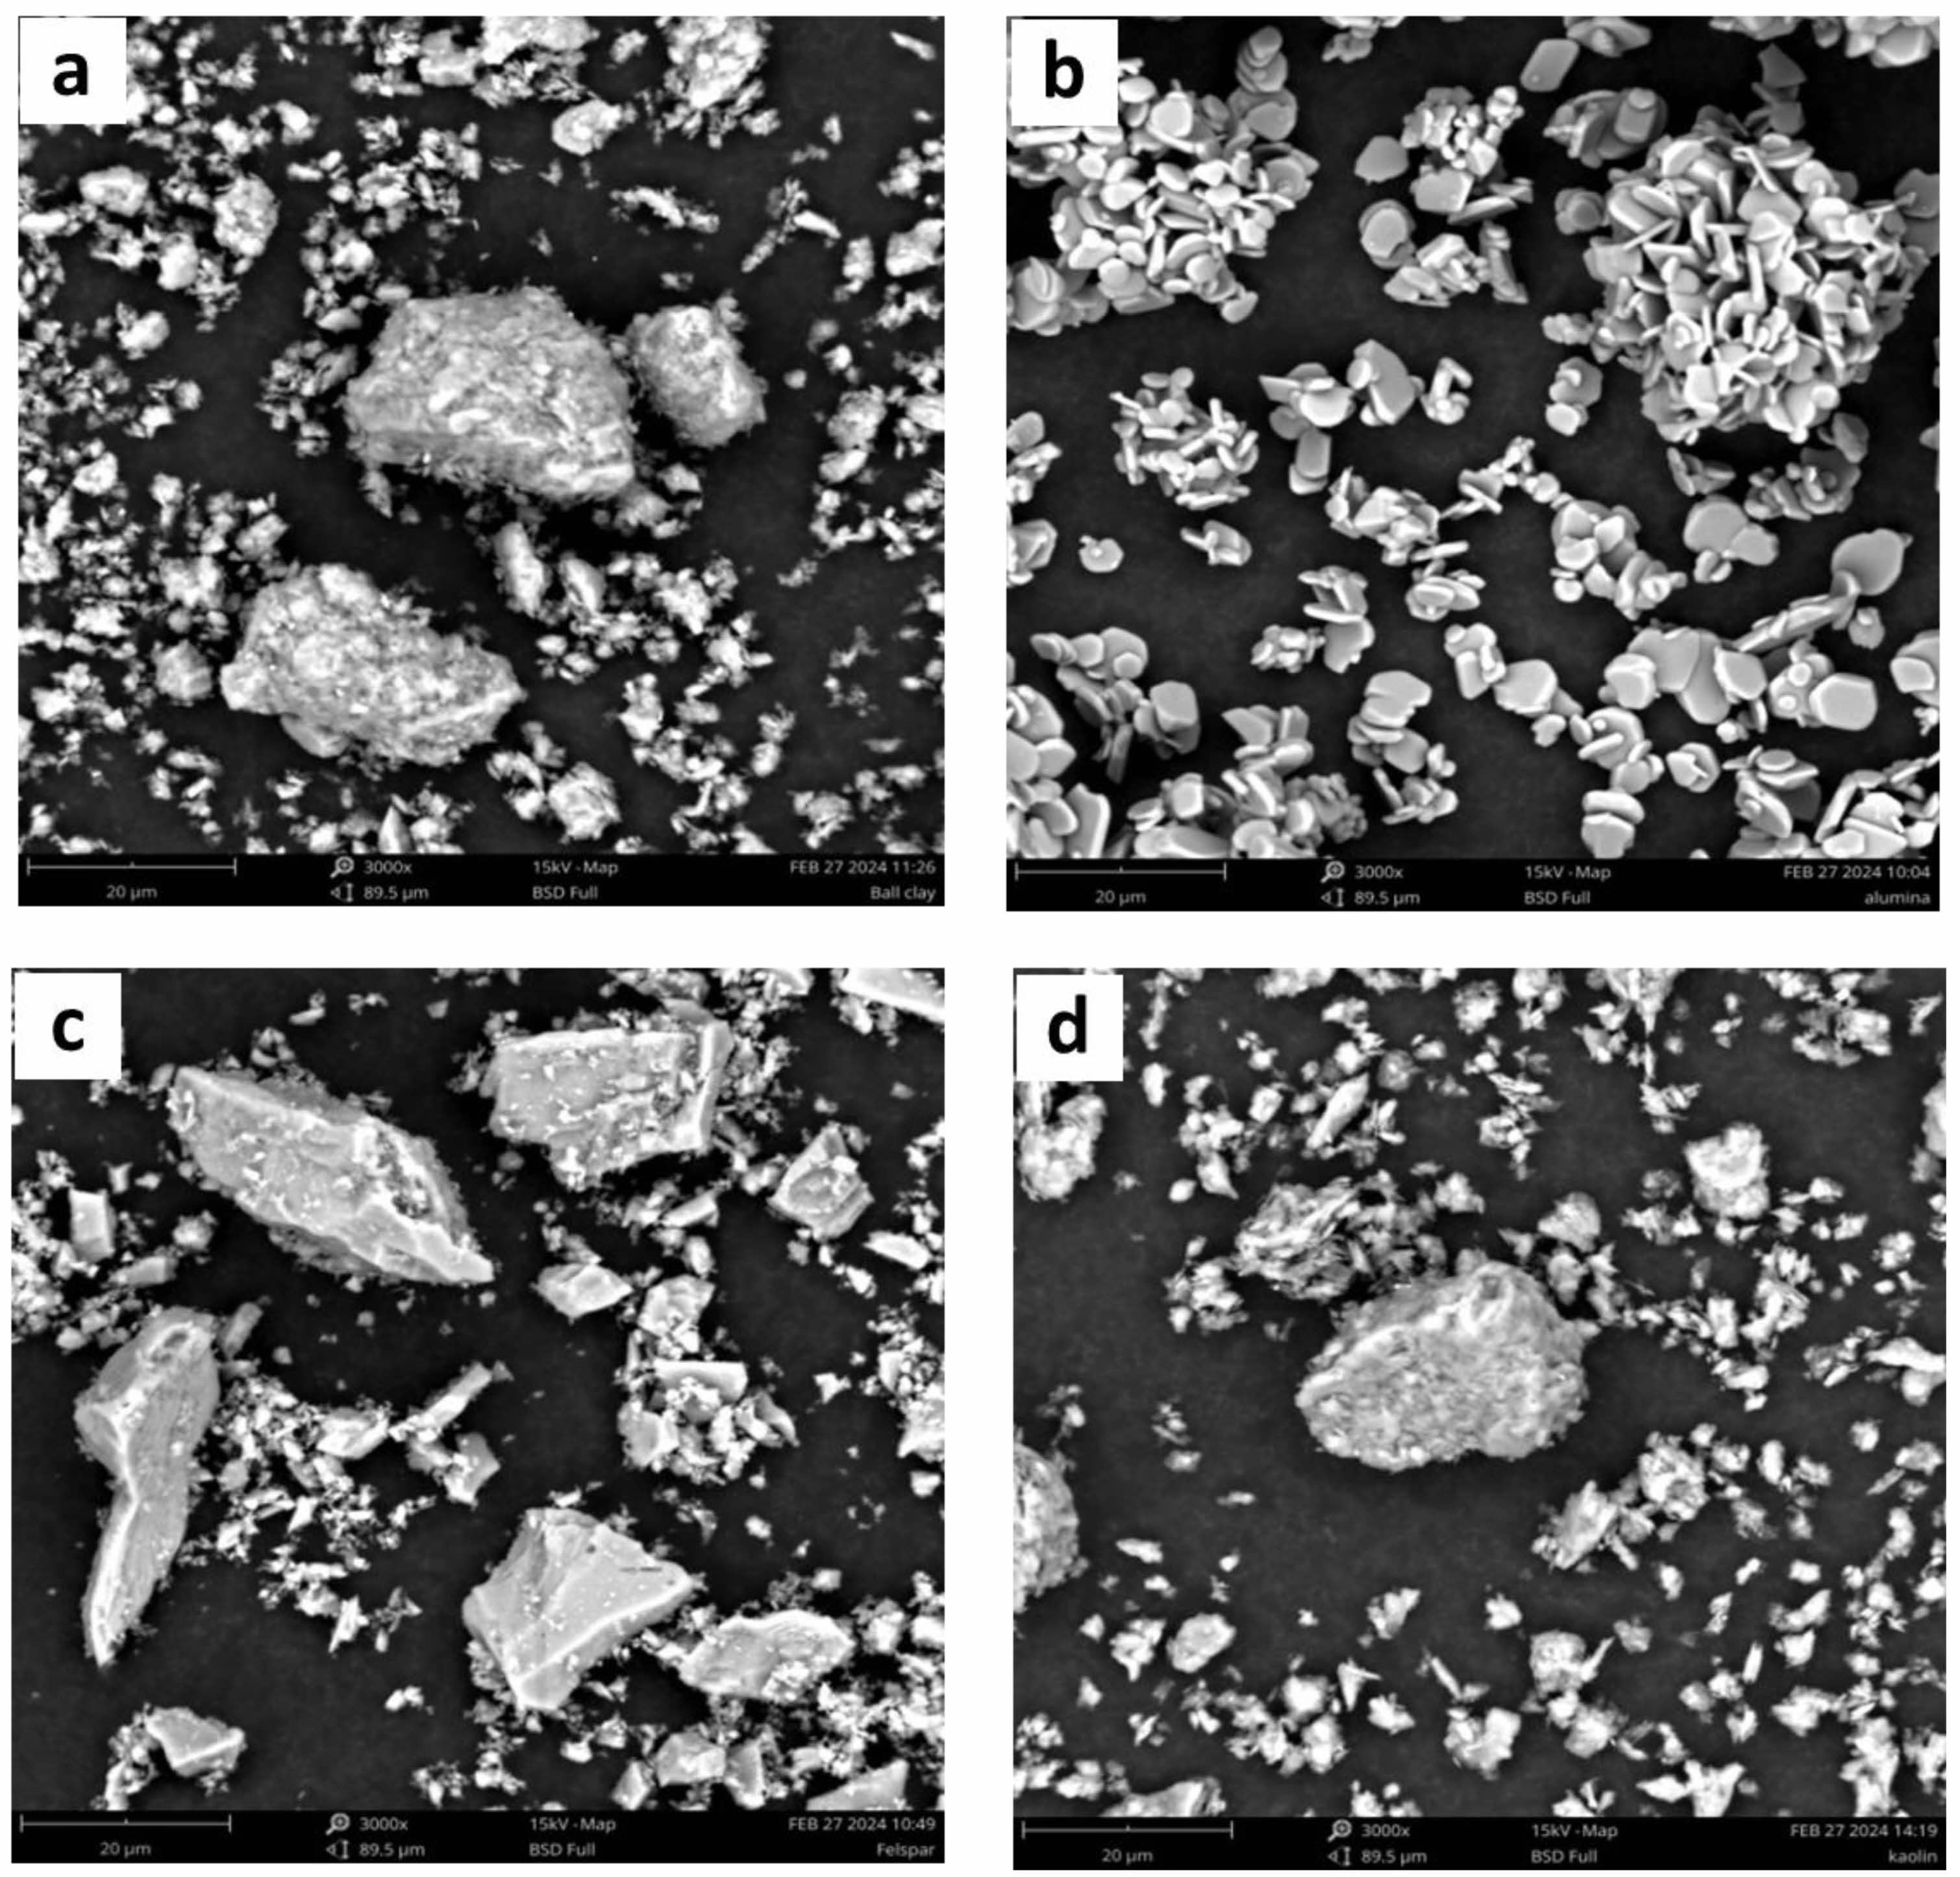
The results of the SEM characterization analysis show that the morphology of the raw material Ball Clay contains several large chunks due to the agglomeration of small chunks that pile up, the presence of several large chunks surrounded by small chunks indicates that the ball clay is not homogeneous, marked by the presence of a kaolinite phase followed by a quartz phase [27] (Fig. 4a). While the morphology of the raw material alumina contains flat coins in the form of uniform hexagonal crystals stacked on top of each other, this shows that the uniformity of the coins with the same size and uniformity of the corundum phase dominates and there are no other phases that follow it [28, 29] (Fig. 4b). The microstructure of the raw material feldspar has characteristics such as large chunks of rock surrounded by several small chunks that are not uniform because feldspar is a type of granite rock that has several phases including microcline, orthoclase, albite and quartz phases [30] (Fig. 4c). While in the raw kaolin material shows morphology in the form of small chunks that are evenly distributed but the presence of large chunks of rock is due to the agglomeration between the kaolinite and dickite phases that experience an interaction process with each other [27] (Fig. 4d). Furthermore, the SEM results were measured using ImageJ software to obtain qualitative data in the form of particle size in the raw material.
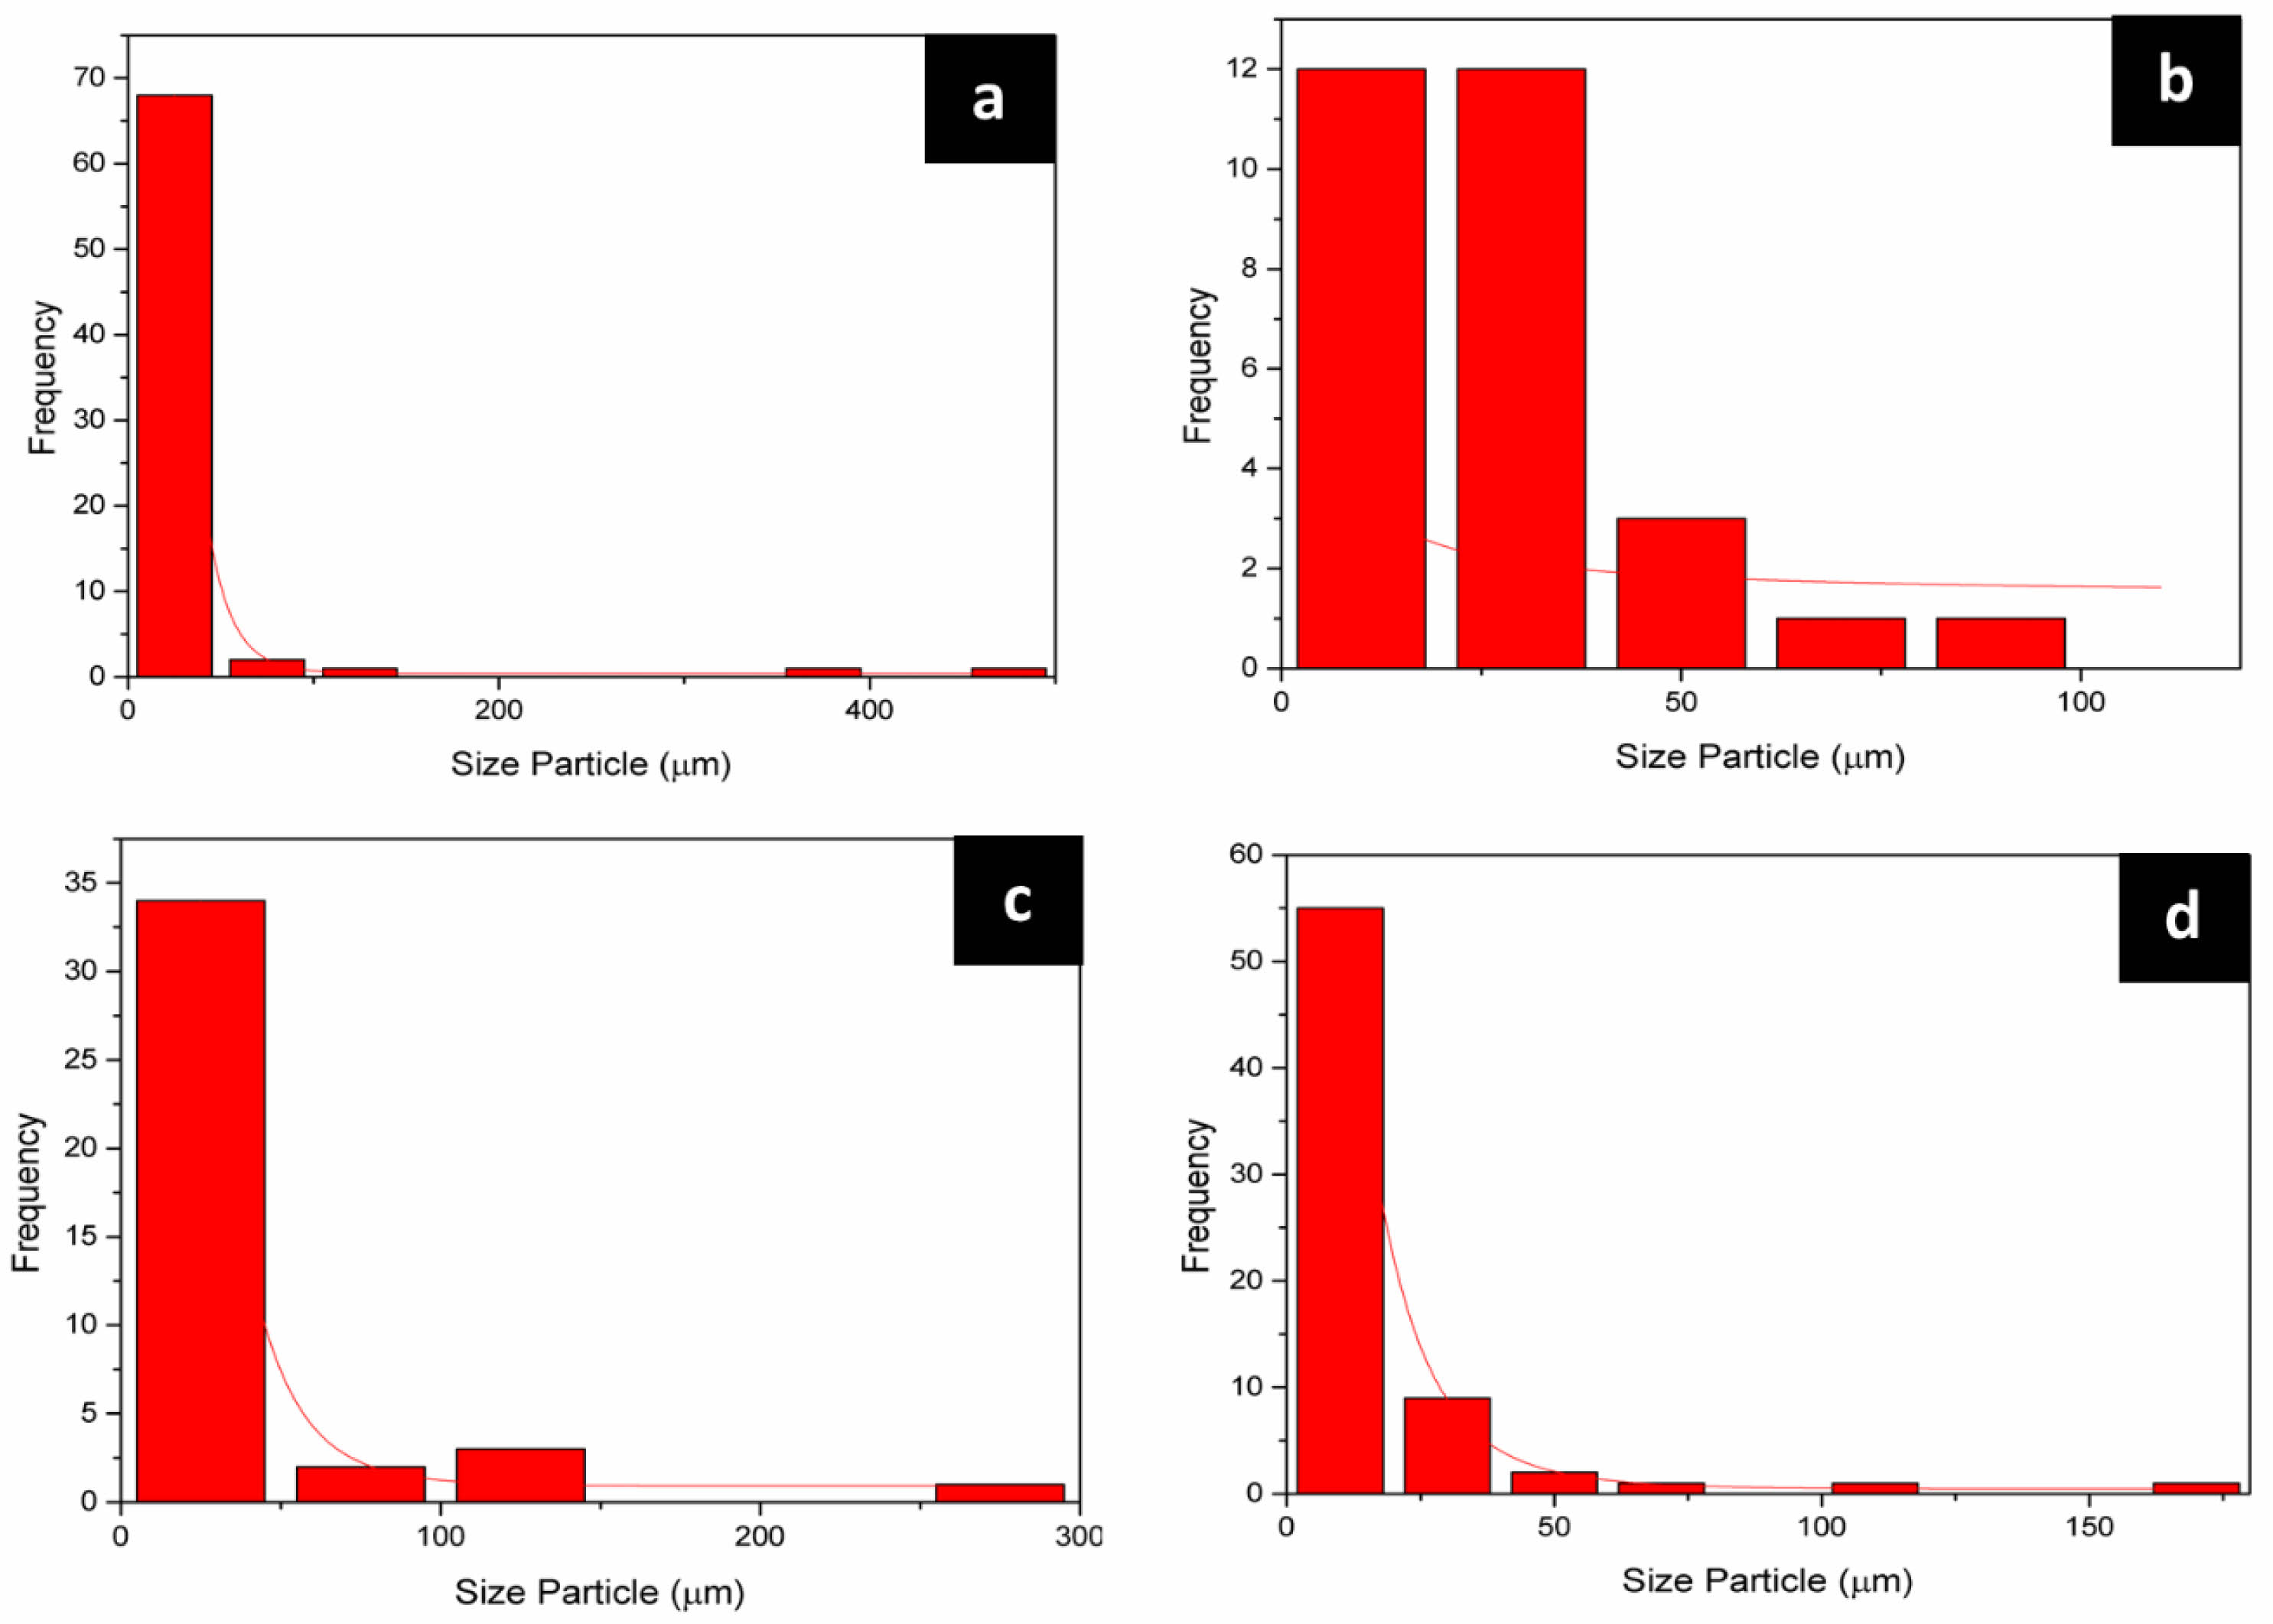
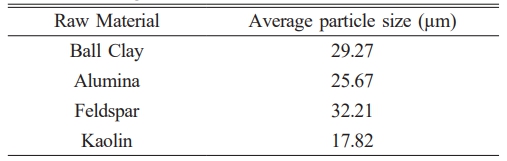
Analysis from SEM results are subject to calculation process size particle from picture SEM results on the raw material with using ImageJ software obtained the average particle size of the feldspar raw material is greater big about 32.21 µm can be seen in Table 5. This in accordance with feldspar morphology that has chunk rock granite with the size is still relatively small large, raw material ball clay has average particle size about 29.27 µm will but the average distribution of its particles. No homogeneous and raw kaolin material has size more particles small around 17.82 µm although distribution the particle No evenly. Subsequent statistical plotting reveals that the average particle distribution in the raw material shows alumina has a more homogeneous particle distribution compared to the others, as illustrated in Fig. 5.
Characteristics Ceramic Composite Crystal Structure
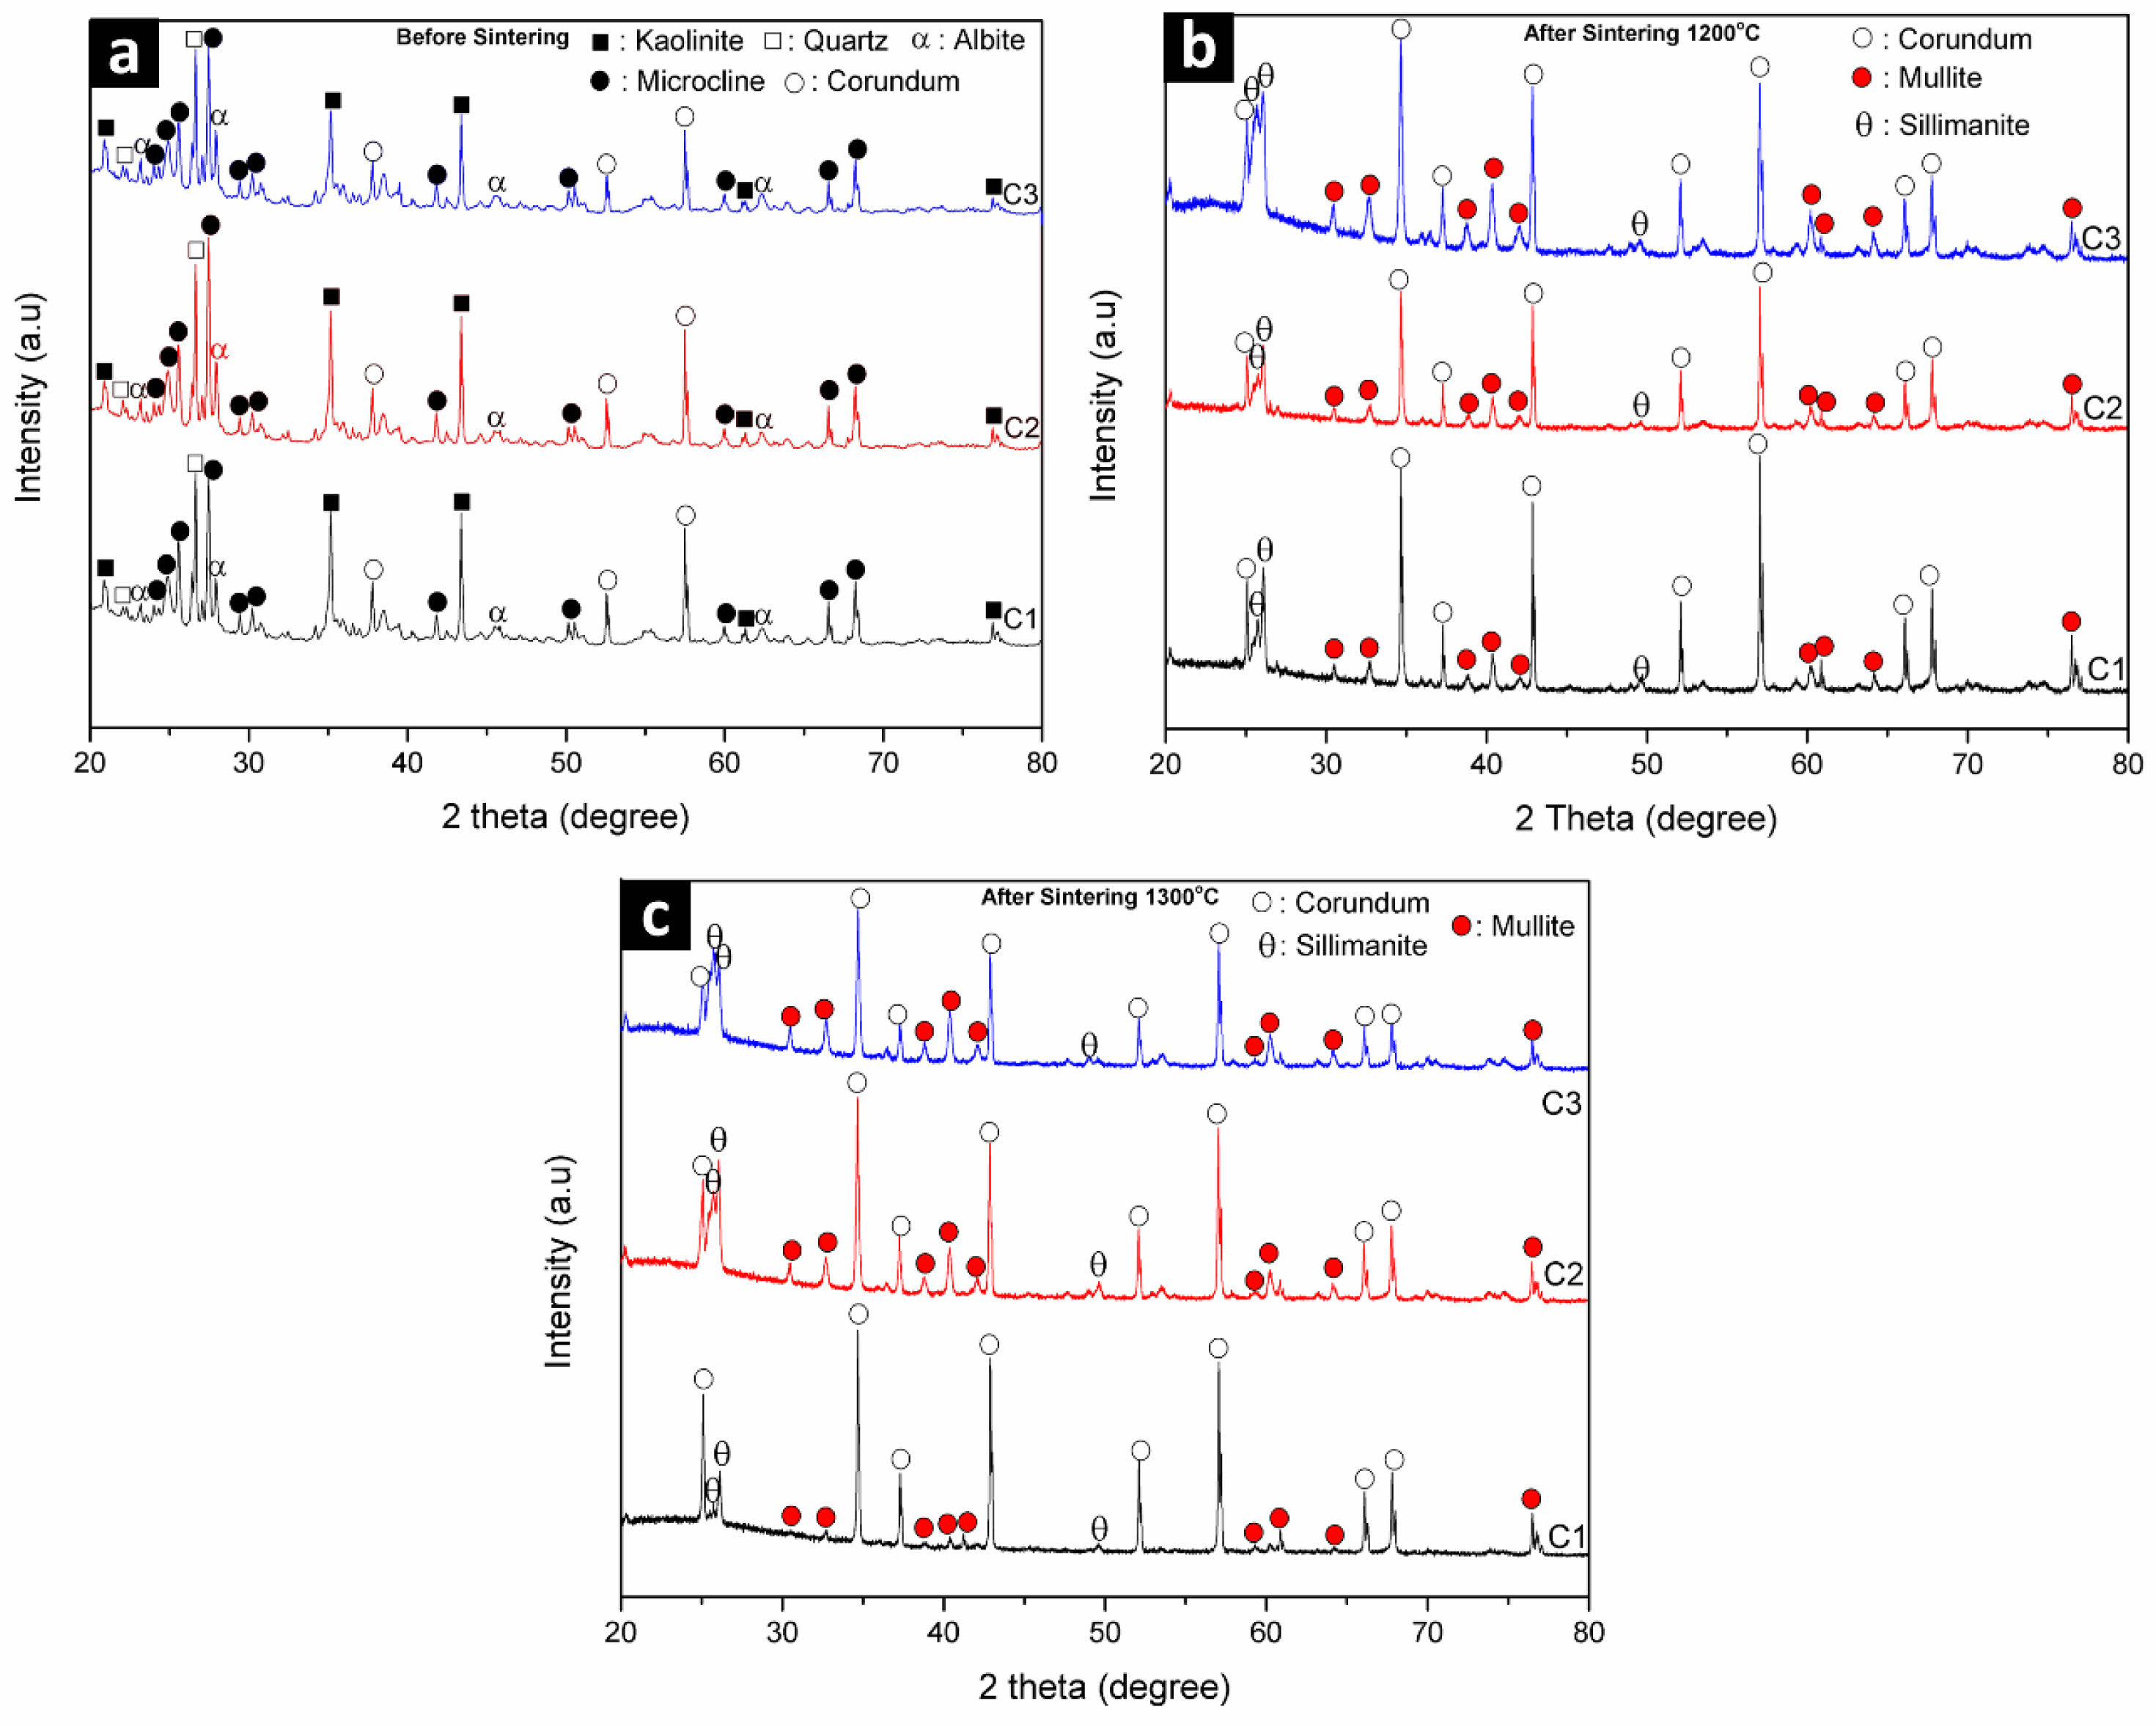
The XRD pattern analysis of the ceramic composite material before sintering reveals predominant kaolinite and microcline phases, along with minor phases of corundum, albite, and quartz, as shown in Fig. 6a. The kaolinite phase that appears in the ceramic composite from material raw ball clay and microcline, albite, and quartz phases appeared in the XRD results of ceramic composites from material feldspar raw material while corundum phase appears from material alumina raw material. After the sintering process at 1200 oC and 1300 oC, only the diffraction peak for the corundum phase appears, while the diffraction peak for the kaolinite phase is absent. This is due to the process of transformation of the kaolinite phase into the amorphous metakaolin phase until sintering at 1200 oC and 1300 oC the formation of the mullite crystal phase can be seen in Fig. 6b [31]. The emergence of a new diffraction peak above sintering at 1200 oC is the formation of a new crystal phase called primary mullite and the emergence of a new sillimanite phase [32]. When the sintering temperature is 1300 oC, it shows that the microcline, albite, and quartz phases disappear, on the other hand the diffraction peak of the mullite phase increases followed by the quartz phase when sintered at high temperatures it will react with the corundum phase which forms the aluminosilicate phase and includes the sillimanite phase, this sintering process creates conditions that allow a new sillimanite phase to form in the ceramic composite can be seen in Fig. 6c [33]. This result is consistent with previous results that mullite was not visible or formed at temperature below 1,200 oC [34] and will start to form significantly at temperatures above 1200 °C [7, 35], as evidenced by the appearance of characteristic mullite peaks with diffraction angles (2θ) around 16.4°, 26°, and 40.8°. Therefore, it can be concluded that increasing the sintering temperature enhances the intensity of the mullite peaks.
Analysis results XRD pattern shows that improvement sintering temperature of before sintering until sintering temperature 1300 oC will experience improvement size crystallites in ceramic composites C1, C2 and C3 which can be seen in table 6 [36], where size crystallites in ceramic composite C1 before sintering until sintering temperature 1300 oC from 40.92 to 70.24 nm and an increase size crystallites in the C2 ceramic composite from 51.45 to 73.33 and the C3 ceramic composite also experienced improvement from 56.07 to 75.88 nm. So, the sintering effect on the ceramic composite will give improvement size crystallite, this is because of existence growth crystallinity in the phase mullite formed at a sintering temperature of 1300 oC [37]. At sintering temperature of 1300 oC the bond alumina chemistry (Al2O3) in corundum and silica (SiO2) phases in the quartz phase will to form bond new become mullite phase which has greater crystallinity tall [36].
Characteristics Morphology Ceramic Composite
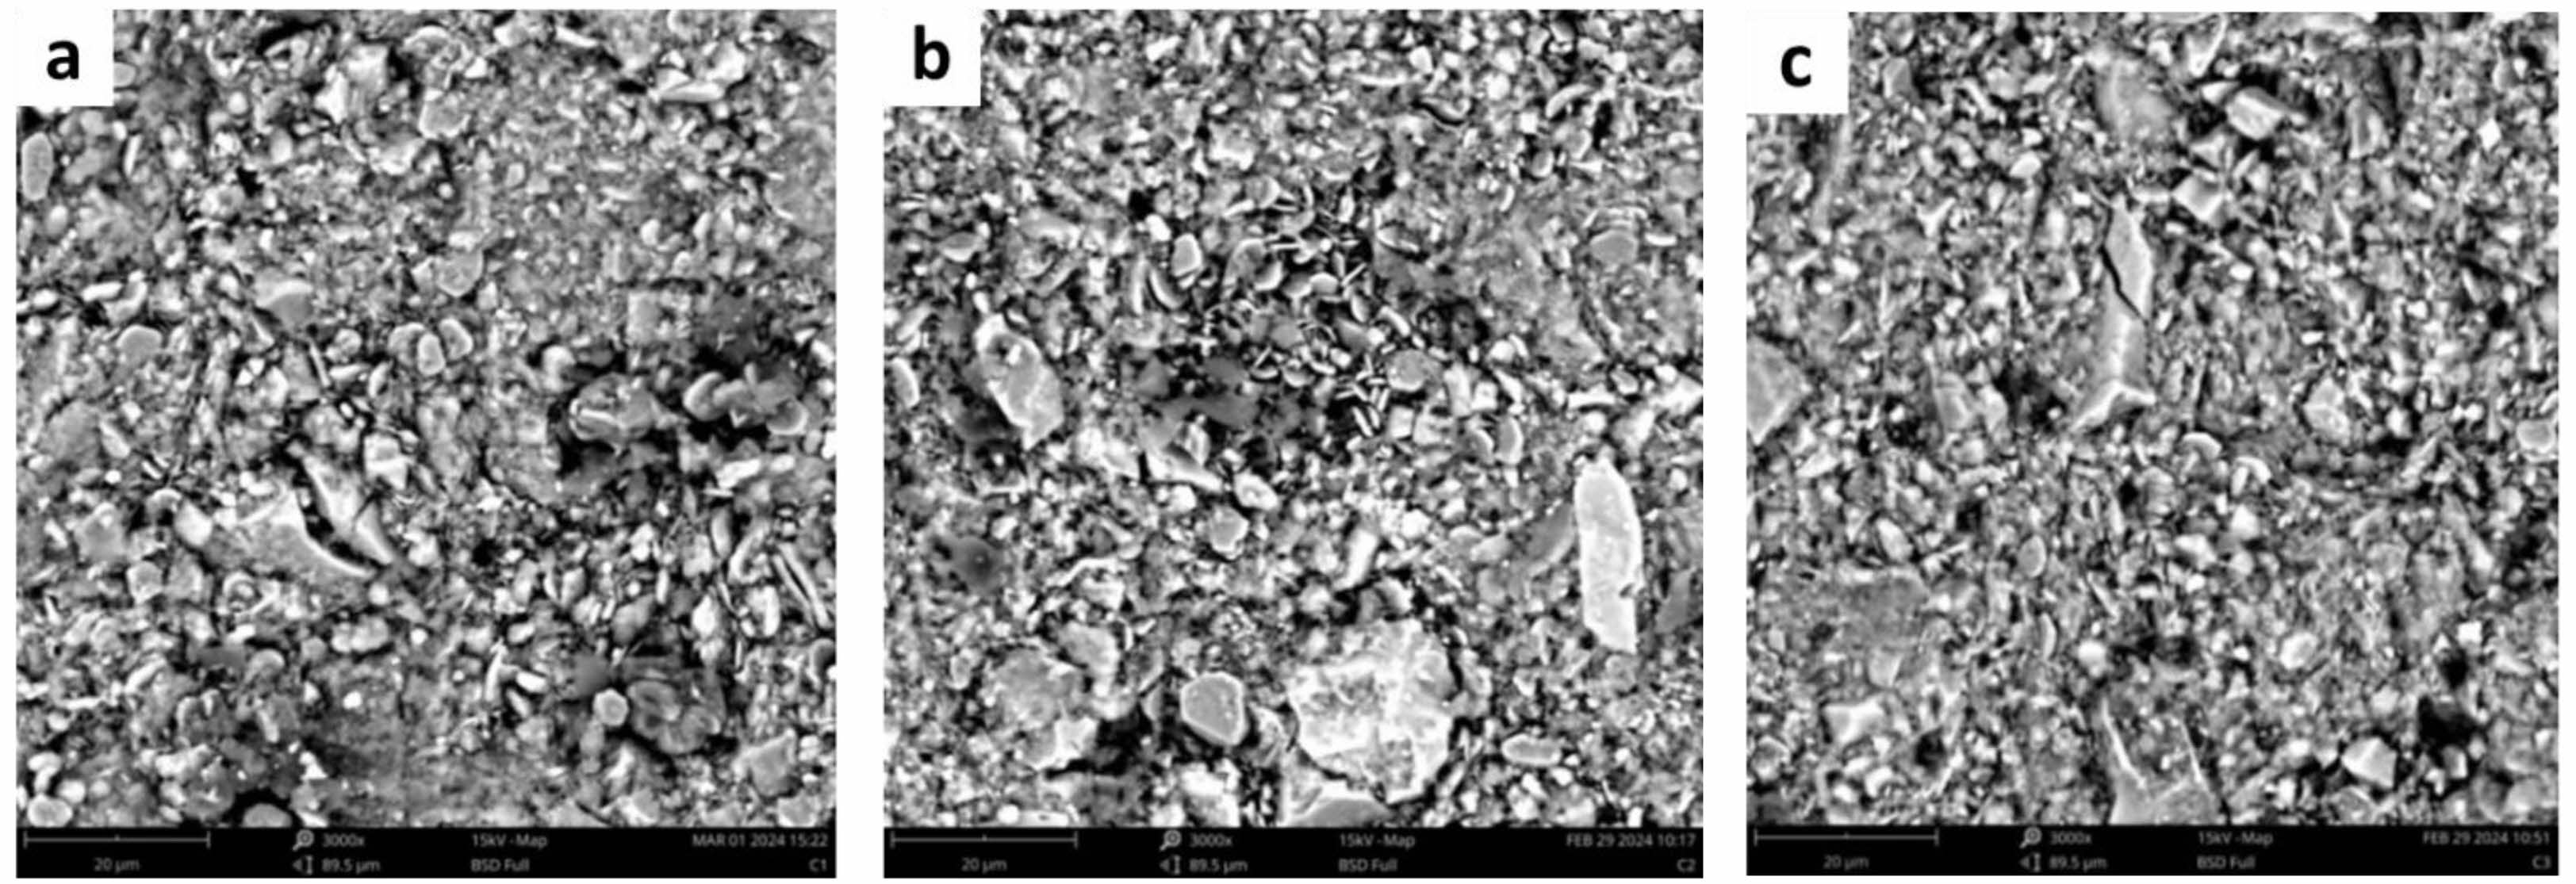
The ceramic composite, composed of ball clay, feldspar, alumina, and kaolin with various compositional variations, exhibits diverse morphological characteristics. In composite C1, the alumina has a flat, coin-like morphology that is evenly distributed and overlaps with itself, indicating the presence of the corundum phase [38]. Feldspar appears as larger rock-like structures broken into smaller fragments, suggesting the presence of kaolinite and microcline phases [27]. Ball clay is observed in small, evenly dispersed rock-like chunks, while kaolin exhibits interlocking, rock-like particles overlapping one another, indicating the presence of the quartz phase, as shown in Fig. 7a [39]. Whereas the morphology shown in the C2 ceramic composite shows morphology of ball clay in big rock visible and surrounded existence coin flat that is morphology dispersed corundum phase evenly distributed and the feldspar morphology also coincides with the morphology of alumina shown in Fig. 7b. For C3 ceramic composite with variation more kaolin composite dominant so that kaolin morphology is more seen with existence big chunk of rock each other overlapping which shows existence the dominant quartz phase can be seen in Fig. 7c [40]. Variations in ceramic composite composition, with added alumina, enhance hardness and thermal durability. However, excessive alumina content can make the composite brittle, limiting alumina variation to around 20%. Feldspar contributes to plasticity and inter-grain bonding, while broader variation in kaolin content supports the formation of the desired crystalline phases, specifically promoting the development of the mullite phase [41].
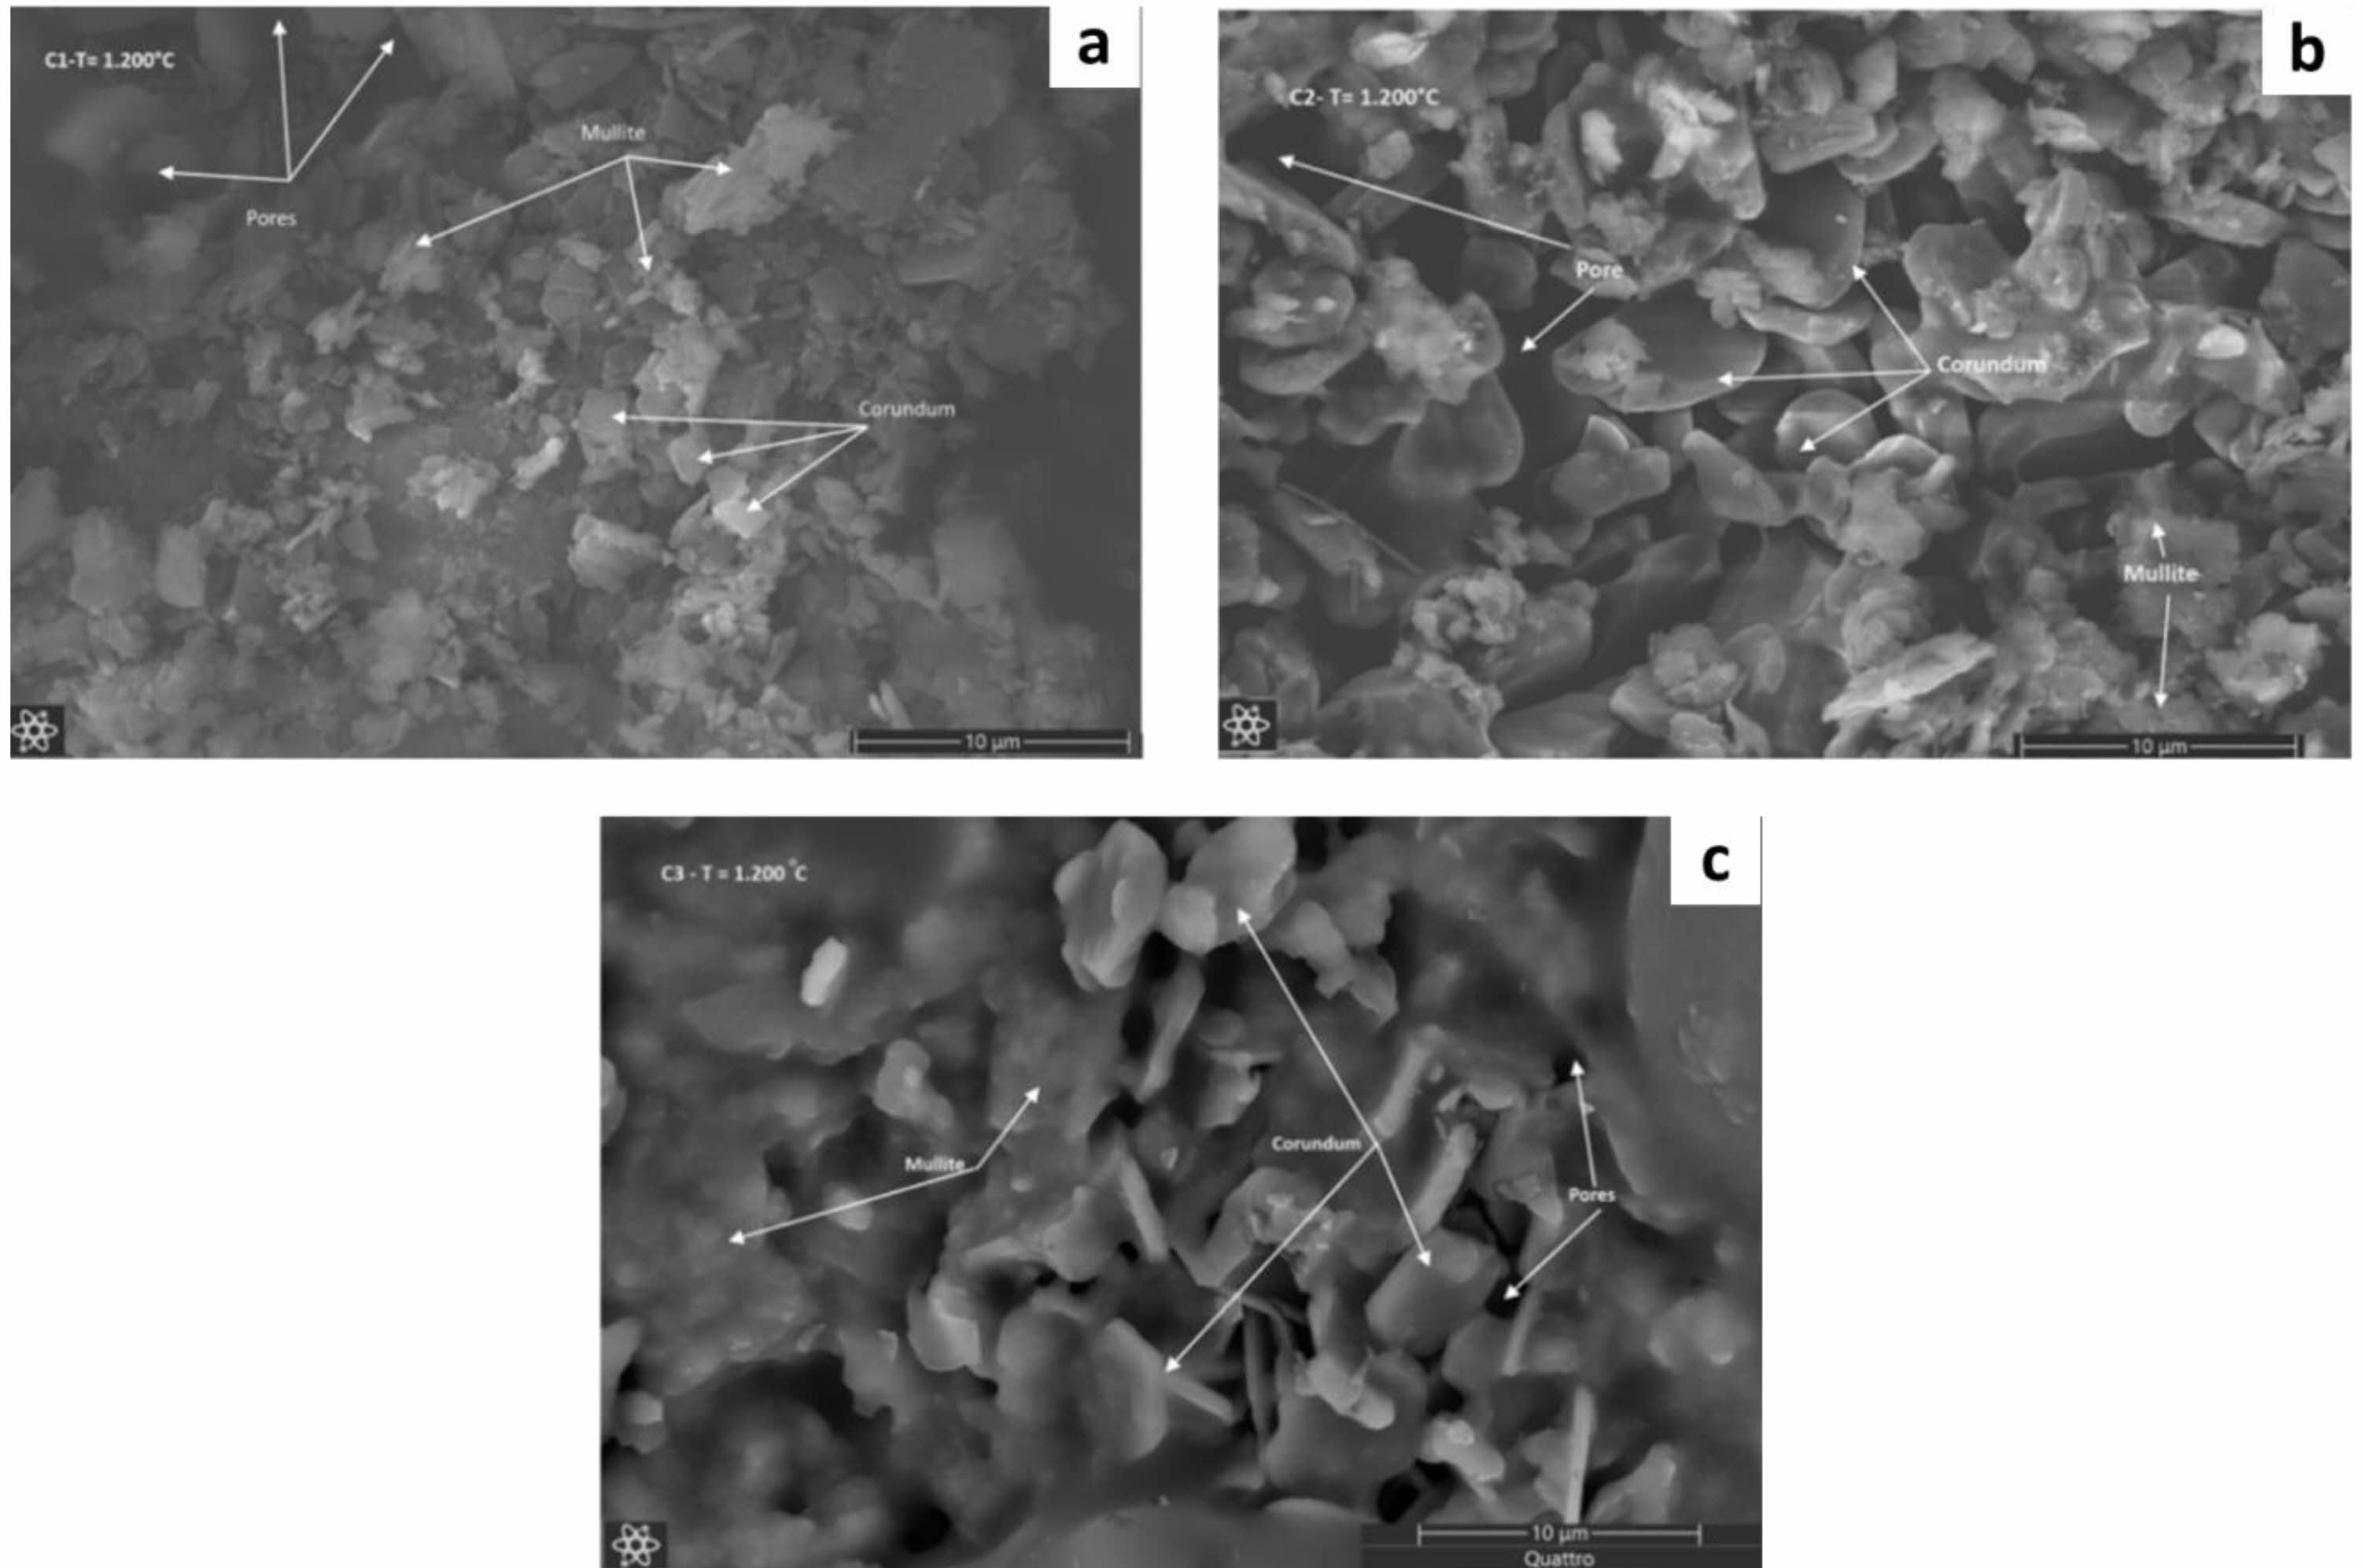
After the sintering process at a temperature of 1200 oC, the morphology of the ceramic composite has a significant morphological change, namely the change in the morphology of alumina and kaolin occurs more unified, it can be seen that the morphology of the corundum and quartz phases becomes the morphology of the mullite phase which is indicated by the morphology of the stacked rods can be seen in Fig. 8a [36]. Fig. 8a also shows the morphology of the corundum phase which is evenly distributed and also the formation of the morphology of the pores. The presence of the porosity that is formed will provide the strength and resistance of the ceramic to mechanical damage [42]. Fig. 8b clearly shows the rock chunks showing a uniform corundum phase. The morphology of the corundum phase above it has the morphology of collections of rod fibers, namely the morphology of mullite and there are also pores [43]. While Fig. 8c also shows the morphology of mullite above the morphology of corundum which is evenly and uniformly distributed and there are pores [44].
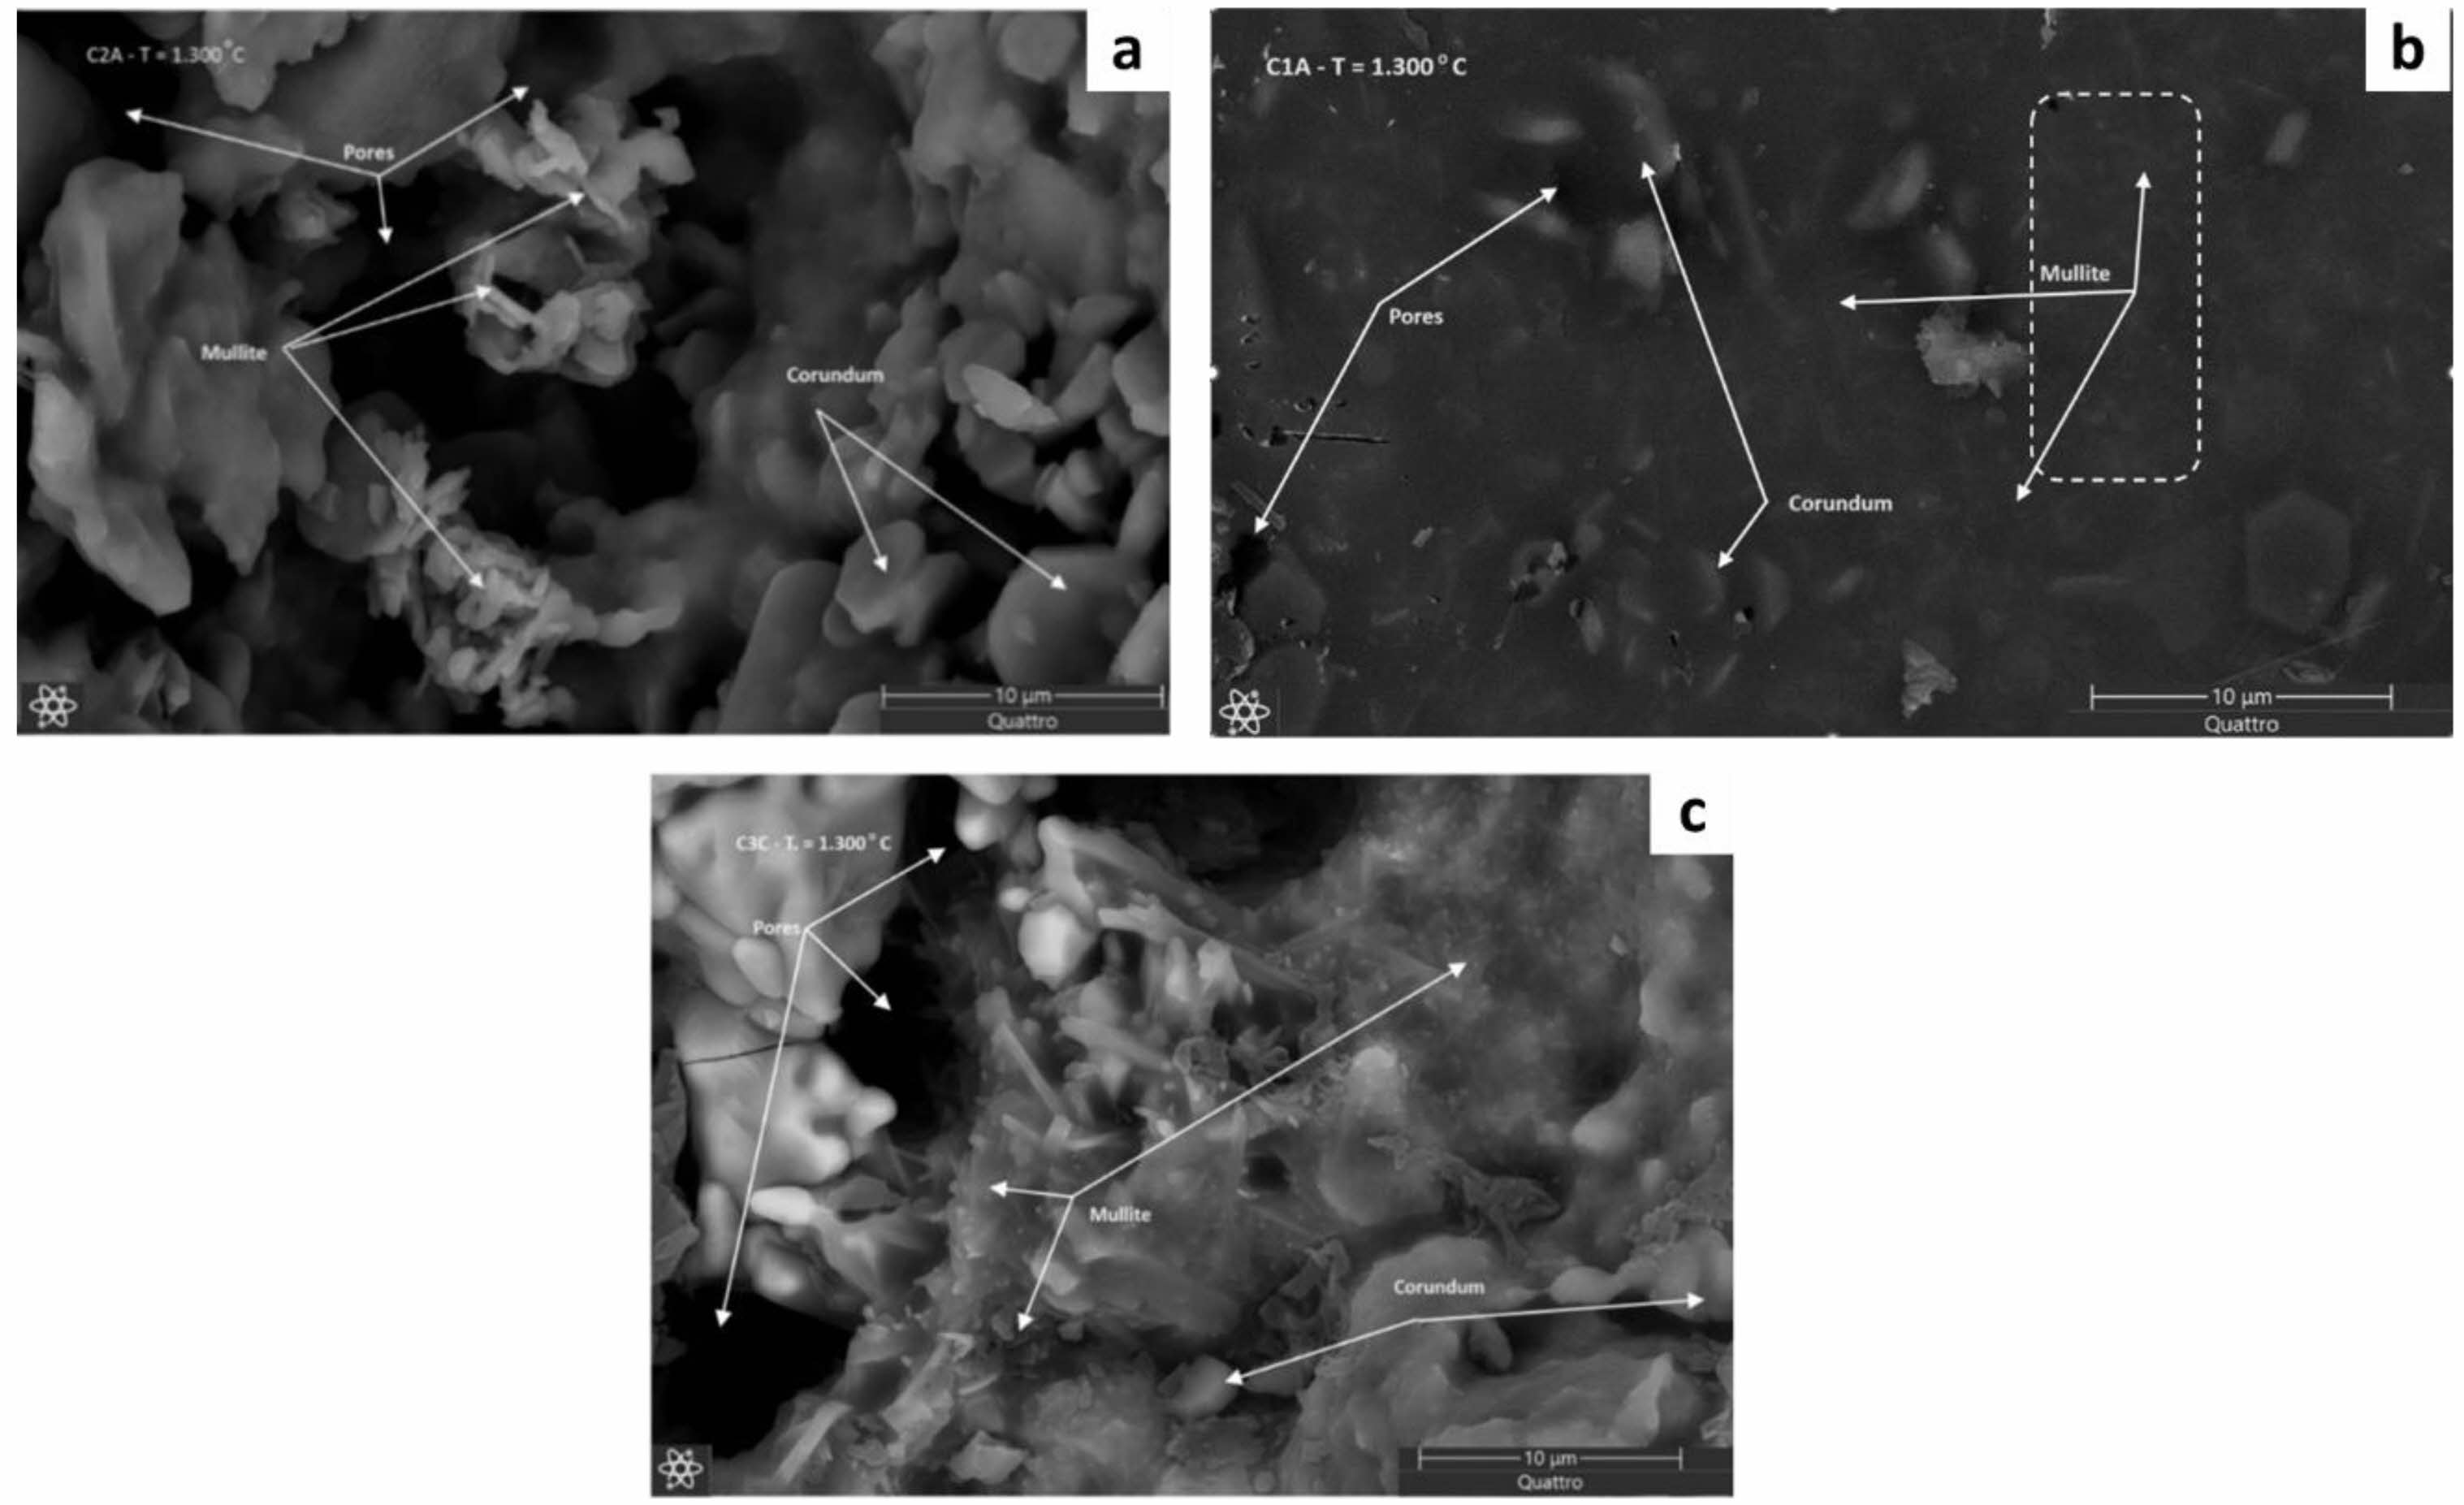
The increase in temperature in the sintering process up to 1300 oC will provide a change in the morphology of corundum that appears to be tucked inside the shaft and the morphology of the fibers in the form of mullite phase in the ceramic composite C1 can be seen in Fig. 9a [18]. While the ceramic composite C2 clearly shows the morphology of flat plates, namely the morphology of corundum that is evenly distributed and homogeneous and there are clumps of rods which are mullite morphology can be seen in Fig. 9b [45]. While in the ceramic composite C3, the morphology of mullite rods is clearly visible, stacked on top of each other and covered with corundum morphology and there is a shaft in the morphology of the ceramic composite C3 shown in Fig. 9c [18]. The increase in sintering temperature will provide a phase change so that the mullite phase appears with the morphology of rods that have integrity and the shaft is also formed quite clearly so as to provide stable and strong mechanical properties [45].
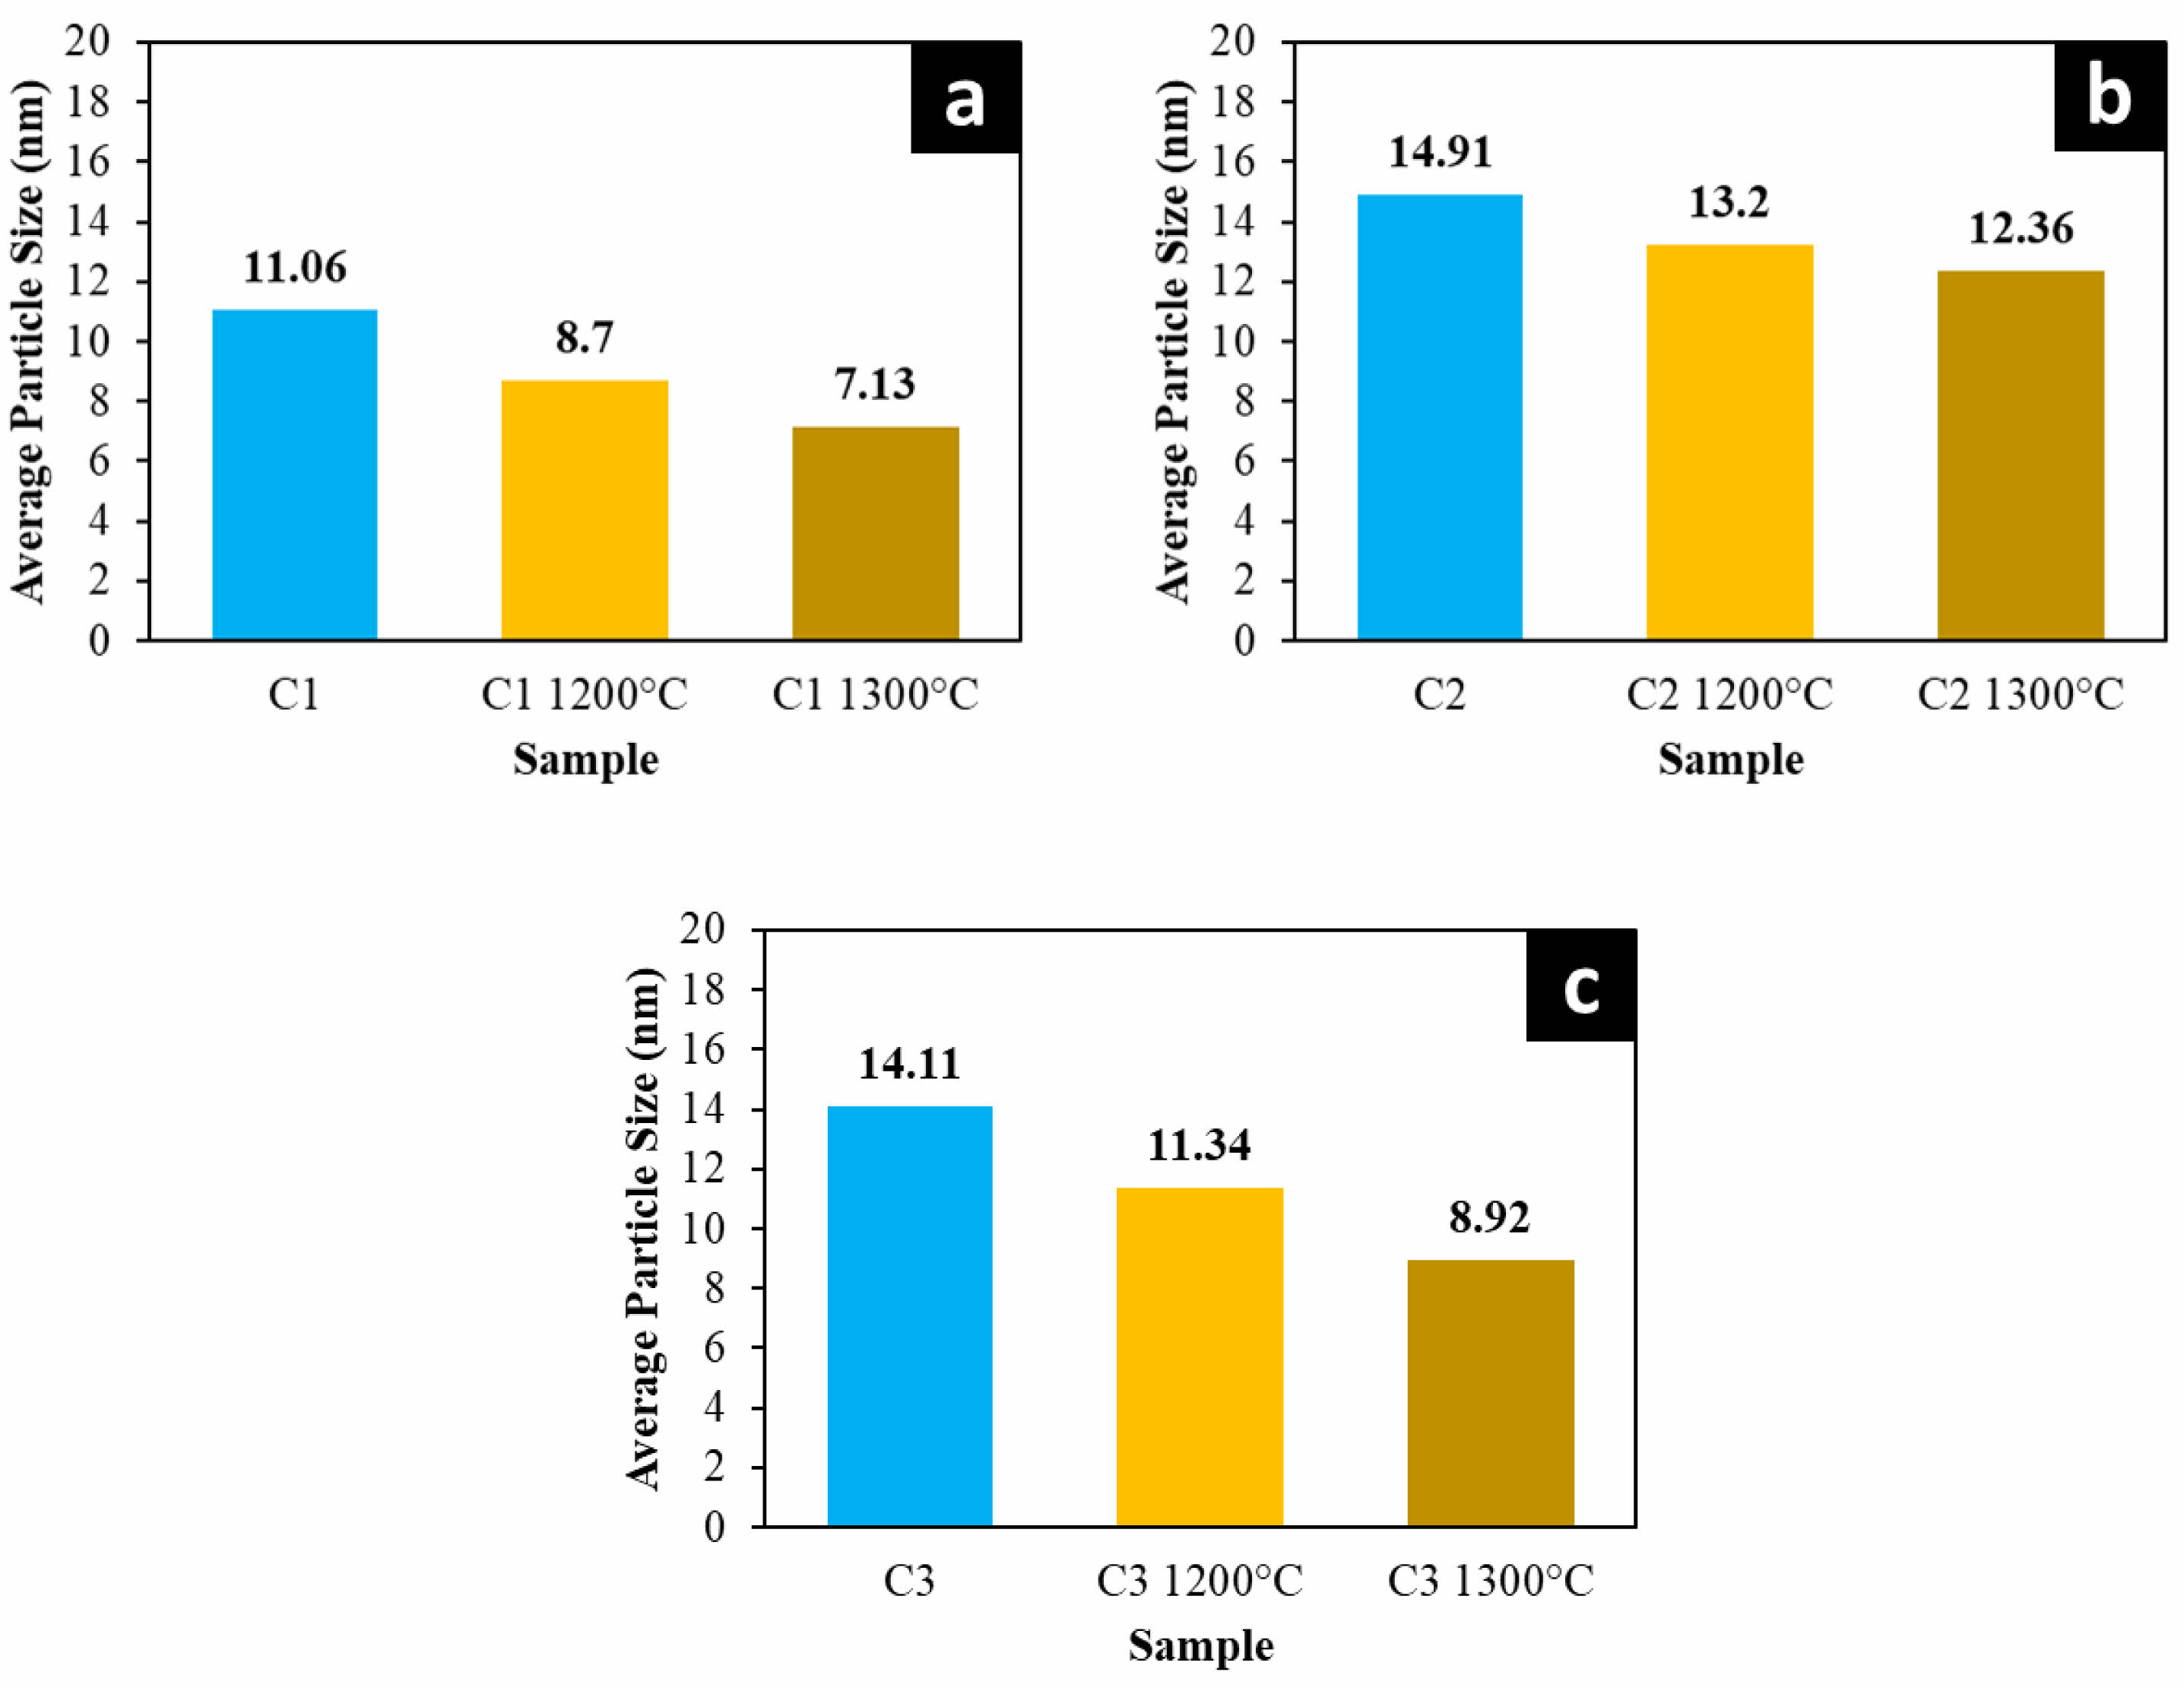
The results of particle measurements on ceramic composites using ImageJ showed that increasing the sintering temperature to 1300 oC on ceramic composite C1 decreased the average particle size from 11.06 to 7.13 as seen in Fig. 10a. Increasing the sintering temperature will provide a de-aggregation process or separation of aggregated particles that occur so that it helps break the particle aggregates and will provide particle interactions that cause previously combined particles to break into smaller sizes [36]. Fig. 10b illustrates that the ceramic composite C2 shows a reduction in average particle size from 14.91 nm to 12.36 nm as the sintering temperature increases. This rise in sintering temperature promotes the formation of the mullite phase and leads to an uneven compaction process, resulting in smaller particle sizes [43]. Similarly, as shown in Fig. 10c, the ceramic composite material C3 experiences a decrease in average particle size from 14.11 nm to 8.92 nm. This reduction is attributed to the presence of a fully developed mullite phase, which causes structural shifts and uneven compaction [7]. This shows that an increase in the sintering temperature of the composite material will provide morphological changes and the formation of a new phase, namely mullite, will cause a decrease in the average particle size [46].
Mechanical Properties Characteristics of Ceramic Composites
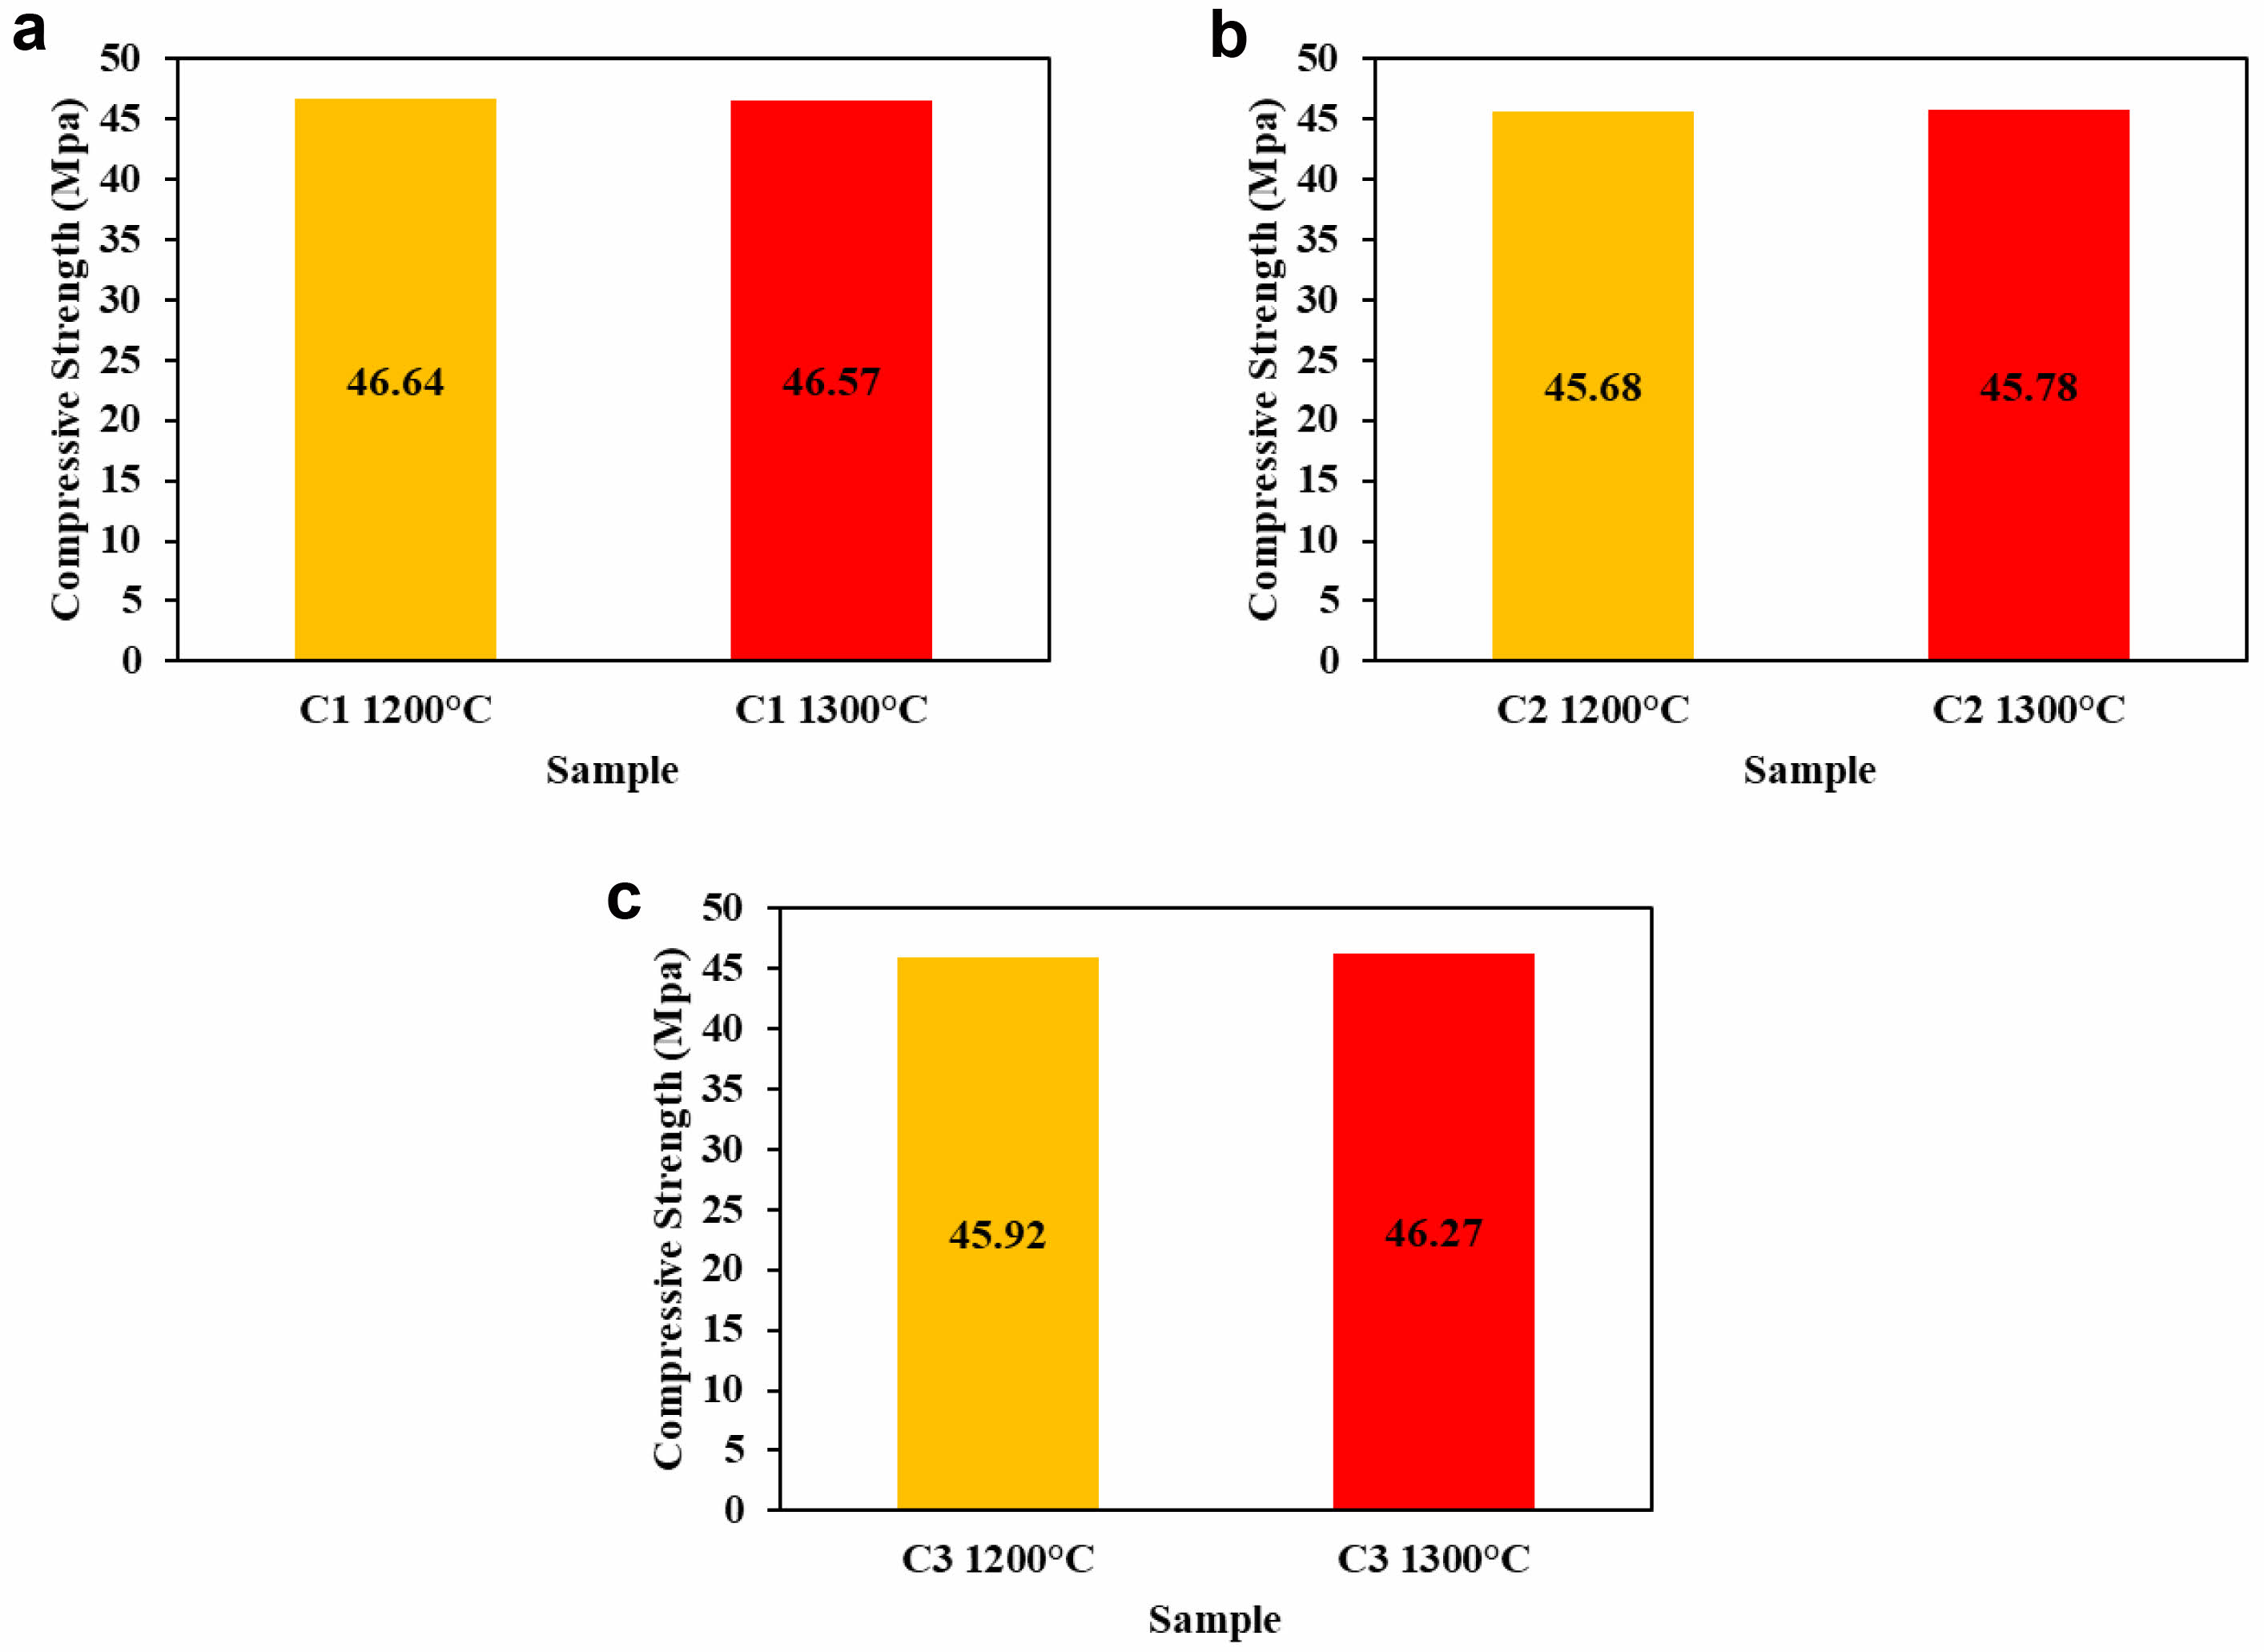
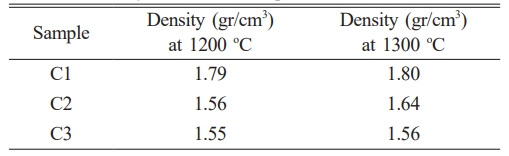
The mechanical properties of the ceramic composite sample C1 were tested for compressive strength, and it was found that increasing the sintering temperature caused the ceramic particles to bond more effectively, reducing porosity and cavities within the material. As porosity decreases, the particle density increases, resulting in a higher density value, from 1.79 to 1.80 g/cm³, which in turn improves mechanical strength. This is reflected in the increase in compressive strength from 46.64 MPa to 46.78 MPa, as shown in Fig. 11a. Similarly, compressive strength testing of ceramic C2 revealed an increase in strength from 45.68 MPa to 45.78 MPa [47].
This finding demonstrates that increasing the sintering temperature enhances the uniform distribution of particles, thereby improving the material's strength, as shown in Fig. 11b [48]. Additionally, the sintering treatment of the C3 ceramic composite results in a denser microstructure, enabling it to better withstand external forces compared to materials with higher porosity [49]. This increased density contributes to improved material strength, as indicated by the rise in compressive strength from 45.92 MPa to 46.27 MPa, as shown in Fig. 11c. Compression testing results show that the ceramic composite exhibits stronger mechanical properties as the sintering temperature increases. This enhancement is due to the strengthening of bonds between particles, making the material more resistant to mechanical stresses [50].
The particle size is an important factor in determining the mechanical properties of ceramics, particularly compressive strength. In this study, it was found that using a particle size ground to 325 mesh (~44 μm) did not significantly affect the compressive strength of the ceramic material. When compared with previous research, which used a 200-mesh particle size, the mechanical strength was similar, with the former showing a value of around 45 MPa and this study yielding approximately 46 MPa [34]. This slight difference in particle size did not result in a significant change in the compressive strength, suggesting that within this range of particle sizes, the mechanical strength remains relatively constant. Therefore, the change in particle size did not notably influence the compressive strength of the material [51].
Characteristics of Electrical Properties of Ceramic Composites
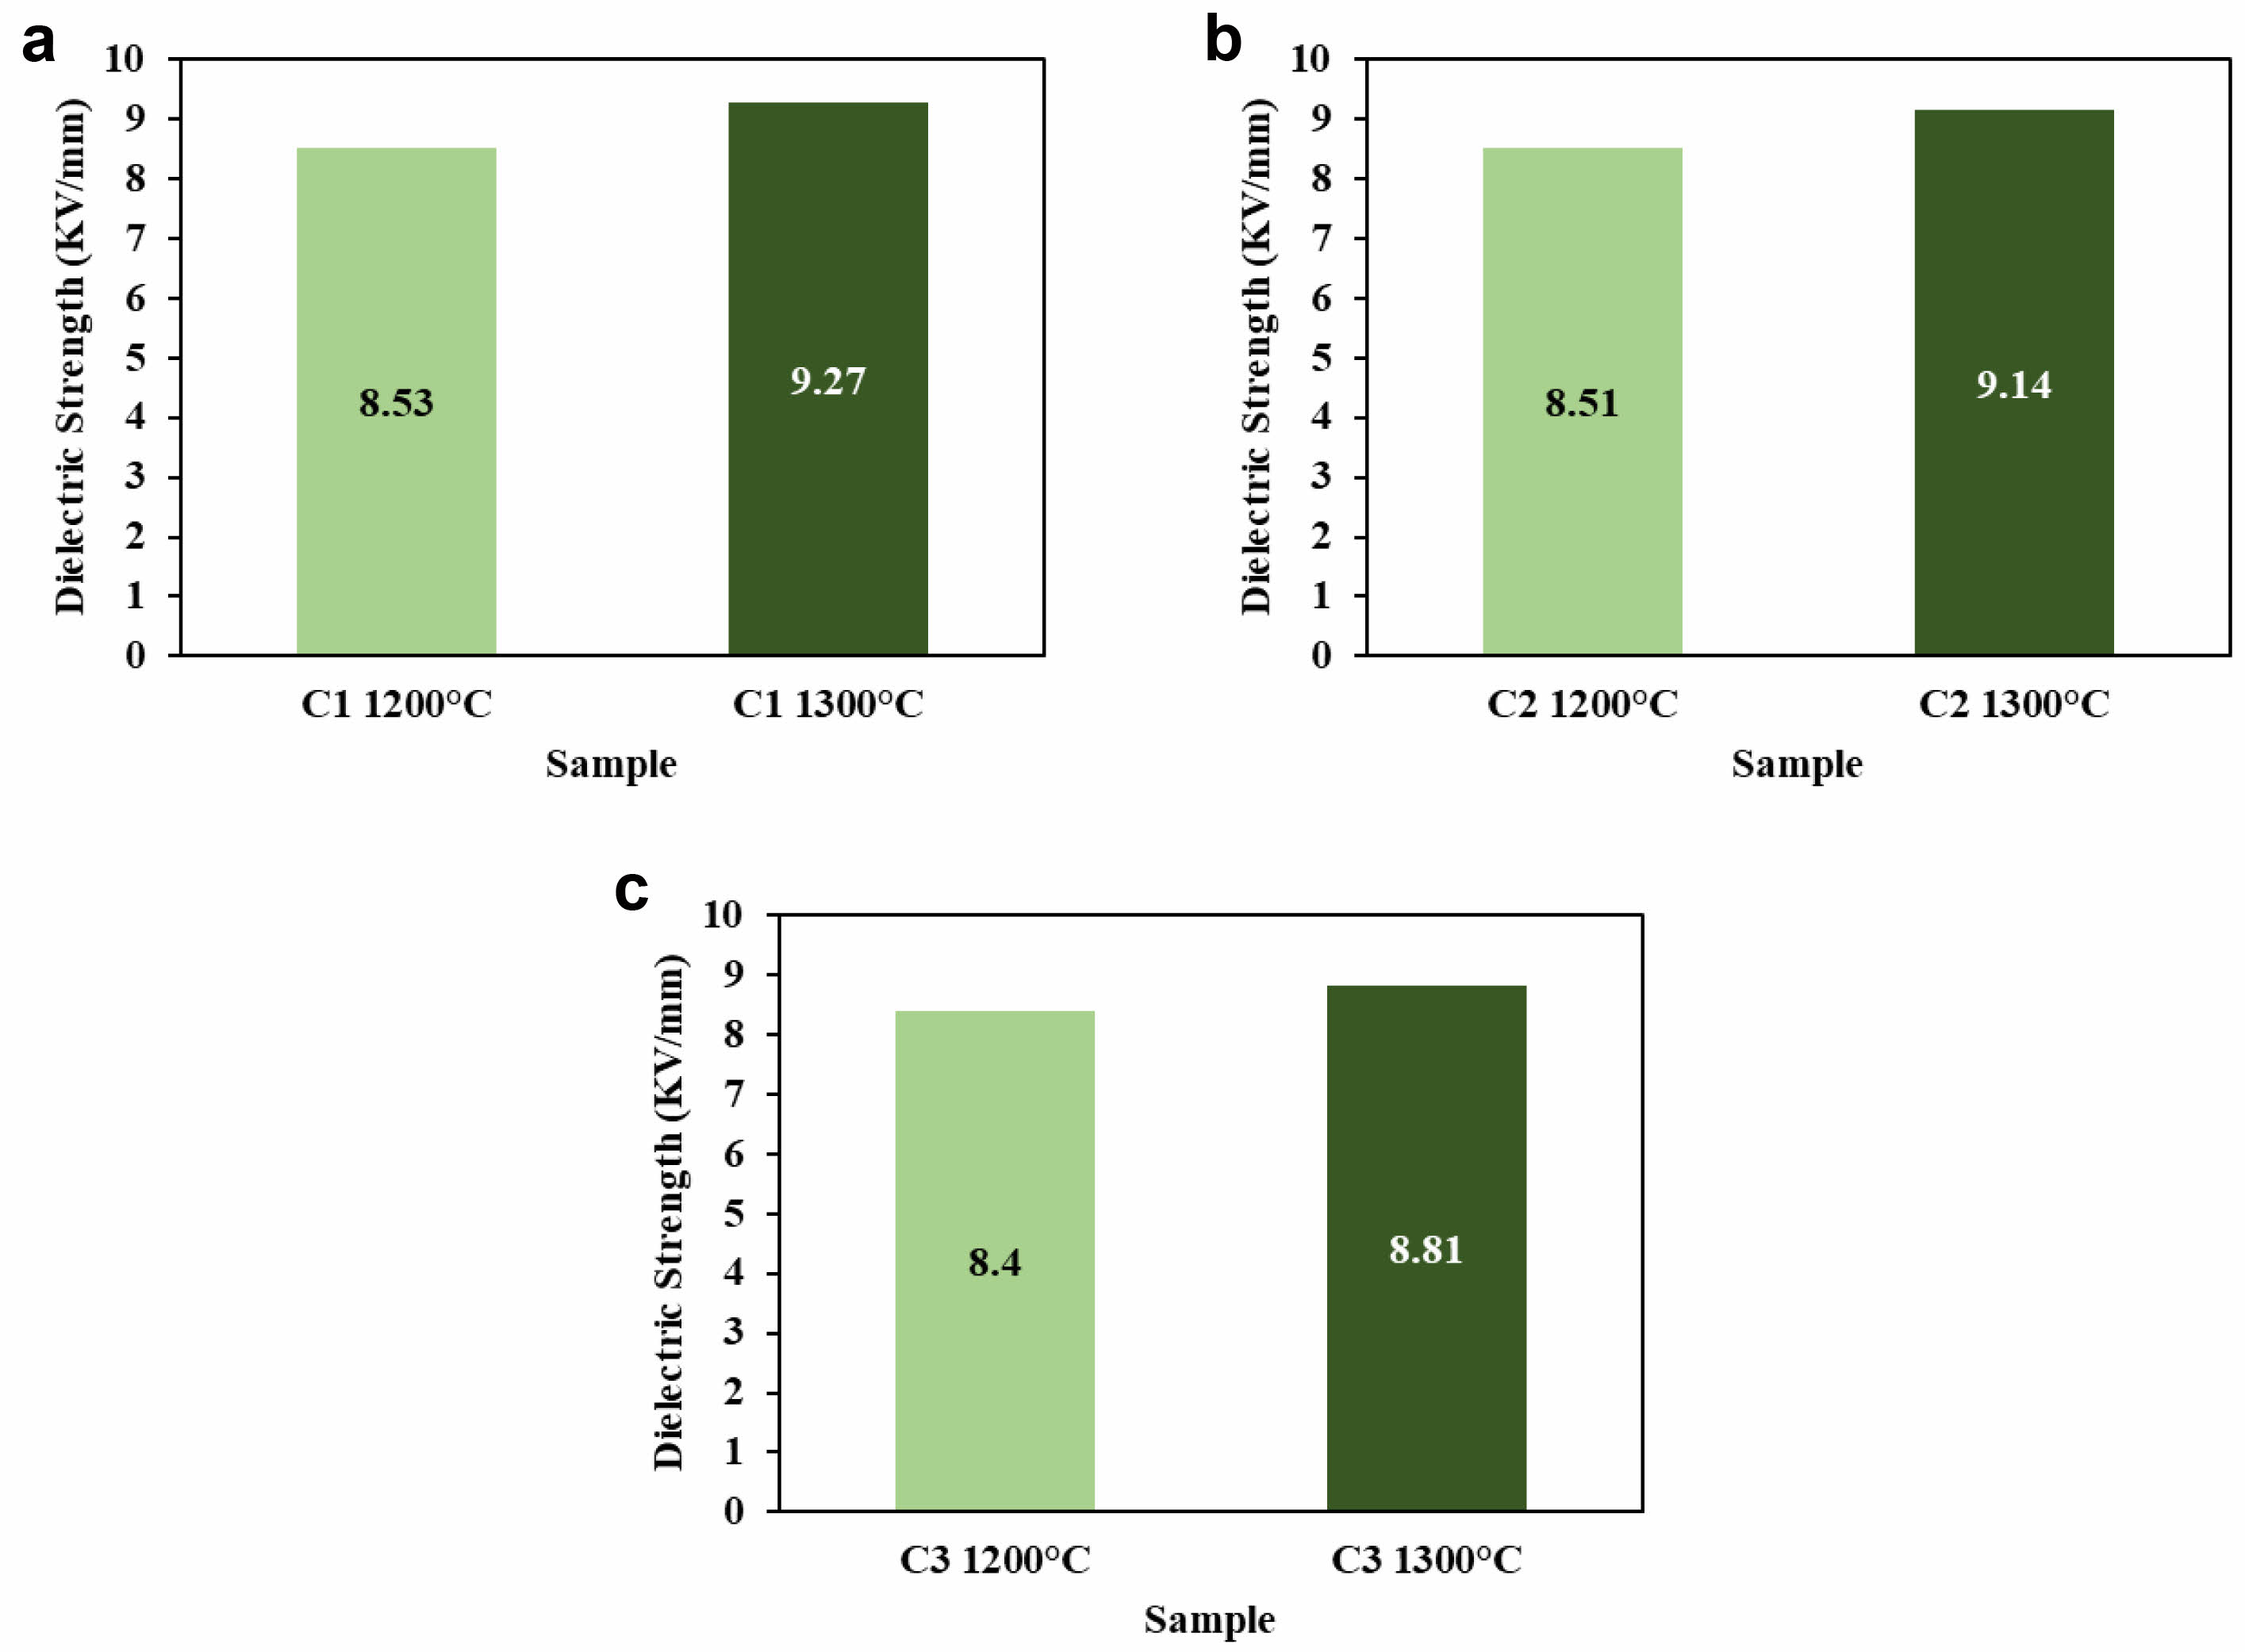
The electrical properties of the C1 ceramic composite can be seen from the results of electrical testing, it is obtained that the increase in sintering temperature given to the C1 ceramic composite will trigger grain growth, good grain growth will be able to increase the dielectric strength value from 8.53 to 9.27 kV/mm can be seen in Fig. 12a, because the grain boundaries are less reducing the breakdown and the grains will usually withstand the given electric field [52].
In ceramic composite C2 can be seen in Fig. 12b, where C2 has strength dielectric increase with increasing sintering temperature and reaches mark maximum 9.14 kV/mm at sintering temperature of 1300 oC. The increase dielectric strength possible due to part ceramic material melts, fills pores and produce surface hard and not porous so that voltage remainder can released and there is improvement range vitrification the ceramic sample [49]. Inside provision ceramic composite for applied to porcelain insulators must is in the range of 6.1-13 kV/mm, where C3 ceramic composite still is at stretched the that is about 8.81 kV/mm at a temperature of 1300 oC can be seen in Fig. 12c. Improvement sintering temperature will give density, phase stable crystals and homogeneous material as well as No porous so that the material can withhold Medan electricity without experienced a breakdown which caused increase in dielectric strength [50].
The dielectric strength of ceramics, which measures how well the material resists electrical breakdown, did not change much with different particle sizes in this study. When the particle size was reduced from 200 mesh (~75 μm) to 325 mesh (~44 μm), the dielectric strength only slightly increased from 9.26 kV/mm to 9.27 kV/mm. This shows that changing the particle size does not have a significant effect on the dielectric strength of the material [34].
Role of Raw Materials in Porcelain Alumina Ceramic Insulator
Raw material contributes to the mechanical and dielectric properties of PACI, with a focus on their specific roles and interactions, especially regarding alumina and mullite formation. Kaolin is a clay mineral primarily composed of alumina (Al₂O₃) and silica (SiO₂). It is often used in ceramic formulations for its plasticity and ability to help form a strong bond during sintering. In PACI, kaolin's role is likely to contribute to the formation of a glassy phase, which can enhance mechanical properties such as strength and thermal stability [53]. Additionally, kaolin can assist in the formation of mullite (3Al₂O₃·2SiO₂) when heated, which is important for improving high-temperature stability and dielectric properties. Feldspar is a group of minerals that act as a flux in ceramics, reducing the sintering temperature and promoting the formation of a vitreous phase during sintering. It helps in the densification process, leading to improved mechanical properties like hardness and strength. Feldspar also contributes to the creation of a low-viscosity glass phase that helps bind the ceramic particles together and improves the material’s dielectric properties by lowering its electrical conductivity at certain frequencies [54]. Ball clay is another type of clay rich in alumina and silica, and it adds to the plasticity of the ceramic mix [55]. In PACI, ball clay likely contributes to the shaping and forming process, allowing for better moldability and homogeneity in the final product. While its contribution to dielectric properties may not be as significant as other materials, its role in improving the green strength (before sintering) is vital for maintaining the structural integrity of the ceramic body. Alumina (Al₂O₃) is a key ingredient in the formation of mullite, an essential phase for high-temperature stability and electrical insulation in ceramics. The high Al₂O₃ content in alumina promotes the formation of mullite during sintering, particularly when the mixture also contains silica from kaolin and feldspar [56]. Mullite has excellent thermal stability, low thermal expansion, and good dielectric properties, making it an essential phase for improving both the mechanical and dielectric performance of PACI. In addition, alumina's high melting point enhances the ceramic's overall thermal resistance.
In the case of Al₂O₃ and mullite formation, the high Al₂O₃ content of alumina plays a critical role in the formation of mullite. Mullite is formed when Al₂O₃ reacts with SiO₂ at elevated temperatures (typically above 1200 oC), and its formation is crucial for enhancing the ceramic's mechanical strength, thermal shock resistance, and dielectric properties. The presence of alumina helps control the phase composition and microstructure, allowing for the desired balance of hardness, insulation properties, and thermal stability. Table 7
|
Fig. 1 XRD result patterns on raw materials (a) Ball Clay, (b) Alumina, (c) Feldspar and (d) Kaolin |
|
Fig. 2 Linear plot of modified Scherrer's for calculation size crystallite. |
|
Fig. 3 Reitveld Refinement results XRD pattern on raw material. |
|
Fig. 4 SEM on raw Materials (a) Ball Clay, (b) Alumina, (c) Feldspar and (d) Kaolin. |
|
Fig. 5 Particle size distribution in raw material (a) Ball Clay, (b) Alumina, (c) Feldspar and (d) Kaolin |
|
Fig. 6 XRD Pattern of Ceramic Composite (a) Before sintering, (b) after sintering at 1200 oC, (c) after sintering at 1300 oC. |
|
Fig. 7 Microstructure of ceramic composites before sintering (a) C1, (b) C2, (c) C3 |
|
Fig. 8 Microstructure of ceramic composite after 1200 o C (a) C1, (b) C2, (c) C3 |
|
Fig. 9 Microstructure of ceramic composite after 1300 o C (a) C1, (b) C2, (c) C3 |
|
Fig. 10 Results of the average particle size (nm) of the ceramic composite before sintering, after sintering at 1200 o C and 1300 o C (a) C1; (b) C2; (c) C3 |
|
Fig. 11 Compressive strength value on composite after sintering at 1200 oC and 1300 oC. (a) C1; (b) C2; (c) C3 |
|
Fig. 12 Dielectric strength value of composites after sintering at 1200 oC and 1300 oC. (a) C1; (b) C2; (c) C3 |
|
Table 6 Crystallite size in ceramic composites before sintering up to sintering temperature of 1300 oC. |
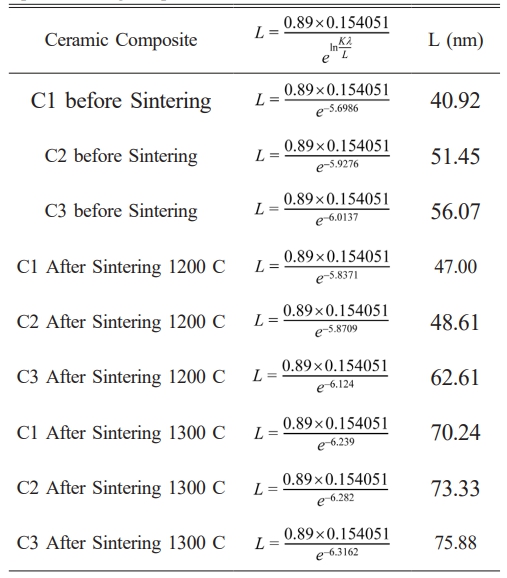
The properties of ceramic composites C1, C2, and C3 show enhanced mechanical and electrical characteristics as the sintering temperature increases. This rise in sintering temperature improves crystallite size, with composite C3 achieving an optimal crystallite size of 75.88 nm at 1300 oC compared to the others. Additionally, the increased sintering temperature promotes the formation of the mullite phase and results in a more homogeneous and porous morphology, which enhances the hardness of the material. Notably, at a sintering temperature of 1300 oC, ceramic composite C1 demonstrates a favorable hardness of approximately 46.78 MPa and a dielectric strength of about 9.27 kV/mm. The ceramics produced with composition C1, consisting of raw ball clay (15%), alumina (20%), feldspar (27%), and kaolin (37%), and sintered at 1300 oC, meet the required standards for mechanical characteristics and sufficient electrical insulation strength for porcelain insulator applications. Several methods exist to enhance the mechanical and electrical properties of ceramics; aside from sintering temperature treatment, there is potential for Indonesia to produce standard porcelain insulators by substituting commercial ball clay with local ball clay. This substitution, when combined with an optimized formulation and processing conditions, could yield high-quality porcelain insulators.
- 1. E. Liun, S. Suparman, S. Sriyana, D. Dewi, and J. S. Pane, Int. J. Energy Econ. Policy. 12[2] (2022) 467-473.
-

- 2. I. F. U. Muzayanah, H. H. Lean, D. Hartono, K. D. Indraswari, and R. Partama, Heliyon. 8[9] (2022) e10634.
-
- 3. H. Kurniawan, I. Iskandar, and M. A. B. Sidik, Indones. J. Environ. Manage. Sustain. 8[2] (2024) 50-62.
-
- 4. M. Oktaviani and M. Asrol, IJETAE. 12[7] (2022) 128-139.
-
- 5. H. Hardianto, Int. J. Environ. Eng. Educ. 1[3] (2019) 1-8.
-
- 6. U. Ekpunobi, C. Ihueze, P. Igbokwe, A. Ekpunobi, H. Obiora-Ilouno, C. Onu, S. Agbo, S. Ezennaya, U. Onuigbo, I. Tabugbo, A. Etukudoh, C. Onu and E. Amalu, Clay Miner. (2021).
-
- 7. A. Merga, H. C. A. Murthy, E. Amare, K. Ahmed, and E. Bekele, Heliyon 5[8] (2019) e02327.
-
- 8. B. Ngayakamo and S. E. Park, EPITOANYAG. 70[4] (2018) 106-109.
-
- 9. I. O. Odewale, V. T. D. Amaakaven, S. C. Ekenyem, O. B. Abe, A. C. Iyasara, V. D. K, and A. A. Alabi, WJARR. 20[2] (2023) 1171-1183
-
- 10. H. Xu and S. Wang, J. Phys. Conf. Ser. 2656[1] (2023) 012020
-
- 11. C. Lubos and K. Jozef, TT: PhE. 3 (2019) 42-44.
-
- 12. M. Z. Saleem and M. Akbar, Polymers 14[3] (2022) 431.
-
- 13. V. J. da Silva, S. K. A. Taveira, K. R. Silva, G. A. Neves, H. L. Lira, and L. N. L. Santana, Mater. Res. 24[2] (2021).
-
- 14. I. Ropuš, L. Ćurković, V. Mandić, M. K. Mustafa, and I. Gabelica, Teh. Vjesn. 28 [5] (2021).
-
- 15. A. de Pablos‐Martín, S. Rodríguez‐López, and M. J. Pascual, Int. J. Appl. Glass. Sci. 11[3] (2020) 552-568.
-
- 16. A. Z. Khalf. Adv. Ceram. Mater. (2021).
-
- 17. M. Qin, Y. Wu, K. Wang, Y. Tian, and G. Li, Mater. Tehnol. 53[5] (2019) 725-731.
-
- 18. M. L. Bella, M. Hamidouche, and L. Gremillard, Ceram. Int. 47[11] (2021) 16208-16220.
-
- 19. K. C. Reddy and K. V. L. Subramaniam, J. Appl. Crystallogr. 53[2] (2020) 424-434.
-
- 20. D. Blake, R. M. Hazen, S. M. Morrison, T. S. Bristow, P. Sarrazin, K. Zacny, E. B. Rampe, R. T. Downs, A. Yen, D. W. Ming, R. V. Morris, D. T. Vaniman, A. Treiman, C. N. Achilles, P. I. Craig, D. J. D. Marais, V. Tu, N. Castle, and M. T Thorpe, Bull. Am. Astron. Soc. 53[4] (2021).
-
- 21. G. M. Alzoubi, Adv. Appl. Ceram. 119[4] (2020) 224-232.
-
- 22. L. Mahnicka-Goremikina, R. Svinka, V. Svinka, V. Goremikins, S. Ilic, L. Grase, I. Juhnevica, M. Rundans, T. V. Eiduks, and A. Pludons, Materials. 16[13] (2023) 4631.
-
- 23. T. F. Choo, M. A. Mohd Salleh, K. Y. Kok, and K. A. Matori, Recycling. 4[3] (2019) 39.
-
- 24. T. Kumazawa and H. Suzuki, Ceram. Int. 47[9] (2021) 12381-12388.
-
- 25. W. Zhou, W. Yan, N. Li, Y. Li a, Yajie Dai, B. Han, Y. Wei, Ceram. Int. 44[18] (2018) 22950-22956.
-
- 26. C. L. Chi, S. N. Hung, N. L. Ly, and T. L. Anh, ICGTDS. (2016) 161-165.
-
- 27. A. N. N. Dowuona, A. Yaya, E. Nyankson, J. K. Efavi, L. N.W. Damoah, D. Dodoo-Arhin, V. Apalangya, E. Annan, E. K. Tiburu, B. Onwona-Agyeman, and B. Tomiczek, J. Ceram. Process. Res. 19[2] (2018) 95-100.
-
- 28. B. K. Park and C. S. Kim, J. Ceram. Process. Res. 8[5] (2007) 376-381.
-
- 29. W. Burger and G. Kiefer, J. Compos. Sci. 5[11] (2021) 306.
-
- 30. H. Li, Y. Liu, Y. Liu, K. Hu, Z. Lu, and J. Liang, Acta Metall. Sin. 33[2] (2020) 204-214.
-
- 31. O. T. Sanya, S. S. Owoeye, O. E. Isinkaye, and O. T. Simon, Int. J. Appl. Ceram. Technol. 17[5] (2020) 2259-2264.
-
- 32. O. Kotova, V. Ustyugov, S. Sun, and A. Ponaryadov, J. Min. Inst. (2022).
-
- 33. S. Lin, Y. Yu, Y. Tan, H. Yang, M. Zhong, C. Zhang, Z. Zhang, and Y. Wu, Materials. 15[11] (2022) 3867.
-
- 34. W. Garinas, A. Fauzi, H. Hidayaturrahman, Q. N. Madra, Subari, D. M. Nurjaman, W. Hidayat, Y. Sudiyanto, N.V. Permatasari, Zulfahmi, Yurohman, J. Ceram. Process. Res. 25[2] (2024) 306-315.
-
- 35. A. K. Kaviraj, S. Saha, A. Chakraborty, G. Pahari, D. Ray, T. K. Parya, and S. K. Das, J. Aust. Ceram. Soc. 57 (2021) 327-337.
-
- 36. X. Wang, Y. Chen, X. Han, J. Yu, K. Xiao, X Zhang, and X. Wu, Int. J. Appl. Ceram. Technol. 20[3] (2023) 1442-1456.
-
- 37. Y. Wang, S. Zhu, X. Zhou, and T. Zhang, J. Phys. Conf. Ser. 2206[1] (2022) 012037.
-
- 38. N. S. Mehta, P. K. Sahu, P. Tripathi, R. Pyare, and M. R. Majhi, Bol. Soc. Esp. Cerám. Vidr. 57[4] (2018) 151-155.
-
- 39. I. F. Chidozie, JMMS. 3[2] (2022) 1-7.
-
- 40. M. Abubakar, A. Muthuraja, D. K. Rajak, N. Ahmad, C. I. Pruncu, L. Lamberti, and A. Kumar, Materials. 13[8] (2020) 1872.
-
- 41. M. H. Chávez, M. V. Ramírez, A. M. H. González, J. G. Serrano, A. C. Ramírez, J. A. R. Serrano, and R. G. S. Alvarado, Physicochem. Probl. Miner. Process. 57[1] (2020) 39-52.
-
- 42. H. P. A. Alves, J. B. Silva, L. F. A. Campos, S. M. Torres, R. P. S. Dutra, and D. A. Macedo, Ceram. Int. 42[16] (2016) 19086-19090.
-
- 43. Q. Shan, Q. Ma, J. Lian, C. Yao, and A. Shui, Int. J. Appl. Ceram. Technol. (2022).
-
- 44. H. L. Yang, Z. S. Li, Y. D. Ding, Q. Q. Ge, Y. J. Shi, and L. Jiang, Materials. 15[20] (2022) 7212.
-
- 45. M. L. Jalaluddin, U. A. A. Azlan, M. W. A. Rashid, and N. Tamin, AIMS Mater. Sci. 11[2] (2024) 243-255.
-
- 46. F. Mao, W. Pi, Y. Li, X. Xu, P. Wen, and W. Zhou, Int. J. Appl. Ceram. Technol. 19[3] (2022) 1650-1658.
-
- 47. C. Du, B. Lei, Y. Qi, R. Zhang, and F. Liu, J. Mater. Sci. 59[29] (2024) 13365-13392.
-
- 48. N. Ismiati and D. Darwis, J. Phys. Conf. Ser. 1763[1] (2021) 012094.
-
- 49. D. K. Das, P. C. Mishra, S. Singh, and R. K. Thakur, Int. J. Mech. Mater. Eng. 9[1] (2014) 12.
-
- 50. Z. Peng, W. Chenchen, Z. Shengfeng, G. Baisong, Z. Zhiguo, Y. Zhentao, and L. Wei, Powder Metall. Met. Ceram. 61[9-10] (2023) 560-573.
-
- 51. K. Miyake, Y. Hirata, T. Shimonosono, and S. Sameshima, Materials. 11[7] (2018) 1137.
-
- 52. W. Du, S. Jin, and D. Gruber, Comput. Part. Mech. 11[5] (2024) 1887-1901.
-
- 53. I. Stubana, A. Trnik, F. Chmelik, and L. Vozar, Adv. Ceram. - Char., RM, Proc., Props., Degrad. & Heal. (2011).
-
- 54. W. Mao, L. Wu, and Y. Qi, IEEE Trans. Geosci. Remote Sens. 58[2] (2019) 1398-1408.
-
- 55. M. Valaskova, Ceram. - Silik. 59[4] (2015) 331-340.
- 56. H. Guo and W. Li, J. Eur. Ceram. Soc. 38[2] (2018) 679-686.
-
 This Article
-
2025; 26(4): 646-660
Published on Aug 31, 2025
- 10.36410/jcpr.2025.26.4.646
- Received on Apr 16, 2025
- Revised on Jul 12, 2025
- Accepted on Jul 16, 2025
Services
Shared
Correspondence to
- Wahyu Garinas, Haerul Hidayaturrahman
-
Mining Technology Research Center, National Research and Innovation Agency, Serpong, Indonesia
Tel: +62812 1908 3564(Wahyu Garinas), Tel: +62813 3976 3820(Haerul Hidayaturrahman) - E-mail: garinas64@gmail.com, haerul.hidayat@gmail.com
Clean-Energy Research Institute(CRI), Hanyang University, 222, Wangsimni-ro, Seongdong-gu, Seoul, 04763, Korea
E-mail: jcpr@hanyang.ac.kr