


- Effects of Samarium and Yttrium doping on the structural and electrical properties of perovskite materials for SOFC applications
Huijuan Mua,* and Xiaoqing Qiub
aZhumadian Preschool Education College, Zhumadian 463003, Henan, China
bSchool of Materials Science and Engineering, Luoyang Institute of Science and Technology, Luoyang 471023, Henan, ChinaThis article is an open access article distributed under the terms of the Creative Commons Attribution Non-Commercial License (http://creativecommons.org/licenses/by-nc/4.0) which permits unrestricted non-commercial use, distribution, and reproduction in any medium, provided the original work is properly cited.
Advanced materials are critical to driving further progress in solid oxide fuel cell technology to improve efficiency and accommodate a broader range of fuels. Samarium and Yttrium doped perovskite is synthesized via Sol-gel method. According to XRD examination, the predominant phase possesses a cubic crystal structure derived from the Fm3m space group (number 225). A microscope examination reveals the formation of agglomeration and porosity. The SAED patterns of Sm0.5Ce0.5NiO3 and Y0.5Ce0.5NiO3 confirm the poly crystalline nature. As samarium and yttrium are introduced, greater oxygen vacancies form, which impacts the ways grains and grain boundaries form in the material. A combination of various parameters, variations in conductivity and activation energy obey a monotonic trend. Impedance measurement shows a substantial improvement in conductivity is observed for grain and grain boundaries.
Keywords: Perovskite, SOFC, Oxygen vacancies, Impedance.
The rapid The exhaustion of fossil fuel reserves and the pressing require to cut down global Releases of carbon have significantly heightened the requirement for energy from renewable sources. Among these, Hydrogen is becoming more recognized as an essential fuel for clean energy sources in the coming decades. In recent time considerable progress has been made in hydrogen energy development, with increasing efforts to expedite its transition from potential to practical applications. Hydrogen is now being utilized across various sectors to drive more reliable and sustainable energy systems [1, 2]. The utilization of hydrogen in transportation has been demonstrated to be the two practical and effective. Fuel cells are of great interest to industries because to their minimal release of harmful pollutants including NOx and SOx, as well as their high power density [3]. This progression is supported by the ongoing expansion of the hydrogen energy supply infrastructure [4, 5]. Fuel cells are divided into five primary types according to the kind of electrolyte used: Proton exchange membrane fuel cells (PEMFCs), molten carbonate fuel cells (MCFCs), phosphoric acid fuel cells (PAFCs), alkaline fuel cells (AFCs), and solid oxide fuel cells (SOFCs) [6]. SOFCs have many benefits, such as integration with different fuels, less noise generation, diminished emissions of carbon dioxide, long functioning lifetimes ranging from 40,000 to 80,000 hours, as well as outstanding efficiency of energy [7-11]. SOFC applications are versatile enough to be used in a number of settings, including utility
grids, residential energy systems, backup power for transportation, and other niche applications [12-14]. The anode, cathode, and electrolyte are the three primary parts of a SOFC. Hydrogen gas (H2) is introduced at the anode side, while oxygen usually sourced from air is supplied to the cathode. The fuel oxidation reaction (FOR) at the anode and the oxygen reduction reaction (ORR) at the cathode are the two basic electrochemical processes that power the cell [15]. SOFCs are high-temperature fuel cells, Platinum catalysts are among the most expensive are unnecessary. SOFCs high operating temperature (~1000 °C) has drawbacks, such as longer start-up times, shorter cell lifetime due to component reactions, and faster degradation. These variables lead to an overall greater cost for the cell. [16, 17]. To address these challenges, recent research concentrates on dropping the operating temperature of SOFCs. This is being achieved by modifying standard materials or introducing new materials capable of functioning in lower temperature ranges (≤600 °C) and intermediate-temperature ranges (600 °C –800 °C), rather than the traditional 1000 °C. The cathode of a SOFC transforms air (oxygen) into ions (O²⁻). The ORR converts oxygen gas (O₂) into oxygen ions (O²⁻). This reaction takes place at the triple-phase boundary (TPB), which is a critical area where the gas phase (oxygen), electronic conductor (electrode), and ionic conductor (electrolyte) come into contact and interact simultaneously [18, 19]. This step involves reducing oxygen molecules (O2) into oxide ions (O²⁻), transporting these ions from the cathode into the electrolyte, and incorporating them into the crystal lattice. The triple-phase boundary (TPB) where the electrode, electrolyte, and gas phases meet is critical to enabling these processes and ensuring efficient SOFC operation, as the cells performance is strongly influenced by the length of the TPB. A larger TPB length results in a higher reaction rate, thereby improving cell performance. If any phase within the TPB breaks down, the reaction cannot proceed, leading to a loss of functionality [20]. The oxygen reduction process additionally impacts SOFC cell resistance. The microstructure and architecture of SOFC components had immediate effects on the dimension and location of triple-phase boundaries (TPBs), which are vital places for chemical reactions to occur Oxygen reduction and subsequent ion incorporation into the electrolyte may happen via many kinds of pathways, including surface and bulk diffusion processes. Adler has provided an extensive review of the various factors influencing the oxygen reduction reaction (ORR), which provides valuable insights into the underlying processes that govern SOFC performance [21]. Perovskite oxides with the general formula ABO₃ have received much interest owing to their flexibility in structure and broad functional properties. The A-site cations in this structure are typically rare earth or alkaline earth metals that occupy positions with a coordination number of twelve. The B-site cations, usually transition metals, are in octahedral coordination with a coordination number of six [22-24]. Typically, perovskite-structured oxides exhibit a cubic structure at room temperature. However, variations in the ionic radii of the dopant and host elements can lead to cationic substitutions at the A and B sites, altering the overall structure. Modifications in the charge for the A and B-sites cations, as well as changes in processing parameters, can distort the structure's shape. This distortion is caused by the occurrence of oxygen and cationic vacancies, as well as shifts in the angles between the cations and oxygen. Octahedral tilting (BO₆) is a common distortion in ABO₃ structures. Defects at the A-sites cause the emergence of oxygen vacancies, that strengthen ionic conductivity while preserving the total neutrality of charges system [25-28]. Several Multiple B-site components have been selected for perovskite structures due to their exceptional capacity to undergo redox reactions, which are essential in the operation of SOFCs. In the SOFC process, The relative pressure for oxygen grows leading to structural disorder in the system. This disorder facilitates a hopping technique in which cations within lower oxidation states migrate to greater oxidation states. The ABO₃ perovskite structure's ability to adapt to multiple oxidation states enables redox-driven transport, promoting system integrity under additionally electrical and thermal driving forces [29, 30]. Ceria's interchangeable oxidation states (Ce³⁺ and Ce⁴⁺) make it a popular material for producing and releasing oxygen ions. This characteristic leads to the presence of oxygen vacancies results in high ionic conductivity [31, 32]. Rare earth-doped ceria demonstrates increased conductivity of ions at lower temperatures less than 773 K. This makes it an excellent choice for the electrolyte in intermediate-temperature solid oxide fuel cells [33, 34]. Doping Ce⁴⁺ with rare-earth elements like Sm³⁺, Gd³⁺, and Nd³⁺ introduces additional oxygen vacancies, Promoting ionic conductivity, reducing activation energy, and boosting the stability compared to ambient temperature to the melting point [35]. The Krogner-Vink connection for oxygen vacancies could be showed as M2O3  M’Ce + +
  where M indicate a trivalent rare earth metal. Dopants like Sm³⁺, Gd³⁺, Dy³⁺, Pr³⁺, Nd³⁺, and Y³⁺ are highly soluble in ceria, this produces improved ionic conductivity. Samarium (Sm³⁺) is an ideal dopant through it similar ionic radius and electro negativity to ceria (Ce⁴⁺). This compatibility facilitates its incorporation into the ceria lattice, resulting in a stable solid solution. As a result, samarium doping has a significant influence on the material's structural integrity as well as its electrical properties [36]. Yttrium-doped barium cerate zirconate (BaCe₁₋ₓ₋ᵧZrₓYᵧO₃₋δ (BCZY) sintered pellets act as a promising proton-conducting material which have been thoroughly studied. It exhibits high conductivity and excellent chemical stability in atmospheres containing CO₂, H₂O, or H₂S. Among the barium cerate zirconate compounds BaCe₀.₄₅Zr₀.₄₅M₀.₁O₃₋δ (where M = In, Y, Gd, or Sm), the Y-doped composition displayed the highest ionic conductivity. Ce⁴⁺ (0.87 Å) and Y³⁺ (0.90 Å) possess equivalent efficient ionic radii as well as have a coordination number of six.Furthermore The efficiency of single-cell solid oxide fuel cells (SOFCs) using dense or thin-film BCZY electrolytes has been extensively studied, highlighting BCZY's potential as an effective proton-conducting material for intermediate-temperature SOFCs powered by hydrogen or ammonia, as well as reversible SOFC applications [37]. Nickel doping at the B-site of layered perovskites It has been shown to increase electrochemical performance By establishing metal exsolution, as previously reported for PBM. The combined effects of cerium's mixed valence states and nickel metal exsolution, resulting from Ce and Ni doping, significantly impact both ionic and electronic conductivity. These effects are attributed to mechanisms such as oxygen vacancy formation, lattice distortion, valence state changes, band structure modifications, and defect-induced conductivity [38]. During this work, An attempt was made to synthesise a novel complex perovskite compound. by Utilising most effective compositions. The resulting perovskite nanomaterials were synthesized and thoroughly investigated for their structural, morphological, and electrical conductivity characteristics.
Synthesis of YCNO and SCNO
Y0.5Ce0.5NiO3 and Sm0.5Ce0.5NiO3 perovskite was prepared using a sol-gel method [39]. Stoichiometric amounts of the starting materials YNO3, CeNO3, Sm(NO3)3·6H2O and Ni(NO3)2·6H2O were dissolved in 100 ml double distilled water. The resulting solution was then mixed with equal parts citric acid and polyethylene glycol constantly stirred till a gel stage established. The gel was dried at 200 °C for 12 hours to extract water, citric acid, and other organic compounds. The outcome of dry gel was then calcined at 800 degrees Celsius for 4 hours. to synthesize nano particles. Agate mortar was used to finely crush the calcined material, which was afterwards uniaxially pressed through cylinder-like pellets analysing 1.6 mm thick and 10 mm diameter. This was achieved with a hydraulic machine produces a pressure of 180 kg/cm². The cylindrical pellets were subsequently sintered at 1200 °C for 10 hours before undergoing further characterization and total conductivity analysis.
Characterization
The nanopowder was structurally identified utilising a PHILIPS X-ray diffractometer with Cu Kα radiation (λ = 1.540598 Å). Data were collected with a 2θ range of 10° to 80° and a step size of 0.02° per second. The ensuing patterns of diffraction were analysed utilising the X'Pert High Score Plus programs.The microstructure of the was examined utilising a Carl Zeiss Auriga Scanning Electron Microscope (SEM) in secondary electron emission mode. The elements' oxidation states were investigated as well during the analysis process. The morphology and Calcined powders' crystal structure were investigated using high-resolution transmission electron microscopy (HRTEM) with a JEOL JEM 2100 (Japan) at 200 kV. Each calcined powder was crushed with ethanol using a mortar and pestle for 3 minutes preparing for having drop-casting into a carbon-coated copper grid (200 mesh). The grid had been allowed for drying for 15 minutes before being inserted into the HRTEM for analysis. A Wayne Kerr (6500 P Series) LCR meter was utilized for calculating the electrical impedance of silver-coated samples in air. at temperatures ranging from 250 °C to 750 °C, with intervals of 25 °C and frequency ranges of 20 Hz-1 MHz.
X-ray diffraction analysis
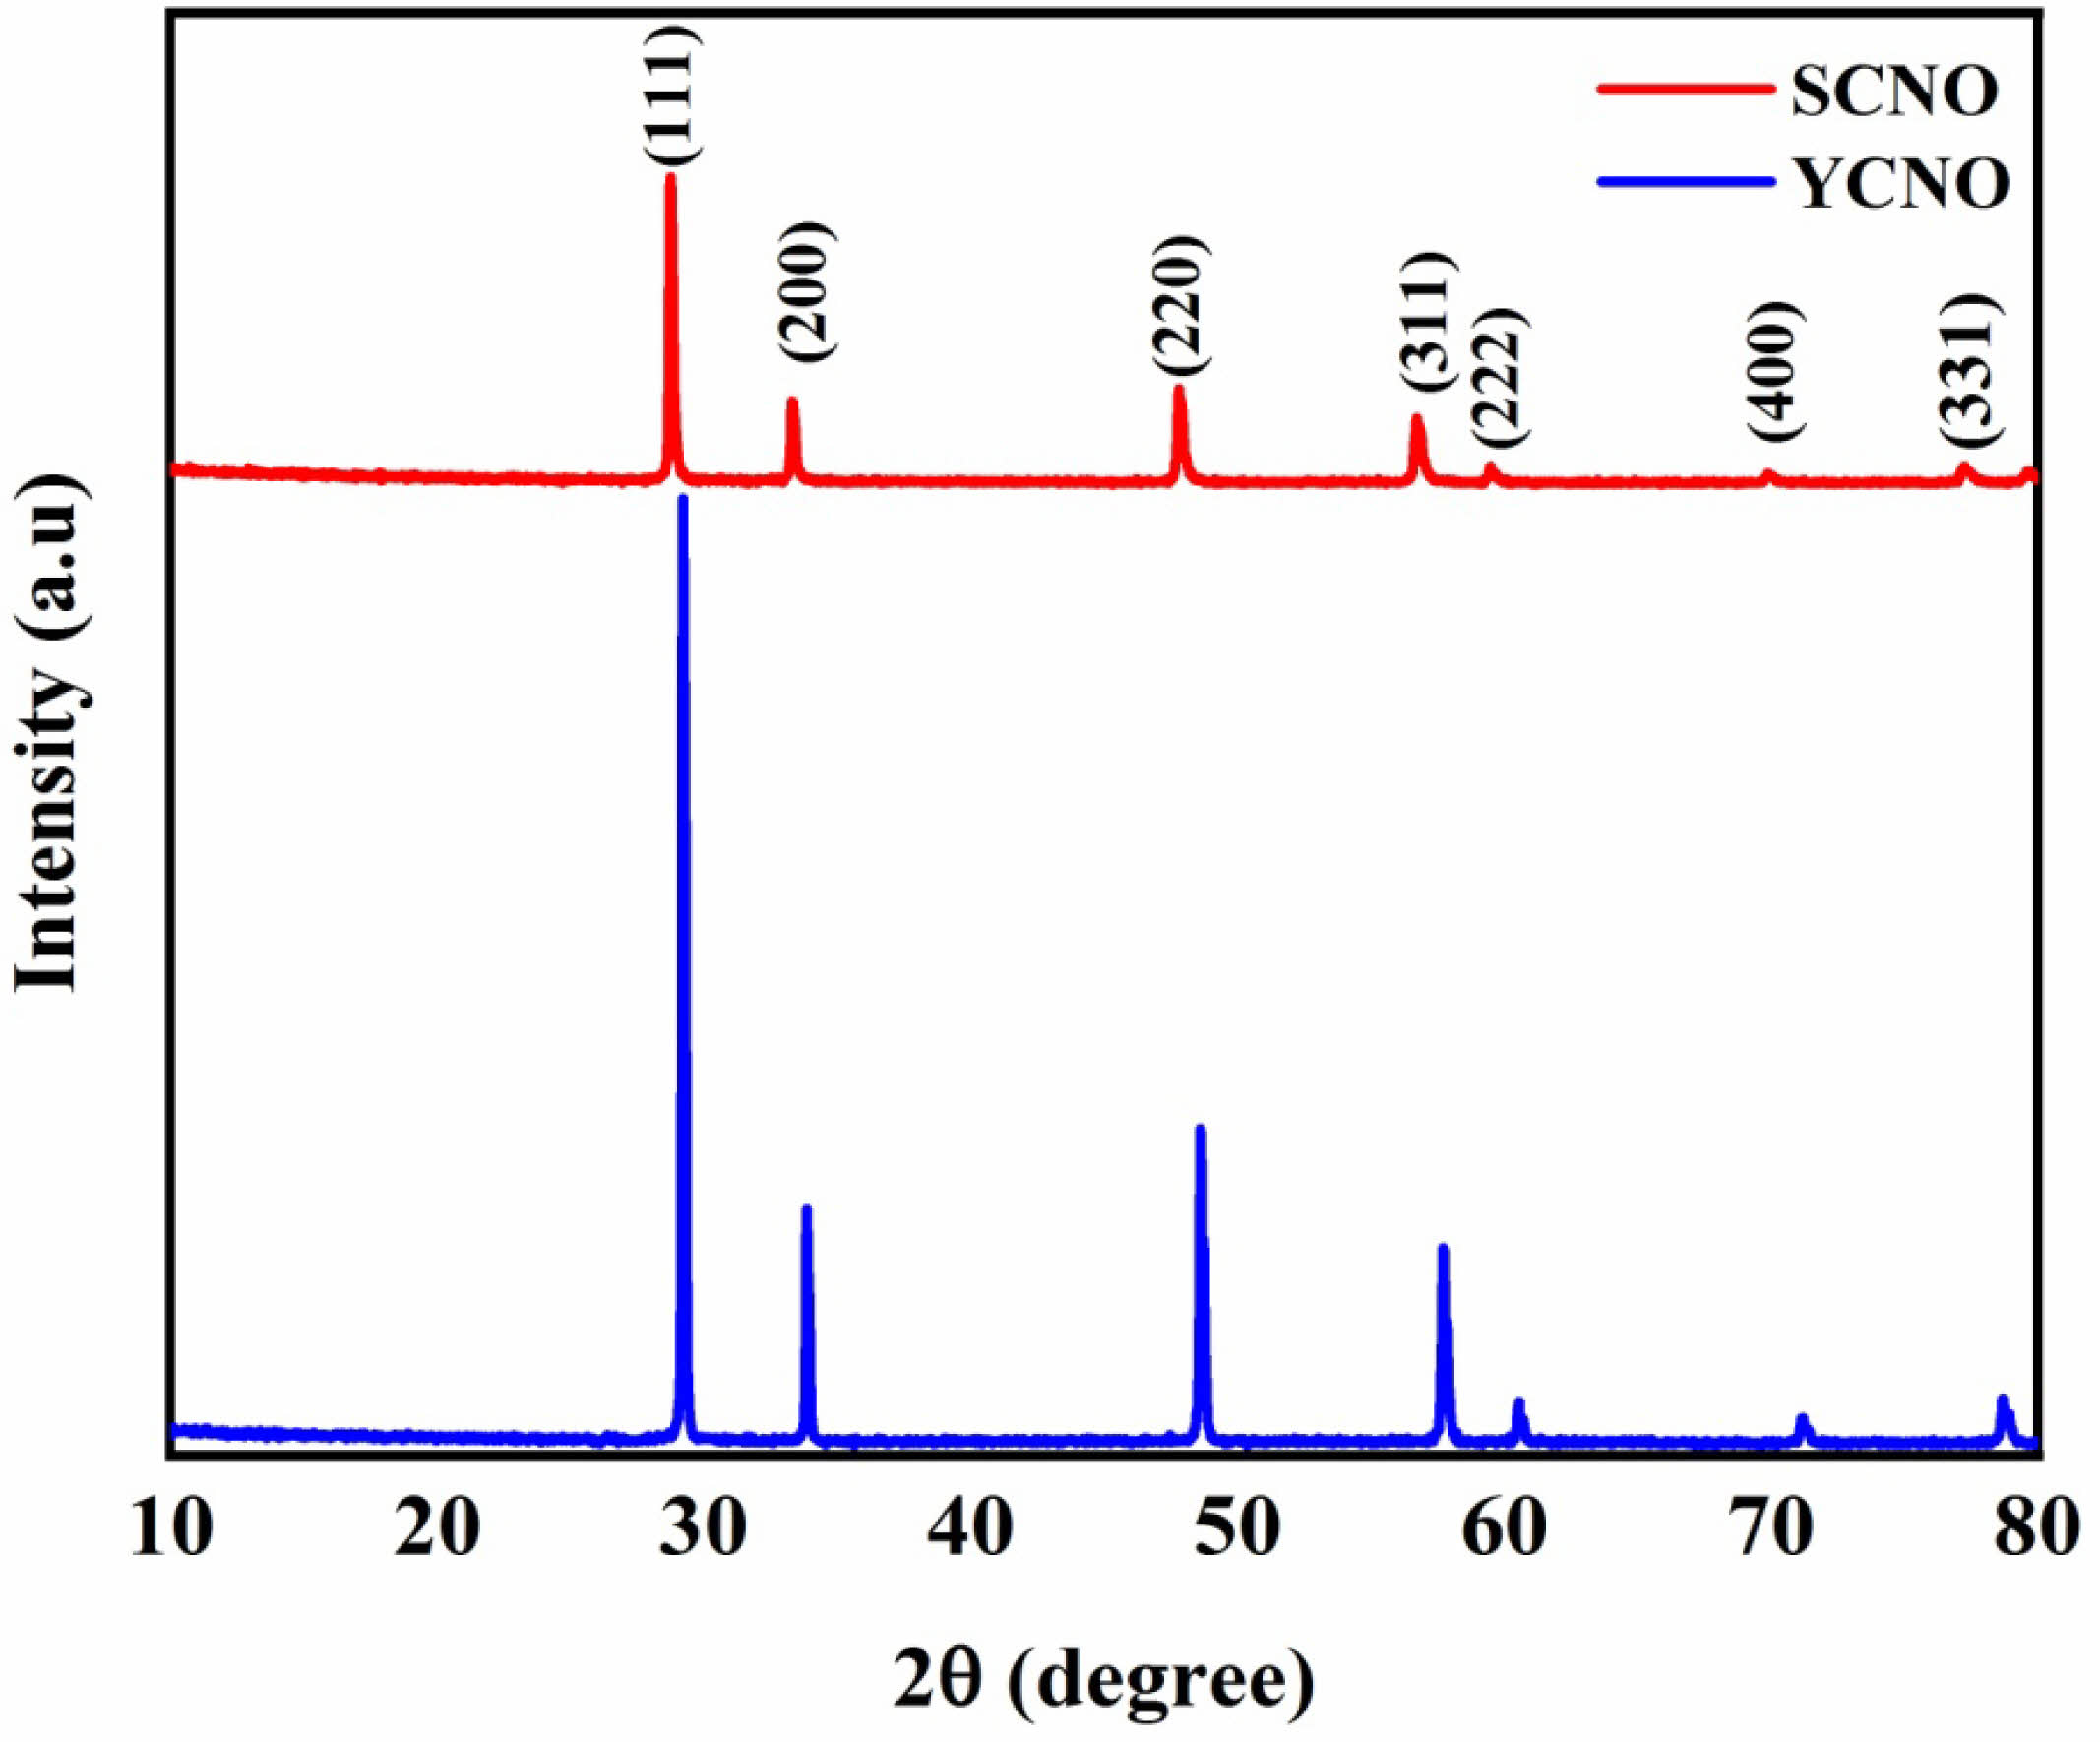
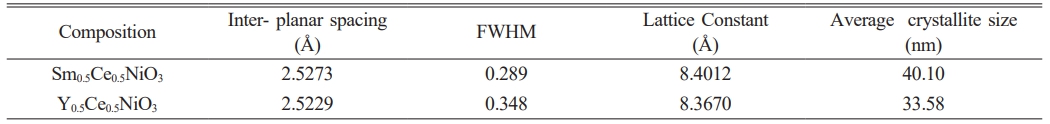
Fig. 1 shows the XRD pattern of Sm³⁺ and Y³⁺ co-doped nano particles, with separated peaks of diffraction related to the (111), (200), (220), (311), (222), (400), and (331) crystallographic planes. These peaks correlate with standard data from JCPDS card no. 75-0162, confirmation the formation of a cubic structure with space group Fm3̅ m (No. 225) [40, 41]. The XRD analysis also reveals a shift in the peaks towards lower Bragg angles for Sm³⁺-doped compared to Y³⁺-doped the bigger ionic radius of Sm³⁺ (1.21 Å) compared with Y³⁺ (1.15 Å) may impact lattice expansion and imperfections formation, potentially affecting both crystal structure and the ionic conductivity of the doped material. Additionally, the Expanding of the reflection peaks decreases. and the Peaks turn more sharp. Indicating an improvement in the crystalline of the sample [42] A lattice constant (a) was estimated with a relationship involving the inter planar spacing (d) and the Miller indices (hkl), based on the equation [43]:

An average size of the crystallite was obtained utilizing the Debye-Scherrer formula.
λ is the X-ray wavelength (1.5406 Å) and β is the full width at half maximum (FWHM) of the (311) diffraction peak, and θ is the Bragg angle. Table 1 illustrates the calculated values for the lattice parameter (a) and average size of the crystallite.
Morphological analysis
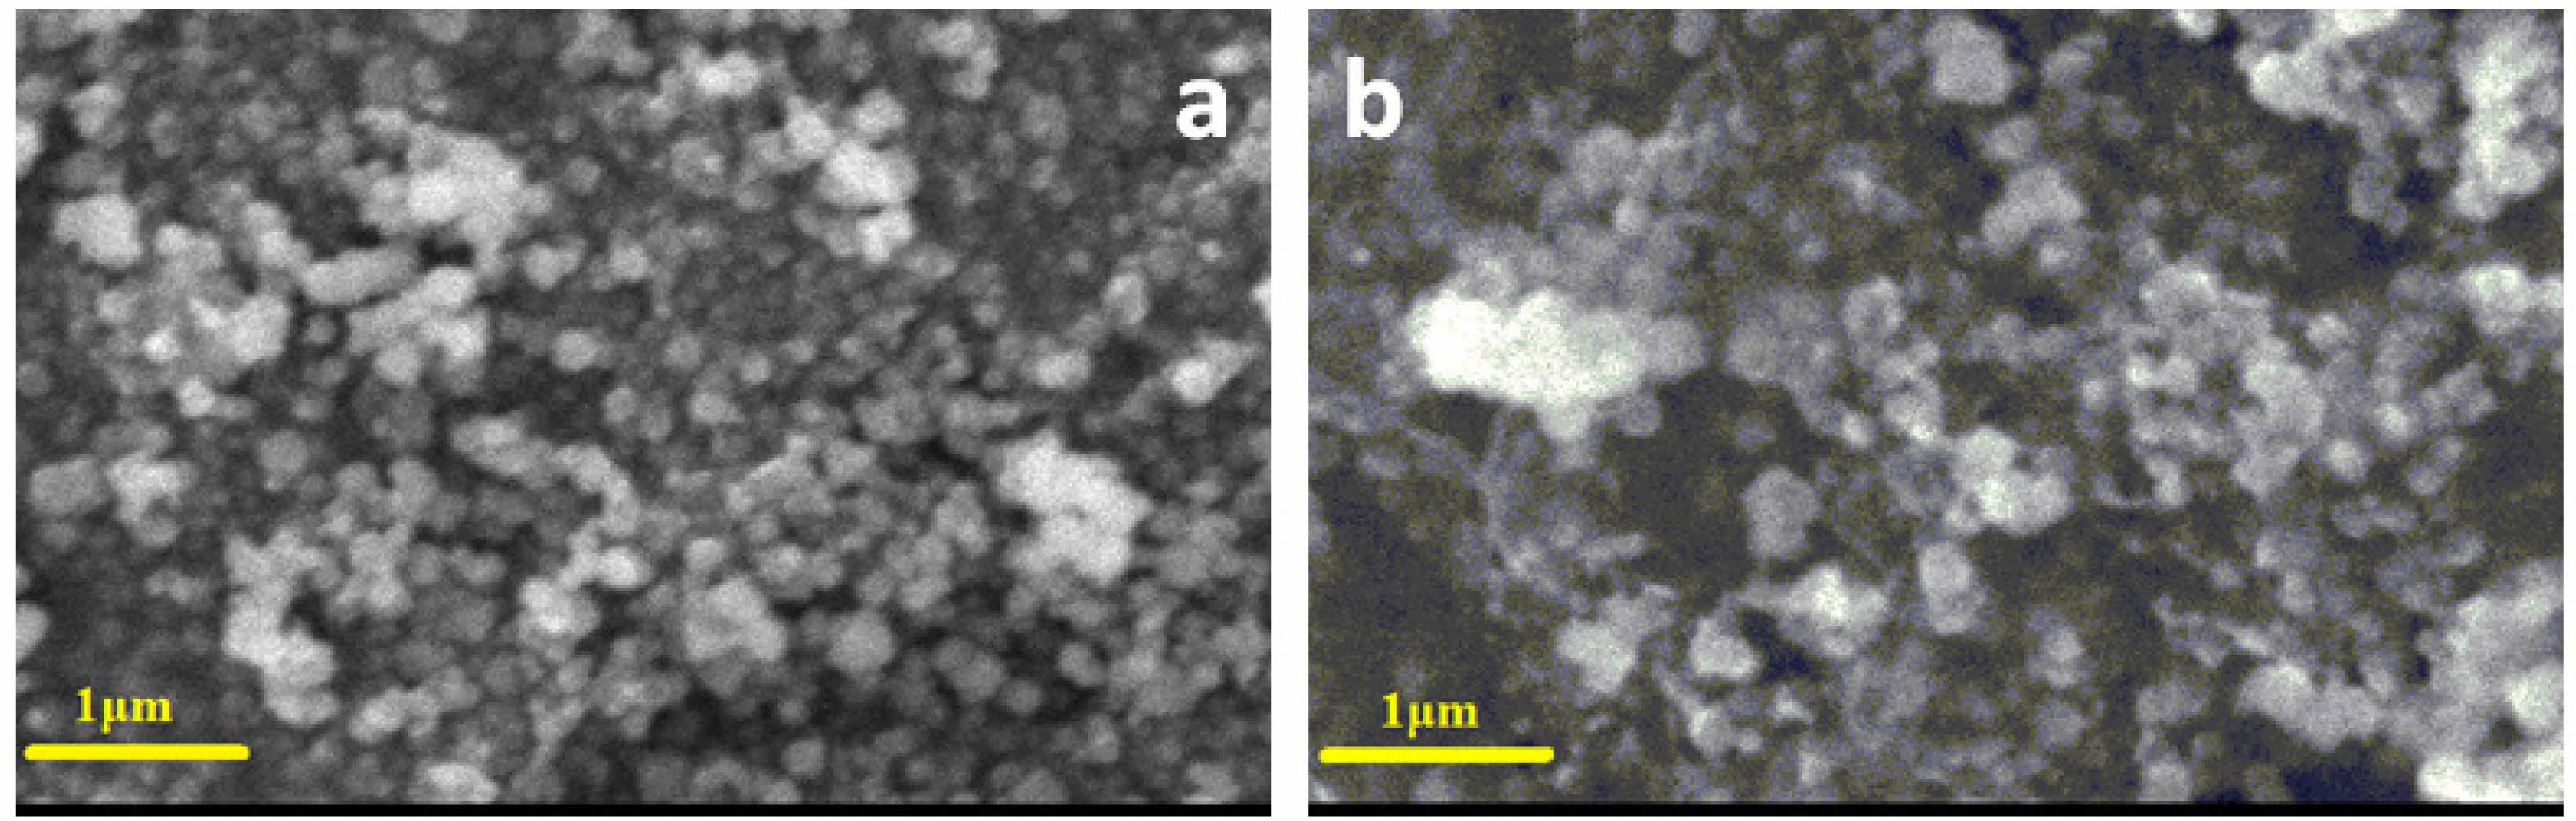
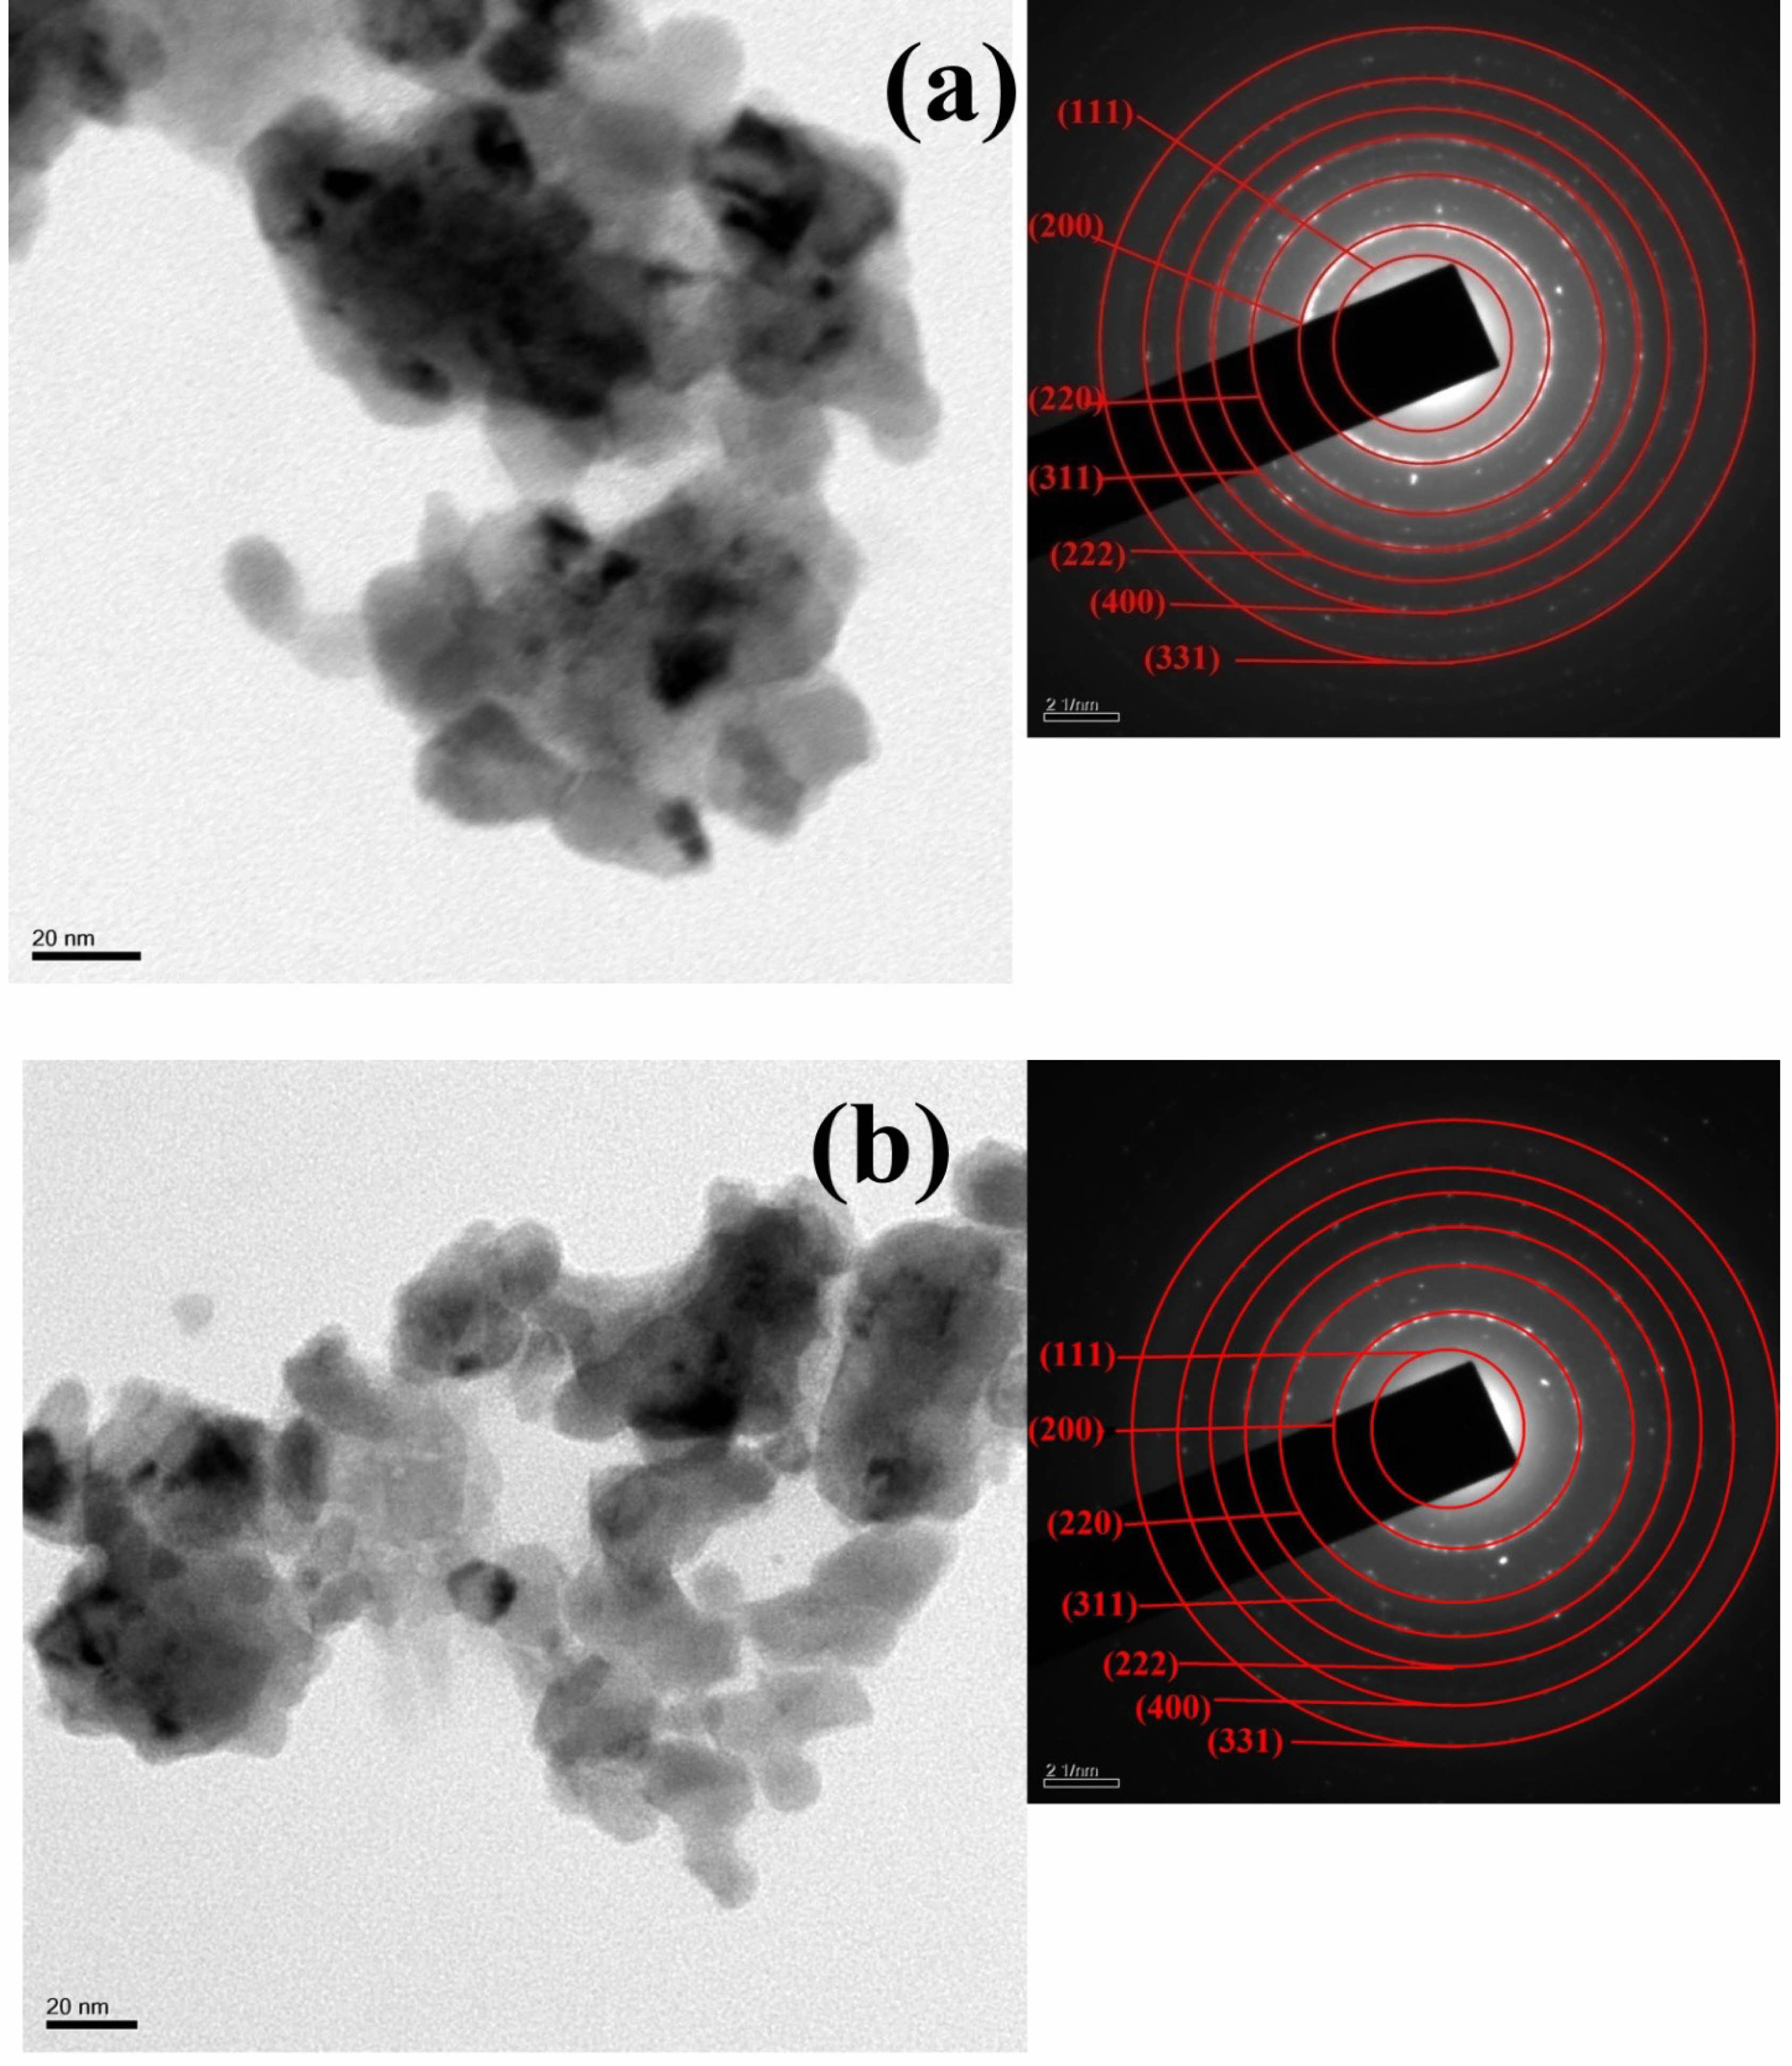
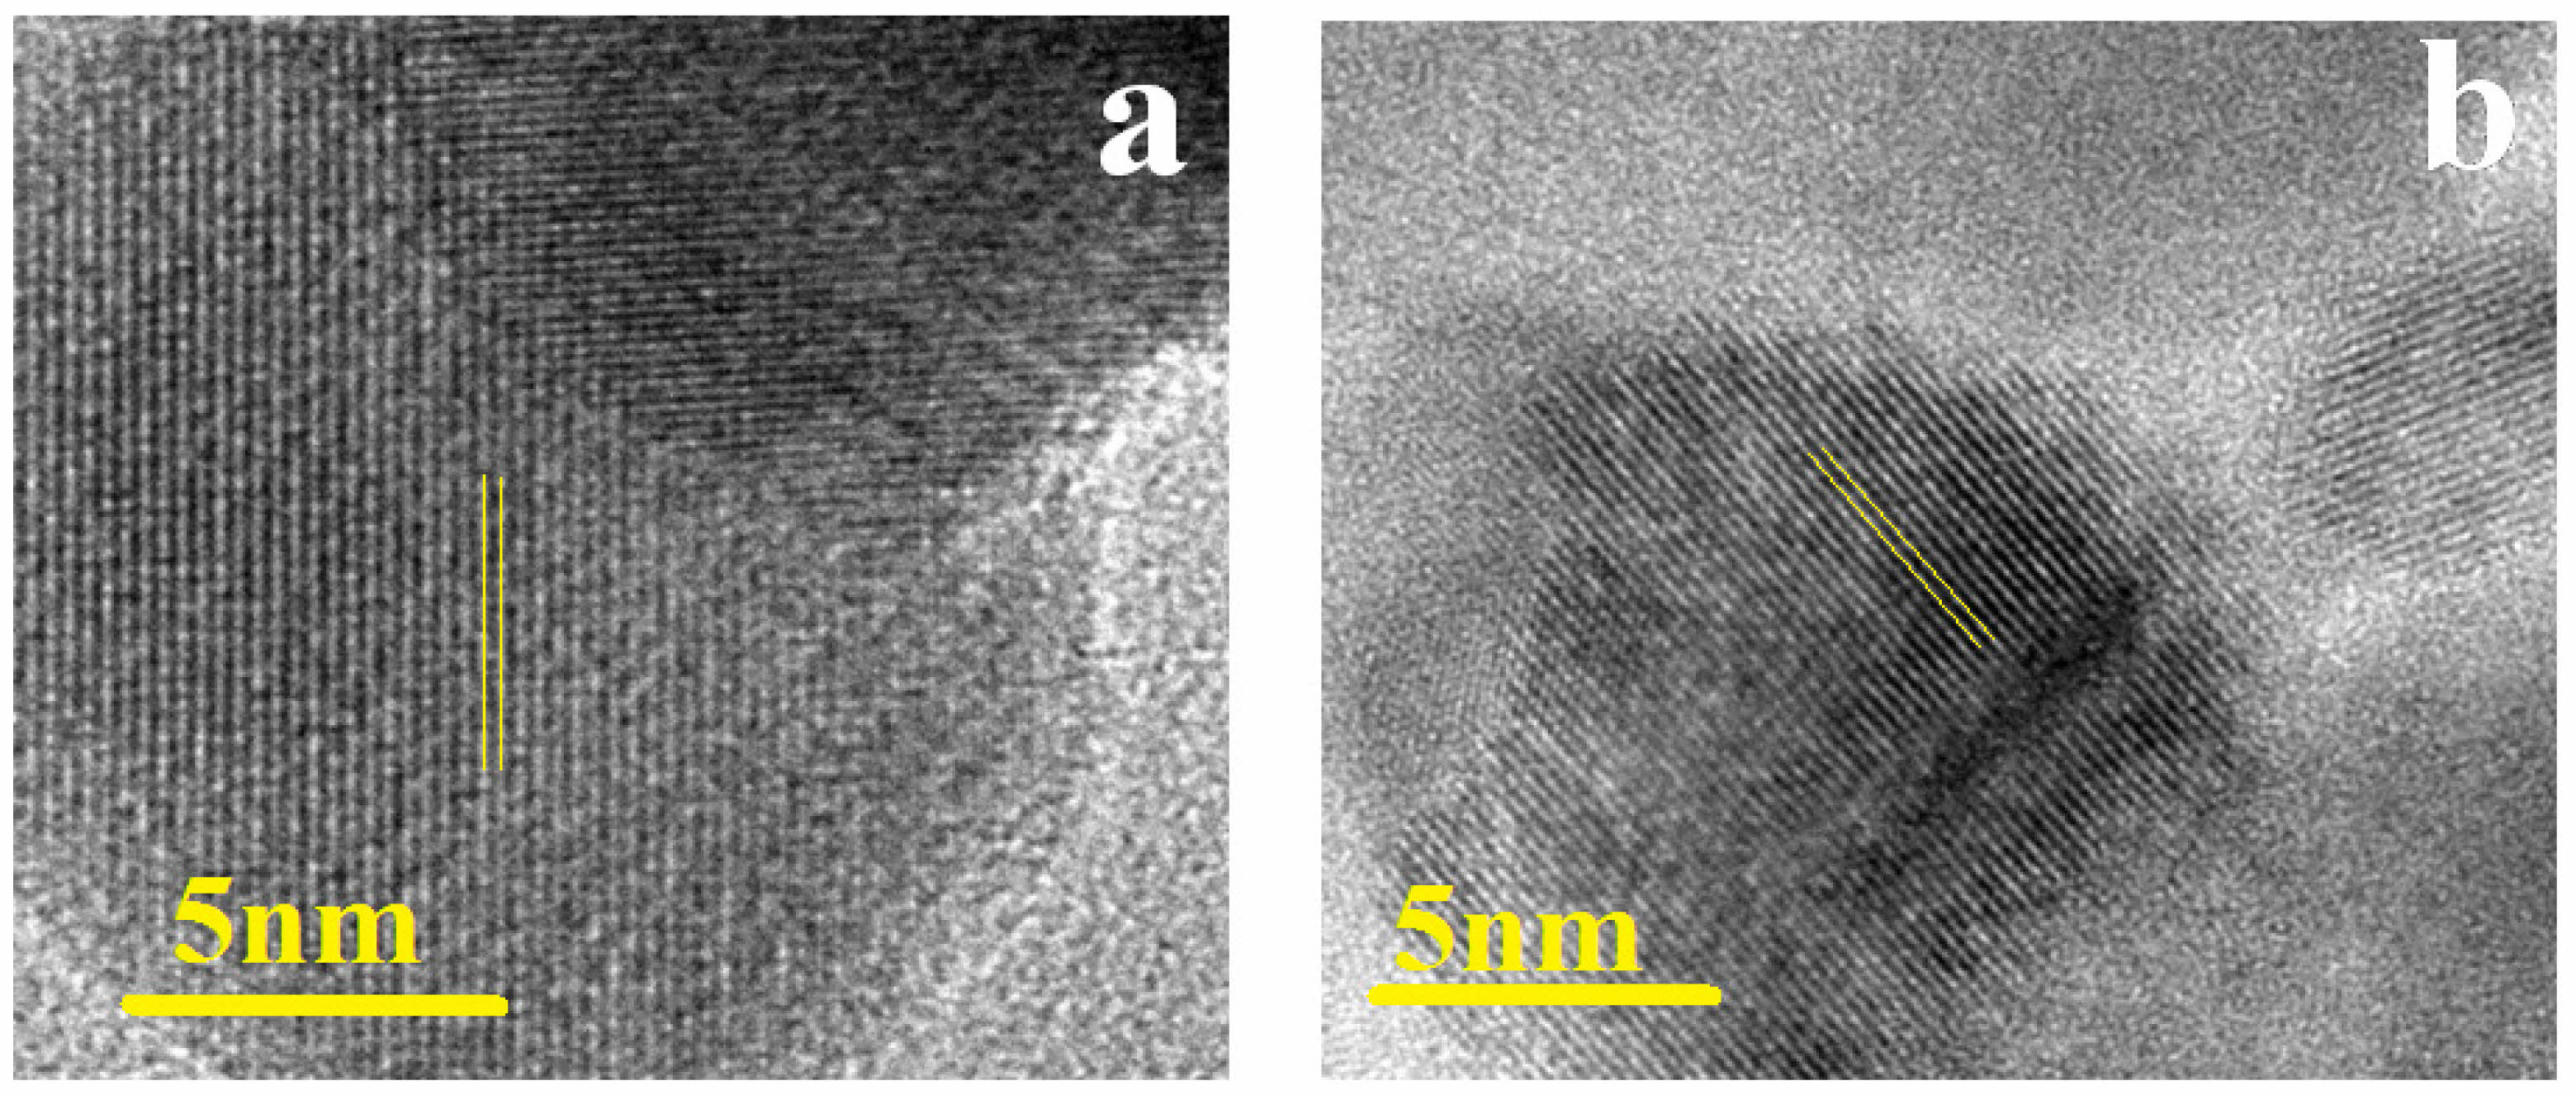
SEM and TEM are utilized to examine the morphology and structure of Sm0.5Ce0.5NiO3 and Y0.5Ce0.5NiO3 nano particles. Fig. 2 shows the study the morphology of of Sm0.5Ce0.5NiO3 and Y0.5Ce0.5NiO3 nanoparticles. The SEM image of pure of Sm0.5Ce0.5NiO3 and Y0.5Ce0.5NiO3 show agglomeration and porosity, which enhances the surface area of the sample, potentially improving its functional properties. The pore size ranged between 0.36 and 0.60 μm. The samples additionally demonstrate a pattern of reducing grain size with increasing dopant concentration. In structures doped with acceptor ions, these dopants tend to divide at the grain boundaries, forming barriers that avoid more grain growth during sintering. The phenomenon is because of interruptions in the ionic compensation process, which affects grain boundary mobility [44]. Fig. 3(a), (b) shows the TEM and SAED images of Sm0.5Ce0.5NiO3 and Y0.5Ce0.5NiO3 The samples demonstrate the highly mono dispersed spherical particles of approximately 10 nm. Fig. 4 shows The HR-TEM images confirmed that the the samples were highly crystalline. The inter-planar spacing of Sm0.5Ce0.5NiO3 and Y0.5Ce0.5NiO3 Samples have been measured at 0.31 nm, which corresponds to the (111) plane of JCPDS No.75-0162. The HRTEM images of Sm0.5Ce0.5NiO3 and Y0.5Ce0.5NiO3 show that the prepared materials are highly crystalline, as lattice fringes are clearly visible. The SAED patterns of Sm0.5Ce0.5NiO3 and Y0.5Ce0.5NiO3 the presence of discontinuous diffraction rings in different orientations confirms the samples' polycrystalline structure [45].
|
Fig. 1 X-ray diffraction patterns of Sm0.5Ce0.5NiO3 and Y0.5Ce0.5NiO3. |
|
Fig. 2 SEM micrographs of Sm0.5Ce0.5NiO3 and Y0.5Ce0.5NiO3. |
|
Fig. 3 (a), (b) TEM and SAED images of Sm0.5Ce0.5NiO3 and Y0.5Ce0.5NiO3. |
|
Fig. 4 (a), (b) HRTEM images of Sm0.5Ce0.5NiO3 and Y0.5Ce0.5NiO3. |
|
Table 1 mmarizes structural parameters from XRD analysis of Sm0.5Ce0.5NiO3 and Y0.5Ce0.5NiO3. |
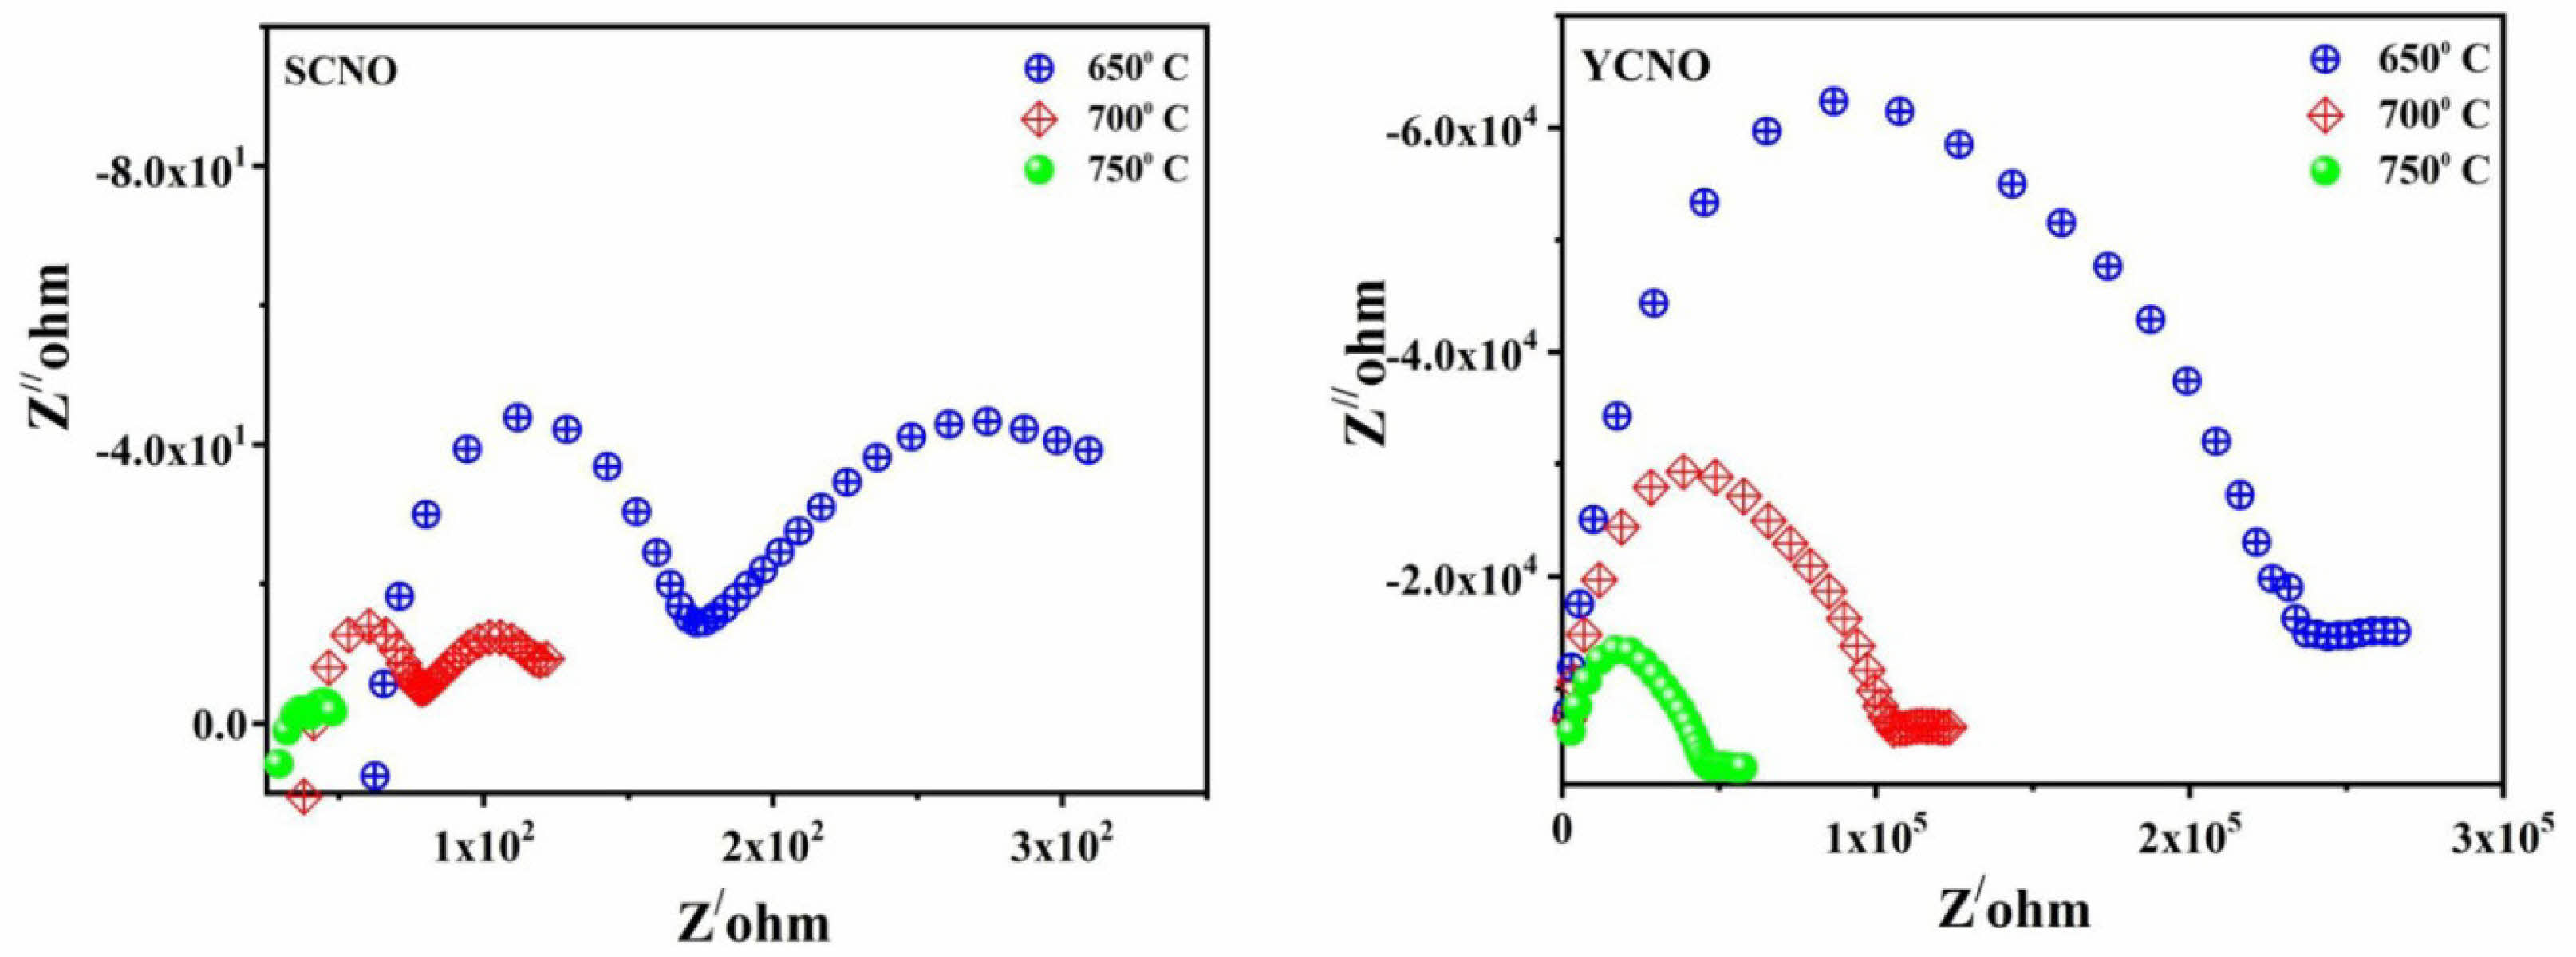
Impedance measurements have been employed to Study the fundamental conduction mechanisms and determine whether the conductivity in both doped and undoped samples is predominantly electronic, ionic, or a combination of both. The complex impedance, denoted as Z, is defined by the formula:

Where Z' represents the real part of impedance and Z'' is the imaginary part. The technique facilitates a comprehensive analysis of frequency-dependent electrical behaviour, offering helpful information into the bulk, grain boundary, and interfacial contributions to the material's generally electrical conductivity. Impedance spectroscopy was utilized for determining the total conductivity of perovskite samples in an extensive frequency range (50 Hz to 10 MHz) and temperature range (30 °C to 750 °C) in an air atmosphere.Complex impedance spectroscopy (CIS) was utilized to generate Cole–Cole plots (Nyquist diagrams) for both doped and undoped samples. These plots provided insights into the conduction behavior, enabling the separation and analysis of bulk, grain boundary, and interfacial contributions to the electrical properties of the materials [39]. The complex impedance representation (Z″ versus Z′) for this plot is presented in Fig. 5. For Sm0.5Ce0.5NiO3 and Y0.5Ce0.5NiO3 samples at various temperatures In general, the impedance spectra usually demonstrate two separate semicircular arcs. The high-frequency semicircle is usually attributed to the bulk response of solid electrolyte, whereas the intermediate-frequency arc is associated with oxygen ion blocking at internal interfaces such as grain boundaries, insulating impurity phases, and other micro structural defects such as pores and cracks. A third semicircle may appear at low frequencies, indicating electrode reaction processes. The observed spectra were analyzed quantitatively using an equivalent circuit model. This model included an electrode resistance in series with two parallel Ri-CPEi (constant phase element) sub-circuits that represented the bulk and grain boundary contributions, respectively.

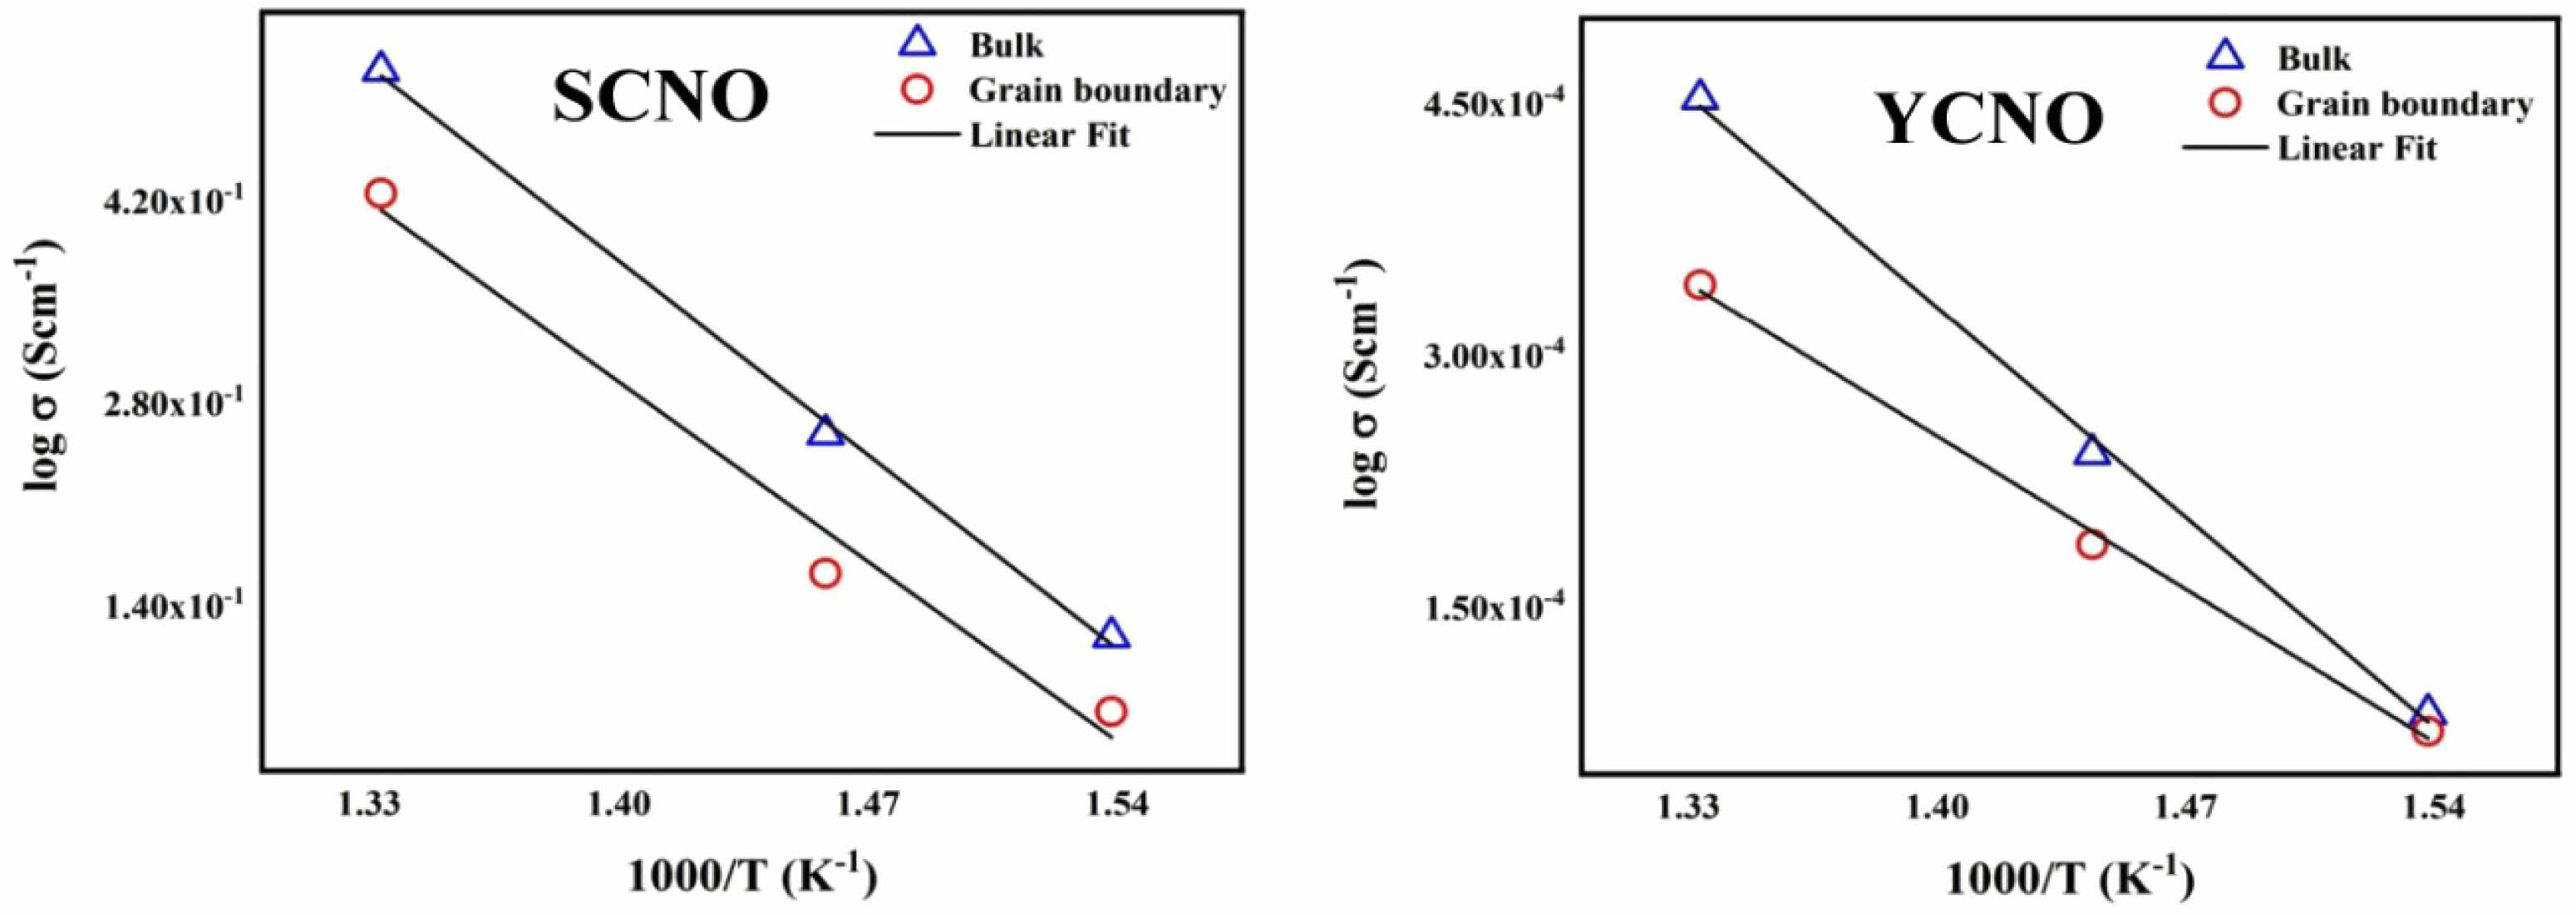
In the equation provided, Rb represents resistance, l stands for thickness, and A represents area. Total conductivity is calculated based on these parameters. the electrical conductivities, σb and σgb, derived from the impedance spectra's high-frequency (bulk) and intermediate-frequency (grain boundary) regions, respectively. Fig. 6 shows log σT is plotted against 1000/T. From these plots, the activation energies were determined. The results reveal that the grain boundary conductivity exhibits a higher activation energy compared to the bulk conductivity. This relationship was consistent across different compositions and independent of the oxygen partial pressure. Furthermore, Fig. 5 illustrates the significant effect of yttrium and samarium doping on the activation energy associated with grain boundary conductivity. demonstrating its critical role in modifying the material's electrical properties. The activation energy of grain boundaries is consistently higher than that of the bulk, a trend commonly observed in ceramic materials. This phenomenon is typically attributed to the additional barriers to ion or electron movement at the grain boundary regions, such as defects, impurities, and variations in crystal orientation, which hinder conductivity more than in the bulk material [46]. The conductivities were measured at various temperatures, and the activation energy for conductivity was determined using the Arrhenius equation.

In this context, Ea represents the activation energy for conduction, KB is the Boltzmann constant, and T denotes the absolute temperature.
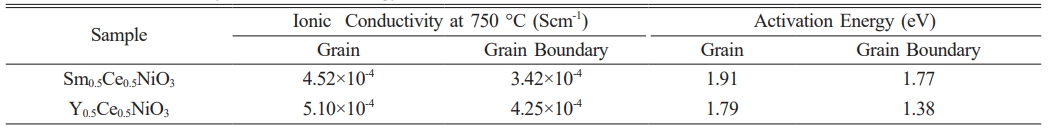
The activation energies for the bulk and grain boundary were determined to be 1.91 eV and 1.77 eV for Sm0.5Ce0.5NiO3 and 1.79 eV and 1.38 eV Y0.5Ce0.5NiO3, respectively, as illustrated in the insets of Fig. 6. The resulting activation energy values at 750 °C are presented in Table 2 These values align with the barrier energy required for the thermal migration of oxygen vacancies [47-49]. When compared to the grain conductivity of the corresponding sample, the grain boundary conductivity is slightly higher. The activation energy values for conduction strongly suggest that, at higher temperatures, ionic charge carriers, likely oxygen vacancies, dominate the The conduction process. In perovskite ferroelectric materials, oxygen vacancies have been identified as one of the primary mobile charge carriers [50]. The ionisation of oxygen vacancies primarily produces conduction electrons, which is commonly represented in Kroger-Vink notation [51]:
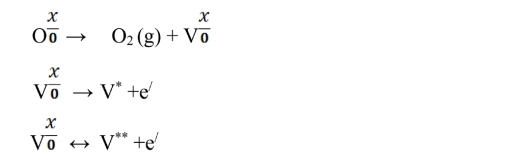
As a result, An excess electrons and vacancies in oxygen are created during the reduction reaction
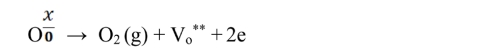
Electrons at trapped ion sites or vacancies in oxygen can become by heating triggered, which speeds up the electrically conductive procedures. Doubly charged oxygen vacancies (Vₒ••) are highly mobile charge carriers in perovskite ferroelectrics, contributing significantly to the overall conduction mechanism [52].
|
Fig. 5 Variation of real and imaginary parts of impedance at different temperatures for Sm0.5Ce0.5NiO3 and Y0.5Ce0.5NiO3 doped samples. |
|
Fig. 6 Variation of log σ vs. 1000/T for the Sm0.5Ce0.5NiO3 and Y0.5Ce0.5NiO3 doped samples |
|
Table 2 Ionic conductivity and activation energy for Sm0.5Ce0.5NiO3 and Y0.5Ce0.5NiO3. |
The Sol-gel method was employed to synthesize Sm0.5Ce0.5NiO3 and Y0.5Ce0.5NiO3 perovskite oxide, which was then utilized as a promising oxygen electrode. The XRD analysis revealed that the Sm0.5Ce0.5NiO3 and Y0.5Ce0.5NiO3 sample exhibited a cubic structure characterized by an fm3m space group no 225. SEM revealed the sintered pellets are porous in nature. Total conductivity of Sm0.5Ce0.5NiO3 and Y0.5Ce0.5NiO3 perovskite gets enhanced after doping. The dc conductivity measurements revealed that the discovered total conductivity is caused by grain and grain boundary. The activation energy decrees for doping Yttrium then Samarium this type of mixed conducting in SOFC applications this type of perovskite can function as an electrode.
- 1. P. Boldrin and N.P. Brandon, Nat. Catal. 2[7] (2019) 571-577.
-

- 2. Y. Zhou, Energy Reviews 1[1] (2022) 100001.
-
- 3. S. McIntosh and R.J. Gorte, Chem. Rev. 104[10] (2004) 4845-4866.
-
- 4. L. Lei, Z. Tao, X. Wang, J.P. Lemmon, and F. Chen, J. Mater. Chem. A 5[44] (2017) 22945-22951.
-
- 5. Z. Tao, B. Wang, G. Hou, and N. Xu, Int. J. Hydrogen Energy 39[28] (2014) 16020-16024.
-
- 6. A.K. Tareen, K. Khan, M. Iqbal, Y. Zhang, Z. Xie, A. Mahmood, N. Mahmood, J. Long, C. Li, and H. Zhang, J. Mater. Chem. C 10[47] (2022) 17812-17873.
-
- 7. A.B. Stambouli and E. Traversa, Renew. Sustain. Energy Rev. 6[5] (2002) 433-455.
-
- 8. J.D. Slater, T. Chronopoulos, R.S. Panesar, F.D. Fitzgerald, and M. Garcia, Int. J. Greenh. Gas Con. 91 (2019) 102818.
-
- 9. V. Cigolotti, M. Genovese, and P. Fragiacomo, Energies 14[16] (2021) 4963.
-
- 10. F. Ramadhani, M.A. Hussain, and H. Mokhlis, Processes 7[12] (2019) 950.
-
- 11. I. Staffell, D. Scamman, A.V. Abad, P. Balcombe, P. E. Dodds, P. Ekins, N. Shah, and K.R. Ward, Energy Environ. Sci. 12[2] (2019) 463-491.
-
- 12. S. Ahmadi, H. Ghaebi, and A. Shokri, Energy 186 (2019) 115899.
-
- 13. A. Cuneo, V. Zaccaria, D. Tucker, and A. Sorce, Appl. Energy 230 (2018) 855-864.
-
- 14. A. Hauch, R. Kongas, P. Blennow, A.B. Hansen, J.B. Hansen, B.V. Mathiesen, and M.B. Mogensen, Science 370[6513] (2020) eaba6118.
-
- 15. Z. Zakaria, Z. Awang Mat, S.H. Abu Hassan, and Y. Boon Kar, Int. J. Energy Res. 44[2] (2020) 594-611.
-
- 16. E.D. Wachsman and S.C. Singhal, Electrochem. Soc. Interface 18[3] (2009) 38.
-
- 17. S. Thakur, O.P. Pandey, and K. Singh, Solid State Ionics 268 (2014) 23-30.
-
- 18. E.D. Wachsman and K.T. Lee, Science 334[6058] (2011) 935-939.
-
- 19. S. Thakur, O.P. Pandey, and K.J. Singh, Ceram. Int. 40[10] (2014) 16371-16379.
-
- 20. C. Sun, R. Hui, and J. Roller, J. Solid State Electrochem. 14 (2010) 1125-1144.
-
- 21. S.B. Adler, Chem. Rev. 104[10] (2004) 4791-4844.
-
- 22. L.G. Tejuca, J.L.G. Fierro, and J.M.D. Tascon, Adv. Catal. 36 (1989) 237-328.
-
- 23. P.M. Woodward, Acta Crystallogr. B: Struct. Sci. 53[1] (1997) 32-43.
-
- 24. H. Zhu, P. Zhang, and S. Dai, ACS Catal. 5[11] (2015) 6370-6385.
-
- 25. R. Roy, J. Am. Ceram. Soc. 37[12] (1954) 581-588.
-
- 26. A.F. Sammells, R.L. Cook, J.H. White, J.J. Osborne, and R.C. MacDuff, Solid State Ionics 52[1-3] (1992) 111-123.
-
- 27. J. Richter, P. Holtappels, T. Graule, T. Nakamura, and L.J. Gauckler, Monatsh. fur Chem. 140 (2009) 985-999.
-
- 28. C. Moure and O. Pena, Prog. Solid State Chem. 43[4] (2015) 123-148.
-
- 29. R. Raffaelle, H.U. Anderson, D.M. Sparlin, and P.E. Parris, Phys. Rev. B 43[10] (1991) 7991.
-
- 30. W. Khan, A.H. Naqvi, M. Gupta, S. Husain, and R. Kumar, J. Chem. Phys. 135[5] (2011) 054501.
-
- 31. L.S. Zivkovic, V. Lair, O. Lupan, M. Cassir, and A. Ringuede, Acta Phys. Pol. A 120 (2011) 298-302.
-
- 32. T. Otake, H. Yugami, K. Yashiro, Y. Nigara, T. Kawada, and J. Mizusaki, Solid State Ionics 161[1-2] (2003) 181-186.
-
- 33. H. Inaba and H. Tagawa, Solid State Ionics 83[1-2] (1996) 1-6.
-
- 34. K. Yamashita, K.V. Ramanujachary, and M. Greenblatt, Solid State Ionics 81[1-2] (1995) 53-60.
-
- 35. Y. Liu, B. Li, X. Wei, and W. Pan, J. Am. Ceram. Soc. 91[12] (2008) 3926-3930.
-
- 36. S.F. Wang, C.T. Yeh, Y.R. Wang, and Y.C. Wu, J. Mater. Res. Technol. 2[2] (2013) 141-148.
-
- 37. Y. Yoo and N. Lim, J. Power Sources 229 (2013) 48-57.
-
- 38. P.B. Managutti, Y. Wen, T.C. Hansen, V. Dorcet, S. Paofai, P. Briois, K. Huang, and M. Bahout, ACS Appl. Energy Mater. 7[9] (2024) 3831-3840.
-
- 39. S. Prakash, B. Madhavan, A. Suvitha, C. Kumar Shatheesh, A. Steephen, and J. Pawar, Mater. Res. Innov. 28[7] (2024) 579-588.
-
- 40. L.D. Jadhav, M.G. Chourashiya, A.P. Jamale, A. U. Chavan, and S.P. Patil, J. Alloys Compd. 506[2] (2010) 739-744.
-
- 41. N. Sutradhar, A. Sinhamahapatra, S. Pahari, M. Jayachandran, B. Subramanian, H.C. Bajaj, and A.B. Panda, J. Phys. Chem. C 115[15] (2011) 7628-7637.
-
- 42. D. Jampaiah, K.M. Tur, S.J. Ippolito, Y.M. Sabri, J. Tardio, S.K. Bhargava, and B.M. Reddy, RSC Adv. 3[31] (2013) 12963-12974.
-
- 43. K.M. Batoo, E.H. Raslan, Y. Yang, S.F. Adil, M. Khan, A. Imran, and Y. Al-Douri, AIP Adv. 9[5] (2019) 055202.
-
- 44. V. Paunovic, Z. Prijic, and V.V. Mitic, Sci. Sinter. 54[1] (2022) 81-91.
-
- 45. M.K. Chinnu, K.V. Anand, R.M. Kumar, T. Alagesan, and R. Jayavel, Mater. Lett. 113 (2013) 170-173.
-
- 46. T. Van Dijk, and A.J. Burggraaf, Phys. Status Solidi A 63[1] (1981) 229-240.
-
- 47. K.H. Kim, J.Y. Gu, H.S. Choi, G.W. Park, and T.W. Noh, Phys. Rev. Lett. 77[9] (1996) 1877.
-
- 48. A. Molak, M. Paluch, S. Pawlus, J. Klimontko, Z. Ujma, and I. Gruszka, J. Phys. D: Appl. Phys. 38[9] (2005) 1450.
-
- 49. S. Rachna, S. Bhattacharyya, and S.M. Gupta, J. Phys. Chem. Solids 69[4] (2008) 822-829.
-
- 50. A. Munpakdee, K. Pengpat, J. Tontrakoon, and T. Tunkasiri, Smart Mater. Struct. 15[5] (2006) 1255.
-
- 51. M. Vijayakumar, S. Selvasekarapandian, M.S. Bhuvaneswari, G. Hirankumar, G. Ramprasad, R. Subramanian, and P.C. Angelo, Physica B 334[3-4] (2003) 390-397.
-
- 52. R. Bounouioua, T. Bezzi, S.E. Berama, B. Boudine, and M.T. Benlahrache, J. Ceram. Process. Res. 20[2] (2019) 187-197.
-
 This Article
-
2025; 26(3): 526-533
Published on Jun 30, 2025
- 10.36410/jcpr.2025.26.3.526
- Received on Mar 22, 2025
- Revised on Apr 30, 2025
- Accepted on May 15, 2025
Services
- Abstract
introduction
materials and method
results and discussion
impedance spectral investigation
conclusions
- References
- Full Text PDF
Shared
Correspondence to
- Huijuan Mu
-
Zhumadian Preschool Education College, Zhumadian 463003, Henan, China
Tel : 13939653290 Fax: 03963690397 - E-mail: mhjrnys8036765@163.com
Clean-Energy Research Institute(CRI), Hanyang University, 222, Wangsimni-ro, Seongdong-gu, Seoul, 04763, Korea
E-mail: jcpr@hanyang.ac.kr