


- Next-generation circular waste biorefineries based on biogas utilization using renewable energy: Process composition and economic analysis
Okkyoung Choia, Amith Abrahamb, Seongcheol Kangb,c, Saehee Leec, Jung Han Parkd and Byoung-In Sangb,c,*
aEco Lab Center, SK Ecoplant, 51, Jong-ro, Jongno-gu, Seoul 04763, Republic of Korea
bClean-Energy Research Institute, Hanyang University, 222 Wangsimni-ro, Seongdong- gu, Seoul 04763, Republic of Korea
cDepartment of Chemical Engineering, Hanyang University, 222 Wangsimni-ro, Seongdong-gu, Seoul 04763, Republic of Korea
dNational Research Facilities and Equipment Center, Korea Basic Science Institute, 169-148 Gwahak-ro, Yuseong-gu, Daejeon 34133, Republic of KoreaaThis article is an open access article distributed under the terms of the Creative Commons Attribution Non-Commercial License (http://creativecommons.org/licenses/by-nc/4.0) which permits unrestricted non-commercial use, distribution, and reproduction in any medium, provided the original work is properly cited.
The integration of waste-to-energy processes with CO₂ reduction and renewable energy storage was investigated. Here, we demonstrate a waste biorefinery that utilize biogas, which was previously used only for thermal energy. High value-added chemicals such as succinic acid, polyhydroxybutyrate (PHB) and synthetic natural gas can be produced by industrial microorganism from food waste and renewable energy. Water electrolysis facilities accounted for a significant portion of the investment cost. However, the rising demand for bioplastics helped shorten the payback period despite their relatively high price. The quantity and economic feasibility of final products changed according to the order of the process, and the possibility of circular waste biorefinery based on the use of biogas using renewable energy was suggested.
Keywords: Power-to-gas, Waste-to-energy, Biogas, Value-added products, Techno-economic analysis.
Over 105 billion tonnes of organic waste—including food, agricultural, and industrial waste—are generated globally each year, releasing greenhouse gases (GHG) into the atmosphere as they decompose. Effective management and recycling of these bioresources could reduce global GHG emissions by up to 10% by 2030 [1]. As part of this global effort, South Korea has initiated strategic measures to enhance the management of organic waste, with a national target to increase biogas production by 36% through anaerobic digestion by the year 2027 [2]. Anaerobic digestion has evolved from a waste treatment method to an energy production process and further to the production of value-added products [3]. Direct methanation of biogas is one of the long-term energy storage methods that capture CO2 from biogas and use hydrogen from water electrolysis using renewable energy [4-6]. Electro-assisted biosynthesis and biomolecule conversion are emerging technologies that integrate electrical energy with biological processes to enhance the efficiency, sustainability, and selectivity of biochemical reactions [7, 8].
Water electrolysis is a method of converting electrical energy into chemical energy. The electrons are stored in the chemical bonds of hydrogen and can be used as a fuel or reused as electrical energy when needed. The four types of water electrolyzers are alkaline, PEM (polymer electrolyte membrane), AEM (anion exchange membrane, currently at the lab scale), and solid oxide (also at the lab scale). In order to produce hydrogen from renewable energy, it is still necessary to reduce the cost of the electrolysis facility [9].
Biological methanation of biogas can use a mixed gas containing H2S and NH4 from biogas (high tolerance of impurities) and has the advantage of operating at a lower temperature and pressure than chemical methanation [10]. The resulting methane concentration is greater than 95% and can be inject into existing natural gas pipelines [11]. Thermophilic hydrogenotrophic methanation (THM, 60-65 ℃) is primarily applied because of its faster conversion rate than mesophilic methanation [12]. Several pilot plants regarding THM were tested such as Electrochaea in the BioCat project [13], Microbenergy in the BioPower2Gas project [14], and Copernicus P2X project. The economic analysis of THM indicated that the water electrolysis process contributes the most to the overall cost of biomethanation production [10]. However, carbon dioxide of biogas also can be converted into methane without the emission from the process and high methane content can be used for transportation fuels like natural gas [15].
Carbon dioxide from biogas can be used to produce succinic acid through the valorization of organic waste. Succinic acid is one of the promising platform chemicals and used as a precursor for polymer, resins, and bio-based succinic acid from renewable resources is attracting attention. Actinobacillus succinogenes [16], Succinivibrio dextrinosolvens [17],and Basfia succiniciproducens [18], and Mannheimia succiniciproducens [19] can produce succinic acid as a major end product via fermentation fixating CO2 as a second substrate. They are capnophilic (CO2-loving) bacteria and heterotrophs with faster growth and CO2 fixation rate than autotrophic microorganisms. Based on the recently reported succinic acid productivity, 21.3 g/ L/h [20], the CO2 fixation rate is much faster at 4.41 Nm3 CO2/m3/h compared to 0.001-0.032 Nm3 CO2/m3/h by microalgae [21]. Various organic wastes were tested for succinic acid production [22], and crude glycerol, a major byproduct of biodiesel production, was one of economical feedstocks [23]. The life cycle assessment analyzed that the selling price for succinic acid production from glycerol was $1.6-1.9 per kg, while production from corn stover was $1.7-2.0 per kg [23].
Oxygen produced in water electrolysis can be used to produce polyhydroxybutyrate (PHB) using methane-oxidizing bacteria. There are two pathways for PHB production using methane: the ribulose monophosphate pathway (type I) and the serine pathway (type II) (Table 1). Type I methylotrophs lack the complete TCA cycle and require the energy of acetyl-CoA, a key intermediate for PHB production while Type II need greater reducing power for serine cycle [24]. PHB accumulates during the stationary phase of growth under nutrient-limited condition, such as nitrogen, phosphate, oxygen deficiency [25]. The theoretical conversion efficiency from methane to PHB is 67% (Eq. 1) [26].

Where FPH2 is reduced flavoprotein [26]. A large fraction of CH4 and O2 consumed has to be converted to CO2 to generate reducing power such as NADH2 and FPH2 in type II methanotroph [26]. Methylosinus trichosporium [27], Methylocystis parvus [28], and Methylocystis hirsuta [29] are type II methanotrophs that use methane to produce PHB. The PHB price from methane was reported $4.1~$6.8/kg based on 100,000 t/a PHB production facility [29].
In this study, a combined system integrating biological methanation, succinic acid production, and PHB production for biogas valorization was investigated and simulated using SuperPro Designer software. The technology economics associated with each process were evaluated and the return on investment was compared using payback time.
The process was simulated using SuperPro Designer? (Version 12) software by Intelligen, Inc. The total capital investment was calculated as shown in Table S1.
Anaerobic digestion (AD)
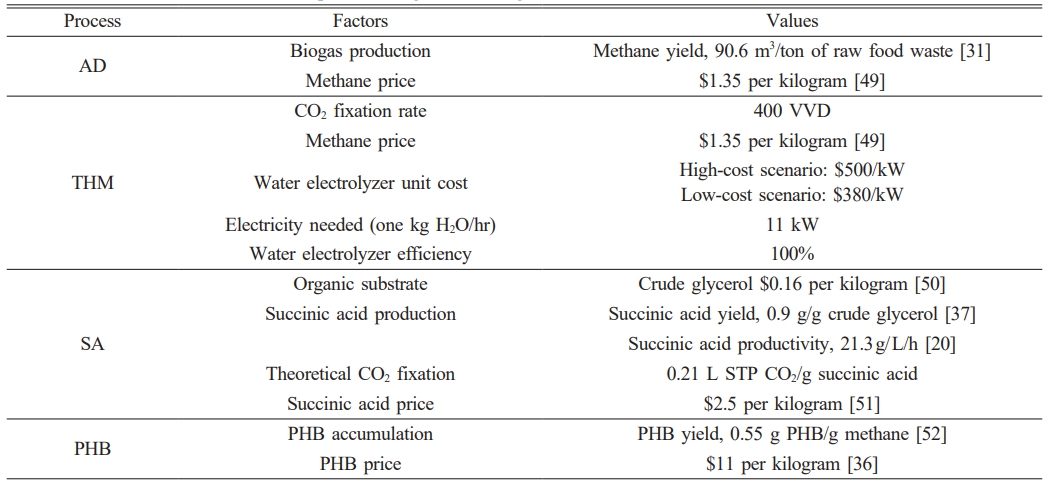
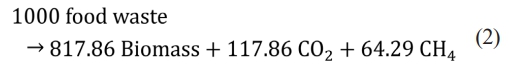
Anaerobic digestion is a method of recycling food waste into products such as animal feed and compost. AD installation cost was not included in the calculation because this study was based on adding another process to value the existing AD installation. In the Republic of Korea, the standard biogas production value is 100 m³ per ton of food waste. In this study, 90.6 m3 methane production per ton of raw food waste was used [30] (Table 1). The reaction mass stoichiometry of AD is Eq. (2). The daily throughput was calculated as 50 tons of raw food waste.
Thermophilic hydrogenotrophic methanation (THM)
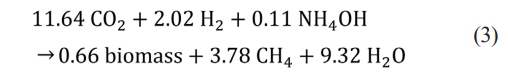
Thermophilic hydrogenotrophic methanation (THM) has been extensively studied because it has a faster methanation rate than mesophilic methanation at the pilot scale. The main construction cost is the facility of water electrolysis [32]. The cost of water electrolysis plant was estimated at $500/kW and the power was calculated at 5 kW per 1 Nm3 H2/h production. A techno-economic assessment of power-to-gas estimated a payback period of approximately 15 years [32]. The cost of water electrolysis and electrical consumption was not included in the calculation because it is premised on using the AD-THM system and using the surplus electricity generated from renewable energy. For the reaction mass stoichiometry, Eq. (3) was used with reference to the previously reported reaction eq. [33].
The conversion rate of carbon dioxide to methane was calculated to be 400 VVD (CH4 vol. per working vol. per day), which was based on previously reported values in pilot plants. CO2 collected from nearby plants can be converted into methane in THM such as AD-PHB-SA-THM system (Fig. 1b).
Methanotrophic polyhydroxybutyrate (PHB) production
One method of valorizing biogas is the production of PHB by methanotrophs, which utilize methane as a feedstock. PHB is a secondary metabolite, and the process is divided into two phases: growth and PHB production. PHB accumulates in nutrient deficiencies. Since higher PHB production comes from high biomass concentration, the modeling was performed according to Eq. (4) of the growth reaction.
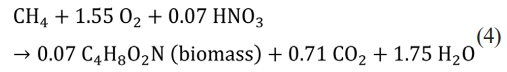
Oxygen requires 4 g per gram of methane (Eq. 4), and it is supplied as a product of water electrolysis. PHB-accumulating cells can be hydrolyzed with cell lysing agent such as sodium hypochlorite (NaOCl) [34]. PHB is collected by resolving in chloroform [35] and obtained after vaporizing solvent (Fig. 2). The selling price of PHB for the calculation of revenues was applied at $11/kg with reference to the reported value of $8-12/kg [36].
Succinic acid (SA) production
Succinic acid, a four-carbon dicarboxylic acid, is produced by combining with CO2 and three carbons chemicals (C3). Succinic acid can be used as a building block for bioplastics such as PBS (polybutylene succinate). A new approach to capture CO2 from biogas has been reported. SA production is a heterotrophic pathway and requires organic substrates. Among previously tested substrates, the crude glycerol was selected and reaction mass stoichiometry was constructed using 0.9 g succinic acid/g crude glycerol [37] (Eq. 5). It has been reported that approximately 10 pounds of crude glycerol are produced for every 100 pounds of biodiesel produced [38].
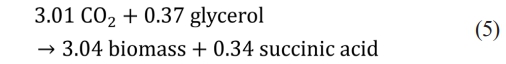
One mol of carbon dioxide is captured per one mol of succinic acid production. The price of succinic acid used in the model was set at $0.47/kg [39]. For the purification of succinic acid, a method of precipitating succinic acid with calcium ions supplied as Ca (OH)2 was used (Fig. 2).
|
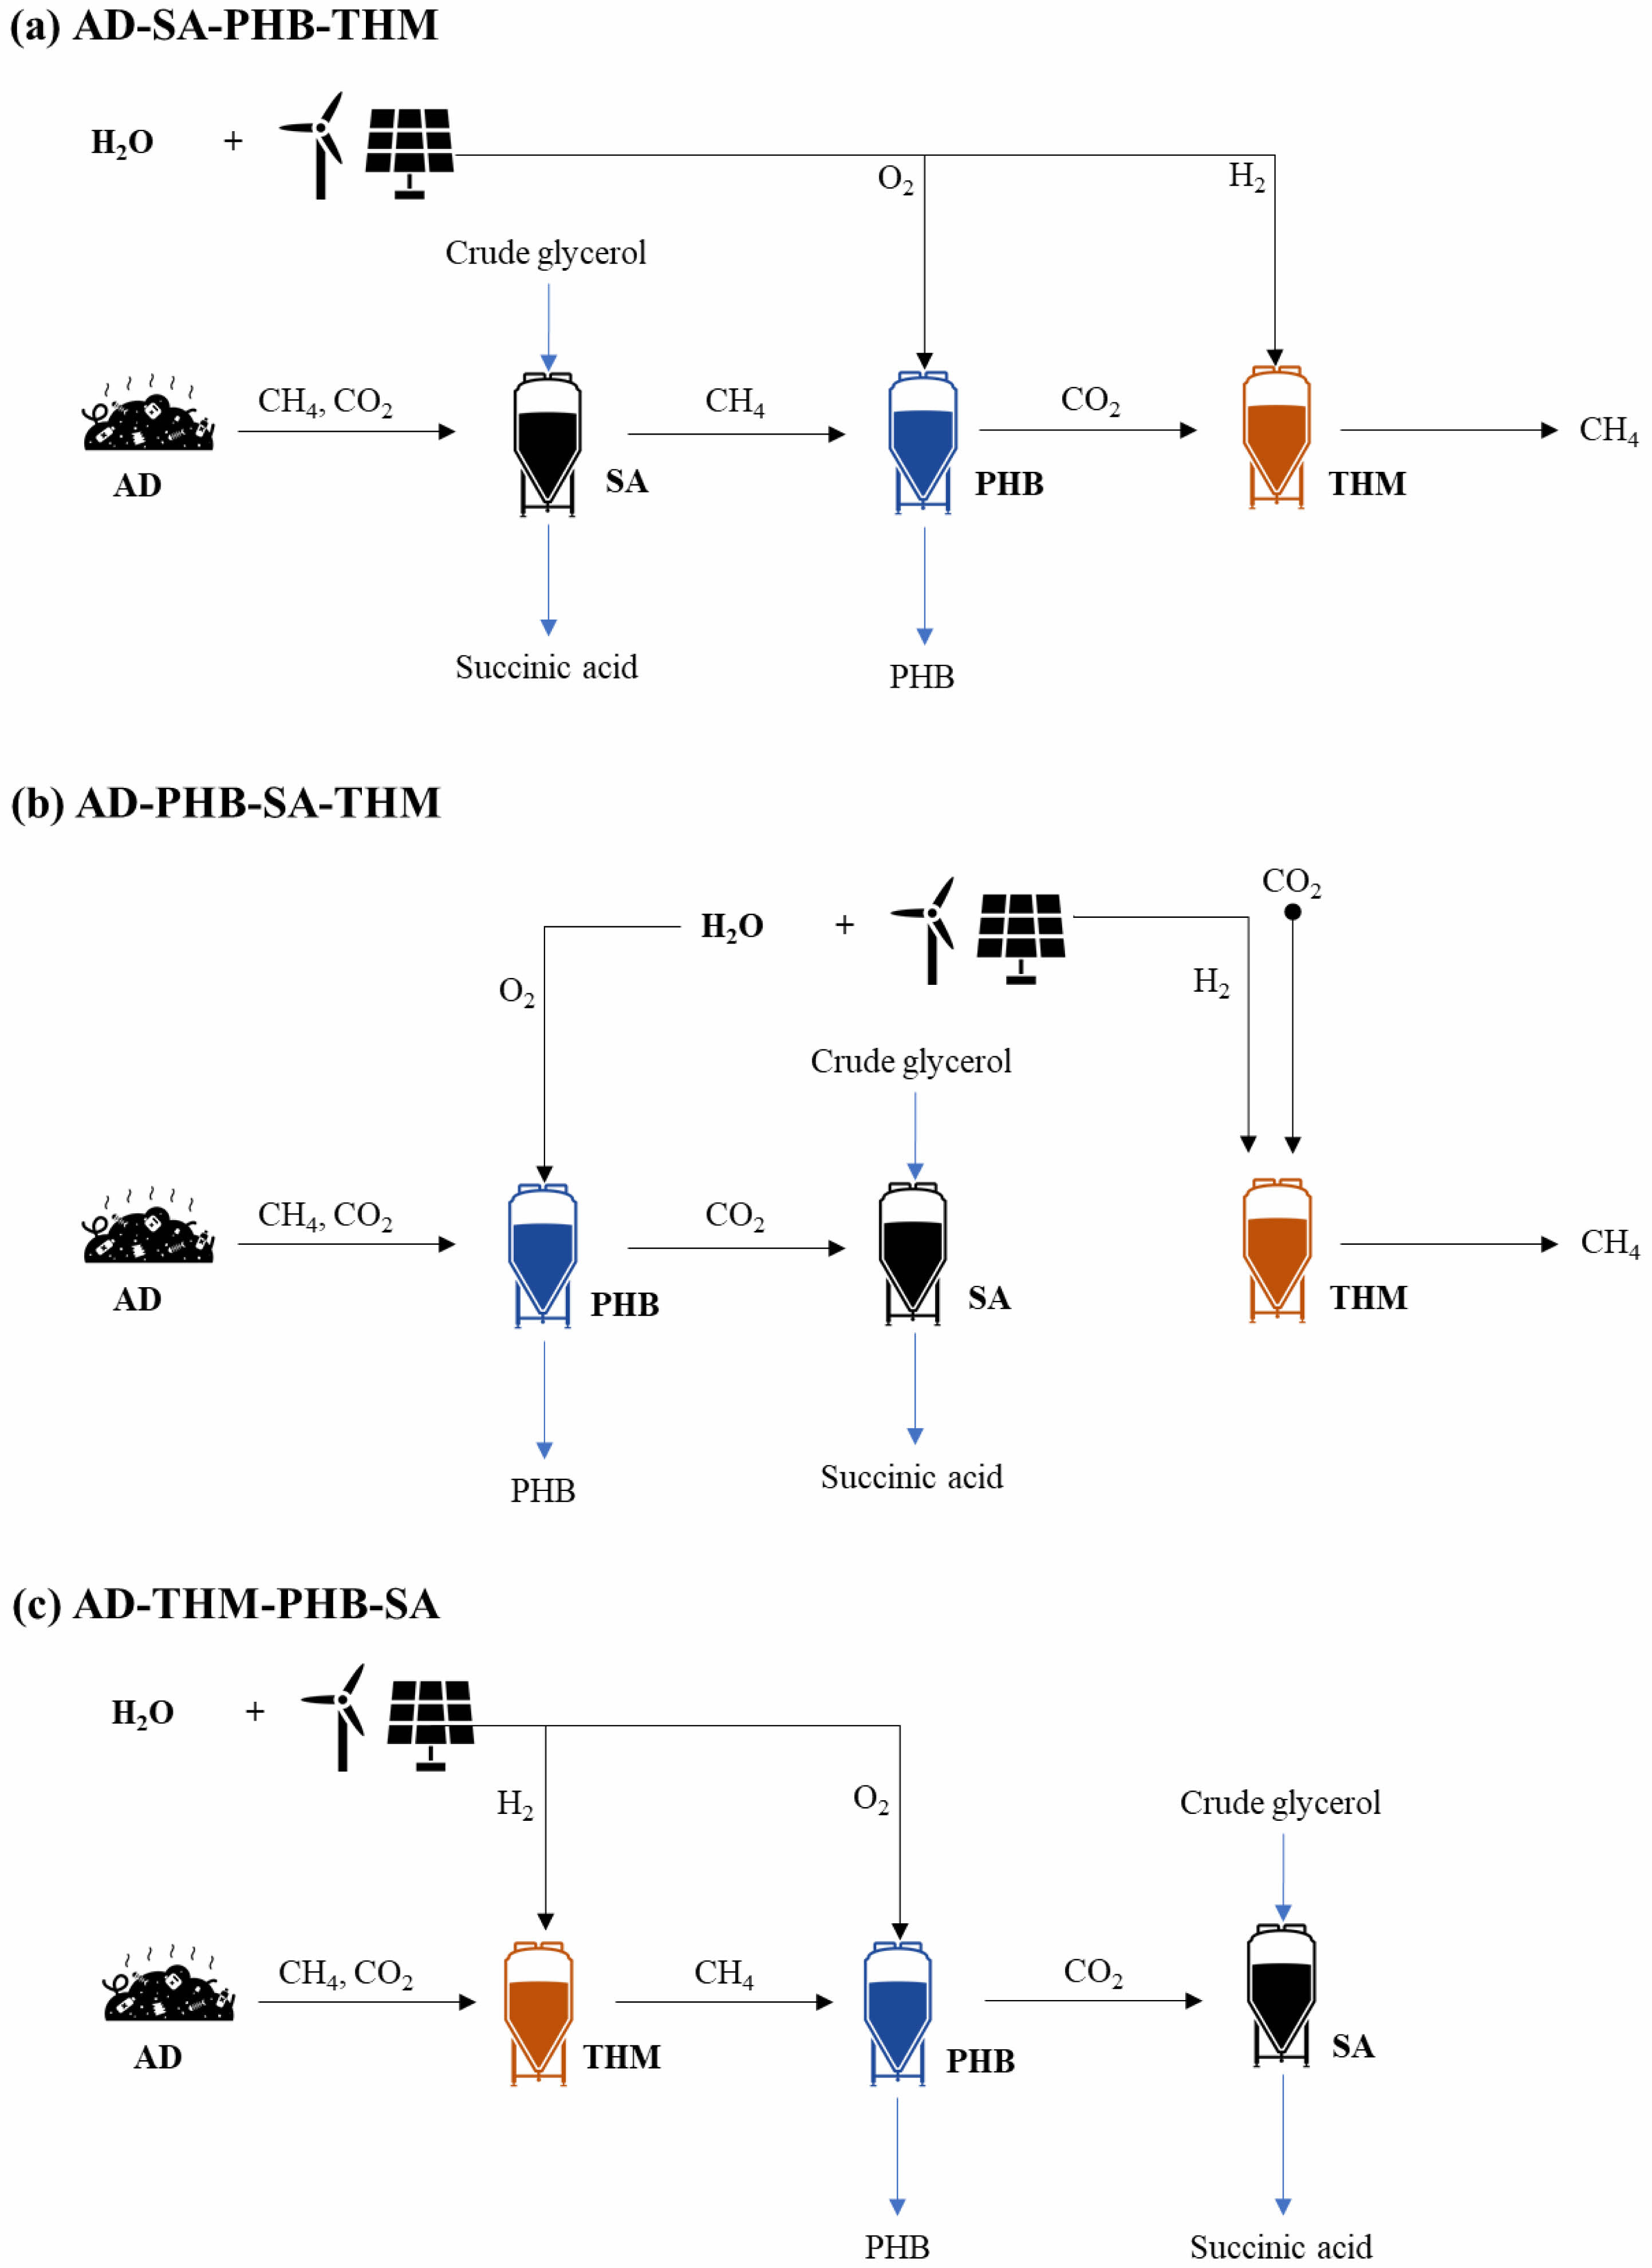
Fig. 1 Synthetic natural gas, PHB, and succinic acid production using biogas from food waste. |
|
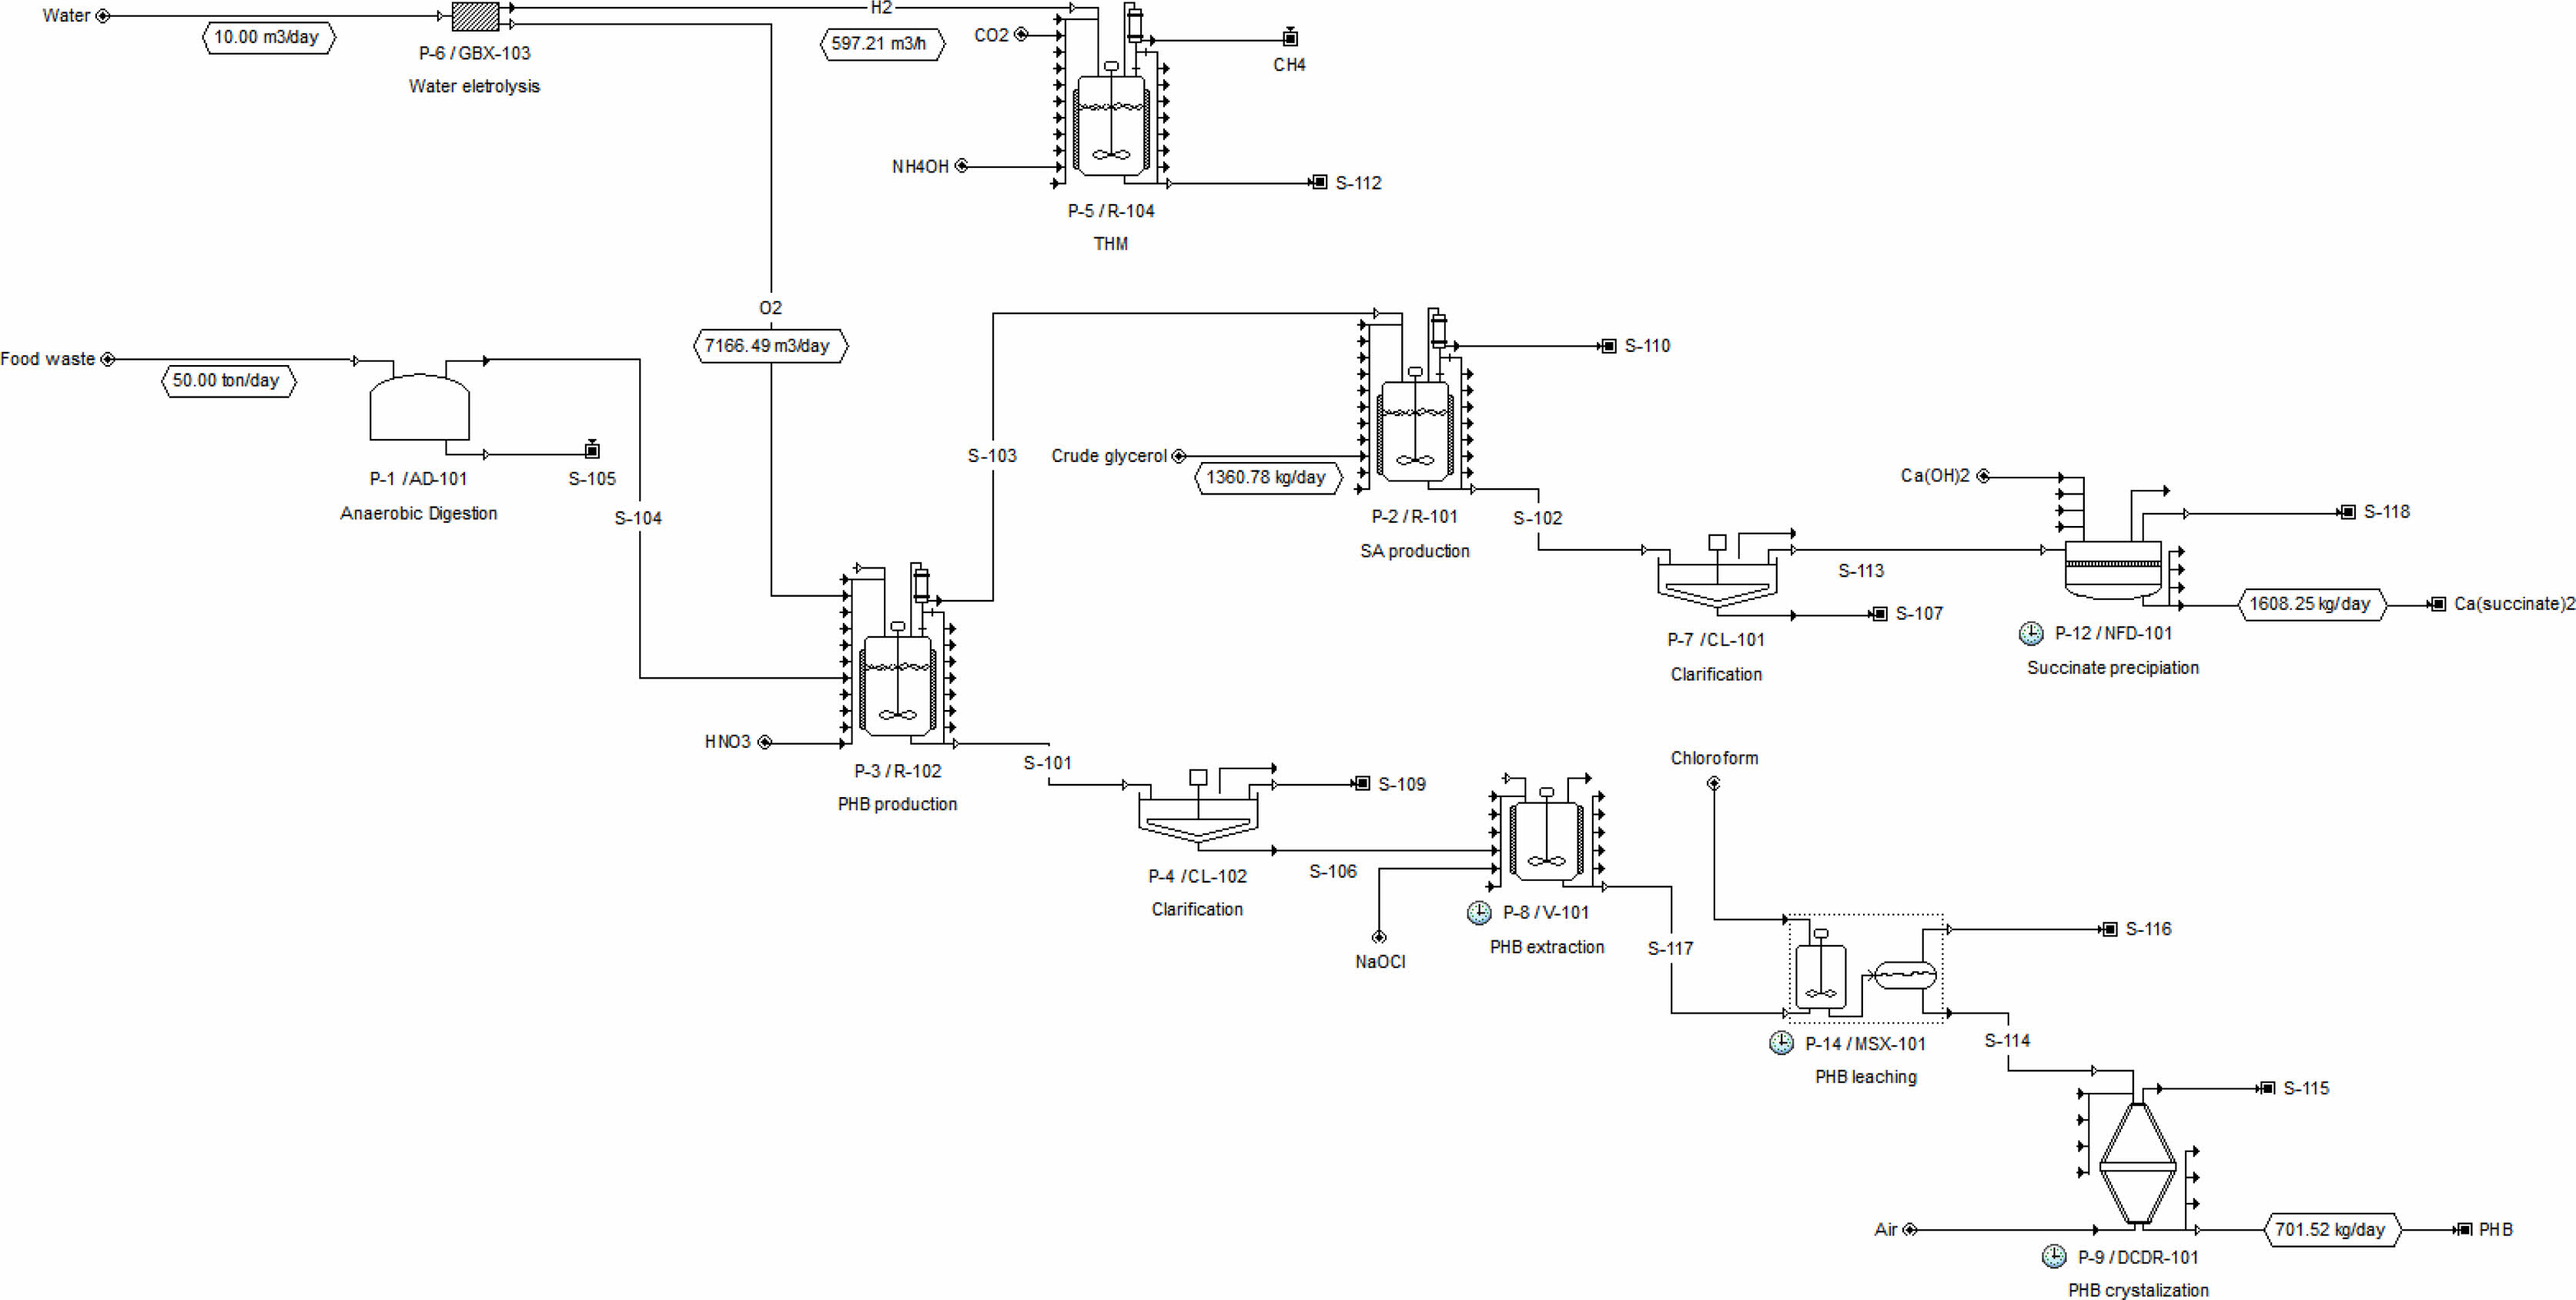
Fig. 2 Process flow of synthetic natural gas, PHB, and succinic acid from food waste AD. |
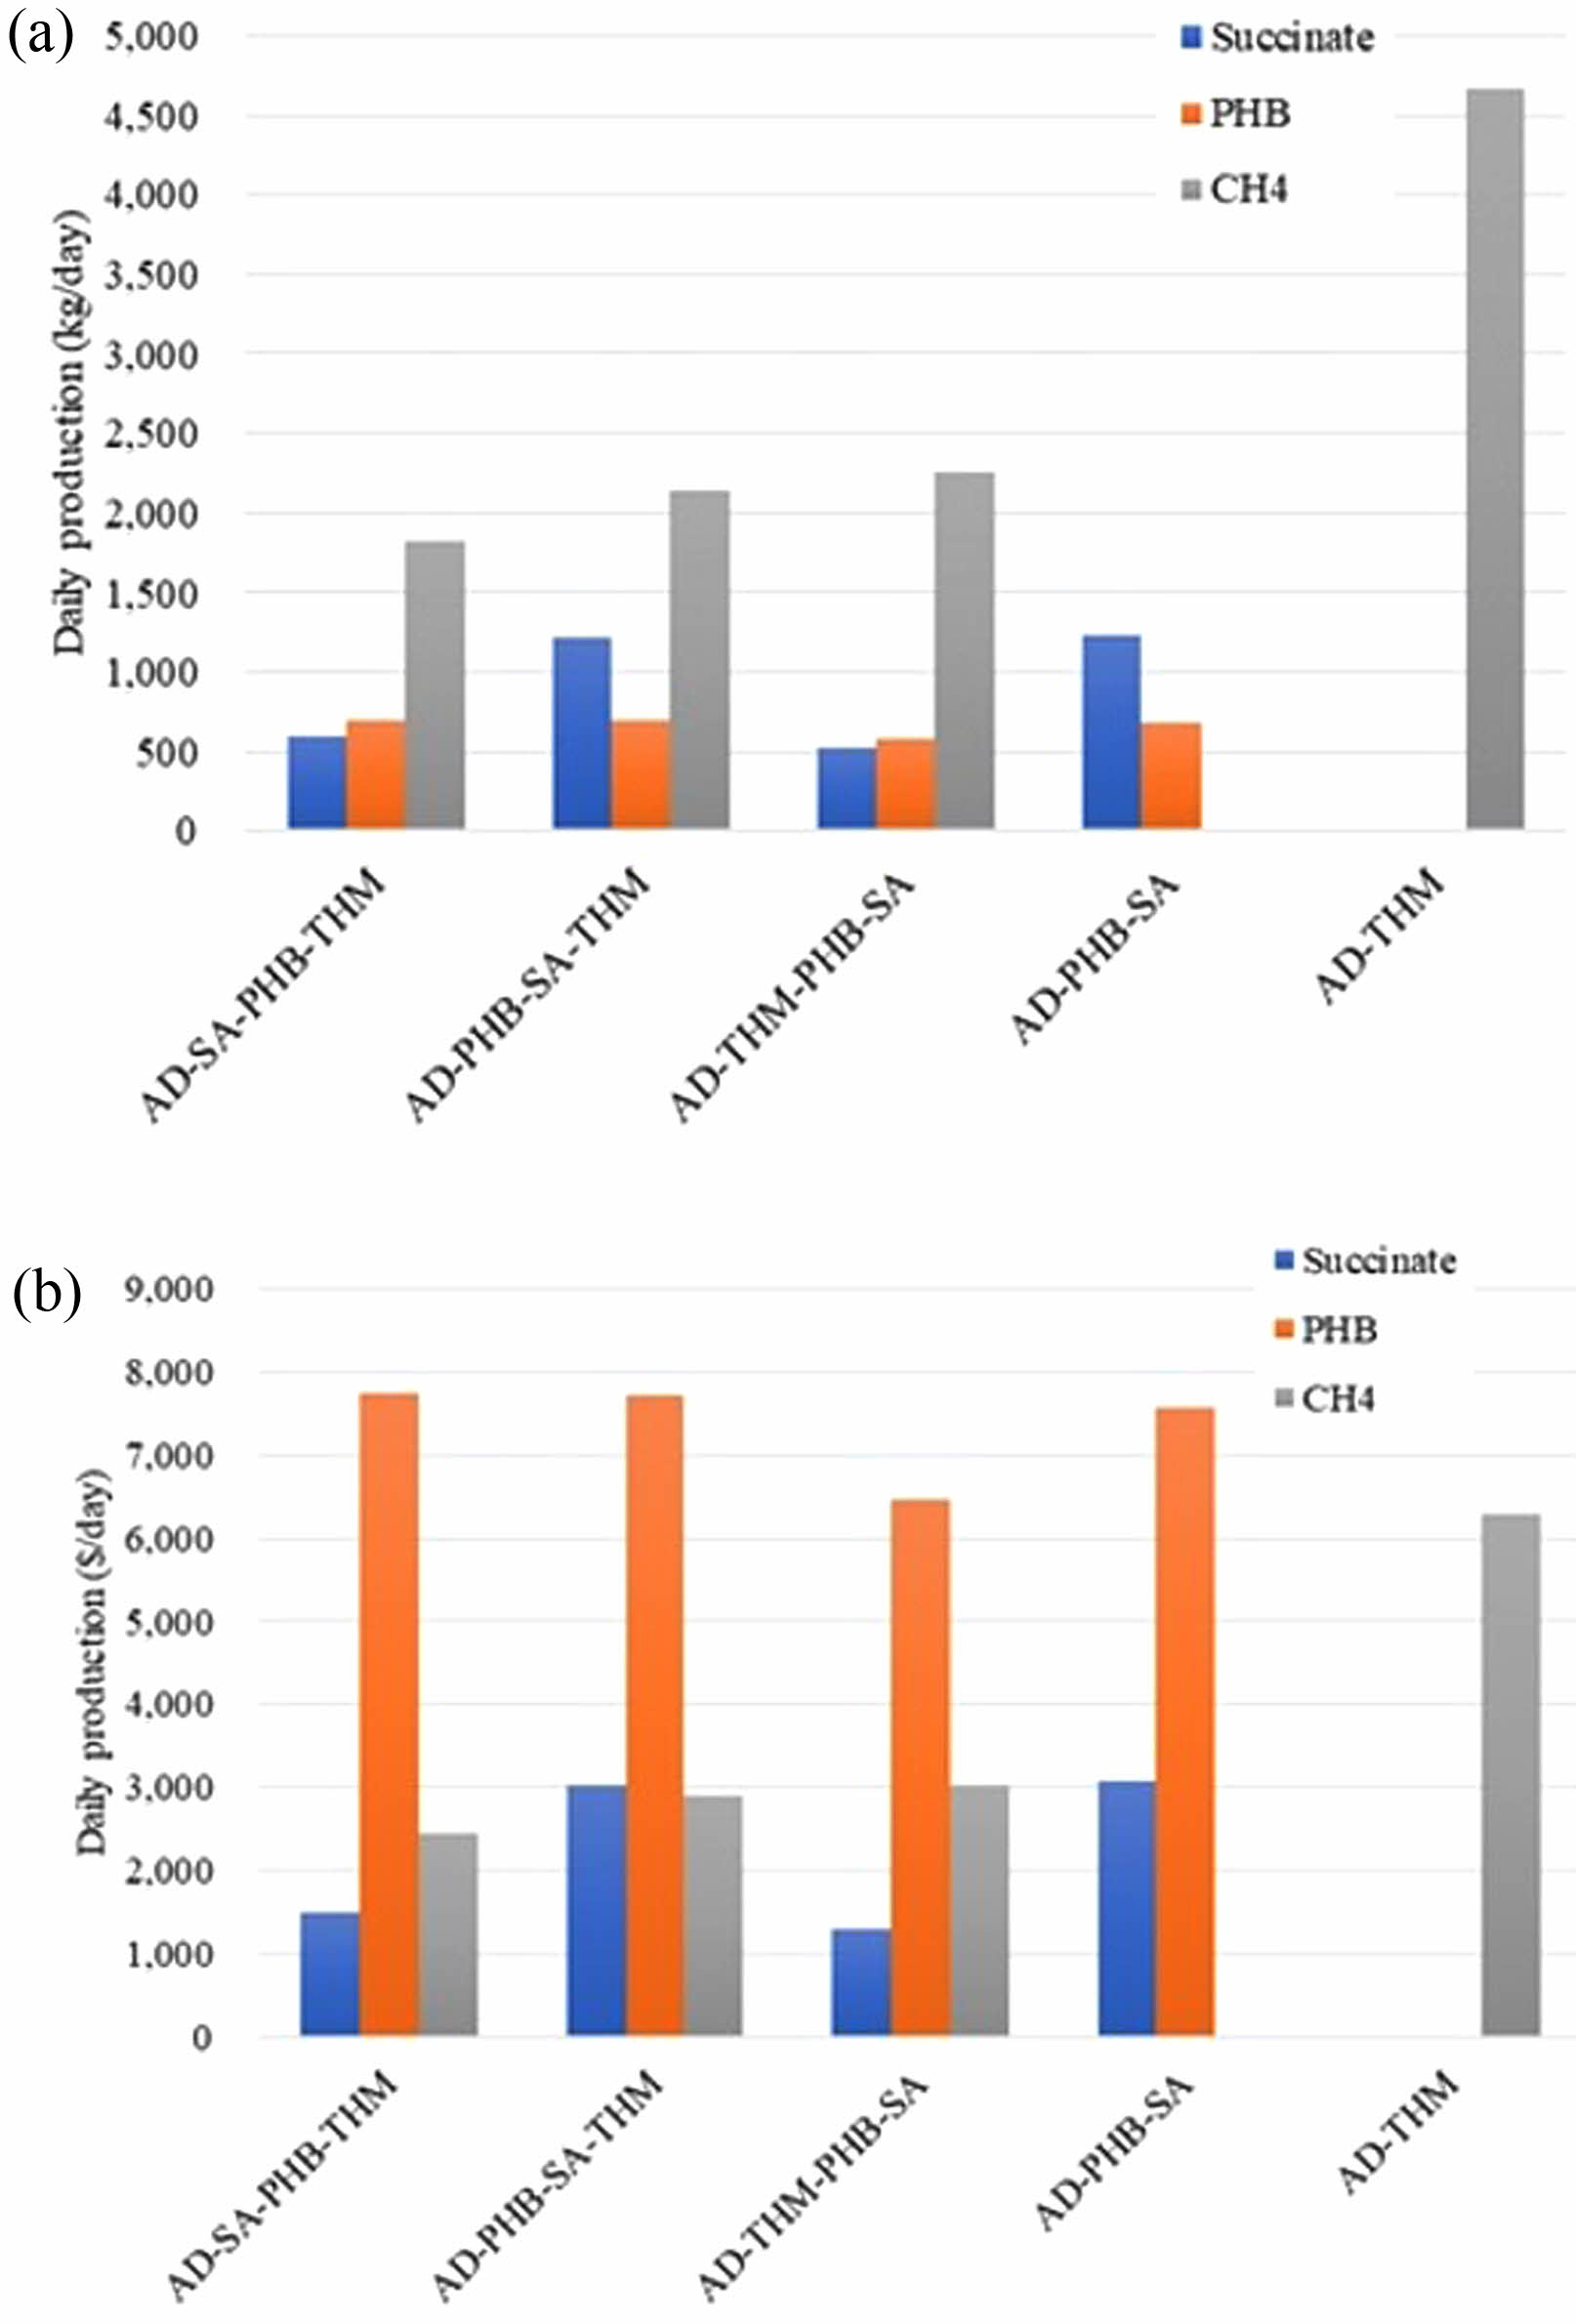
The methane production from 50 tonnes of food wastes in the combined system was the highest in the AD-THM-PHB-SA system, with a daily output of 2,250 kg CH4. This is about 77% of the 2,920 kg CH4 daily production in AD alone (Fig. S1). Other output carbons in the combined system were converted to value-added materials such as PHB and SA. Succinic acid production was highest in the AD-PHB-SA-THM system due to the combination of CO2 generated from PHB production and CO2 from AD. The SA production was 1,216 kg/day in AD-PHB-SA-THM system, compared to 596 kg/day in AD-SA-PHB-THM, 522 kg/day in AD-THM-PHB-SA (Fig. S1).
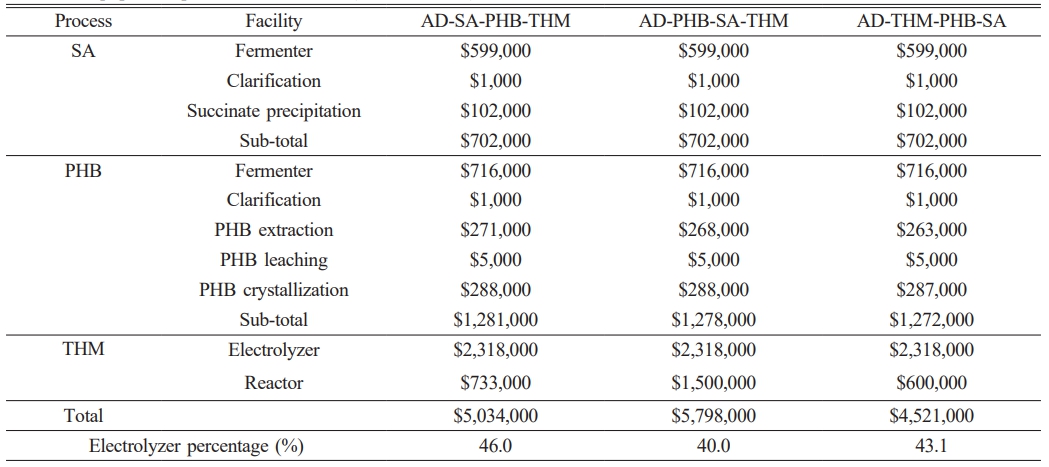
The cost of electrolyser played an important role in the overall economic evaluation. Required electricity power was 3.9 MW (AD-THM-PHB-SA, AD-THM) and 4.6 MW (AD-SA-PHB-THM, AD-PHB-SA-THM). At the current 2020 technology level, the price of electrolyser system was calculated to be $500/kW [8]. Electrolyser costs accounted for 40-46% of the total equipment purchase cost (Table 2).
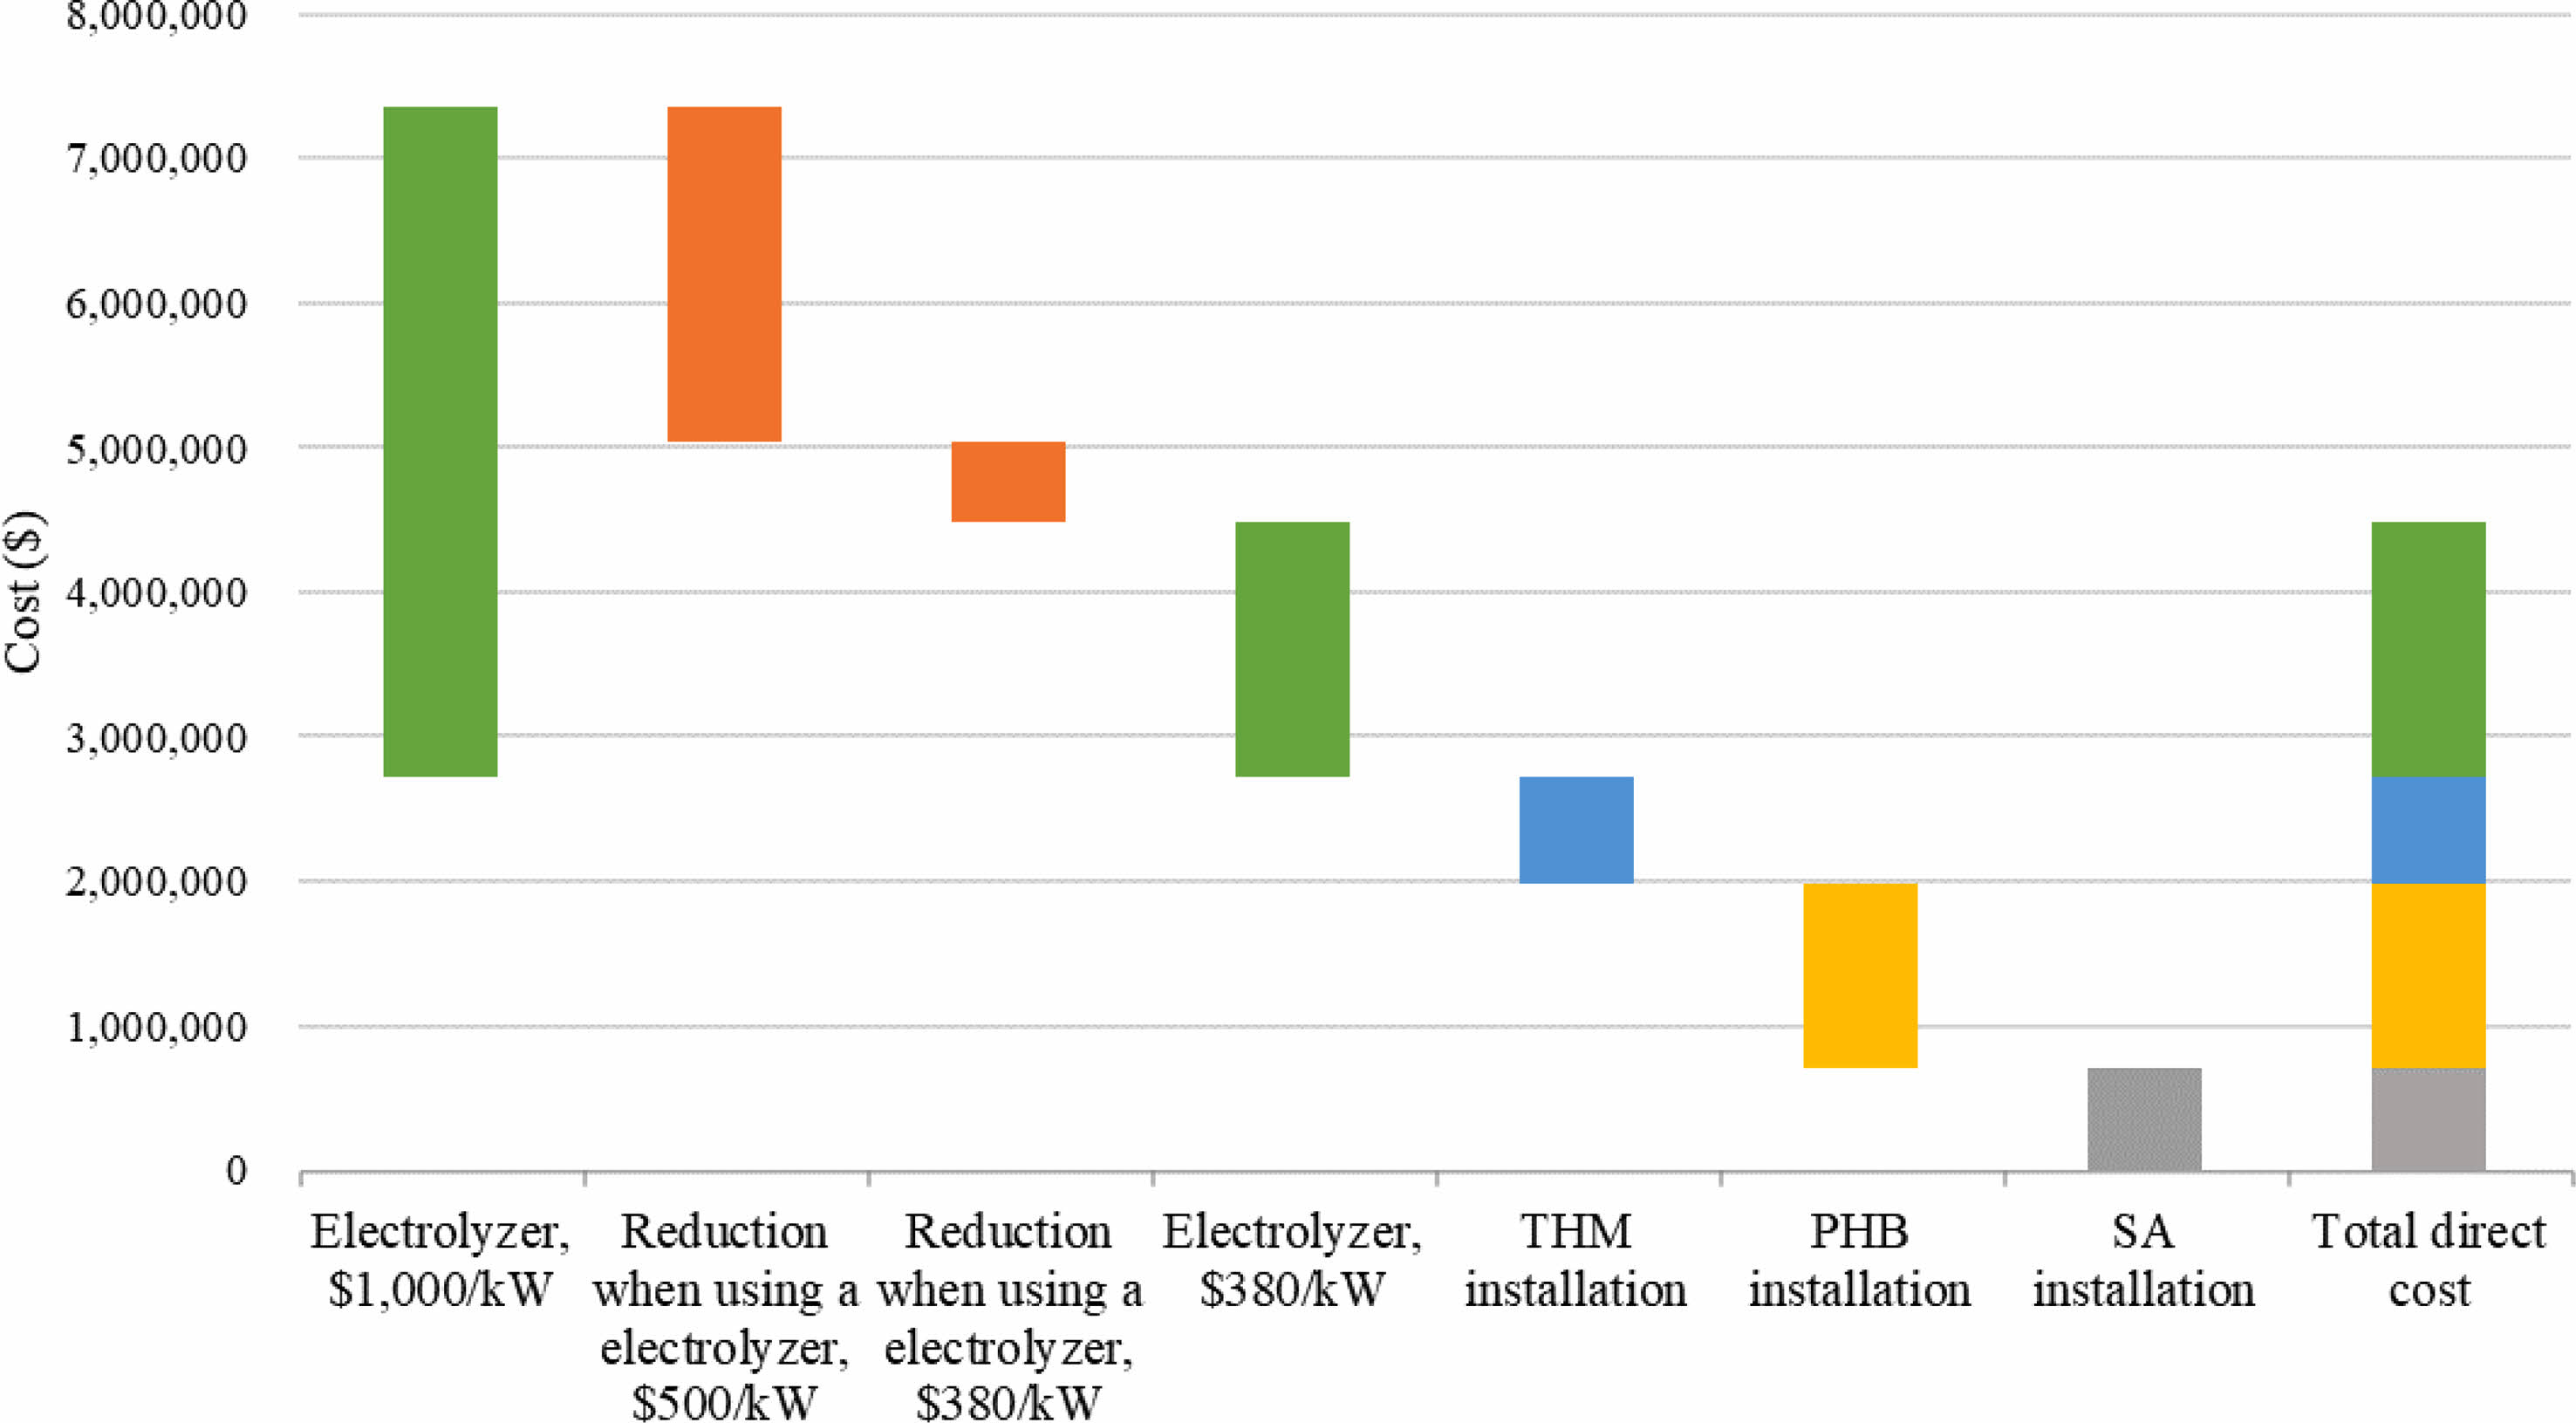
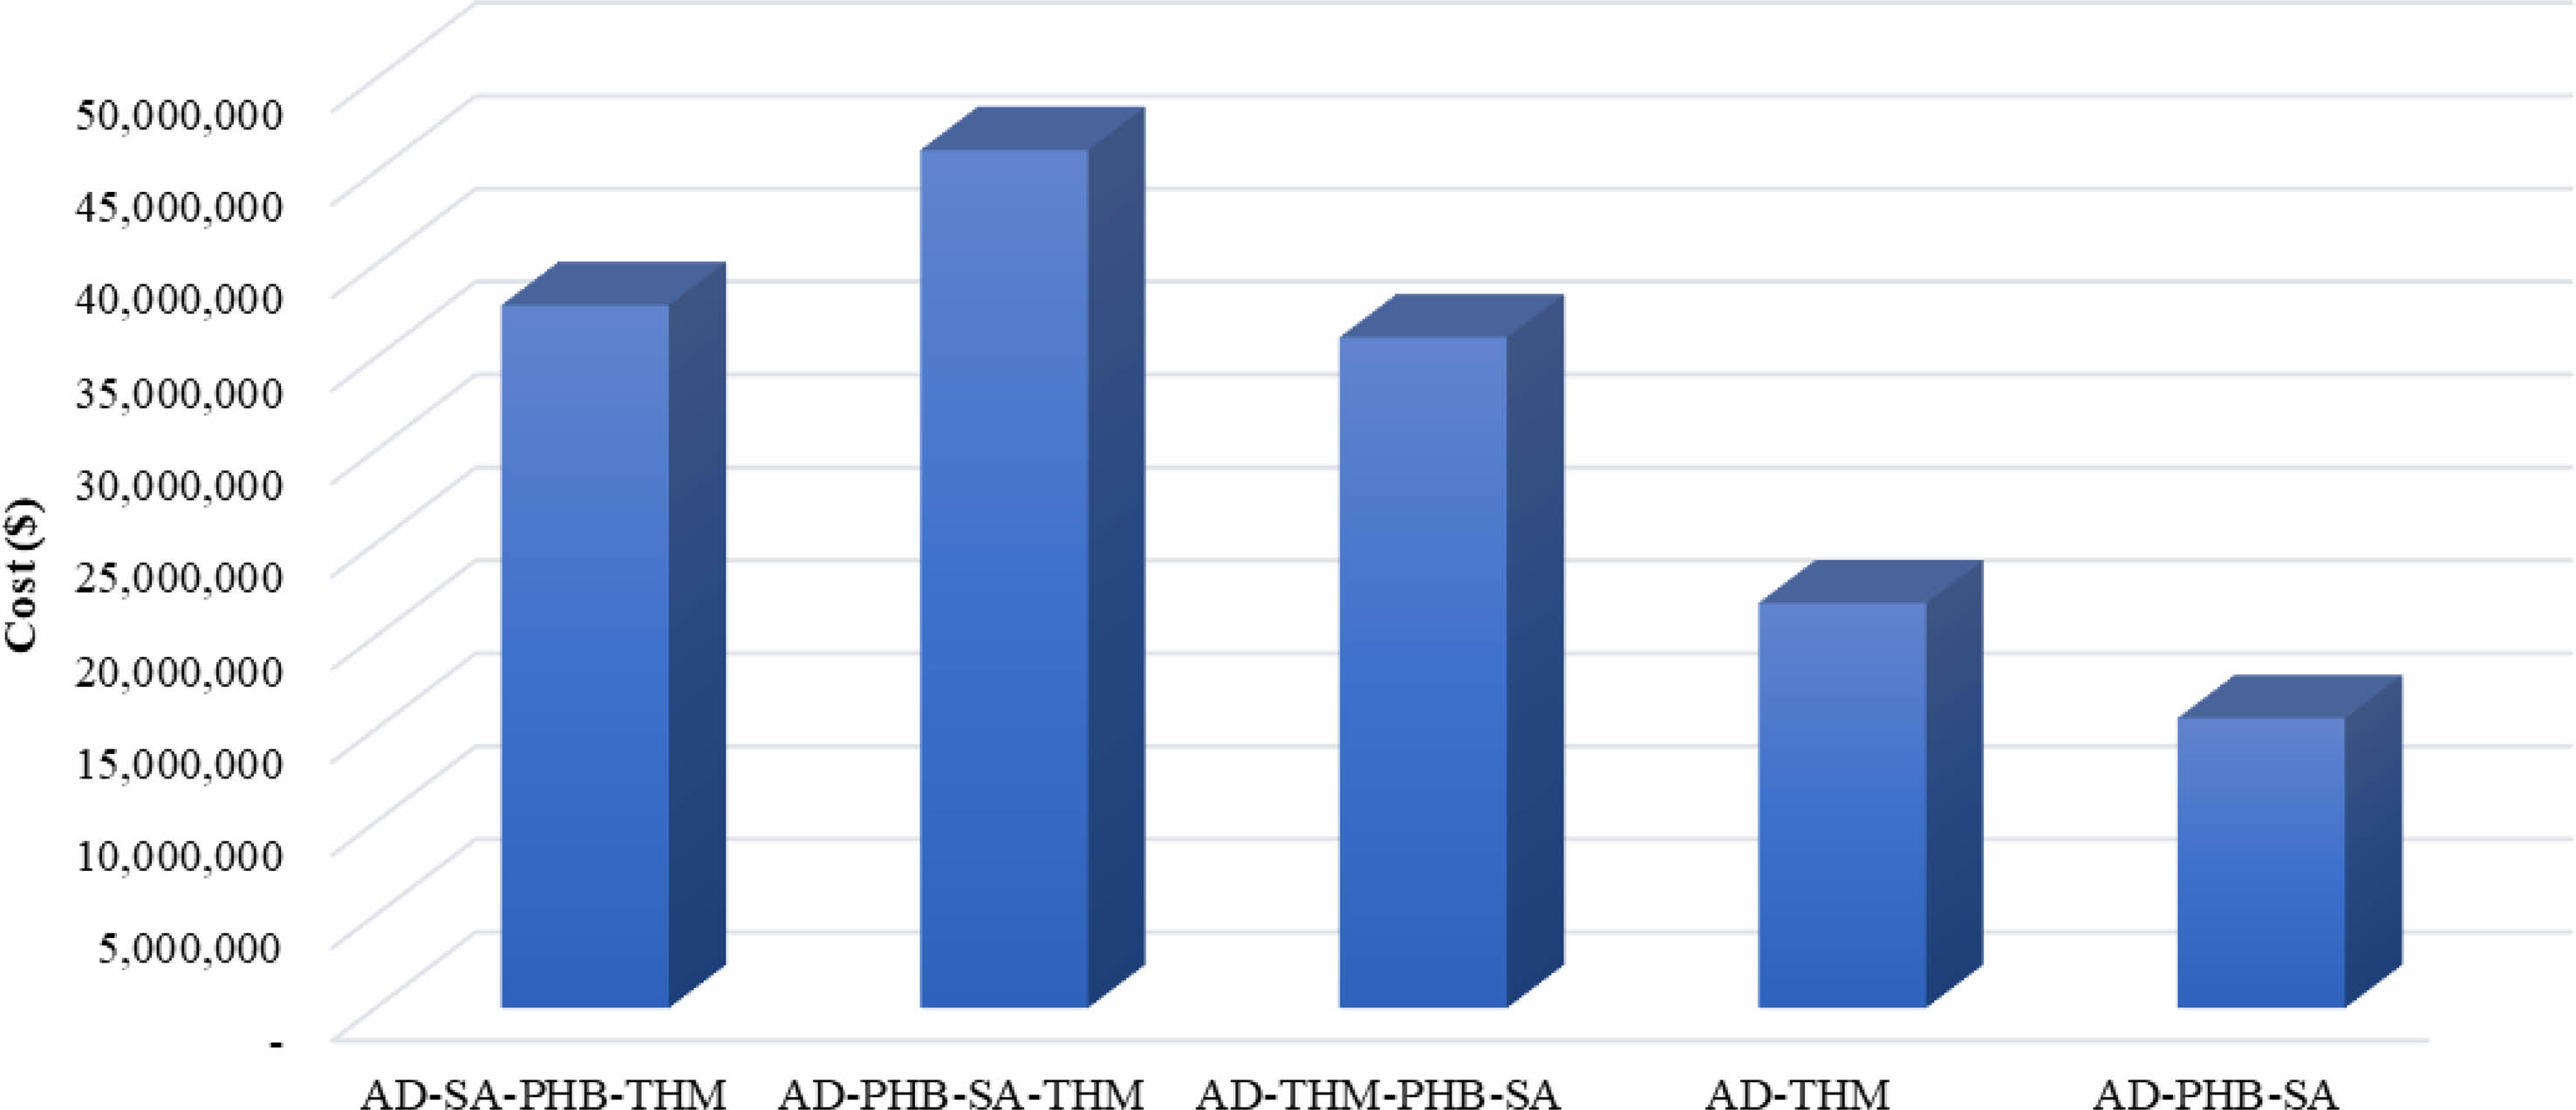
The cost of installing water electrolysis remains high. According to IRENA, electrolyzer costs are expected to range from $130/kW to $307/kW with an estimated 1-5 TW of deployed capacity by 2050 [9]. The electrolyzer cost was set at $380/kW [40], which is comparable to the installation cost of other processes and expressed as a waterfall chart as shown in Fig. 3. The cost of electrolyzer of $1,762,000 was comparable to the cost of $1,281,000 installation for PHB production. Because of the high cost of the electrolyzer, the capital investment was higher with an electrolyzer than without it (Fig. 4). The capital investment is the sum of direct fixed capital (DFC), working capital, startup, and validation cost. The most expensive capital investment was the case of AD-PHB-SA-THM (Fig. 4). The AD-PHB-SA system had the lowest capital investment (Fig. 4).
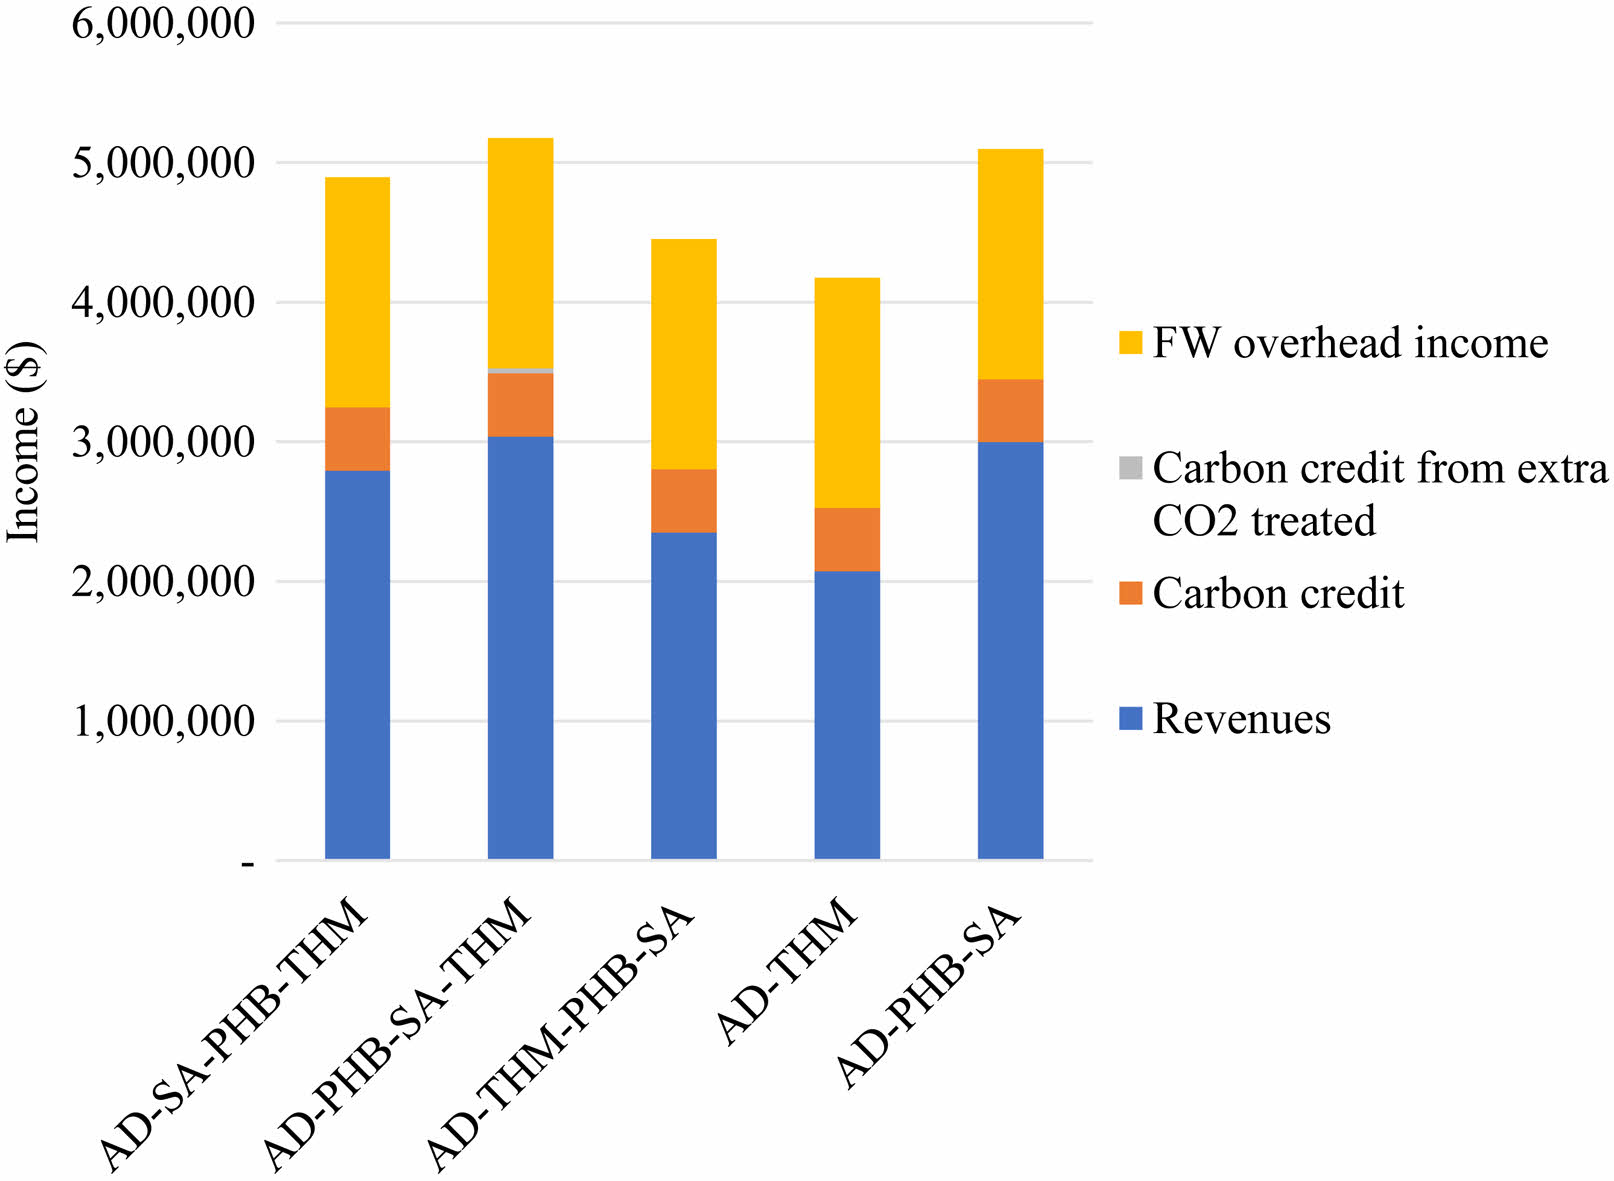
However, in terms of revenue, all cased were not big different (Fig. 5). Income is divided into three categories: revenues, carbon credit, and food waste overhead income. The prices of methane, PHB and succinic acid were calculated at $1.35/kg, $11/kg and $2.5/kg, respectively. The carbon credit was set $15.89/ton CO2 in a Korea-Emissions Trading Schemes (ETS) and methane ETS was calculated 25×CO2 ETS. Food waste overhead income includes waste tipping fee ($100/ton FW) under waste management system. In Korea, it costs an average $100 to process 1 ton of food waste through a resource recycles program, including correction, transportation, and treatment [41]. AD-PHB-SA-THM and AD-PHB-SA show high revenue income. Income from the carbon credit and tipping fee accounts for 41.2-50.4% of the total income amount (Fig. 5). The daily production of methane is the highest in all case (Fig. 5a), but PHB was the most profitable because of its high price (Fig. 5b).
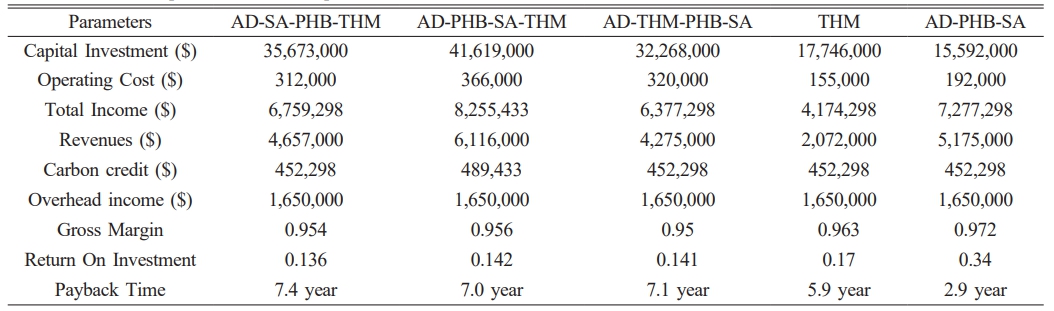
The total capital investment, operation cost of each combination process, and the economic analysis of the scenarios were shown in Table 3. The payback period was determined based on total revenue compared to capital investment and operating costs (Table 3). The payback time is 7.4 year for AD-SA-PHB-THM and 2.9 year for AD-PHB-SA (Table 3).
The investment cost of water electrolysis was the most expensive part in whole processes suggested in this study. Renewable energy sources such as solar and wind power can be used as a power source for water electrolysis. Green hydrogen costs range from $3/kg to $6.55/kg, while fossil-based hydrogen is $1.80/kg [42]. The generated hydrogen can be used as a reducing agent for chemicals production by microorganisms and oxygen can be used as an electron acceptor for aerobic microorganisms. Using biogas, biological conversion to value-added chemicals such as succinic acid and PHB can be profitable addition to renewable biomethane production as shown in this study. Revenue was determined by the process sequence in the overall process flow, market price, operating costs, and additional substrate requirements for biological production. This study suggested that biogas can be used to produce a variety of compounds biologically, and that different processes can be combined to generate revenue according to substrate-product, so that the net profit can be different depending on the process sequence.
The production of electricity from biogas in the world 91,819 GWh in 2019 and it charge 16.5% in bioenergy including solid biofuels (69.8%) and renewable municipal
waste (12.3%). To increase the profits of biogas, bioplastics can be a candidate material that can provide economic benefits along with electricity production. Biological recycling pathways, such as anerobic digestion and aerobic composting, constitute a circular plastic economy. For plastic production, renewable energy supply such as photovoltaics and wind power can cut greenhouse gas emissions [43]. Bioplastics production is attractive because its current high price. PHB revenue from methane was calculated to be 2.2 times that of electricity revenue from methane [44]. Our results also showed that bioplastics production is more profitable than biogas refining due to market price difference. High product costs of bioplastics can be lowered by using waste. By adding a modular production facility to the biogas plant, the range of biogas utilization can be expanded. The result of life cycle assessments in AD with bioplastics reduced greenhouse gas (GHG) by an average of 55% [45].
CO2 and renewable resources are the solution for developing more sustainable polymers [46]. They can be obtained from AD of a typical waste management system and overcome cost-inefficient problems currently encountered in sustainable polymers production. The biogas utilization for plastics production means carbon capture and it can turn GHG emissions to carbon utilization. Incineration is used to treat non-biodegradable plastics such as such as polyethylene, polypropylene, polystyrene, poly (vinyl chloride) and poly (ethylene terephthalate) [43], and the CO2 generated can be uses to produce succinic acid (Fig. 6). A recent report has shown that a combination of biomass and CO2 utilization can achieve net zero-emission plastics with operating costs similar to linear carbon pathways [47]. Carbon capture company, LanzaTech has developed scalable carbon-negative approach for the production of acetone and isopropanol using synthetic biology [48]. Transitioning from a linear to a circular economy requires reusing products, and biogas must be integrated into a carbon circular system. Biogas can contribute not only to energy production but also to the circular plastics economy, by processing the possibility of producing biodegradable plastics circular economy.
|
Fig. 3 Waterfall chart showing the overall cost reduction due to reduced electrolyzer cost in a biogas refinery system. |
|
Fig. 4 Capital investment cost calculated at $500/kW for water electrolyzer. |
|
Fig. 5 Daily production amount (kg/day, a) and revenues ($/ day, b) from each system. |
|
Fig. 6 Income composition for each process. |
Bioplastics production from the biogas is suggested for circular plastic economy in addition to biomethane production using hydrogen from water electrolysis by renewable energy. The cost of water electrolyser was the largest investment, and a major factor in prolonging the payback period. Through the production of high value-added bioplastics, economic benefits can be increased and a contribution to the circular carbon economy can be achieved.
JCPR_2025_026_03_483_Supplementary_Information.pdf (120 kb)
Supplementary Information
This work supported by the Korea Environment Industry & Technology Institute (KEITI) through the Development of Demonstration Technology for Converting Unconventional Waste Biomass to Energy, funded by the Korea Ministry of Environment (MOE) (2022003480001).
- 1. N. Primmer, A. Arias-Garcia, G. Conboy, E. Dorigo, L. Friedman, O. Grauwin, D. Lee, K. Simons, and J. Svedsen, in “Biogas: Pathways to 2030” (World biogas association, 2021) p.3.
- 2. Joint Ministries of the Republic of Korea, in “1st Basic Plan for Resource Circulation for 2018-2027” (Ministry of Environment, 2018) p.89.
- 3. A.N. Kumar, O. Sarkar, K. Chandrasekhar, T. Raj, V. Narisetty, S.V. Mohan, A. Pandey, S. Varjani, S. Kumar, P. Sharma, B.-H Jeon, M. Jang, and S.-H. Kim, Sci. Total. Environ. 806 (2022) 150312.
-

- 4. J. Ferrari, in “Electric Utility Resource Planning” (Elsevier, 2021) p. 109-138.
-
- 5. S. Kang, A.K. Mathew, A. Abraham, O. Choi, and B.I. Sang, J. Ceram. Process. Res. 23[6] (2022) 853-861.
-
- 6. J. Lee, J. Chun, O. Choi, and B.I. Sang, J. Ceram. Process. Res. 21[5] (2020) 602-608.
-
- 7. A. Udayan, S. Kang, and B.I. Sang, J. Ceram. Process. Res. 24[1] (2023) 29-39.
-
- 8. A. Saxena, A. Abraham, and B.I. Sang, J. Ceram. Process. Res. 25[6] (2024) 1087-1104.
-
- 9. E. Taibi, H. Blanco, R. Miranda, and M. Carmo, in “Green hydrogen cost reduction; Scaling up electrolysers to meet the 1.5 ℃ climate goal” (IRENA, 2020) p.1-102.
- 10. M. Götz, A. Koch, and F. Graf, in Proceedings of the International Gas Union Research Conference, September 2014, p.314-327.
- 11. C.J. Quarton and S. Samsatli, Renew. Sustain. Energy Rev. 98 (2018) 302-316.
-
- 12. O. Choi, M. Kim, Y. Go, M.-G. Hong, B. Kim, Y. Shin, S. Lee, Y.G. Kim, J.S. Joo, B.S. Jeon, and B.-I. Sang, Energies 12[21] (2019) 4130.
-
- 13. J. Liebetrau, P. Kornatz, U. Baier, D. Wall, and J. Murphy, in “ Integration of biogas systems into the energy system: Technical aspects of flexible plant operation” (IEA Bioenergy Task, 2020) p. 8.
- 14. M. Bailera, P. Lisbona, L.M. Romeo, and S. Espatolero, Renew. Sustain. Energy Rev. 69 (2017) 292-312.
-
- 15. K.A. Subramanian, V.C. Mathad, V.K.Vijay, and P.M.V. Subbarao, Appl. Energy 105 (2013) 17-29.
-
- 16. I.B. Gunnarsson, M. Alvarado-Morales, and I. Angelidaki, Environ. Sci. Technol. 48 [20] (2014) 12464-12468.
-
- 17. S. O'Herrin and W. Kenealy, Appl. Environ. Microbiol. 59[3] (1993) 748-755.
-
- 18. V. Ventorino, A. Robertiello, D. Cimini, O. Argenzio, C. Schiraldi, S. Montella, V. Faraco, A. Ambrosanio, S. Viscardi, and O. Pepe, Bioenergy Res. 10[2] (2017) 488-498.
-
- 19. H. Song, J. Lee, S. Choi, J. You, W. Hong, and S.Y. Lee, Biotechnol. Bioeng. 98 [6] (2007) 1296-1304.
-
- 20. J.H. Ahn, H. Seo, W. Park, J. Seok, J..A. Lee, W.J. Kim, G.B. Kim, K.-J. Kim, and S.Y. Lee, Nat. Commun. 11[1] (2020) 1970.
-
- 21. S.P. Singh and P. Singh, Renew. Sustain. Energy Rev. 38 (2014) 172-179.
-
- 22. E. Stylianou, C. Pateraki, D. Ladakis, M. Cruz-Fernández, M. Latorre-Sánchez, C. Coll, and A. Koutinas, Biotechnol. Biofuels 13 (2020) 72.
-
- 23. R. Dickson, E. Mancini, N. Garg, J.M. Woodley, K.V. Gernaey, M. Pinelo, J. Liu, and S.S. Mansouri. Energy Environ. Sci. 14[6] (2021) 3542-3558.
-
- 24. A.J. Pieja, in “From waste to plastic: Selection of methanotrophic bacteria for production of poly-3-hydroxybutyrate through applied environmental stresses” (Stanford University, 2011) p.134.
- 25. J.Y. Xin, Y.X. Zhang, S. Zhang, C.G. Xia, and S.B. Li, J. Basic Microbiol. 47[5] (2007) 426-435.
-
- 26. J.A. Asenjo and J.S. Suk, J. Ferment. Technol. 64[4] (1986) 271-278.
-
- 27. N. Doronina, V. Ezhov, and Y.A. Trotsenko, Appl. Biochem. Microbiol. 44[2] (2008) 182-185.
-
- 28. C. Del Cerro, J.M. García, A. Rojas, M. Tortajada, D. Ramón, B. Galán, M.A. Prieto, and J.L. García, J. Bacteriol. 194[20] (2012) 5709-5710.
-
- 29. T. García-Pérez, J.C. López, F. Passos, R. Lebrero, S. Revah, and R. Muñoz, J. Chem. Eng. 334 (2018) 691-697.
-
- 30. I. Levett, G. Birkett, N. Davies, A. Bell, A. Langford, B. Laycock, P. Lant, and S. Pratt, J. Environ. Chem. Eng. 4 (2016) 3724-3733.
-
- 31. J. Kuo and J. Dow, J. Air Waste Manag. Assoc. 67[9] (2017) 1000-1011.
-
- 32. C. Budny, R. Madlener, and C. Hilgers, Energy Convers. Manag. 102 (2015) 258-266.
-
- 33. D.T. Hill, Trans. ASAE, 25[5] (1982) 1374-1380.
-
- 34. D. Heinrich, M.H. Madkour, M.A. Al-Ghamdi, I.I. Shabbaj, and A. Steinbüchel, AMB Express, 2[1] (2012) 59.
-
- 35. S.K. Hahn, Y.K. Chang, B.S. Kim, and H.N. Chang, Biotechnol. Bioeng. 44[2] (1994) 256-261.
-
- 36. E. Bugnicourt, P. Cinelli, A. Lazzeri, and V. Alvarez, Express Polym. Lett. 8[11] (2014) 791-808.
-
- 37. A. Kuenz, L. Hoffmann, K. Goy, S. Bromann, and U. Prüße, Catalysts 10[5] (2020) 470.
-
- 38. W.J. Choi, Recent Pat. Biotechnol. 2[3] (2008) 173-80.
-
- 39. L. Lynd, C. Wyman, M. Laser, D. Johnson, and R. Landucci, in “Strategic biorefinery analysis: Analysis of biorefineries” (National Renewable Energy Laboratory, 2002). p.1-30.
-
- 40. J. Genovese, K. Harg, M. Paster, and J. Turner, in “Current (2009) state of the art hydrogen production cost estimate using water electrolysis” (National Renewable Energy Laboratory, 2009) p.1-44.
- 41. S. Solution, in “Minimizing Food Waste : Zero Food Waste, Seoul 2018”( Seoul Metropolitan Government, 2016).
- 42. P. Kothari, A. Adhikari, G. Awatade, G. Gadekar, and J. Patil, Int. J. Adv. Eng. Manag. 3[11] (2021) 487-495.
- 43. J.-G. Rosenboom, R. Langer, and G. Traverso, Nat. Rev. Mater. 7 (2022) 117-137.
-
- 44. C.S. Criddle, S.L. Billington, and C. Frank, in “Renewable bioplastics and biocomposites from biogas methane and waste-derived feedstock: Development of enabling technology, life cycle assessment, and analysis of costs” (Department of Resources Recycling and Recovery, 2014).
- 45. E.C. Van Roijen and S.A. Miller, Resour., Conserv. Recycl. 181 (2022) 106236.
-
- 46. Q. Hou, M. Zhen, H. Qian, Y. Nie, X. Bai, T. Xia, M.L.U Rehman, Q. Li, and M. Ju, Cell Rep. Phys. Sci. 2[8] (2021) 100514.
-
- 47. R. Meys, A. Kätelhön, M. Bachmann, B. Winter, C. Zibunas, S. Suh, and A. Bardow, Science 374[6563] (2021) 71-76.
-
- 48. C.D. Scown and J.D. Keasling, Nat. Biotechnol. 40[3] (2022) 304-307.
-
- 49. S. Dinkin, in “Increasing the profit ratio” (The space reviews, 2016).
- 50. A.A.A. Raman, H.W. Tan, and A. Buthiyappan, Front. Chem. 7 (2019) 774.
-
- 51. X. Ge, C. Chang, L. Zhang, S. Cui, X. Luo, S. Hu, Y. Qin, and Y. Li, in “Advances in Bioenergy” (Elsevier, 2018) p.161-213.
-
- 52. P.J. Strong, B. Laycock, S.N.S. Mahamud, P.D. Jensen, P.A. Lant, G. Tyson, and S. Pratt, Microorganisms 4[1] (2016) 11.
-
 This Article
-
2025; 26(3): 483-491
Published on Jun 30, 2025
- 10.36410/jcpr.2025.26.3.483
- Received on Feb 26, 2025
- Revised on Mar 12, 2025
- Accepted on Mar 14, 2025
Services
- Abstract
introduction
materials and methods
results and discussion
conclusions
- Supplementary Information
- Acknowledgements
- References
- Full Text PDF
Shared
Correspondence to
- Byoung-In Sang
-
bClean-Energy Research Institute, Hanyang University, 222 Wangsimni-ro, Seongdong- gu, Seoul 04763, Republic of Korea
cDepartment of Chemical Engineering, Hanyang University, 222 Wangsimni-ro, Seongdong-gu, Seoul 04763, Republic of Korea
Tel : +82-2-2220-2328 Fax: +82-2-2298-4101 - E-mail: biosang@hanyang.ac.kr
Clean-Energy Research Institute(CRI), Hanyang University, 222, Wangsimni-ro, Seongdong-gu, Seoul, 04763, Korea
E-mail: jcpr@hanyang.ac.kr