


- Comparative study on composition and firing atmosphere of hare's fur glaze and oil spot glaze from Jian Kiln in Song Dynasty (960-1279 A.D.)
Caishui Jianga, Junming Wua,*, Huan Yub, Ting Luoc, Zhen Yaoa, Fen Jianga and Xiaoxin Qiua
aSchool of Archaeology and Museology, Jingdezhen Ceramic University, Jingdezhen 333403, China
bJingdezhen University, Jingdezhen 333000, China
cSchool of Materials Science and Engineering, Jingdezhen Ceramic University, Jingdezhen 333403, ChinaThis article is an open access article distributed under the terms of the Creative Commons Attribution Non-Commercial License (http://creativecommons.org/licenses/by-nc/4.0) which permits unrestricted non-commercial use, distribution, and reproduction in any medium, provided the original work is properly cited.
This study systematically compared the chemical composition, phase constitution, and microstructure of Song dynasty Jian kiln hare’s fur glaze and oil spot glaze, and employed simulated experiments to investigate the relationship between the formation and composition of their surface patterns and the firing atmosphere, thereby revealing the intrinsic reasons for the rarity of oil spot glaze. The results indicate that although the ceramic bodies of both glazes exhibit similar chemical compositions and their surface patterns are primarily composed of ε-Fe₂O₃ crystals, significant differences exist in their glaze formulations. The hare’s fur glaze contains higher levels of CaO and Fe₂O₃—components that facilitate crystalline precipitation—resulting in a more stable composition, whereas the oil spot glaze exhibits elevated contents of SiO₂ and K₂O, leading to greater compositional variability and characteristics unfavorable for crystalline precipitation. Simulated experiments demonstrated that the formation of hare’s fur patterns is less dependent on the firing atmosphere, as similar patterns can form under both oxidizing and reducing conditions; in contrast, the oil spot glaze requires a reducing atmosphere with a CO volume concentration of 13.67–15.38 vol% for the development of its distinctive patterns. This finding suggests that the marked rarity of oil spot glaze in Song dynasty Jian kilns, compared to hare’s fur glaze, is likely attributable to its more demanding chemical composition and firing atmosphere requirements.
Keywords: Jian Kiln, Hare's fur glaze, Oil spot glaze, Chemical composition, Firing atmosphere.
The Jian kiln is located in Houjing Village and Chizhong Village, Shuiji Town, Jianyang District, Nanping City, Fujian Province, China [1]. During the Song dynasty (960–1279 A.D.), the popular trend of tea competitions led to the rapid prosperity of the Jian kiln, which became renowned in Chinese ceramic history for producing black-glazed tea bowls. These tea bowls featured naturally formed and dynamic surface patterns that were highly favored by aristocrats and scholars. Based on the morphology of these patterns, appellations such as “hare’s fur,” “oil spot,” and “pearl pattern” were coined [3]. In particular, the hare’s fur tea bowls were celebrated for their fine, hair-like glaze patterns reminiscent of a rabbit’s whiskers, while the oil spot tea bowls derived their name from patterns resembling floating oil droplets on water. Emperor Huizong of the Song dynasty, Zhao Ji, once praised the hare’s fur tea bowls as premium products, stating that “hare’s fur tea bowls with a dark blue-black hue and well-defined jade-like hair patterns are the finest” [3]. Moreover, Jian kiln black-glazed tea bowls were exported to Japan and other East Asian countries [4]. According to the Japanese ancient text Kundaikan Sayū Chōki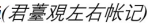 , “oil spot tea bowls are ranked as the second most valuable, worth five thousand bolts of silk, while hare’s fur tea bowls are valued at three thousand bolts of silk” [3]. This illustrates that both hare’s fur and oil spot tea bowls were esteemed as treasures in their time, possessing significant historical and cultural value and exerting a profound influence on the history of world ceramics.
Since the 1960s, collaborative archaeological excavations of the Jian kiln by institutions such as Xiamen University, the Chinese Academy of Social Sciences, and the Fujian Museum have laid the foundation for the study of Jian kiln black-glazed porcelains [5–7]. Researchers including Chen from the Shanghai Silicate Research Institute of the Chinese Academy of Sciences pioneered a series of scientific investigations [8–10], revealing the chemical compositions of the porcelain bodies and glazes, the microstructures, and the firing temperature ranges of Jian kiln black-glazed porcelains. In addition, analyses of the only three known oil spot glaze fragments indicated that the chemical composition of oil spot glaze differs markedly from that of other Jian bowls. However, due to the extreme rarity of oil spot glaze specimens [11], further verification of the compositional differences between oil spot and hare’s fur glazes is required. In recent years, some scholars have approached the study of oil spot glaze by simulating the firing atmosphere [12] and investigating the crystalline precipitation mechanisms [13, 14], as well as analyzing the effects of formulation and firing temperature on glaze crystallization in both hare’s fur and oil spot glazes [15–18]. In addition, both the hare’s fur glaze and the oil spot glaze belong to iron-based crystalline glazes. Fe₂O₃ not only serves as a nucleating agent for crystallization, but the amount and form in which it exists can also alter the high-temperature properties of the glass phase, thereby affecting its crystallization ability [19]. Although these studies have made preliminary progress, most have focused on only one aspect of either glaze, lacking a comprehensive comparative analysis that combines scientific characterization with simulated experiments. Moreover, archaeological findings indicate that the majority of excavated Jian kiln specimens are black-glazed tea bowls, with oil spot tea bowls being far less common than hare’s fur tea bowls [5, 6]. Both hare’s fur and oil spot glazes were produced in long dragon kilns measuring several tens to hundreds of meters, and the inherent instability of the firing atmosphere within these large kilns may be an important factor contributing to the differences in glaze appearance. Therefore, it is imperative to integrate scientific analysis with simulated experiments to systematically investigate the underlying causes of the visual differences between hare’s fur glazes and oil spot glazes.
The present study aims to provide a scientific basis for the rarity of oil spot glaze in Jian kiln porcelains by comparing the chemical composition, phase constitution, and microstructure of Song dynasty hare’s fur glazes and oil spot glazes, in conjunction with simulated processing experiments to elucidate their formation mechanisms and the reasons for their differences. The results are expected not only to shed light on the firing techniques and cultural value of Song dynasty Jian kiln black-glazed porcelains but also to offer scientific insights for the preservation and innovation of modern Jian kiln porcelain production techniques.
Specimens
The Song dynasty Jian kiln specimens used in this study were provided by the Institute of Ancient Ceramics at Jingdezhen Ceramic University. The collection includes 15 hare’s fur glaze specimens (labeled HF-1 to HF-15) and 12 oil spot glaze specimens (labeled OS-1 to OS-12). Photographs of selected representative specimens are shown in Fig. 1.
Simulation Experiments
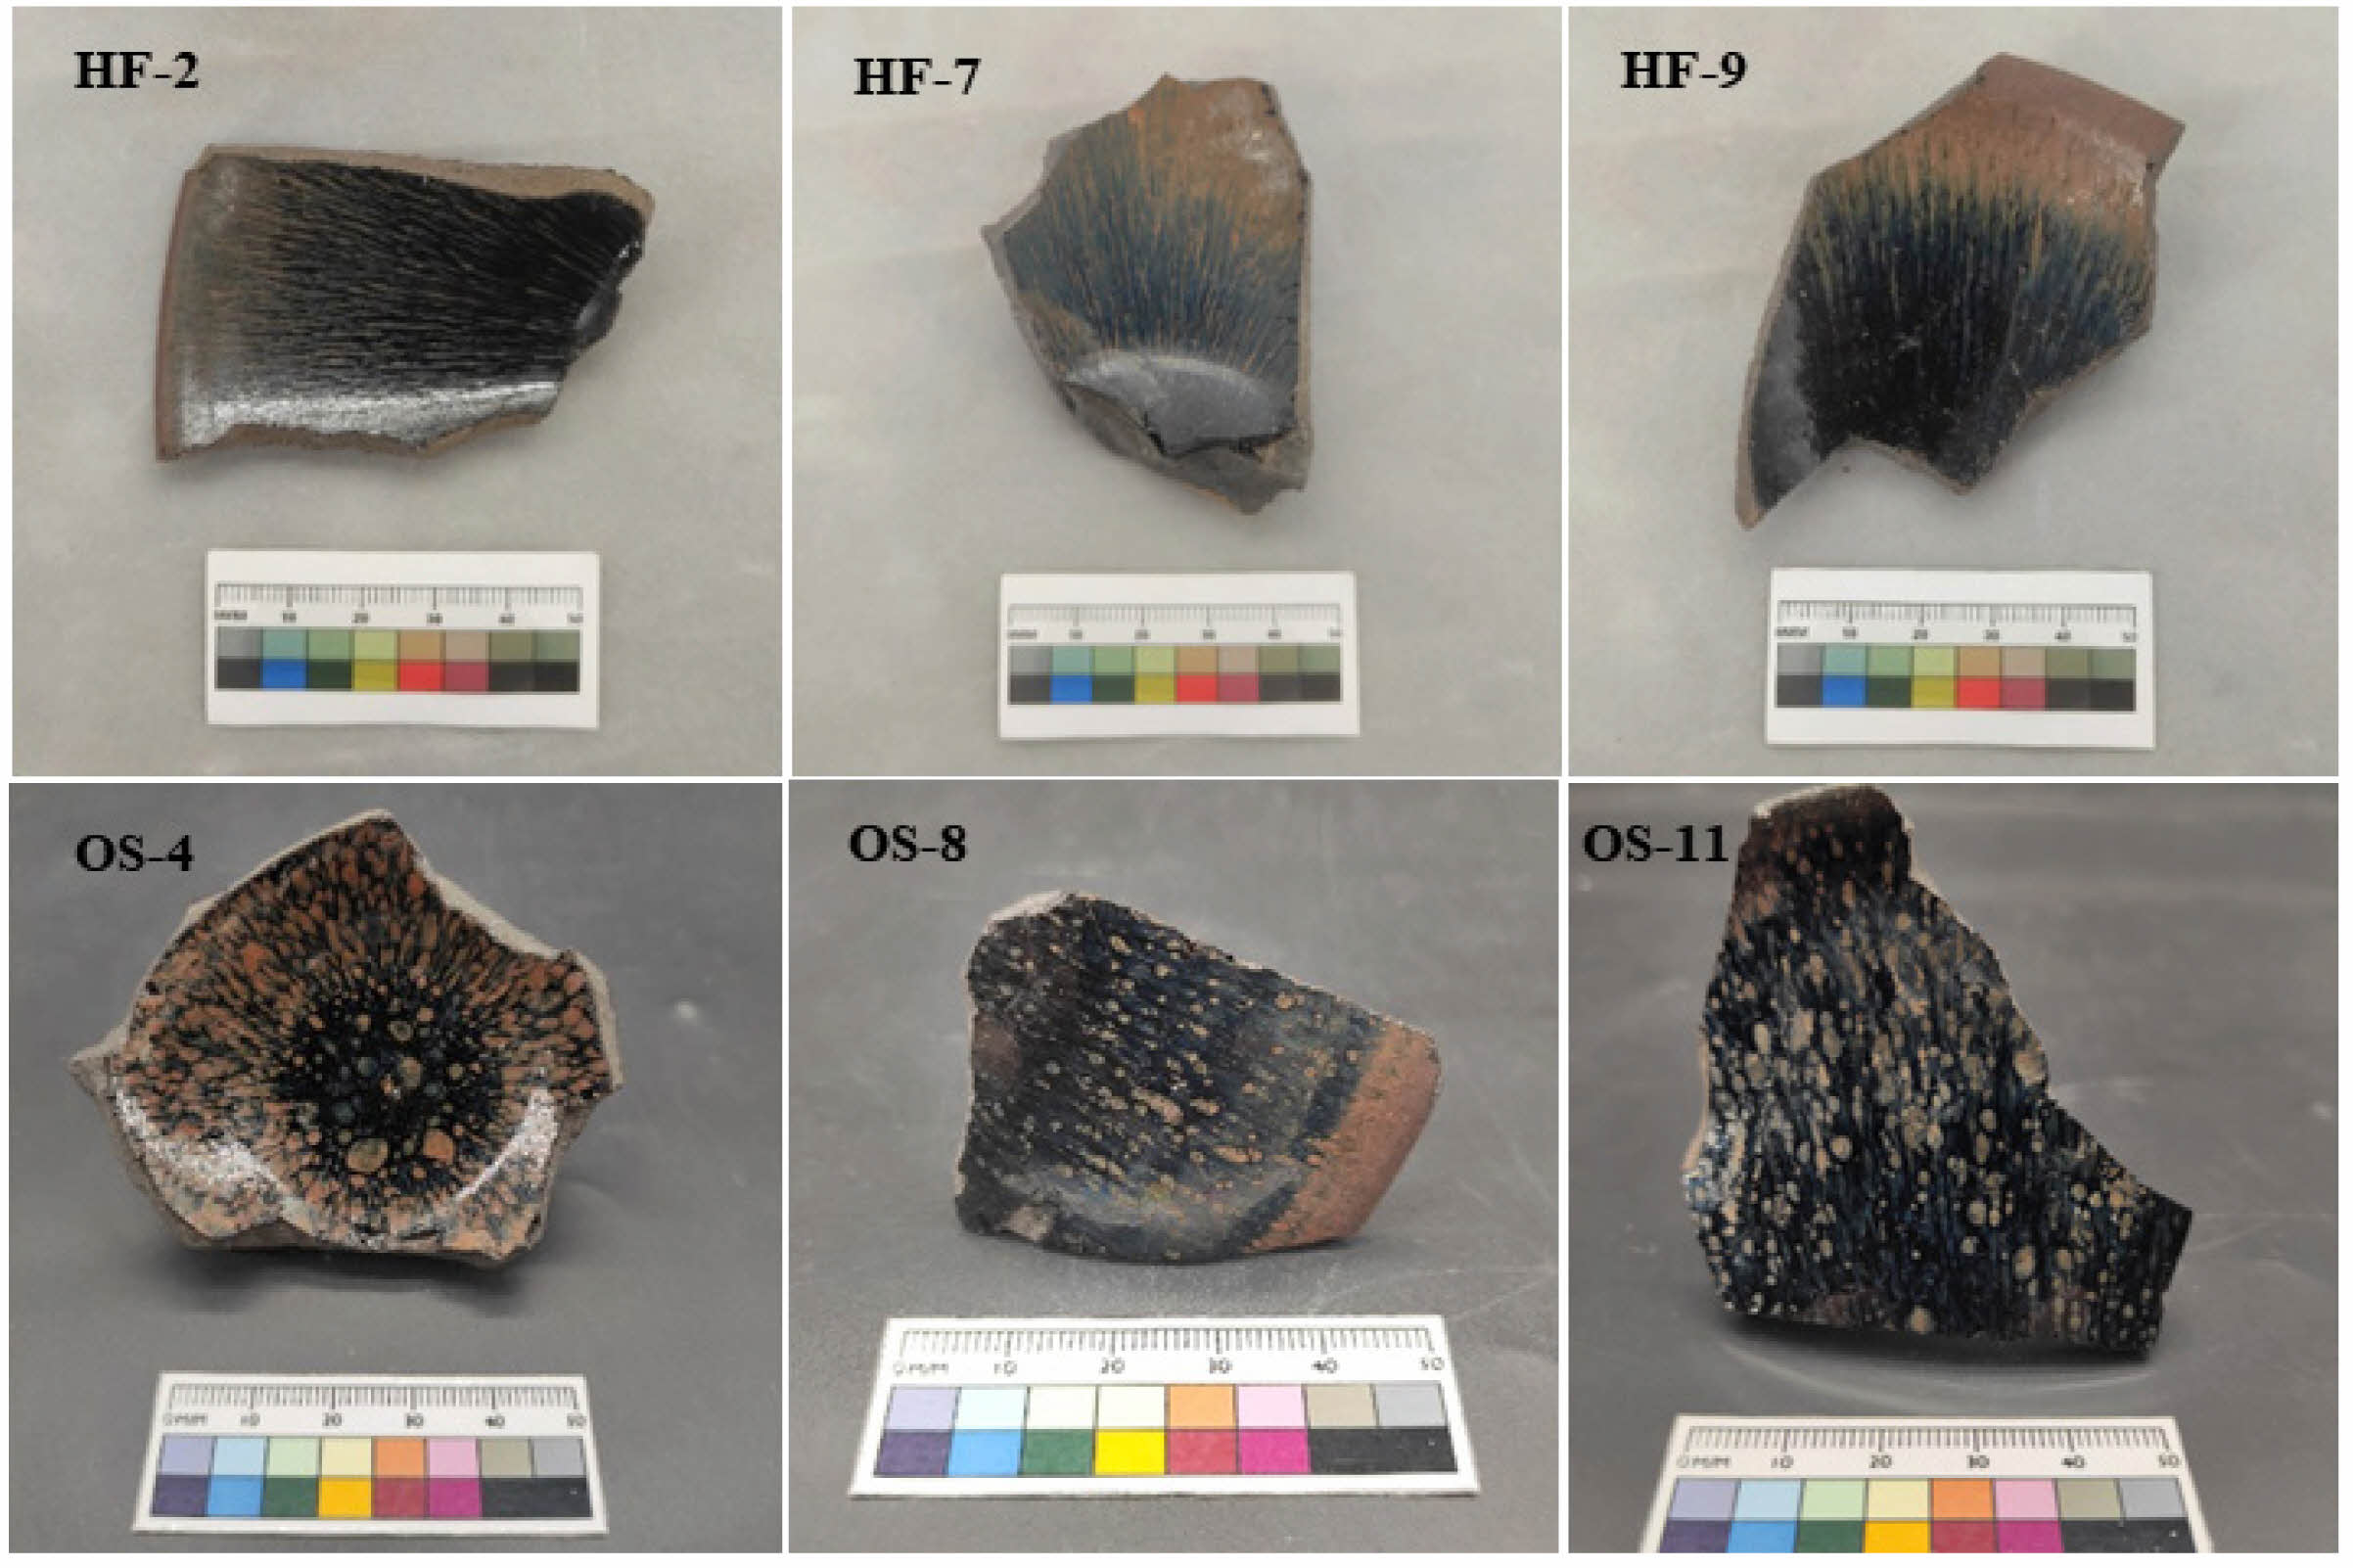
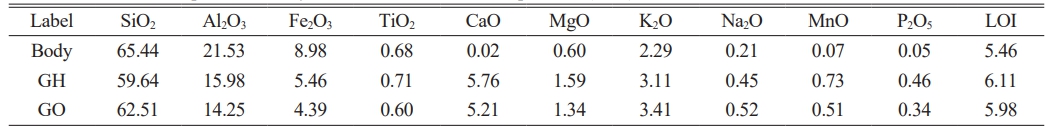
Based on the analysis of the porcelain body and glaze chemical compositions of the hare’s fur glaze and oil spot glaze specimens, the chemical compositions for the test bodies and glazes in the simulated experiments were formulated, as shown in Table 1. The raw materials for the glazes—glaze stone, glass ash, and red clay—were sourced from Shuiji Town, Jianyang District, Nanping City, with their chemical compositions presented in Table 2. The hare’s fur glaze (designated as GH) and the oil spot glaze (designated as GO) were then prepared according to these compositions. The glazes were wet-milled for 10 min at 400 r/min using a YDM-1 rapid ball mill, with a material-to-ball-to-water mass ratio of 1:2:0.8. The resulting slurry was passed through a 100-mesh (150 μm) sieve, ensuring that the residue was less than 0.05 wt%, to obtain the glaze slurry. Using identical clay bodies, the glazes were applied by dipping to achieve a glaze thickness of approximately 0.8–1.0 mm, after which the samples were dried and fired in an electric furnace. The temperature program was kept constant while investigating the effects of oxidizing and various reducing firing atmospheres on the crystalline precipitation of the glaze surface. The temperature program was as follows: the temperature was increased from room temperature at a rate of 3 °C/min to 300 °C, then at 4 °C/min to 800 °C, subsequently at 2 °C/min to 1150 °C, and finally at 1 °C/min to 1315 °C, followed by a 90-min hold before natural cooling. For the reducing firing, after a 60-min high-temperature hold, loose wood was introduced into the kiln to generate CO and other reducing gases via incomplete combustion. Wood was added every 5 min for a total of six additions. The weight of wood added and the corresponding CO volume concentration for each addition are provided in Table 3. For convenience, the samples were numbered using the format “glaze sample number + simulated experiment number” (with hare’s fur glaze samples labeled as GH-1, GH-2, GH-3 and oil spot glaze samples as GO-1, GO-2, GO-3). In order to assess the high-temperature viscosity of the glaze melt, portions of the hare’s fur and oil spot glazes were dried into glaze powder, granulated, and pressed into cylindrical specimens with a diameter of 15 mm and a height of 10 mm. These were fired alongside the samples, and the average diameter of the molten specimens was measured.
Characterization Methods
The surface patterns and black-glazed areas of the specimens were analyzed using an energy-dispersive X-ray fluorescence spectrometer (Eagle-Ⅲ, EDAX, USA), and the average of these measurements was taken as the chemical composition of the glaze; the ceramic bodies were also analyzed. In order to determine the distribution state of the elements on the glaze surface, mapping analysis was performed under the following conditions: an accelerating voltage of 50 kV, a current of 200 μA, a vacuum light path, and an X-ray beam spot diameter of 300 μm. A depth-of-field microscope (VHX-6000, KEYENCE, Japan) was employed to observe the microstructure of the samples at magnifications ranging from 50 to 1000. The samples were etched in a 5 wt% HF solution for 1 min, ultrasonically cleaned for 20 min, and then dried at 75 °C for 2 h before being examined by a scanning electron microscope (SU 8010, HITACHI, Japan). An energy-dispersive spectrometer (Model 550i, IXRF, USA) attached to the SEM was used for micro-area elemental analysis. The phase composition of the glaze surfaces was analyzed by a micro-Raman spectrometer (Invia, Renishaw, UK) using a 532 nm laser at 5 mW power. Finally, after calibration with a standard gas, a gas chromatograph (GC-2014C, Shimadzu, Japan) was used to measure the CO gas volume concentration.
|
Fig. 1 Photographs of Selected Representative Specimens. |

Chemical Composition Analysis
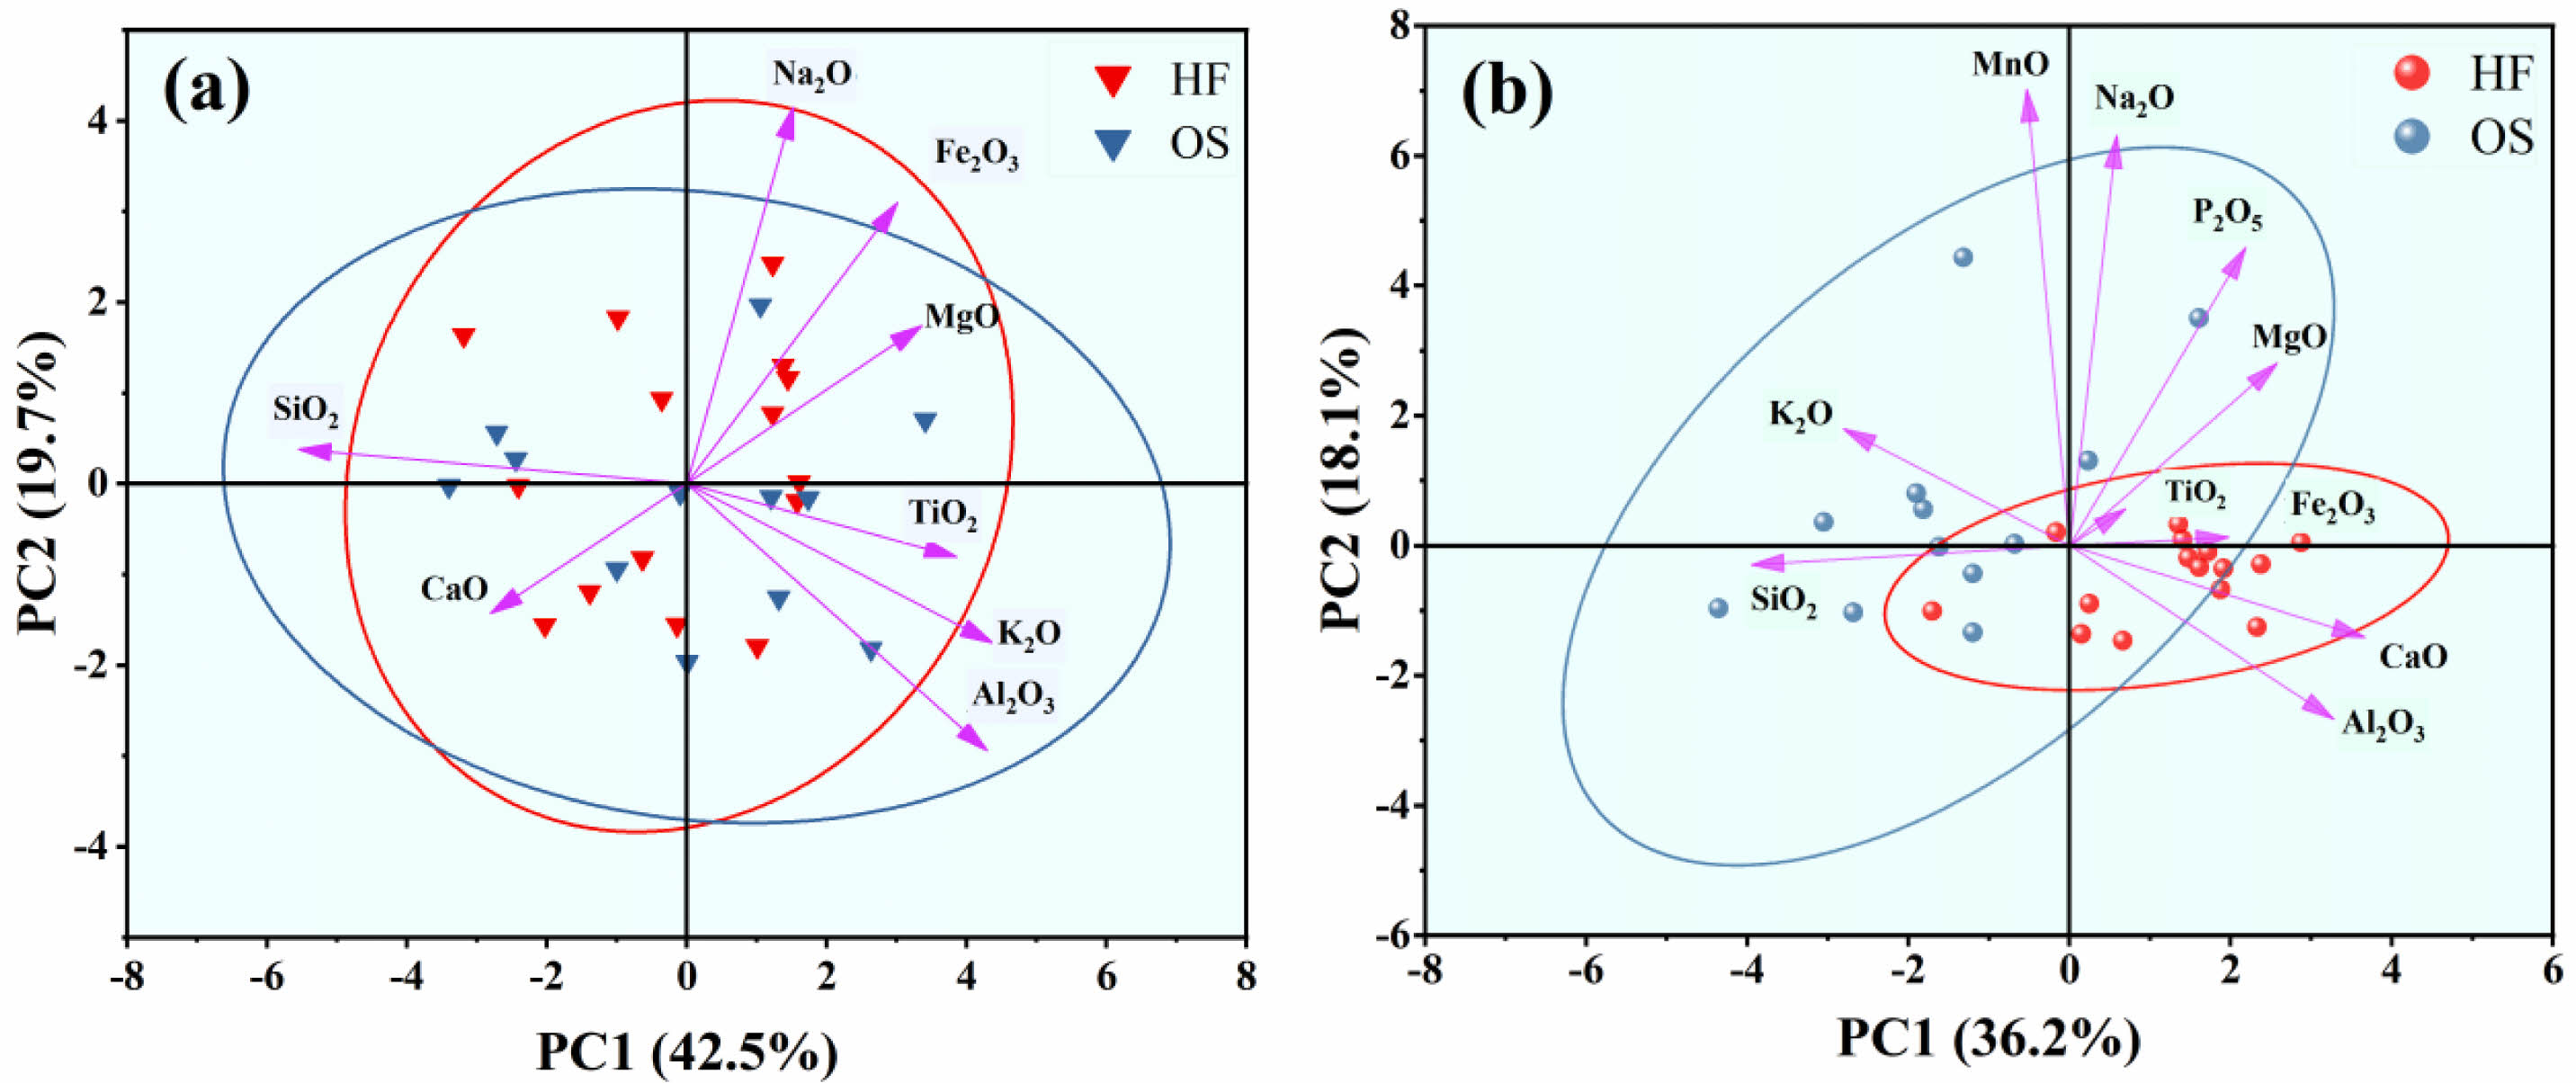
In order to differentiate the chemical composition differences between hare’s fur tea bowls and oil spot tea bowls, a comparative analysis of the porcelain body and glaze compositions of the specimens was conducted (Refer to Supplementary Tables 1 and 2). The tables reveal that the mean values of the porcelain body compositions for both types are similar, whereas marked differences exist in the glaze compositions. Specifically, the hare’s fur glaze exhibits higher contents of Al₂O₃ (16.97±0.73 wt%), CaO (5.97±0.62 wt%), and Fe₂O₃ (5.24±0.56 wt%), while the oil spot glaze shows elevated levels of SiO₂ (67.33±1.93 wt%) and K₂O (3.94±0.44 wt%). Fig. 2 presents the principal component analysis results of the porcelain body and glaze compositions for the hare’s fur glaze and oil spot glaze specimens. As observed in Fig. 2(a), the scatter points representing the main components of the porcelain bodies are substantially intermingled, and the areas of the 95% confidence ellipses almost coincide, indicating that their porcelain body compositions are essentially identical and suggesting that the body formulations are the same. In contrast, Fig. 2(b) displays clear differences in the scatter plots of the glaze compositions: the hare’s fur glaze is concentrated in the directions of Al₂O₃, CaO, and Fe₂O₃, whereas the oil spot glaze is oriented toward SiO₂ and K₂O with a more dispersed distribution. This indicates that the formulations of the hare’s fur glaze and the oil spot glaze are different, with the hare’s fur glaze having higher levels of Al₂O₃, CaO, and Fe₂O₃—rendering its formulation more stable—while the oil spot glaze, being richer in SiO₂ and K₂O, exhibits an unstable formulation.
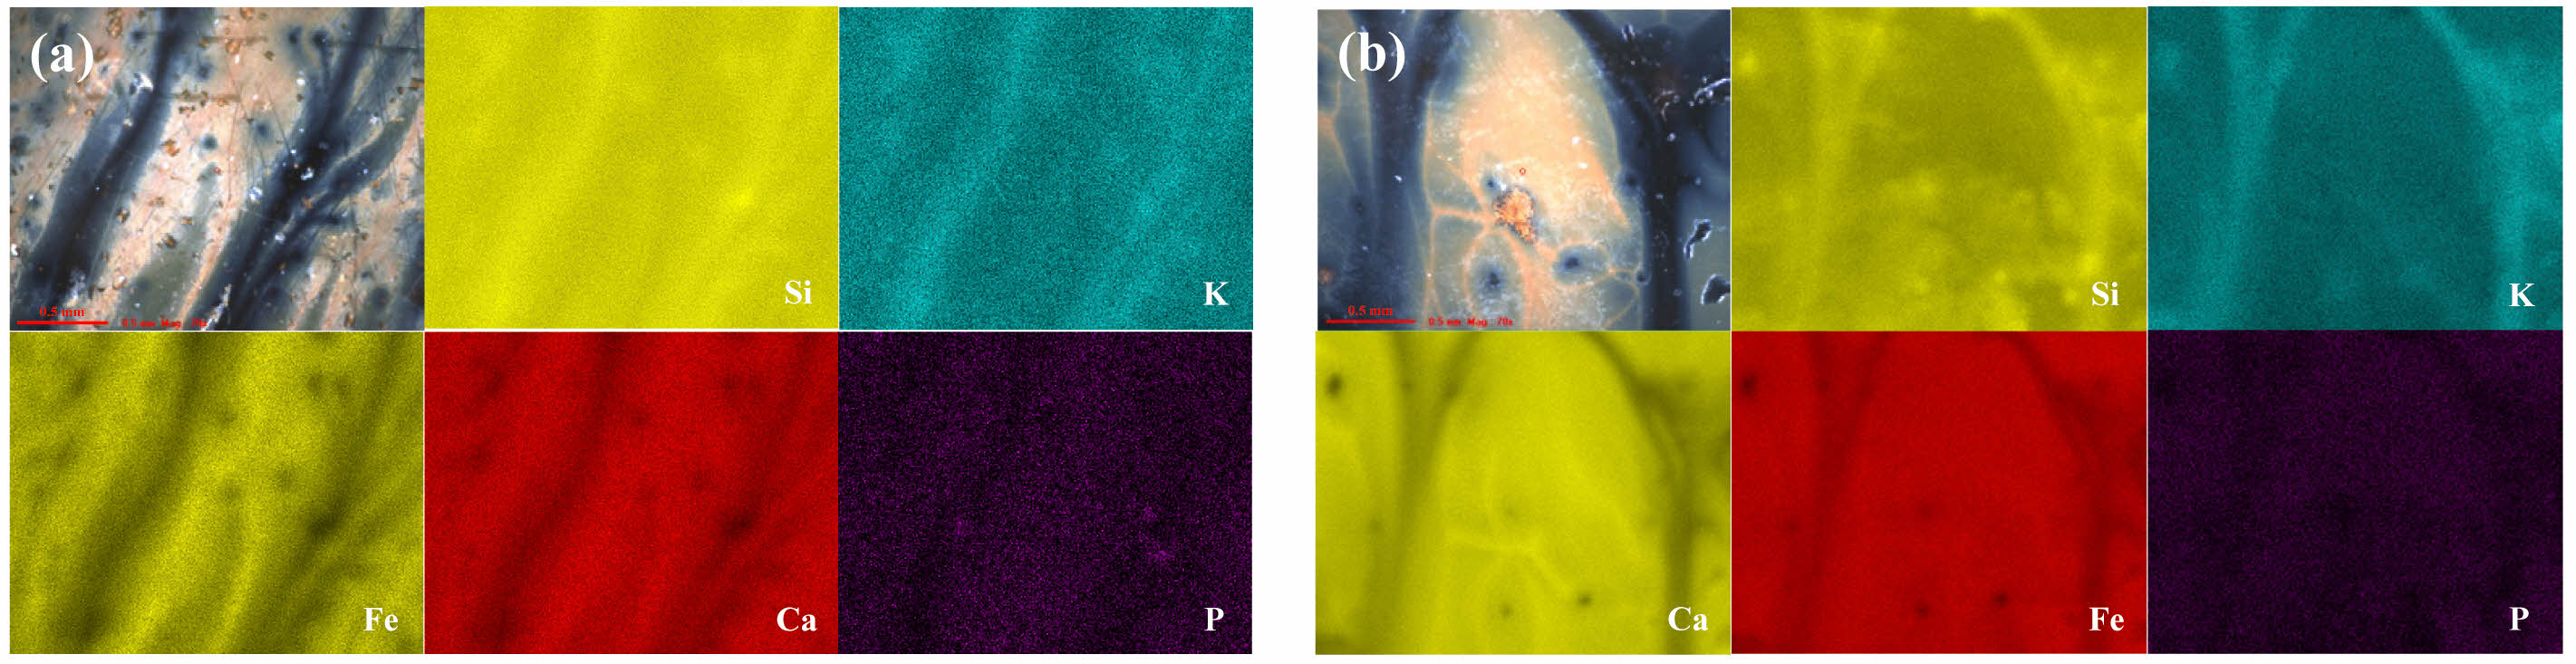
To elucidate the relationship between the elemental composition of the glaze surface and crystalline precipitation, an X-ray fluorescence spectrometer was employed to perform area scanning of the surface elemental distributions on typical specimens HF-2 and OS-4, with the results shown in Fig. 3. Fig. 3 indicates that the elemental distribution patterns on the glaze surfaces of specimens HF-2 and OS-4 are essentially the same: the black-glazed regions are rich in silicon and potassium, whereas the regions displaying hare’s fur or oil spot patterns are enriched in iron, calcium, and phosphorus, suggesting that these elements play key roles in promoting crystalline precipitation on the glaze surface. This is attributed to the ability of calcium and phosphorus to facilitate phase separation in the glaze melt [20, 21], which in turn concentrates the iron required for crystalline precipitation. The formation of the glaze patterns is primarily due to the decomposition of iron oxide generating gas bubbles that migrate iron within the glaze, leading to supersaturation and subsequent crystallization [13, 14, 22]. However, the high SiO₂ content in the black-glazed areas inevitably increases the high-temperature viscosity of the glaze melt, thereby reducing the rate at which gas bubbles can accumulate iron. Moreover, since the ionic potential of K⁺ (Z/r = 0.75) is lower than that of Ca⁺ (Z/r = 1.89), K₂O is less effective than CaO in promoting phase separation [23], which weakens the ability of the glaze melt to concentrate iron through phase separation. Consequently, a glaze formulation rich in SiO₂ and K₂O is unfavorable for the enrichment and crystallization of iron oxide that forms the patterns. Combined with the results shown in Fig. 2(b), it can be inferred that the hare’s fur glaze, belonging to a CaO- and Fe₂O₃-rich system, is conducive to the formation of hare’s fur patterns, whereas the oil spot glaze, which is rich in SiO₂ and K₂O, is unfavorable for the development of oil spot patterns. This difference in the porcelain body and glaze chemical composition systems may be one of the reasons why hare’s fur tea bowls were more prevalent than oil spot tea bowls in Song dynasty Jian kilns.
Phase Composition and Microstructure Analysis
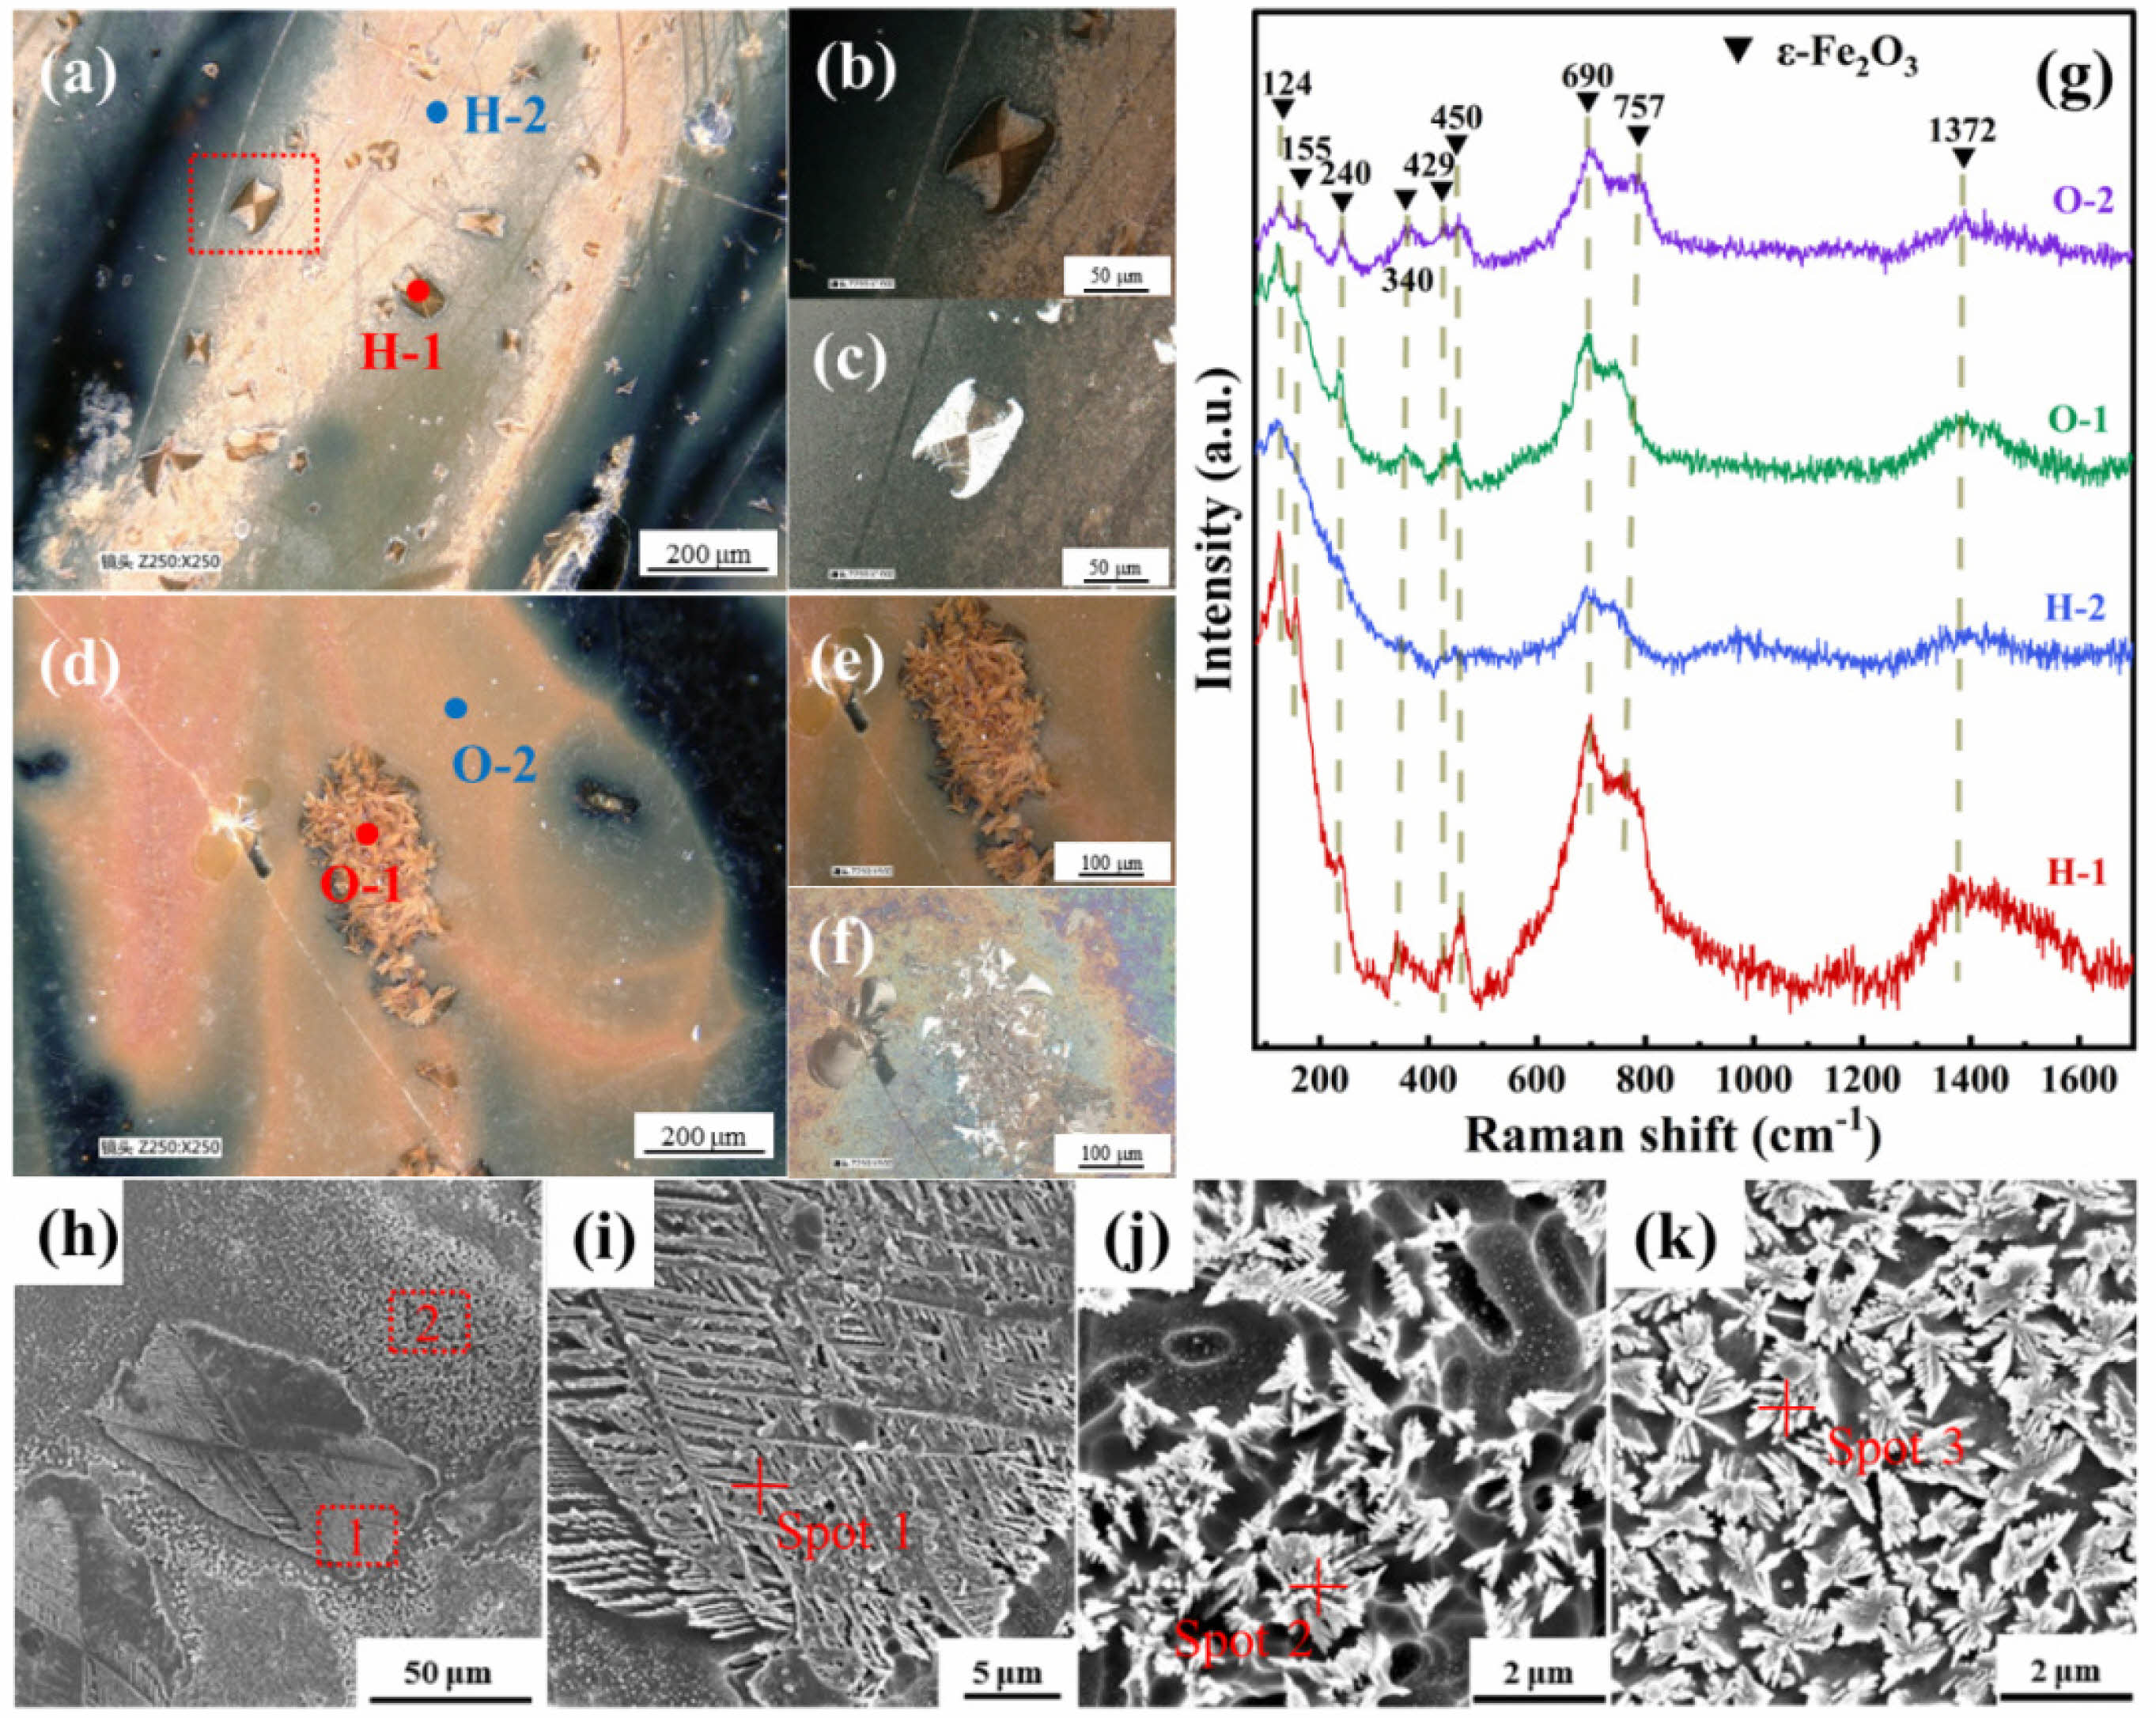
To compare the phase composition and microstructure of the patterned regions in the hare’s fur glazes and oil spot glazes, the patterned areas of typical specimens (HF-2 and OS-4) were analyzed using a depth-of-field optical microscope, a scanning electron microscope (SEM), and a micro-Raman spectrometer, with the results presented in Fig. 4. Figs. 4(a) and 4(d) show optical images of the patterned regions of specimens HF-2 and OS-4 at 250 magnification, revealing the presence of leaf-like crystals or crystal clusters measuring 50–100 μm within the patterns. Figs. 4(b) and 4(e) display magnified images of the patterned regions under ring-light illumination, while Figs. 4(c) and 4(f) present the corresponding views under perpendicular illumination. It can be observed that some crystals exhibit a strong selective reflection under perpendicular illumination, appearing bright white—a phenomenon associated with their oriented arrangement [24]. Fig. 4(g) presents the Raman spectra corresponding to the marked leaf-like crystals and yellow-brown areas (designated as H-1, H-2, O-1, and O-2) within the hare’s fur and oil spot patterns shown in Figs. 4(a) and 4(d). The spectra reveal characteristic Raman peaks in these regions, with peak shifts occurring at approximately 124, 155, 240, 340, 429, 450, 690, 757, and 1372 cm⁻1. These peaks are consistent with the characteristic peaks of ε-Fe₂O₃ [24, 25], indicating that the crystalline phase precipitated within both the hare’s fur and oil spot patterns is primarily ε-Fe₂O₃. Notably, the peak intensities of the leaf-like crystals (H-1 and O-1) are significantly higher than those in the yellow-brown areas (H-2 and O-2), suggesting a higher degree of crystallinity in the leaf-like crystals.
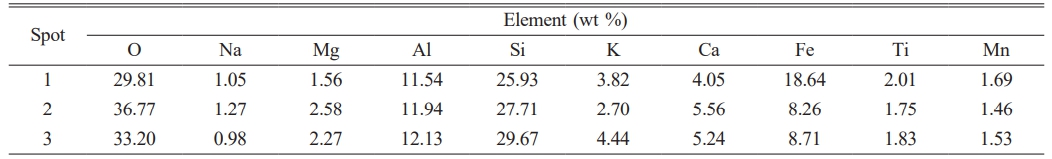
To further verify the differences in the micro-morphology of the precipitated crystals within the hare’s fur and oil spot patterns, SEM observations were conducted on the patterned regions. Fig. 4(h) shows an SEM image of the patterned region in specimen HF-2, with regions 1 and 2 enlarged in Figs. 4(i) and 4(j), respectively. It can be seen that the leaf-like crystals grow in a two-dimensional, oriented, and orderly manner, whereas the yellow-brown regions consist of randomly distributed snowflake-like crystals measuring 1–3 μm, which exhibit the inherent chemical color of ε-Fe₂O₃ [26]. Fig. 4(k) displays an SEM image of the yellow-brown area in the oil spot pattern of specimen OS-4, where similarly scattered snowflake-like crystals are observed. Compared to the yellow-brown areas in the hare’s fur pattern, the crystals in the oil spot pattern are slightly larger and more numerous, resulting in a deeper coloration. Furthermore, EDS analysis of the elemental composition of these crystals was performed, with the results shown in Table 4. As indicated in Table 4, these crystals have a high iron content, and the leaf-like crystals (18.64%) exhibit a significantly higher iron content than the other regions, which is consistent with their stronger Raman peak intensities. In summary, the patterned regions of both the hare’s fur glaze and the oil spot glaze are mainly composed of leaf-like or snowflake-like ε-Fe₂O₃ crystals; however, the leaf-like crystals exhibit a slightly higher degree of crystallinity, larger size, and greater abundance, resulting in a deeper yellow-brown coloration of the patterns.
Analysis of Simulated Firing Results
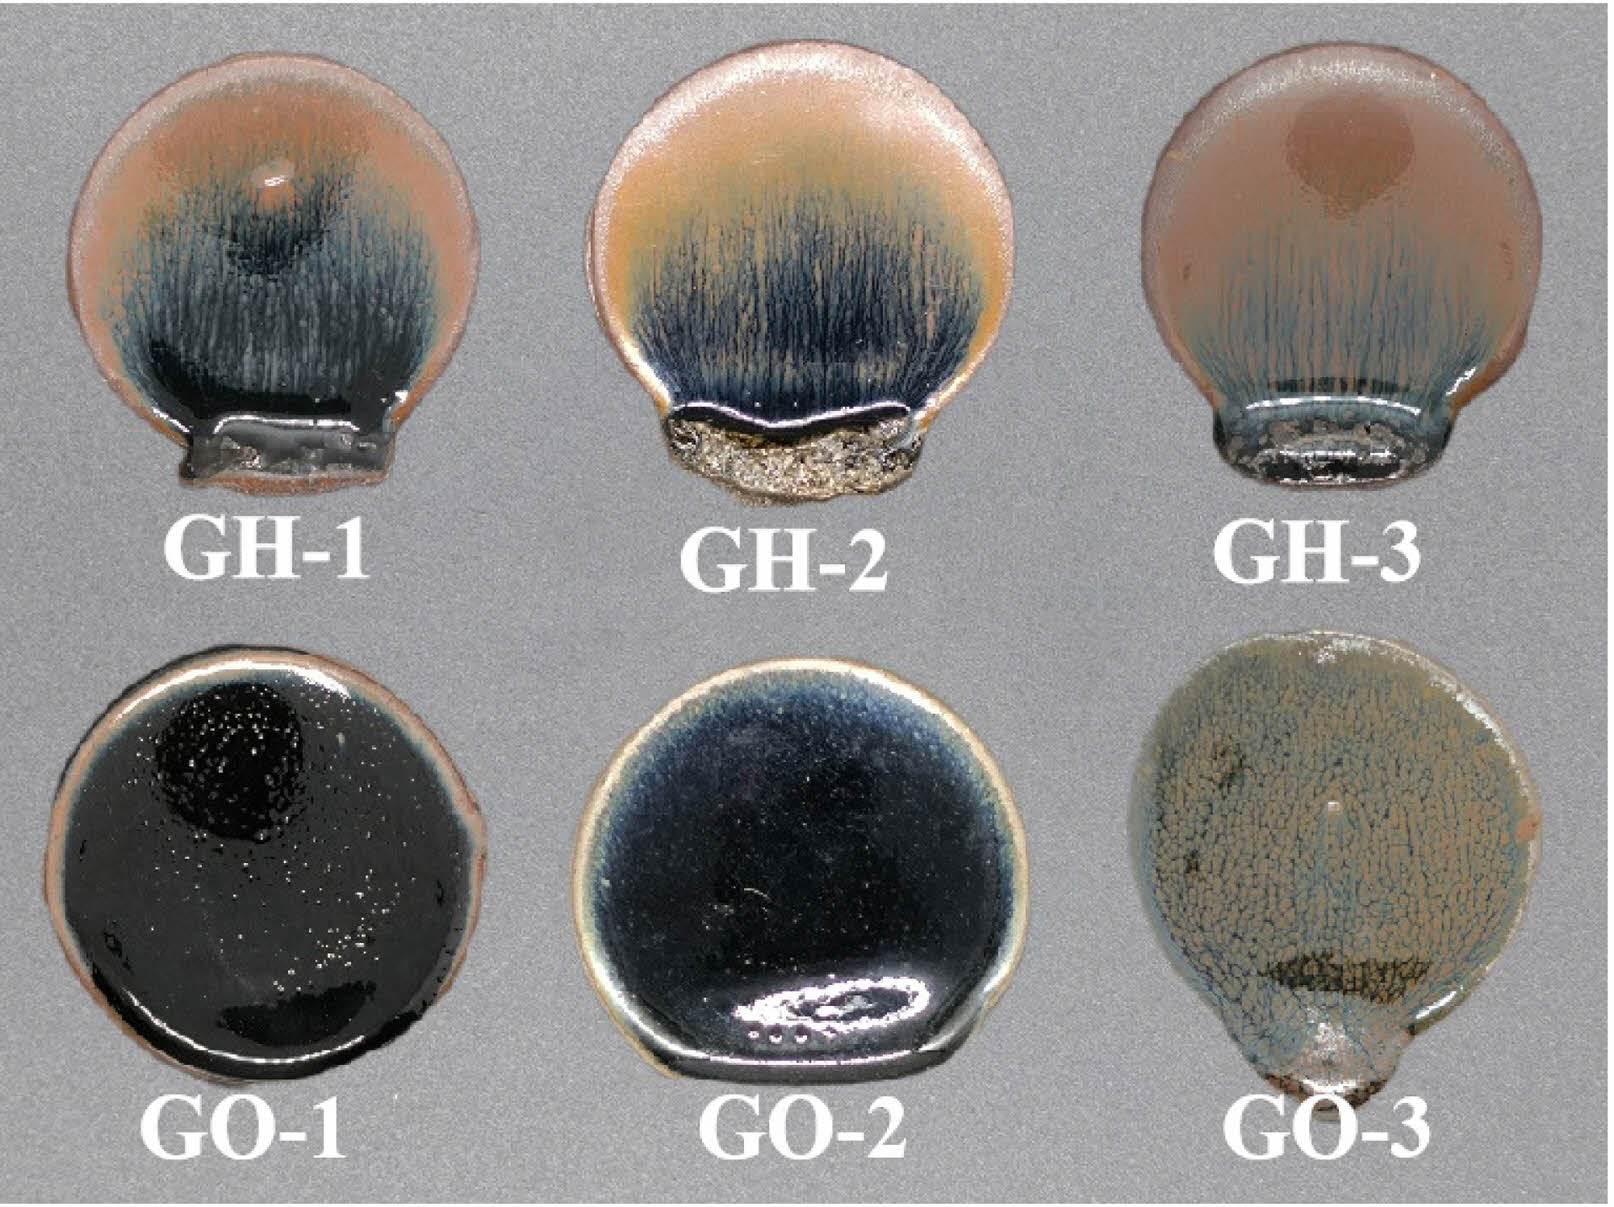
Based on the analysis of the porcelain body and glaze compositions, it was determined that while the ceramic bodies exhibit consistent chemical compositions, the chemical compositions of the hare’s fur glaze and oil spot glaze differ. To verify that these compositional differences are a critical factor influencing pattern formation and to investigate the effect of different firing atmospheres on crystalline precipitation at the glaze surface, simulated re-firing experiments were conducted. Fig. 5 presents the external appearance of the glaze surfaces of the experimental samples. Samples GH-1, GH-2, and GH-3 represent hare’s fur glazes fired under different atmospheres, whereas samples GO-1, GO-2, and GO-3 represent oil spot glazes fired under varying atmospheres (see Table 3 for specific conditions). As shown in Fig. 5, samples GH-1, GH-2, and GH-3 all exhibit distinct hare’s fur patterns, which become clearer and darker as the concentration of the reducing atmosphere increases. In contrast, the oil spot glaze remains uniformly black under an oxidizing atmosphere (sample GO-1) and when the CO volume concentration is 8.61–9.86 vol% in a reducing atmosphere (sample GO-2), with no crystalline pattern observed. Only when the CO volume concentration reaches 13.67–15.38 vol% does sample GO-3 develop an oil spot pattern. These observations indicate that the hare’s fur glaze can form its characteristic pattern under both oxidizing and reducing conditions, whereas the oil spot pattern requires a strongly reducing atmosphere, demonstrating a high dependency on the reducing conditions. This confirms that the compositional characteristics of the hare’s fur glaze are more conducive to crystalline precipitation and pattern formation, while those of the oil spot glaze are not.
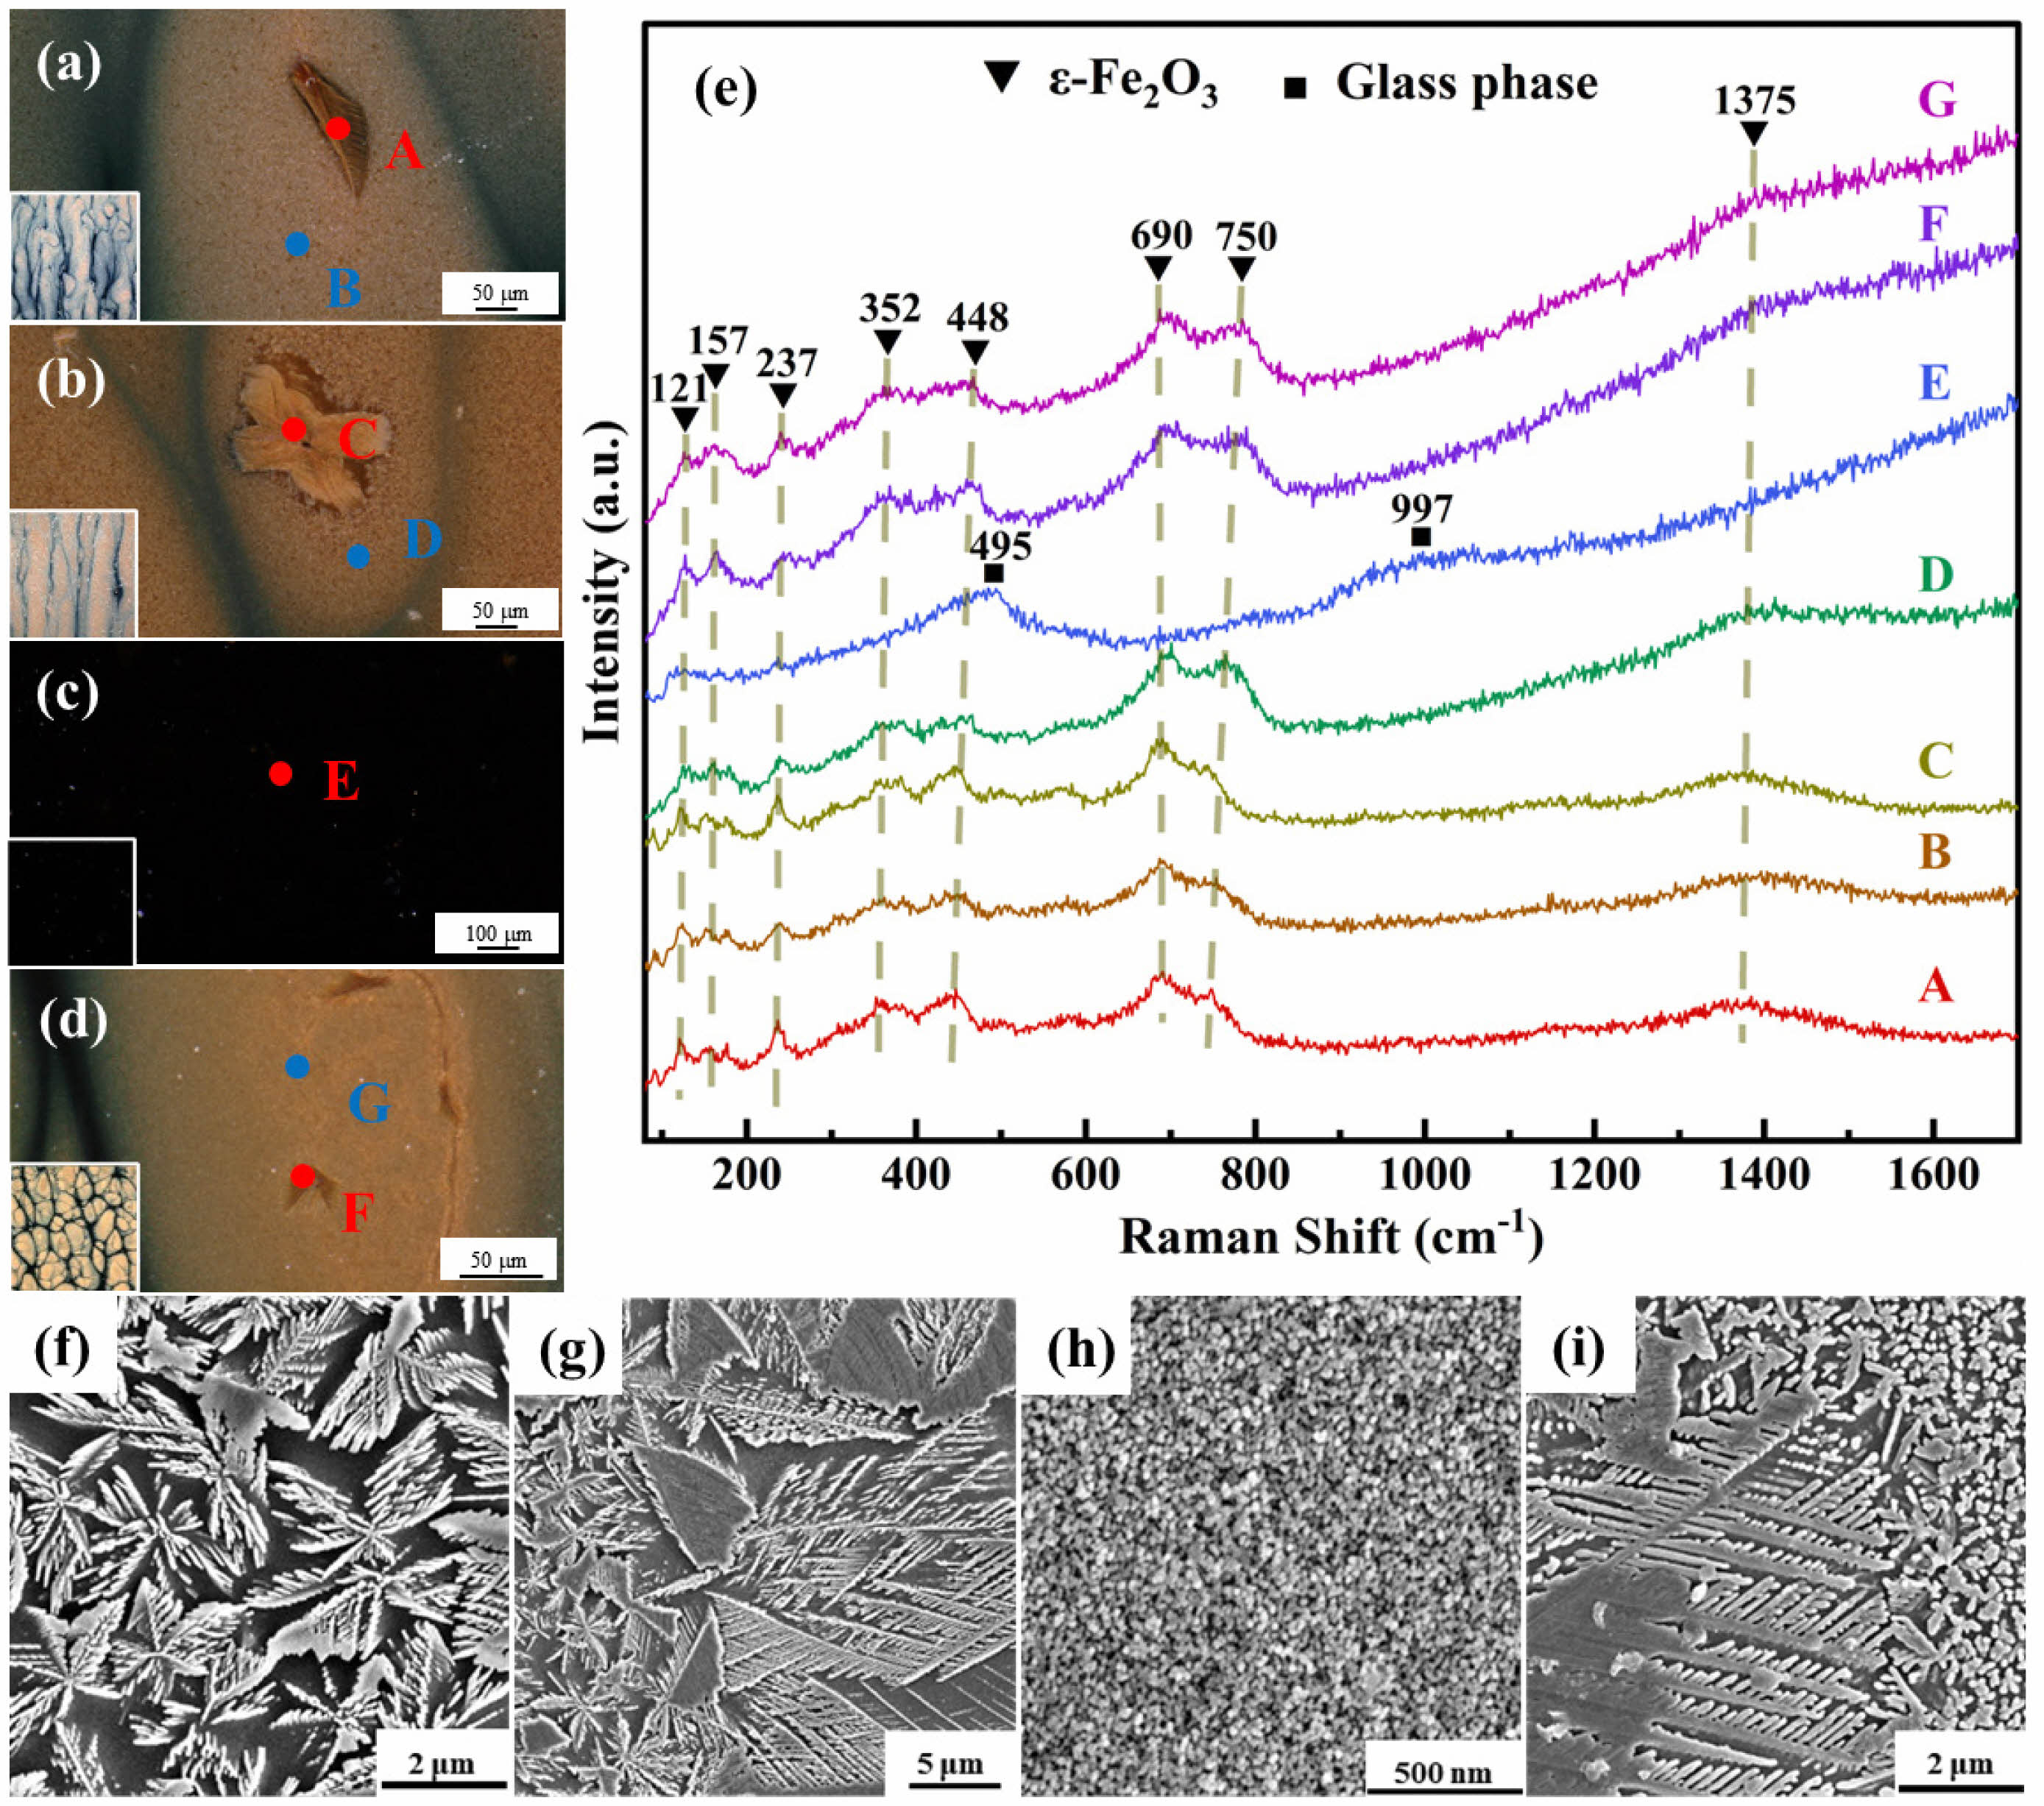
To further investigate the influence of different firing atmospheres on crystalline precipitation, the phase composition and microstructure of samples GH-1, GH-3, GO-1, and GO-3 were analyzed. Figs. 6(a) through 6(d) sequentially display magnified images of the glaze surfaces of samples GH-1, GH-3, GO-1, and GO-3, respectively. With the exception of sample GO-1—which exhibits a uniformly black glaze surface—the other three samples show the presence of leaf-like crystals within the patterned areas, with sample GH-3 displaying the largest crystal size and the deepest yellow-brown coloration in its pattern. To further analyze the phase composition of the glaze surfaces, a micro-Raman spectrometer was used to test the points labeled A–G in Figs. 6(a)–6(d), and the results are shown in Fig. 6(e). The spectra reveal that sample GO-1 exhibits two broad characteristic peaks near 495 and 997 cm⁻¹, whereas the other three samples (GH-1, GH-3, and GO-3) display Raman peaks at approximately 121, 157, 237, 352, 448, 690, 750, and 1375 cm⁻¹. The broad peak in the 400–600 cm⁻¹ region is associated with the stretching vibrations of [SiO₄] tetrahedra, while the broad peak in the 850–1200 cm⁻¹ region is attributed to the symmetric stretching vibrations of [SiO₄] tetrahedra with different degrees of polymerization [27–29]. This indicates that the glaze surface of sample GO-1 is dominated by a Si–O glassy phase, whereas the Raman peaks of the other three samples are similar to the characteristic peaks of ε-Fe₂O₃ [24, 25], indicating that the leaf-like crystals and yellow-brown patterns in these samples are composed of ε-Fe₂O₃ crystals. Figs. 6(f) through 6(i) present the SEM images of the glaze surfaces of samples GH-1, GH-3, GO-1, and GO-3, respectively. It can be observed that the patterned regions of samples GH-1, GH-3, and GO-3 exhibit micron-sized snowflake-like and leaf-like crystals, whereas the glaze surface of sample GO-1 is primarily composed of phase-separated particles on the order of tens of nanometers, with no obvious crystalline phase present. In conjunction with the Raman analysis in Fig. 6(e), it is confirmed that the micron-sized snowflake-like and leaf-like crystals are ε-Fe₂O₃, which is consistent with the microstructure and phase composition observed in specimens HF-2 and OS-4. In summary, the simulated experiments successfully reproduced the hare’s fur and oil spot glazes of the Jian kiln and validated the differences in their formation conditions: the hare’s fur glaze is capable of precipitating ε-Fe₂O₃ under both oxidizing and reducing atmospheres—although reducing conditions are more conducive to its precipitation—whereas the oil spot glaze requires a strongly reducing atmosphere to precipitate ε-Fe₂O₃ and form its characteristic pattern.
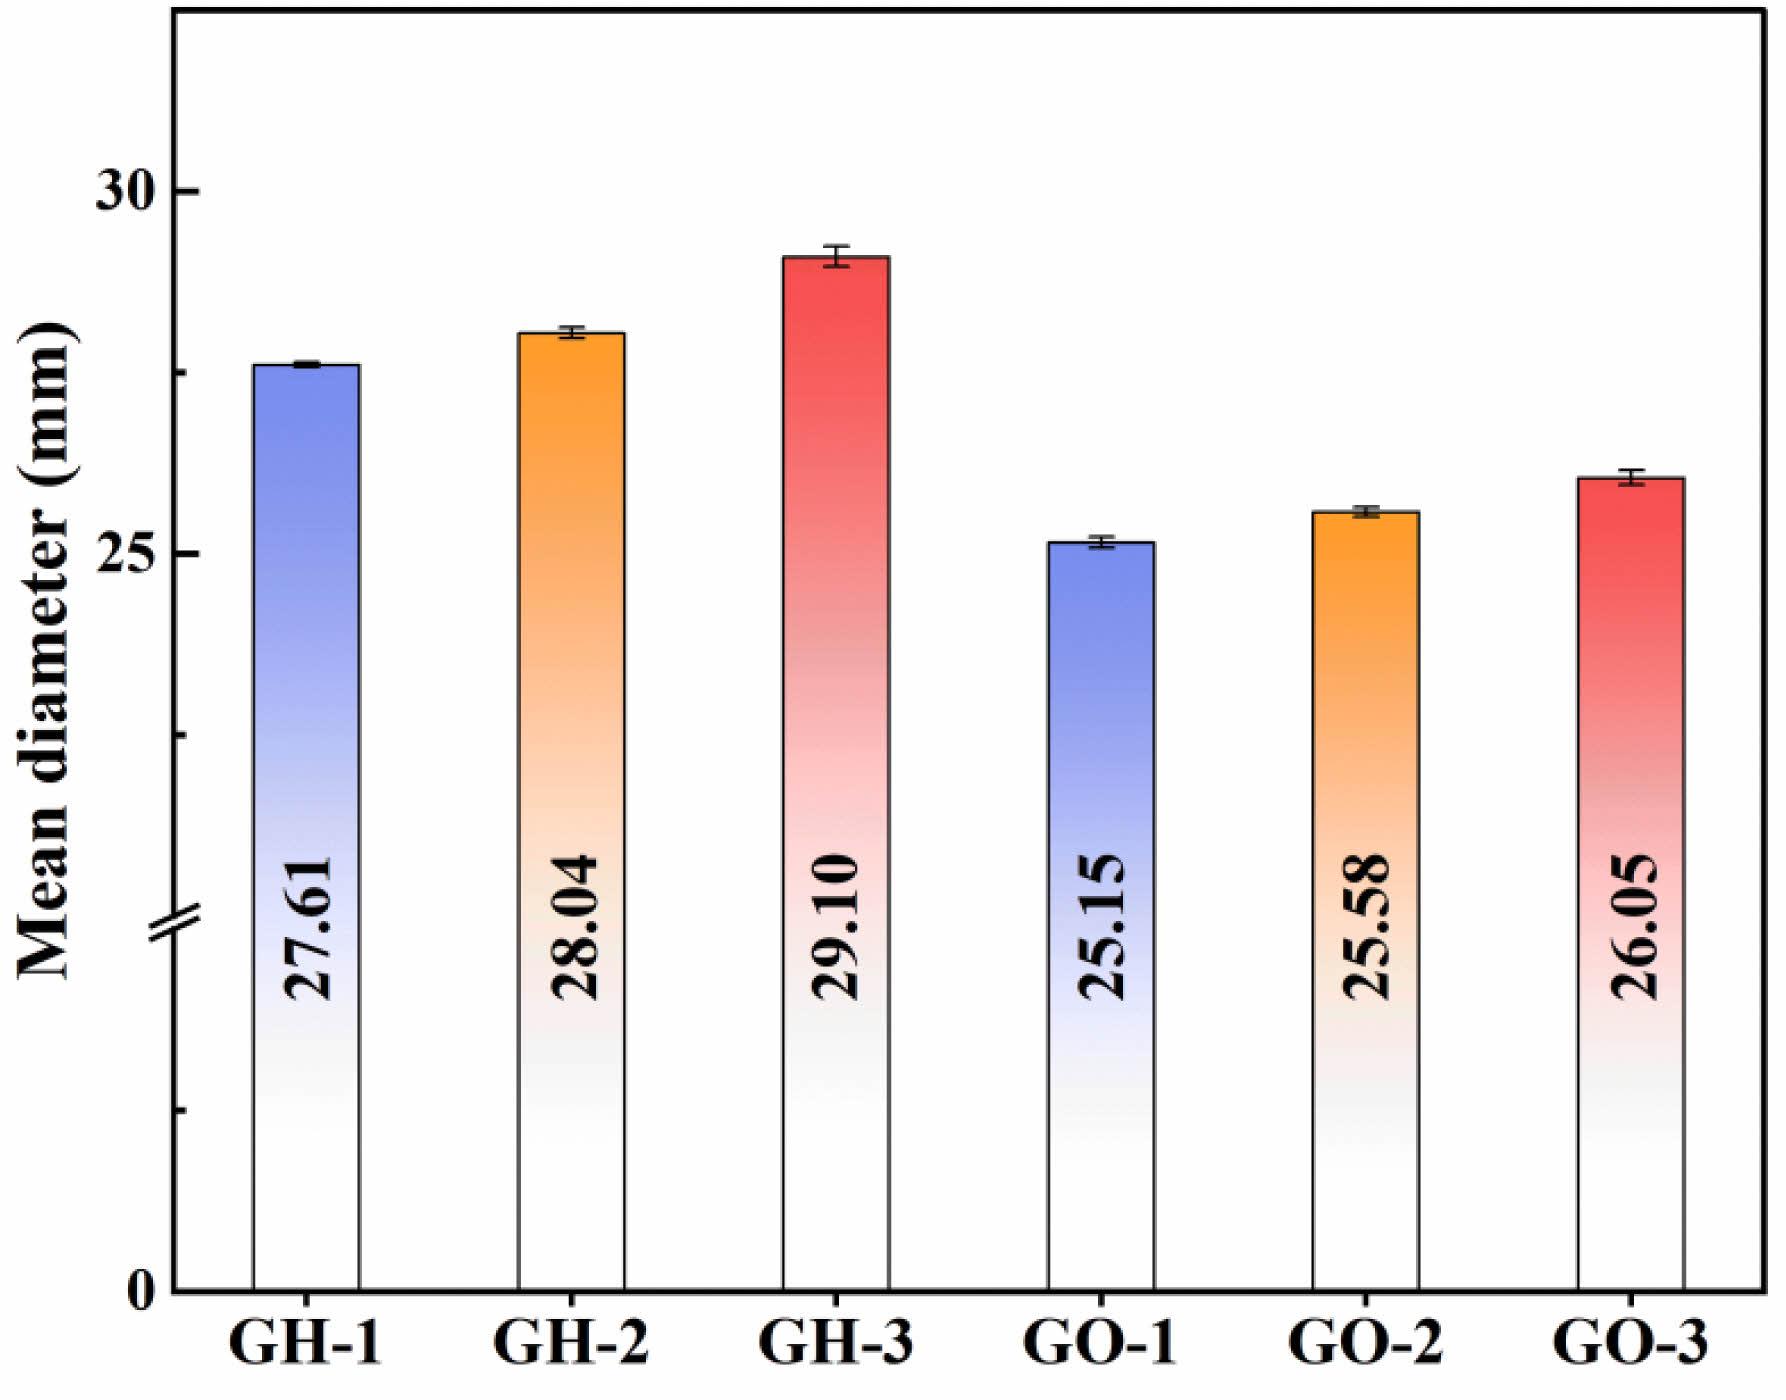
Both the hare’s fur glaze and the oil spot glaze form their patterns through the decomposition of iron oxide at high temperatures, which generates gas bubbles that transport iron within the glaze to form a precipitated layer of iron oxide. However, the high-temperature viscosity of the glaze melt influences the migration rate of these gas bubbles, thereby affecting the enrichment and crystalline precipitation of iron. Fig. 7 presents a bar chart of the molten diameters of the hare’s fur and oil spot glazes. The results indicate that the high-temperature molten diameter of the hare’s fur glaze is significantly larger than that of the oil spot glaze, and that the molten diameter increases with the concentration of the reducing atmosphere. In light of the chemical composition analysis—which shows that the hare’s fur glaze contains higher levels of strong fluxing agents CaO and Fe₂O₃, whereas the oil spot glaze is relatively richer in SiO₂ and K₂O—it can be inferred that the hare’s fur glaze has a lower high-temperature viscosity, facilitating the accumulation and crystalline precipitation of iron on the glaze surface to form its pattern. Under oxidizing conditions, excess Fe³⁺ enters the glass network in the form of [FeO₄] tetrahedra, a structure that increases the connectivity of the glass network and leads to an increase in the viscosity of the glaze melt [19]. The increase in viscosity will limit the migration ability of the ions and thus reduce the crystallization ability of the glaze melt. However, since a reducing atmosphere can reduce Fe2⁺ to Fe3⁺ in the glaze, thereby lowering the high-temperature viscosity of the glaze melt [30, 31], the molten diameter increases with the concentration of the reducing atmosphere, further promoting crystalline precipitation on the glaze surface. In contrast, sample GH-3 exhibits a deeper hare’s fur pattern with larger and more abundant precipitated crystals, while the oil spot glaze transitions from a uniformly black surface to one in which oil spot crystals are precipitated. Furthermore, to elucidate the rarity of oil spot glaze in Song dynasty Jian kiln porcelain, the firing atmosphere of a modern, reconstructed ancient long kiln (approximately 10 m in length) was tested; during its reducing firing stage, the maximum CO volume concentration reached only 6.97–9.05 vol%. However, the simulated experiments revealed that a CO volume concentration of 13.67–15.38 vol% is required for a distinct oil spot pattern to precipitate. Generally, the larger the kiln volume, the more difficult it is to achieve a high reducing atmosphere concentration. It can thus be inferred that the extremely long and voluminous long kilns used in the Song dynasty Jian kiln likely encountered difficulties in forming a highly concentrated reducing atmosphere during firing, which is another important factor contributing to the rarity of oil spot glaze.
|
Fig. 2 Principal Component Analysis of Ceramic Body and Glaze Compositions for Hare’s Fur and Oil Spot Tea Bowls: (a) Body; (b) Glaze. |
|
Fig. 3 Elemental Distribution Mapping of the Glaze Surface for Representative Samples: (a) Sample HF-2; (b) Sample OS-4. |
|
Fig. 4 Microstructural Photographs and Raman Spectra of the Patterned Glaze Regions in Specimens HF-2 and OS-4. |
|
Fig. 5 Microstructural Photographs and Raman Spectra of Hare’s Fur Glaze and Oil Spot Glaze Samples. |
|
Fig. 6 Microstructural Photographs and Raman Spectra of Hare’s Fur Glaze (GH-1 and GH-3) and Oil Spot Glaze (GO-1 and GO3) Samples. |
|
Fig. 7 Bar Chart of Molten Diameters of Samples under Different Firing Atmospheres. |
Through a comparative analysis of the chemical composition, phase composition, and microstructure of Song dynasty Jian kiln hare’s fur glaze and oil spot glaze specimens, revealed that although the ceramic bodies of the tea bowls share similar chemical compositions and the primary constituent of the glaze patterns is ε-Fe₂O₃, significant differences exist in the glaze compositions. The hare’s fur glaze exhibits a relatively stable composition with higher contents of CaO and Fe₂O₃, whereas the oil spot glaze shows greater compositional variability with elevated levels of SiO₂ and K₂O. Both scientific characterization and simulated experiments confirmed that the compositional system of the hare’s fur glaze is more conducive to crystalline precipitation and pattern formation than that of the oil spot glaze. The crystalline precipitation in the hare’s fur glaze occurs under both oxidizing and reducing firing atmospheres—although reducing conditions further lower the high-temperature viscosity of the glaze melt and promote the precipitation of ε-Fe₂O₃—whereas the formation of the oil spot pattern is highly dependent on a strongly reducing atmosphere, with the pattern only forming when the CO volume concentration reaches 13.67–15.38 vol%. Thus, the rarity of oil spot tea bowls in Song dynasty Jian kiln porcelain can be attributed to their unique compositional characteristics and the stringent requirement for a high concentration of reducing atmosphere, which together render the formation of ε-Fe₂O₃ in oil spot glaze unfavorable.
JCPR_2025_026_03_463_Supplementary_Information.pdf (28 kb)
Supplementary Information
This research was supported by the National Key R&D Program (2023YFF0905800), the Jingdezhen City Key Science and Technology Project (2023SF001), and the Jiangxi Province Graduate Innovation Special Fund Project (YC2024-B246).
- 1. R. Xie, Southeast Cult. [5] (1992) 230-234.
- 2. J. Li, in “China’s History of Science and Technology: Ceramic Vol” (Sci. Press, 1998) p. 186-192.
- 3. W. Ye, B. Geng, and Z. Lin, in “Jian Kiln” (Jiangxi Fine Arts Press, 2016) p. 21-29+92.
- 4. Z. Lin, Z. Wang, and B. Lu, Marit. Hist. Res. [2] (1987) 12-19.
- 5. W. Ye, Archaeol. [4] (1964) 191-193.
- 6. D. Li, Archaeol. [12] (1990) 1095-1099+1089+1156-1157.
- 7. J. Li, Archaeol. [2] (1995) 148-154+159+199.
- 8. X. Chen, S. Chen, and M. Ruan, Chin. Ceram. [3] (1983) 55-59.
- 9. R. Huang, X. Chen, and M. Ruan, Jingdezhen Ceram. [1] (1984) 39-46.
- 10. X. Chen, R. Huang, and J. Li, J. Jingdezhen Ceram. Inst. [1] (1995) 26-34.
- 11. D. Xie, Archaeol. [11] (1994) 1056.
- 12. C. Jiang, Y. Fang, and J. Zhou, Chin. Ceram. 59[4] (2023) 68-75.
- 13. X. Shi, Y. Yu, and J. Wu, RSC Adv. 9[71] (2019) 41927-41933.
-

- 14. C. Jiang, J. Wu, and K. Liu, Appl. Sci. 14[11] (2024) 10210.
-
- 15. Y. Fang, H. Li, and J. Zhou, Chin. Ceram. 60[7] (2024) 66-73.
- 16. H. Li, Q. Bao, and J. Yang, J. Ceram. 44[6] (2023) 1139-1145.
-
- 17. C. Jiang, J. Zhou, and J. Wu, Chin. Ceram. Soc. 43[6] (2024) 2269-2278+2317.
- 18. Y. Fang, C. Jiang, and J. Zhou, Chin. Ceram. 60[1] (2024) 68-74+121.
- 19. G. Wang, Y. Du, and M. Zhao, J. Ceram. Process. Res. 22[6] (2021) 665-674.
-
- 20. P. Shi, F. Wang, and J. Wang, Ceram. Int. 44[14] (2018) 116407-116413.
-
- 21. Z. Sang, F. Wang, and X. Wei, J. Ceram. Process. Res. 23[6] (2022) 758-765.
-
- 22. X. Chen, S. Chen, and M. Ruan, Chin. Ceram. [2] (1983) 52-59.
- 23. L. Zhang, X. Huang, and X. Song, “Fundamentals of Materials Science” (Wuhan Univ. Technol. Press, 2004) p. 437.
- 24. C. Dejoie, P. Sciau, and Z. Liu, Sci. Rep. [4] (2014) 4941.
-
- 25. Q. Hoo, Y. Liang, and X. Cao, J. Eur. Ceram. Soc. 40[12] (2020) 4340-4347.
-
- 26. M. Li, W. Li, and C. Xu, J. Chin. Ceram. Soc. 48[7] (2020) 1134-1144.
- 27. P. Colomban, J. Non-Cryst. Solids 323 (2003) 180-187.
-
- 28. P. Colomban and O. Paulsen, J. Am. Ceram. Soc. 88 (2005) 390-395.
-
- 29. M. Hao, M. Zhang, and X. Zhe, J. Ceram. Process. Res. 25[5] (2024) 827-841.
-
- 30. W. Xuan, H. Wang, and B. Meyer, Energy Fuels 34[11] (2020) 13698-13706.
-
- 31. X. Guo, X. Cai, and H. Yang, J. Non-Cryst. Solids 405[1] (2014) 63-67.
-
 This Article
-
2025; 26(3): 463-471
Published on Jun 30, 2025
- 10.36410/jcpr.2025.26.3.463
- Received on Mar 4, 2025
- Revised on Apr 21, 2025
- Accepted on Apr 29, 2025
Services
- Abstract
introduction
materials and methods
results and discussion
conclusions
- Supplementary Information
- Acknowledgements
- References
- Full Text PDF
Shared
Correspondence to
- Junming Wu
-
School of Archaeology and Museology, Jingdezhen Ceramic University, Jingdezhen 333403, China
Tel : +86-0798-8495508 - E-mail: woshiwxb@126.com
Clean-Energy Research Institute(CRI), Hanyang University, 222, Wangsimni-ro, Seongdong-gu, Seoul, 04763, Korea
E-mail: jcpr@hanyang.ac.kr