


- Microbial community dynamics and biogas optimization in full-scale anaerobic digesters across South Korea
Okkyoung Choia, Darsha Prabhaharanb, Hyojeong Songc, HyunJin Kimd, Hyunook Kime,*, Jung Han Parkf, Amith Abrahamg and Byoung-In Sangb,g,*
aEco Lab Center, SK Ecoplant, 51, Jong-ro, Jongno-gu, Seoul 04763, Republic of Korea
bDepartment of Chemical Engineering, Hanyang University, 222 Wangsimni-ro, Seongdong- gu, Seoul 04763, Republic of Korea
cDepartment of Environmental Engineering, University of Seoul, 163 Seoulsiripdae-ro, Dongdaemun-gu, Seoul 02504, Republic of Korea
dDepartment of Geosciences, University of Tübingen, Schnarrenbergstraße 94-96, 72076 Tübingen, Germany
eKorea Electric Power Research Institute, 105 Munji-ro, Yooseong-gu, Daejeon 34056, Republic of Korea
fNational Research Facilities and Equipment Center, Korea Basic Science Institute, 169-148 Gwahak-ro, Yuseong-gu, Daejeon 34133, Republic of Korea
gClean-Energy Research Institute, Hanyang University, 222 Wangsimni-ro, Seongdong- gu, Seoul 04763, Republic of KoreaThis article is an open access article distributed under the terms of the Creative Commons Attribution Non-Commercial License (http://creativecommons.org/licenses/by-nc/4.0) which permits unrestricted non-commercial use, distribution, and reproduction in any medium, provided the original work is properly cited.
Optimizing microbial communities in anaerobic digesters is essential to improving biogas production for sustainable energy. This study utilized high-throughput 16S rRNA gene sequencing to profile microbial communities from 18 full-scale biogas plants across South Korea, revealing key microbial patterns linked to performance. The bacterial consortia were dominated by Firmicutes, Bacteroidetes, Cloacimonetes, and Proteobacteria, with feedstock type exerting a marked influence on community composition. Firmicutes predominated in FW-fed digesters that exhibited high methane yields (≥ 1 m³ CH₄ m⁻³ day⁻¹), whereas Proteobacteria prevailed in activated sludge-fed systems characterized by lower methane production. Among archaeal families, Methanosarcinaceae, Methanomassiliicoccaceae, and Methanobacteriaceae were especially abundant in high-performing plants. Co-occurrence network analysis revealed a strong positive association between Firmicutes and Methanosarcinaceae in these reactors, indicative of synergistic metabolic interactions that enhance methane generation. Conversely, low-yield plants showed prominent co-occurrence patterns between Proteobacteria and Methanosaetaceae, suggesting alternative or less efficient pathways of methanogenesis. Overall, our findings underscore the critical role of feedstock-dependent microbial networks in determining biogas plant performance, highlighting specific bacterial and archaeal groups as potential biomarkers for monitoring and optimizing anaerobic digestion. These insights also lay a foundation for computational modeling aimed at predicting metabolic outcomes based on microbiome data, ultimately contributing to more effective and sustainable biogas production.
Keywords: Biogas, Anaerobic digestion, Microbial community, Co-occurrence networks, Biomarkers.
Anaerobic digestion (AD) is a multi-stage biochemical process in which a consortium of microorganisms degrades organic substrates under strictly anoxic conditions, ultimately yielding methane and carbon dioxide as principal end products. Beyond its capacity for energy recovery, AD provides a versatile platform for organic waste mitigation, greenhouse gas reduction, and facilitating a circular economy. Globally, biogas production increased by 11.45%, from 1.31 EJ in 2016 to 1.46 EJ in 2020. In South Korea, AD systems focus on waste treatment rather than energy production, highlighting the need for improved operations and microbial analyses to enhance biogas efficiency [1, 2].
Within the AD system, carbohydrates, proteins, and lipids are sequentially hydrolyzed and fermented into volatile fatty acids (VFAs) before conversion to methane and CO2 by a consortium of microorganisms working sequentially across process steps [3–5]. As each stage of the AD process involves discrete metabolic interactions, even subtle perturbations in community structure can significantly disrupt overall performance, as they are strongly influenced by feedstocks [6, 7]. In 2022, South Korea produced 101,000 metric tons of oil equivalent (toe) of energy from biogas [8]. As of 2016, 90 commercial biogas plants were operating in the country, primarily processing food waste (FW), followed by livestock manures and sewage sludges. The average biogas yield in domestic facilities was 77.5 m³ per ton of FW and 21.7 m³ per ton of wastewater [9]. To address low production efficiency, South Korea aims to process 5.57 million tons of organic waste annually and produce 500 million Nm³ of biogas by 2026 [10].
Inspired by the EU’s advanced biogas sector, which utilizes diverse feedstocks—such as agricultural residues and energy crops—and achieves higher average yields of 120.0 m³ per ton of organic waste [11]. Numerous studies have examined the roles of hydraulic retention time, ammonia concentrations, operating temperatures, feedstock composition, toxicity, and organic loading rates in shaping microbial communities [7, 8]. From these analyses, certain methanogens have been identified as biomarkers indicative of biogas production performance [12–14]. However, most of them have focused on small-scale or narrowly defined parameters, offering only limited insights into the complex metabolic networks that develop in full-scale AD systems.
By utilizing recent advancements in bioinformatics, such as multi omics and co-occurrence pattern analysis, researchers are uncovering interspecies interactions and identifying hub microbes that play pivotal roles in the AD process [15–17]. These hub microbes responsible for critical syntrophic interactions can inform the development of biomarkers for rapid diagnostic assays and bioaugmentation strategies aimed at boosting biogas yields. For instance, prior investigations have highlighted syntrophic mechanisms like direct interspecies electron transfer (DIET) between Geobacter species and acetoclastic methanogens. This network can be enhanced by the addition of activated carbon, emphasizing the importance of syntrophic metabolism in the AD process [18-20]. Despite the significance of the AD microbial community, interactions between microbiota, such as bacteria–bacteria, bacteria–methanogen, and methanogen–methanogen are not well established in the large-scale AD reactors, including serial processes and symbiotic microbial networks [16]. Furthermore, the roles of less-characterized taxa including uncultured archaeal lineages have not been systematically well evaluated in operational AD biogas plants.
In this study, we collected 60 microbiome samples from 18 commercial biogas plants in South Korea. Based on their performance, the biogas plants were categorized into two groups: high biogas production (Group 1) and low biogas production (Group 2). We present a robust dataset that not only pinpoints major functional groups but also uncovers potentially novel syntrophic linkages that could shape industrial AD strategies. Overall, our findings advance fundamental knowledge of feedstock-driven microbial assembly and highlight the importance of bacterial–archaeal interactions in determining process performance. These insights also lay the groundwork for computational models that integrate microbial profiles to enhance biogas production. Ultimately, by tackling challenges such as feedstock variability, process instability, and suboptimal methane yields, this work underscores the pivotal role of AD as a cornerstone for sustainable energy solutions. Notably, co-occurrence analysis offers a powerful means to detect shifts in microbial networks, enabling early interventions to maintain process stability and improve methane output. Studies focusing on additional model systems and employing metagenomic or metatranscriptomic approaches can further confirm and extend the implications of these results, driving continued progress in AD optimization.
Commercial biogas plants and sampling procedures
Eighteen commercial biogas plants located in various cities across South Korea were selected for this study. All biogas plants operated under mesophilic conditions and utilized a range of organic wastes as feedstocks in their digesters, either as single substrates or combined substrates (Table 1). Samples were collected seasonally using 2-liter lightproof plastic bottles from both the influent and effluent streams of the AD plants. For microbial community assessment, samples were transferred to 50 mL tubes, sealed, and stored at –70 °C before further analysis.
Chemical Analysis
Water quality parameters were analyzed for both influent and effluent samples. Total and soluble chemical oxygen demand (TCOD and SCOD), total solids (TS), volatile solids (VS), total Kjeldahl nitrogen (TKN), total ammonia nitrogen (TAN), total phosphorus (TP), pH, total alkalinity (Alk), and lipids (LP) were measured according to standard methods [21].
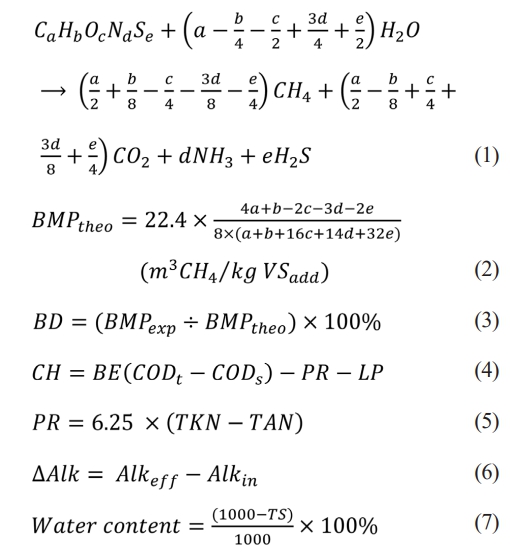
The biochemical methane potential (BMP) test was conducted to estimate the methane potential and biodegradation extent (BE) of the influent samples collected from each biogas plant. BMP tests were performed using an automatic BMP tester (AMPTS II, Bioprocess Control, Lund, Sweden). The elemental composition of the influent samples was analyzed using a Thermo 1112 Series Flash EA NC Soil Analyzer (Thermo Fisher Scientific, Rome, Italy). The theoretical methane yield (BMP_theo) was calculated using Eqs. (1) and (2) [22]. The biodegradation extent of a given influent sample was calculated using Eq. (3) [1]. The carbohydrates (CH), proteins (PR), and variation of alkalinity (∆Alk) to indicate the buffering capacity and water content were calculated using Eq. (4)-(7). VFAs were analyzed by a gas chromatograph with a flame ionization detector (GC 2010, Shimadzu, Kyoto, Japan). A wax column (SH-Rtx-Wax with 30 m length×0.25 mm inner diameter×0.25 µm thickness (Chimdazu, Kyoto, Japan)) was used for separation.
Microbial community analysis
DNA extraction
DNA was extracted from each sample (0.5 g) using the FastDNA™ Spin Kit for Soil (MP Biomedicals, Solon, OH, USA) according to the manufacturer’s instructions. The concentration of extracted double-stranded DNA was determined using an Infinite M200 PRO microplate reader (Tecan Austria GmbH, Grödig, Austria). The DNA samples were stored at -27 °C for subsequent analysis.
DNA Amplification and Next-Generation Sequencing
The V3–V4 region of the bacterial 16S rRNA gene was amplified using primers 341F and 805R. Samples were amplified for pyrosequencing using a forward and reverse fusion primer. The forward primer was constructed with the (5’-3’) Nextera consensus (TCGTCGGCAGCGTC), a sequencing adaptor (AGATGTGTATAAGAGACAG), and the appropriate forward primer selected for the bacterial diversity assay (341F: CCTACGGGNGGCWGCAG). The reverse fusion primer was constructed
with the (5’-3’) Nextera consensus (GTCTCGTGGGCTCGG), a sequencing adaptor, and the proper reverse
primer for the bacterial diversity assay (805R: GACTACHVGGGTATCTAATCC). To detect methanogen species, Arch519F (CAGCCGCCGCGGTAA) and Arch934R (GTGCTCCCCCGCCAATTC) were used as methanogen-specific primers. Amplifications were conducted in a 25 µL reaction with Dr. MAX DNA polymerase (Doctor Protein Inc, Korea), 1 µL of 5 µM primer, and 1 µL of template. Reactions were carried out using the following thermal profile: 95 °C for 3 min, then 25 cycles of 95 °C for 30 s, 55 °C for 30 s, 72 °C for 30 s, followed by one cycle of 72 °C for 5 min and a 4 °C hold. DNA sequencing was performed by CJBiosciences (Seoul, Korea) using an Illumina/MiSeq platform (San Diego, CA, USA) according to the manufacturer’s protocol.
Bioinformatics and Co-Occurrence Pattern Analysis
Raw sequencing reads from each biogas plant sample were processed to analyze the compositions and proportions of bacteria and methanogens using CLcommunity software (Version 3.46, ChunLab Inc., Seoul, Korea). Each pyrosequencing read was processed and taxonomically assigned using the EzTaxon-e database [23]. Canonical correspondence analysis (CCA) was performed to determine the relationships between microbial communities and monitored process parameters such as feedstock contents, SCOD, VS, TP, TN, organic loading rate (OLR), hydraulic retention time (HRT), pH, and alkalinity change (ΔAlk). Taxonomic suffixes used were _s (species), _g (genus), _f (family), _o (order), _c (class), and _p (phylum). Unclassified taxa were indicated with the suffix _uc [24].
Heat maps were generated using CLcommunity software (Chunlab. Inc., Seoul, Korea) at the phylum level for bacteria and family level for methanogens, with a 5% abundance cutoff for individual samples. Overall phylogenetic distances among communities were estimated using Fast UniFrac [25] and visualized via principal coordinate analysis (PCoA) [26]. The correlation matrix was visualized as a correlogram using R software. Network plots of the correlation matrix were visualized using Gephi software [27]. Statistical analyses were conducted using the data analysis tools in Microsoft Excel.
The raw reads generated in this study are available in the EMBL Sequence Read Archive (SRA) database under accession numbers SUB4238920 and SUB4379904.
|
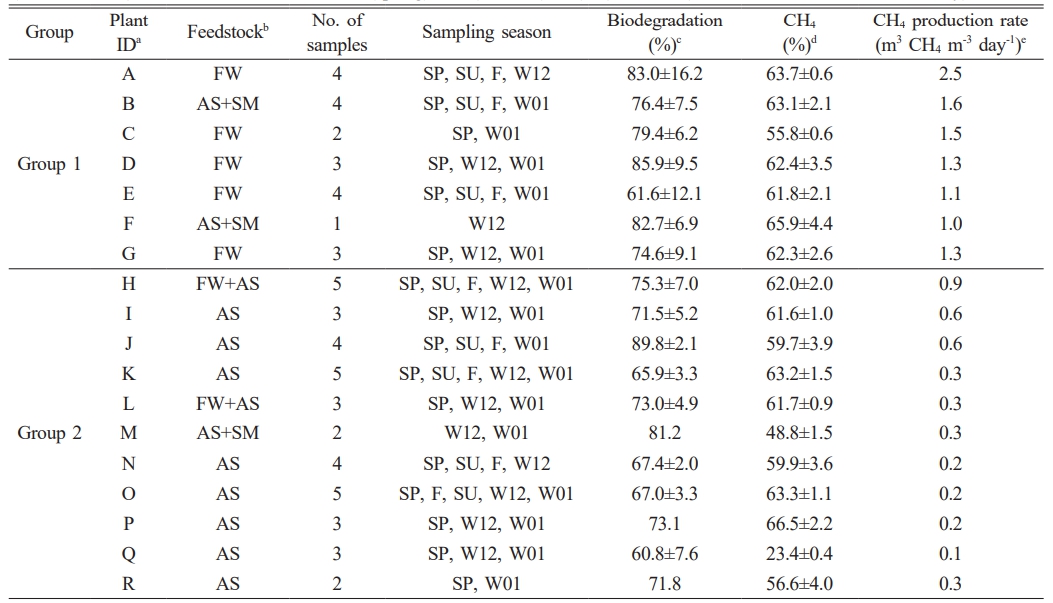
Table 1 The list of full-scale biogas plants analyzed for microbial community composition. Plants were divided into two groups according to biogas production amounts (Group 1 ≥ 1 m3 CH4 m-3 day-1). Plant IDa was arbitrarily labeled. Methane productione was normalized per unit volume of facility. The type of feedstockb was displayed as FW (food waste), AS (activated sludge), and SM (swine manure). Season was indicated as SP (spring), SU (summer), F (fall), and W (winter, 12; December, 01; January). |
Microbial Community Structure
Bacterial Communities
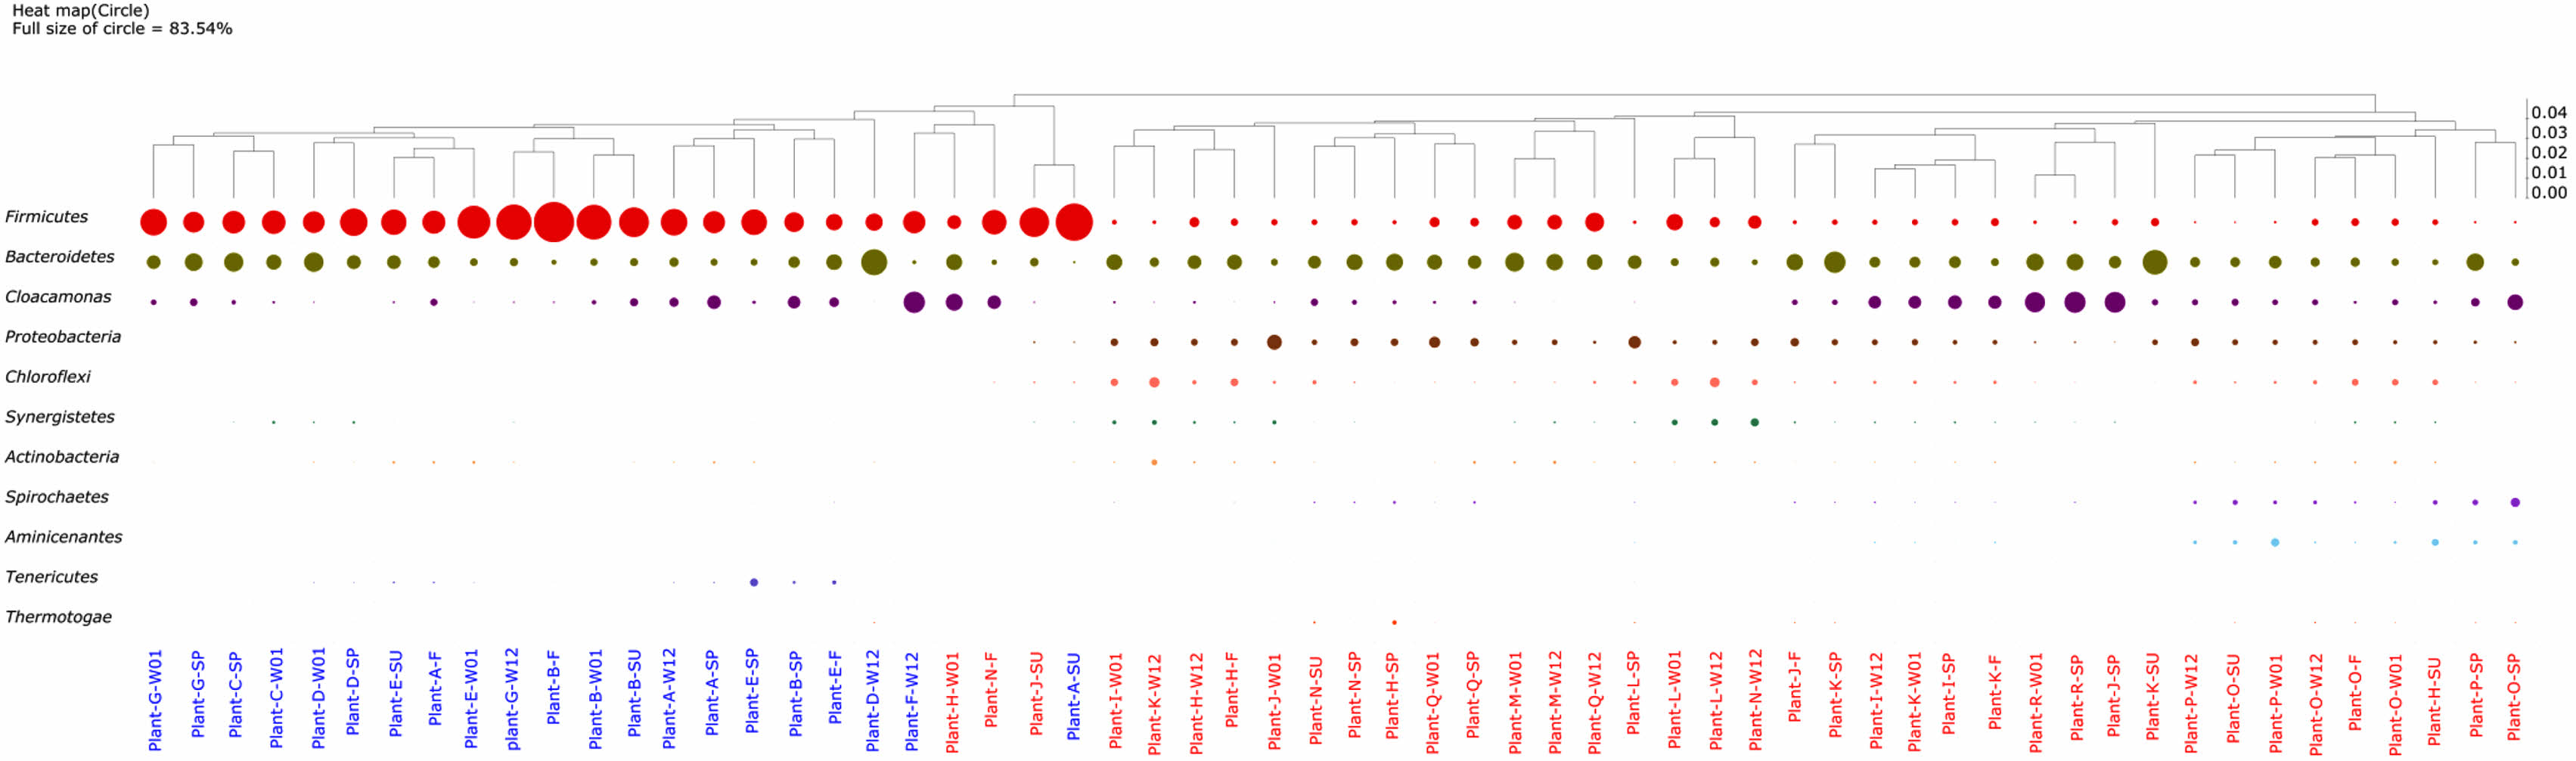
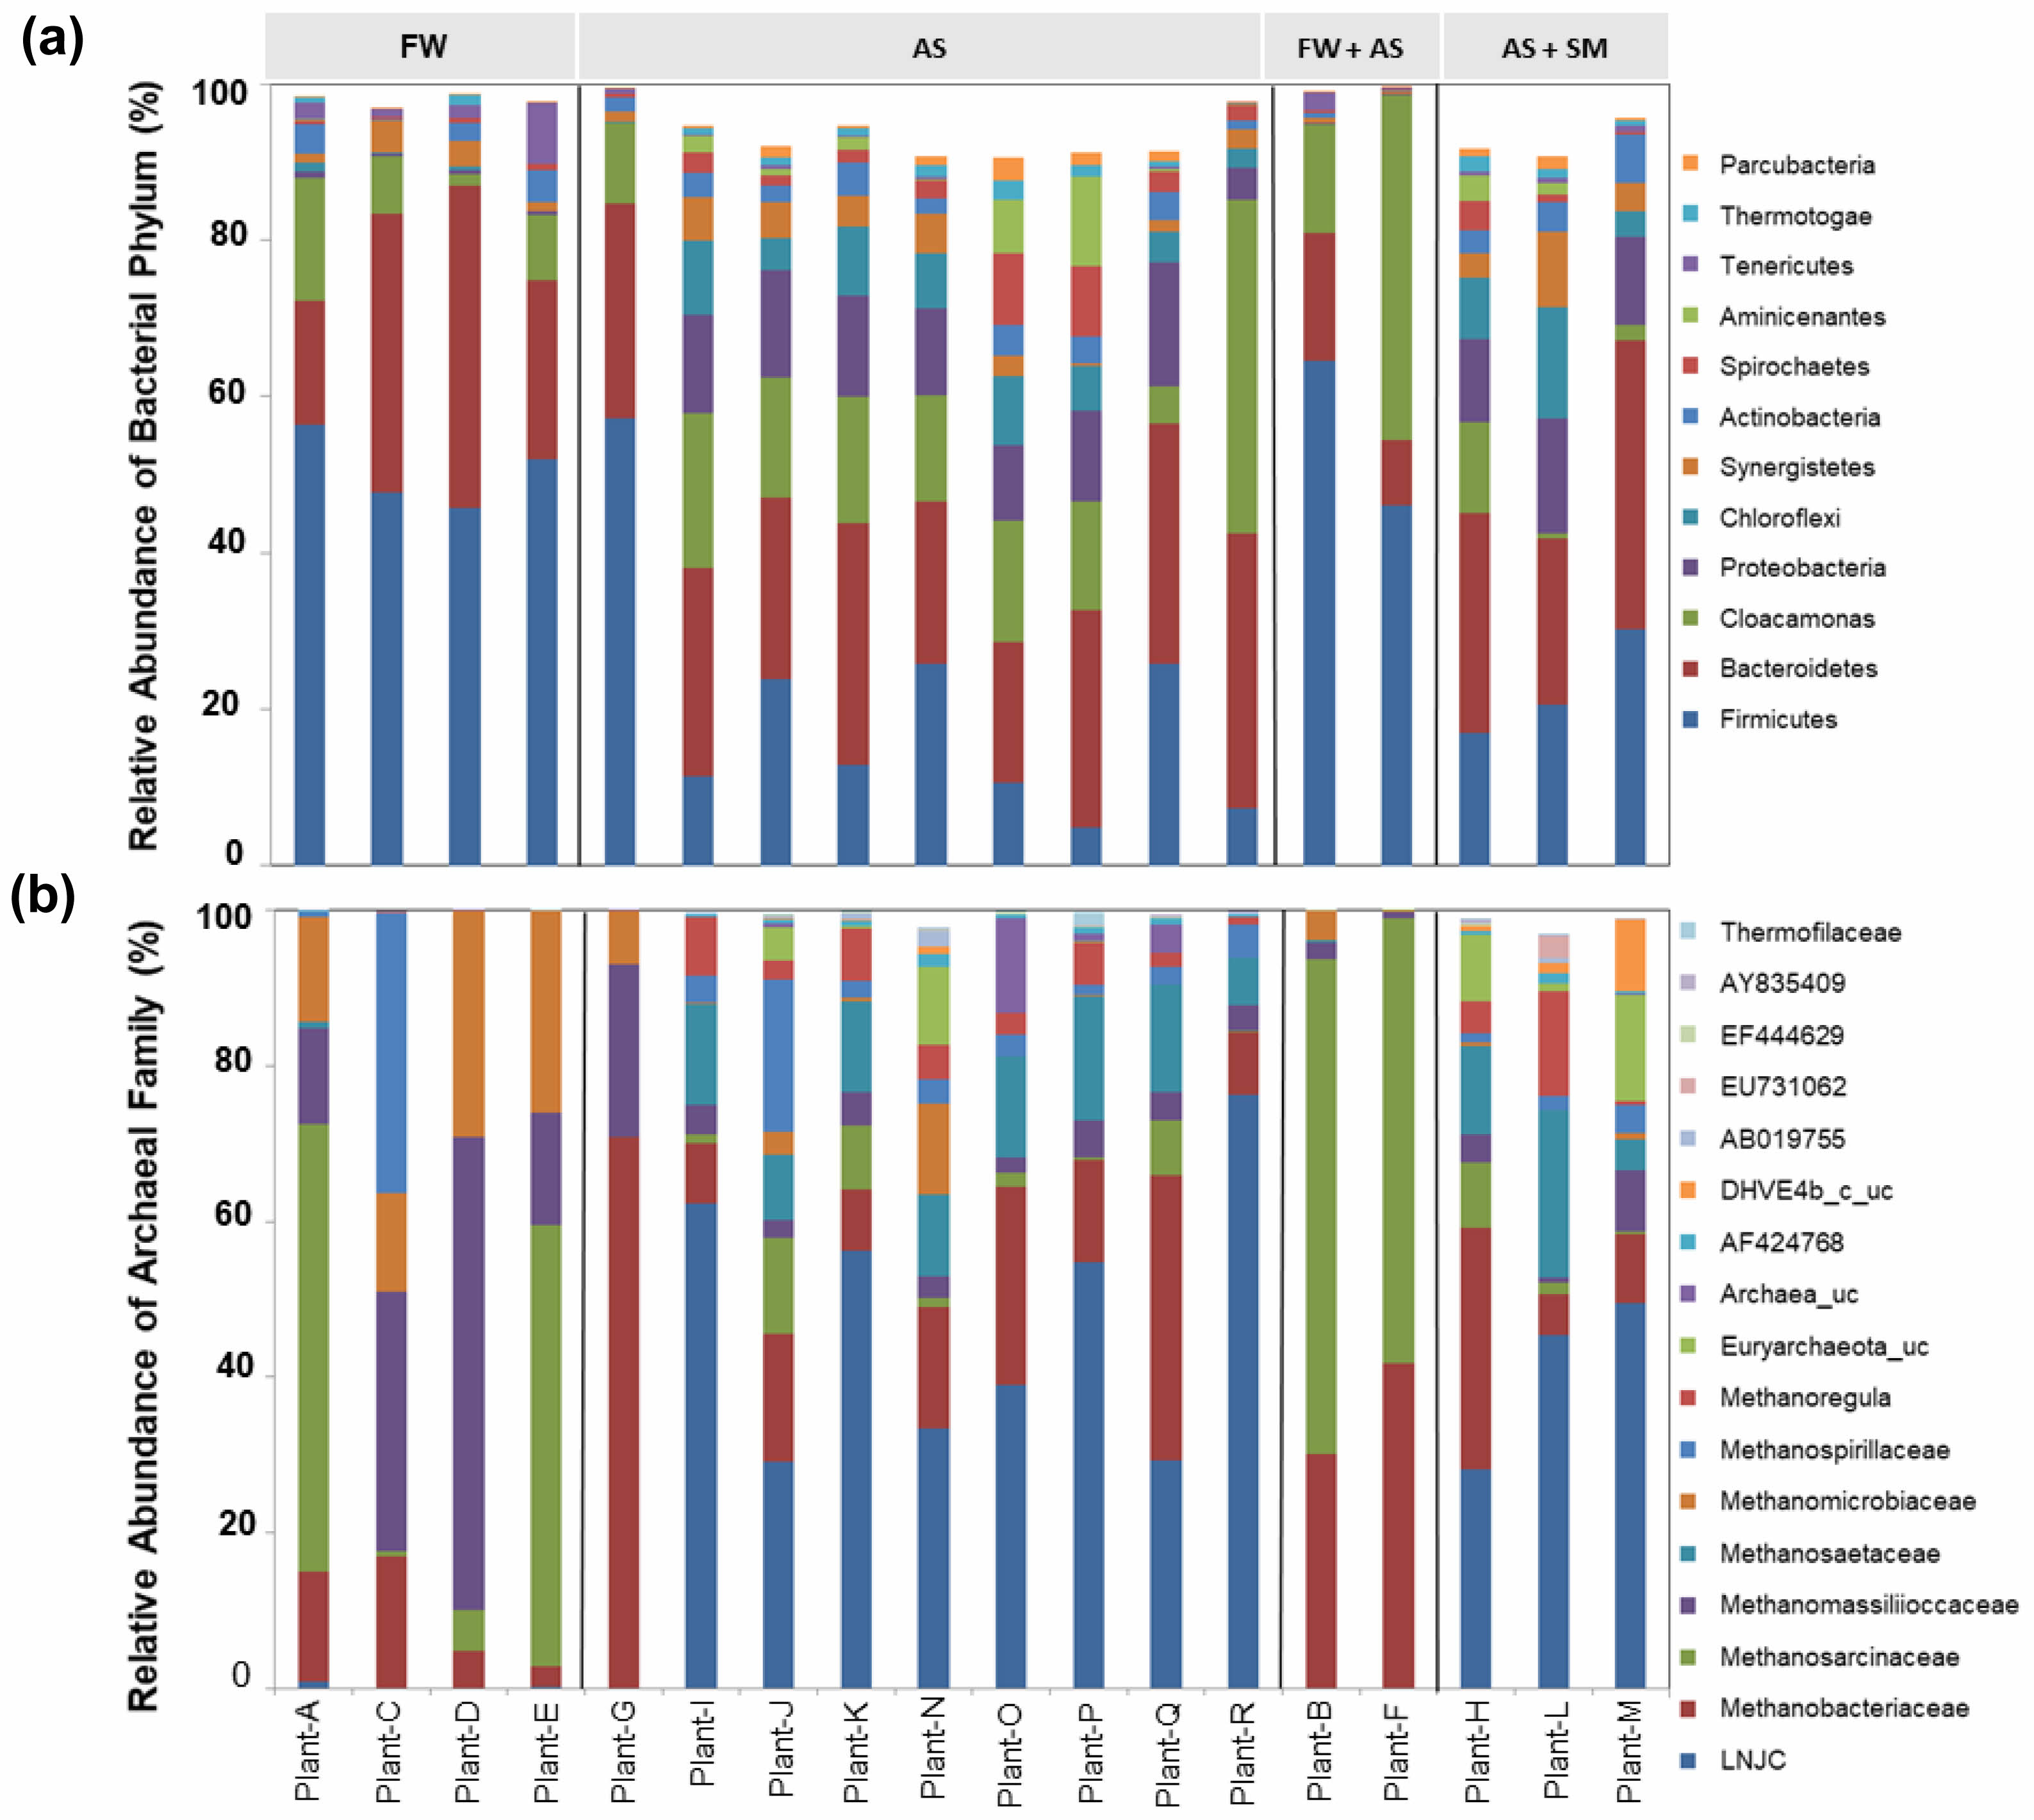
A comprehensive analysis of 60 samples collected from 18 full-scale biogas plants in South Korea revealed that the bacterial consortia predominantly comprised four phyla: Firmicutes, Bacteroidetes, Cloacimonetes (formerly Cloacamonas), and Proteobacteria (Fig. 1). Among these, Firmicutes was especially prevalent in AD plants (A, B, C, D, E, F, and G) exhibiting relatively high methane production rates (≥ 1 m³ CH₄ m⁻³ day⁻¹, hereafter referred to as Group 1). In the most pronounced case, Firmicutes constituted 83.5% of the bacterial community in Plant B-F, whereas it minimally appeared at 3.6% in Plant O-SU. Within the Firmicutes phylum, the genus Clostridium was the leading taxon, known for fermenting organic substrates into intermediates such as fatty acids, hydrogen, and CO₂ metabolites essential for subsequent methanogenesis [28].
Bacteroidetes ranked as the second most abundant bacterial phylum in Group 1 plants. Within Bacteroidetes, Porphyromonadaceae is notable for its role in carbohydrate hydrolysis [28], thereby facilitating the breakdown of complex polymers. Cloacimonetes were conspicuously abundant in Plants F (44.1%) and R (42.7%), consistent with previous findings that this phylum can utilize amino acids, sugars, and carboxylic acids [29]. By contrast, in lower methane-producing plants (Group 2), Bacteroidetes, Cloacimonetes, and Proteobacteria often
co-occurred in comparable proportions (Fig. 1), underscoring the link between microbial community composition and reactor performance.
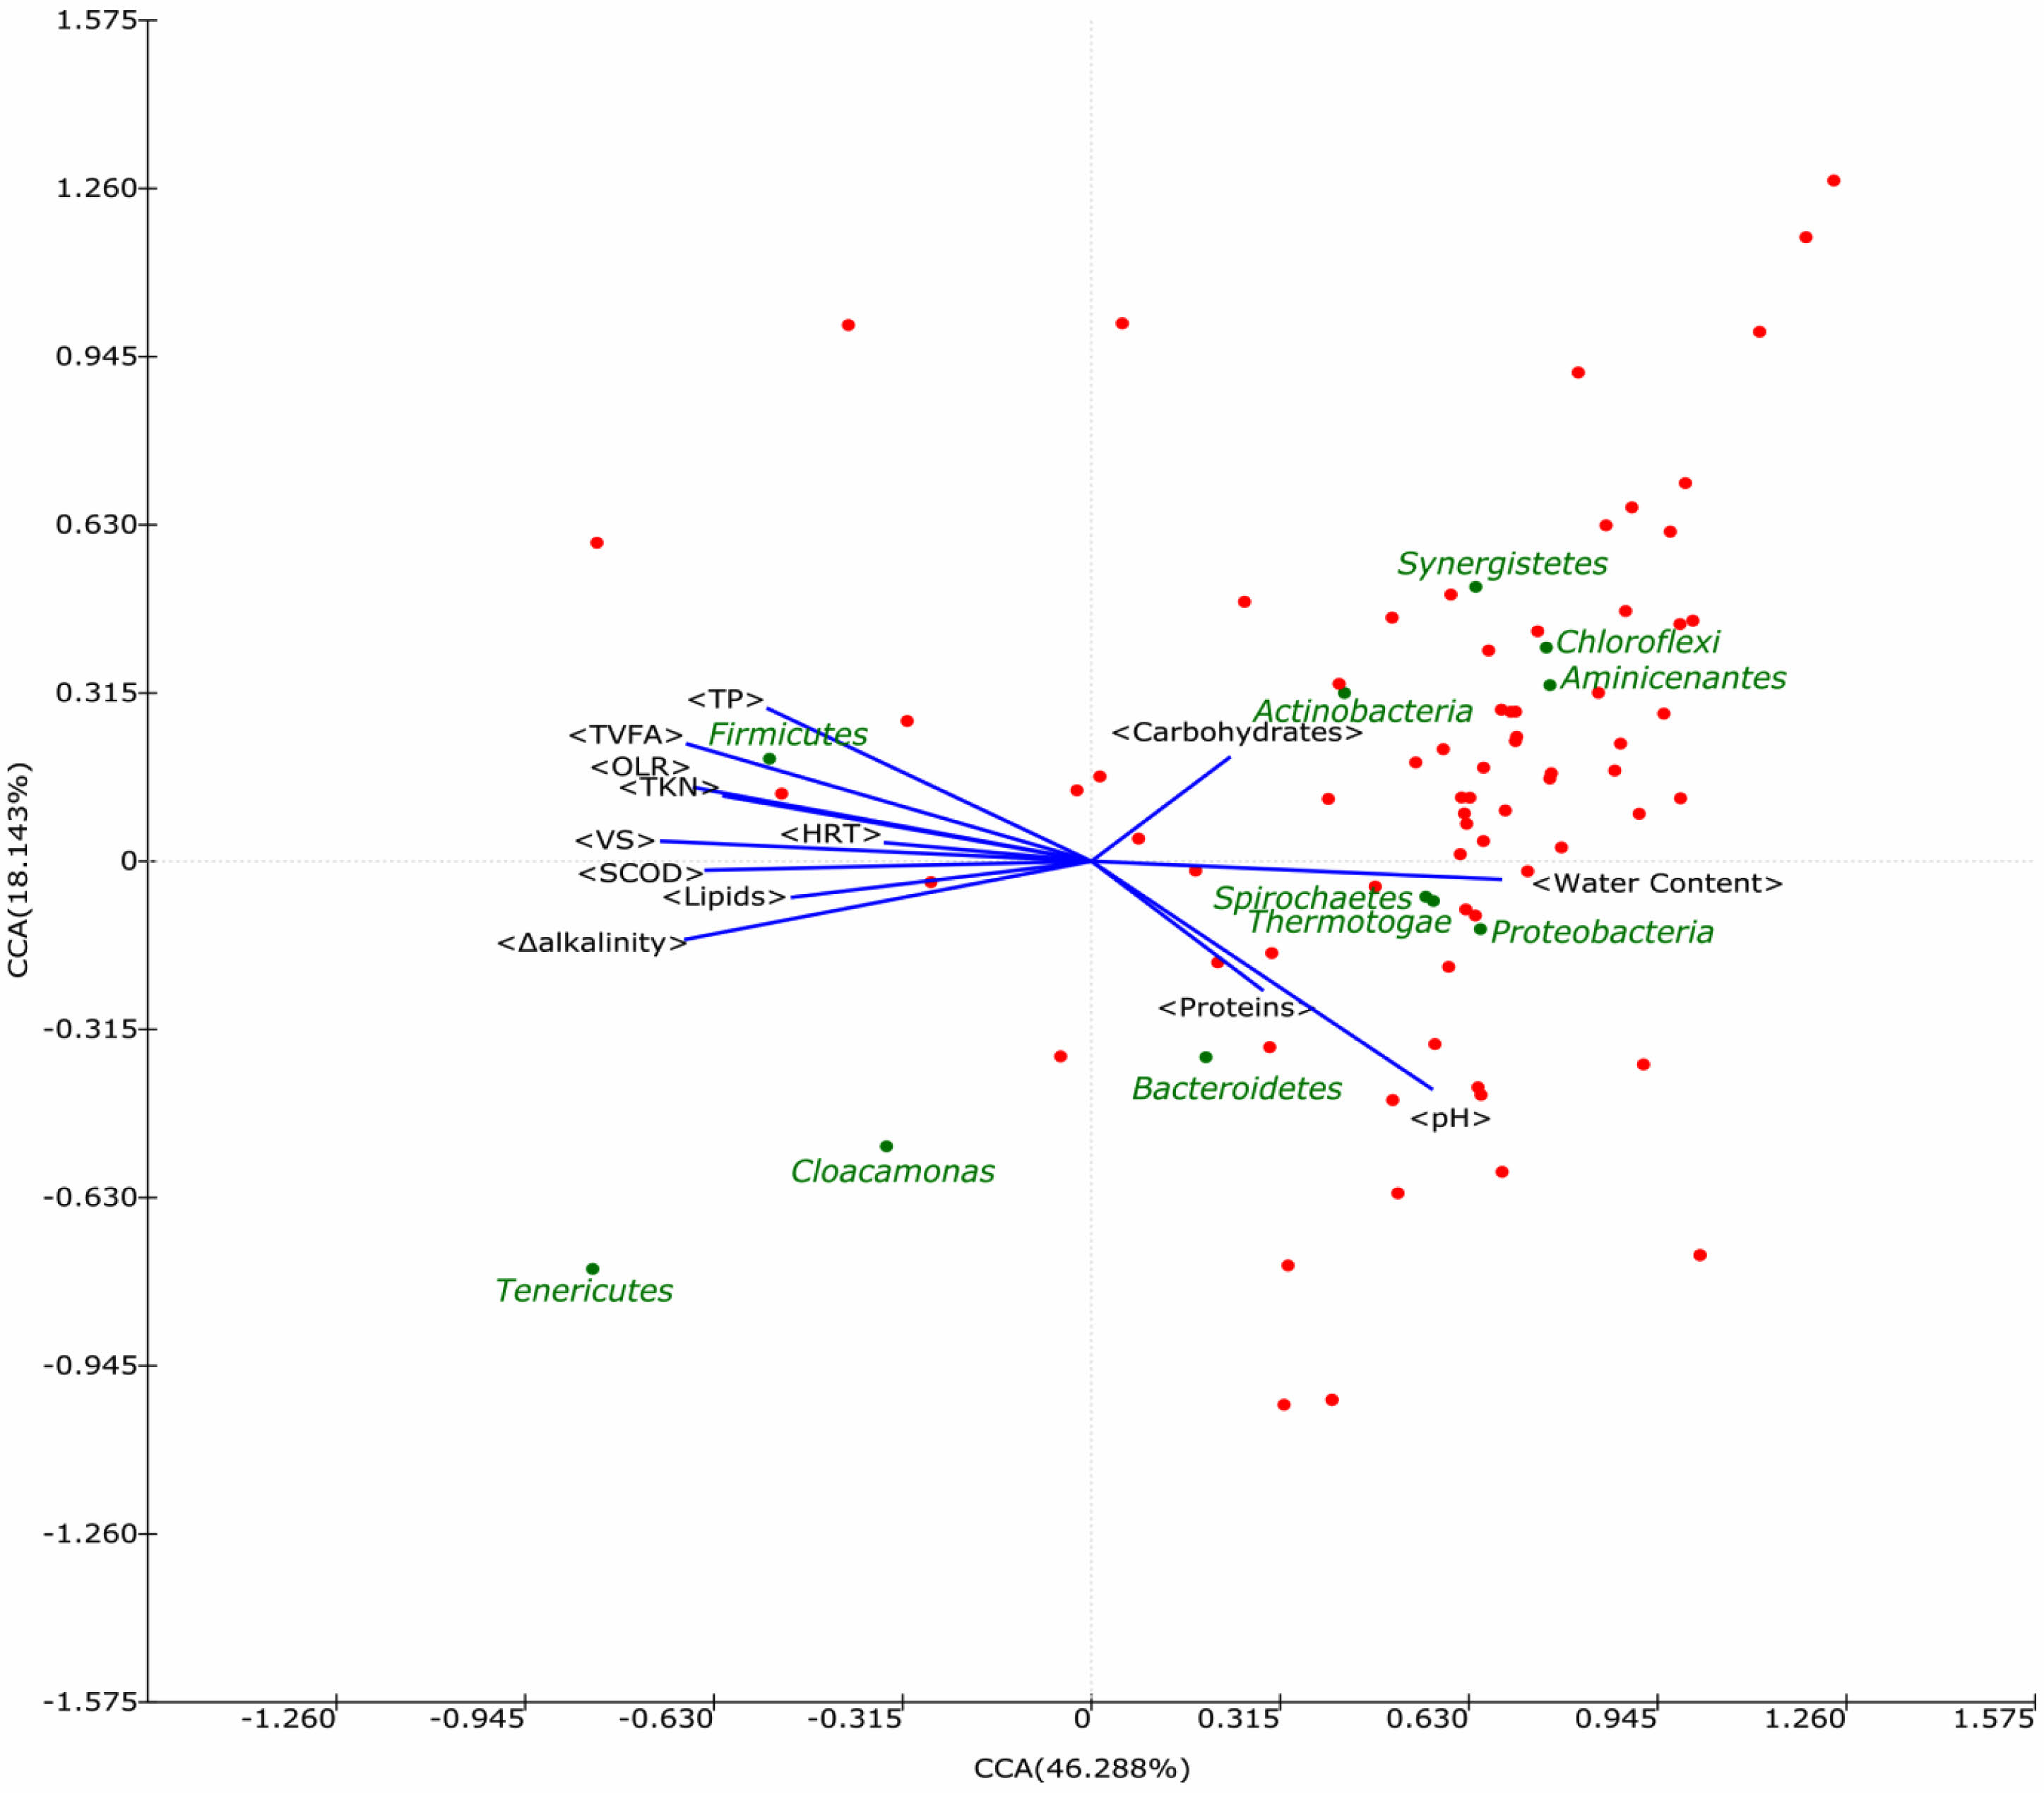
CCA indicated a significant correlation between elevated Firmicutes abundance and higher VFA concentrations (Fig. 2). As key intermediates in AD, VFAs can shape the microbial ecosystem, enriching Firmicutes due to their propensity for fermenting these substrates. However, aside from VFA levels, no other operational variables emerged as strong drivers of the observed bacterial dominance patterns, suggesting that the determinants of community assembly in large-scale AD systems are multifaceted.
Influence of Feedstock on Bacterial Communities
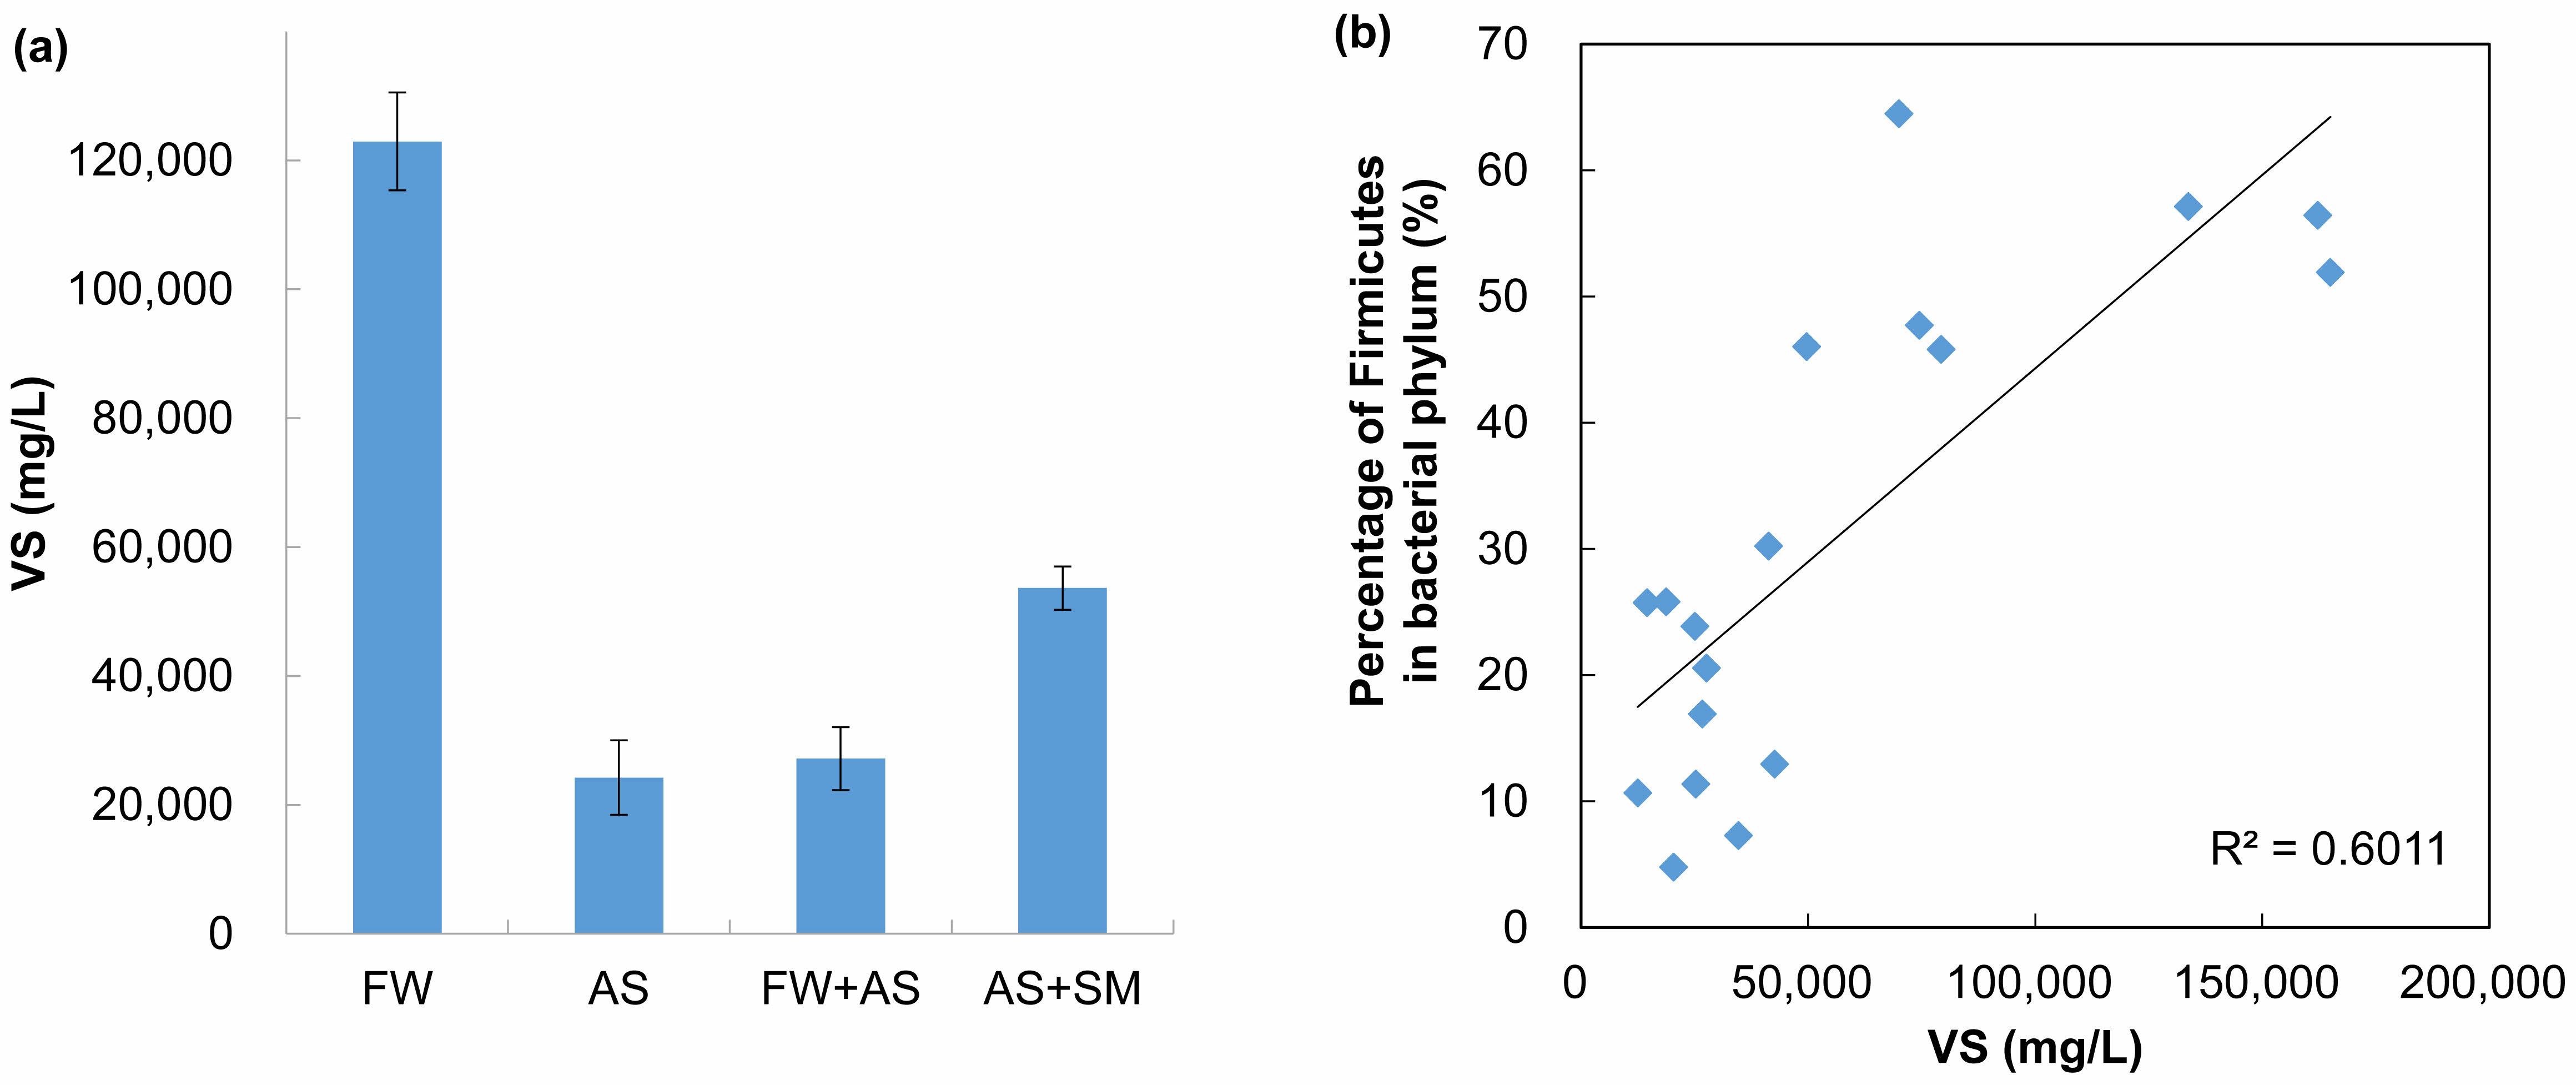
Feedstock type was a major factor steering bacterial community structure (Fig. 3a). Biogas plants receiving FW and swine manure (SM) displayed a marked prevalence of Firmicutes, echoing prior studies that linked easily degradable substrates to this phylum’s dominance [30, 31]. Across all samples, the BMP expressed as methane yield per gram of VS remained relatively uniform (±77.8 mL CH₄ g⁻¹ VS; Table 1). Thus, discrepancies in total methane output were likely tied to variations in the feedstock’s VS content rather than differences in microbial metabolic efficacy.
Indeed, FW exhibited the highest VS content (122 ± 7.6 g L⁻¹), nearly fivefold greater than that of activated sludge (AS; 24.2 ± 5.8 g L⁻¹) (Fig. 4a). Plants A, C, D, E, and G, which all utilized FW, correspondingly yielded higher overall biogas, supporting earlier observations that elevated VS levels bolster methane productivity [30,31]. Moreover, Firmicutes abundance demonstrated a positive correlation with VS concentrations (R² = 0.60; Fig. 4b), suggesting that substrates rich in fermentable organic matter favor Firmicutes proliferation and, by extension, enhance the early stages of hydrolysis and acidogenesis.
Proteobacteria, conversely, were broadly distributed (4.2–15.8%) among AS-fed plants (except Plant G) but were not dominant in FW-fed systems (Fig. 3a). In AS-fed reactors, Proteobacteria frequently include sulfate-reducing bacteria such as Desulfovibrio and denitrifiers like Dechloromonas [32, 33]. Their roles in sulfur and nitrogen cycling may be more significant in wastewater-derived feedstocks, making them potential biomarkers for AS-containing substrates. Meanwhile, seasonal variability was negligible across most plants, aside from Plant J, which exhibited distinct seasonal shifts in dominant phyla Cloacimonetes in spring, Firmicutes in summer, Bacteroidetes in fall, and Proteobacteria in winter (Fig. S1). Although these shifts could reflect temporal alterations in operational or environmental factors, CCA did not pinpoint a specific driver, implying that additional variables or complex microbial interactions may underlie these patterns.
Archaeal Communities
Distribution of Methanogenic Families
Mirroring the trends observed in bacterial communities,
archaeal family composition also varied by feedstock
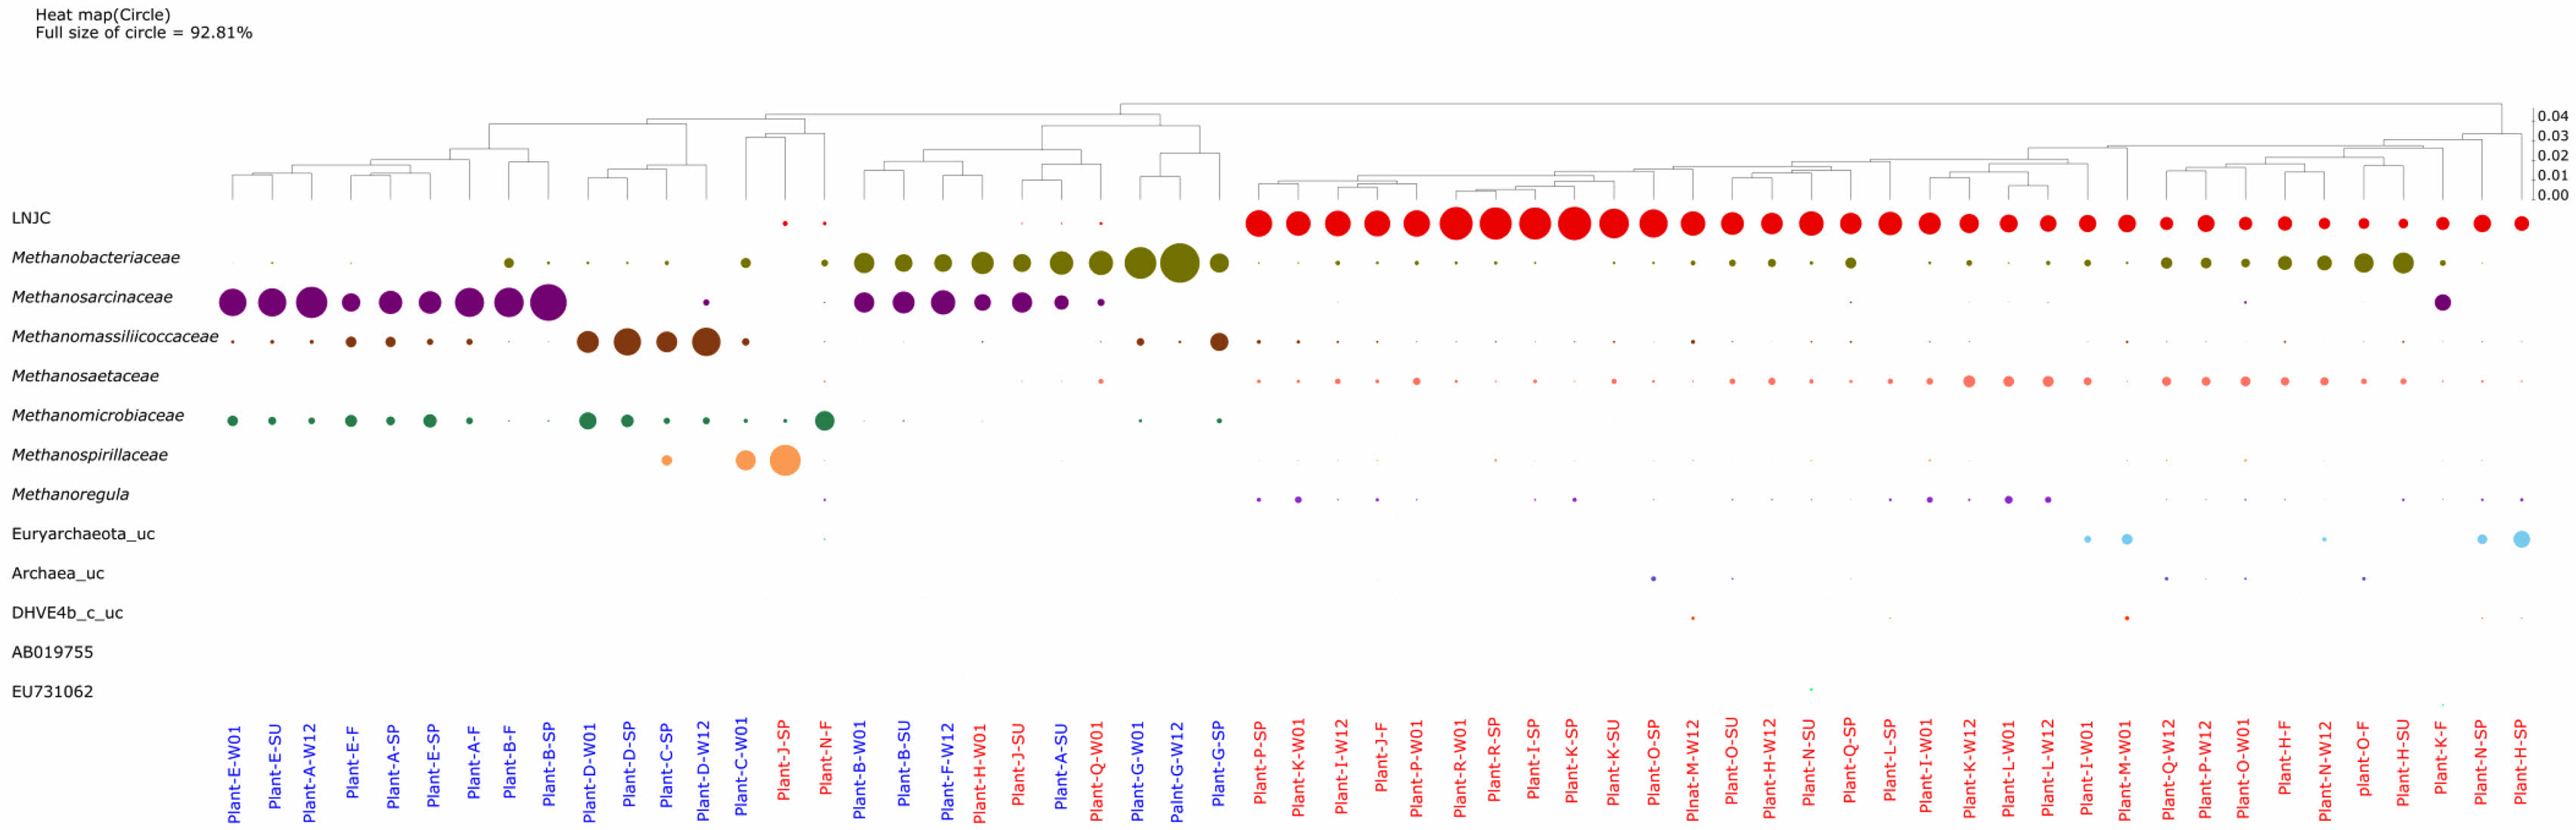
(Fig. 3b). Methanosarcinaceae and Methanomassiliicoccaceae were abundant in FW-fed plants, whereas an uncultured archaeon clone LNJC dominated AS-fed plants. This finding underscores that feedstock composition not only influences bacterial assemblages but also modulates the structure of methanogenic archaea essential for CH₄ generation. At the family level, five core groups emerged as key methanogens in the 60 samples: Methanobacteriaceae, Methanosarcinaceae, Methanomassiliicoccaceae, Methanosaetaceae, and LNJC
(Fig. 5). LNJC, an uncultured archaeon (accession number LNJC01000028), has been detected in methanogenic wastewater bioreactors [34] and AS digesters [35,36], implying a specialized niche in AS-fed environments. Different methanogenic families utilize distinct metabolic pathways: Methanobacteriaceae are hydrogenotrophic, converting H₂/CO₂ to CH₄ [37]; Methanomassiliicoccaceae are methylotrophic, relying on methanol or methyl compounds [38]; Methanosaetaceae are obligate acetoclasts, oxidizing acetate [39]; and Methanosarcinaceae are metabolically versatile, capable of both acetoclastic and hydrogenotrophic methanogenesis [39]. This diversity enables a more complete exploitation of intermediates produced during AD.
Correlating Archaea with Reactor Performance
Methanosarcinaceae was prevalent in Plants A, B, and E, particularly the genus Methanimicrococcus. Plants C and D, in contrast, were dominated by Methanomassiliicoccaceae (e.g., Methanogranum sp.),
while Methanobacterium petrolearium (Methanobacteriaceae) was abundant in Plant G. Interestingly, these sets of plants shared Firmicutes as their principal bacterial phylum yet displayed markedly different archaeal compositions. This suggests that methanogen prevalence is shaped not only by bacterial community structure but also by factors such as reactor design, substrate availability, or environmental conditions.
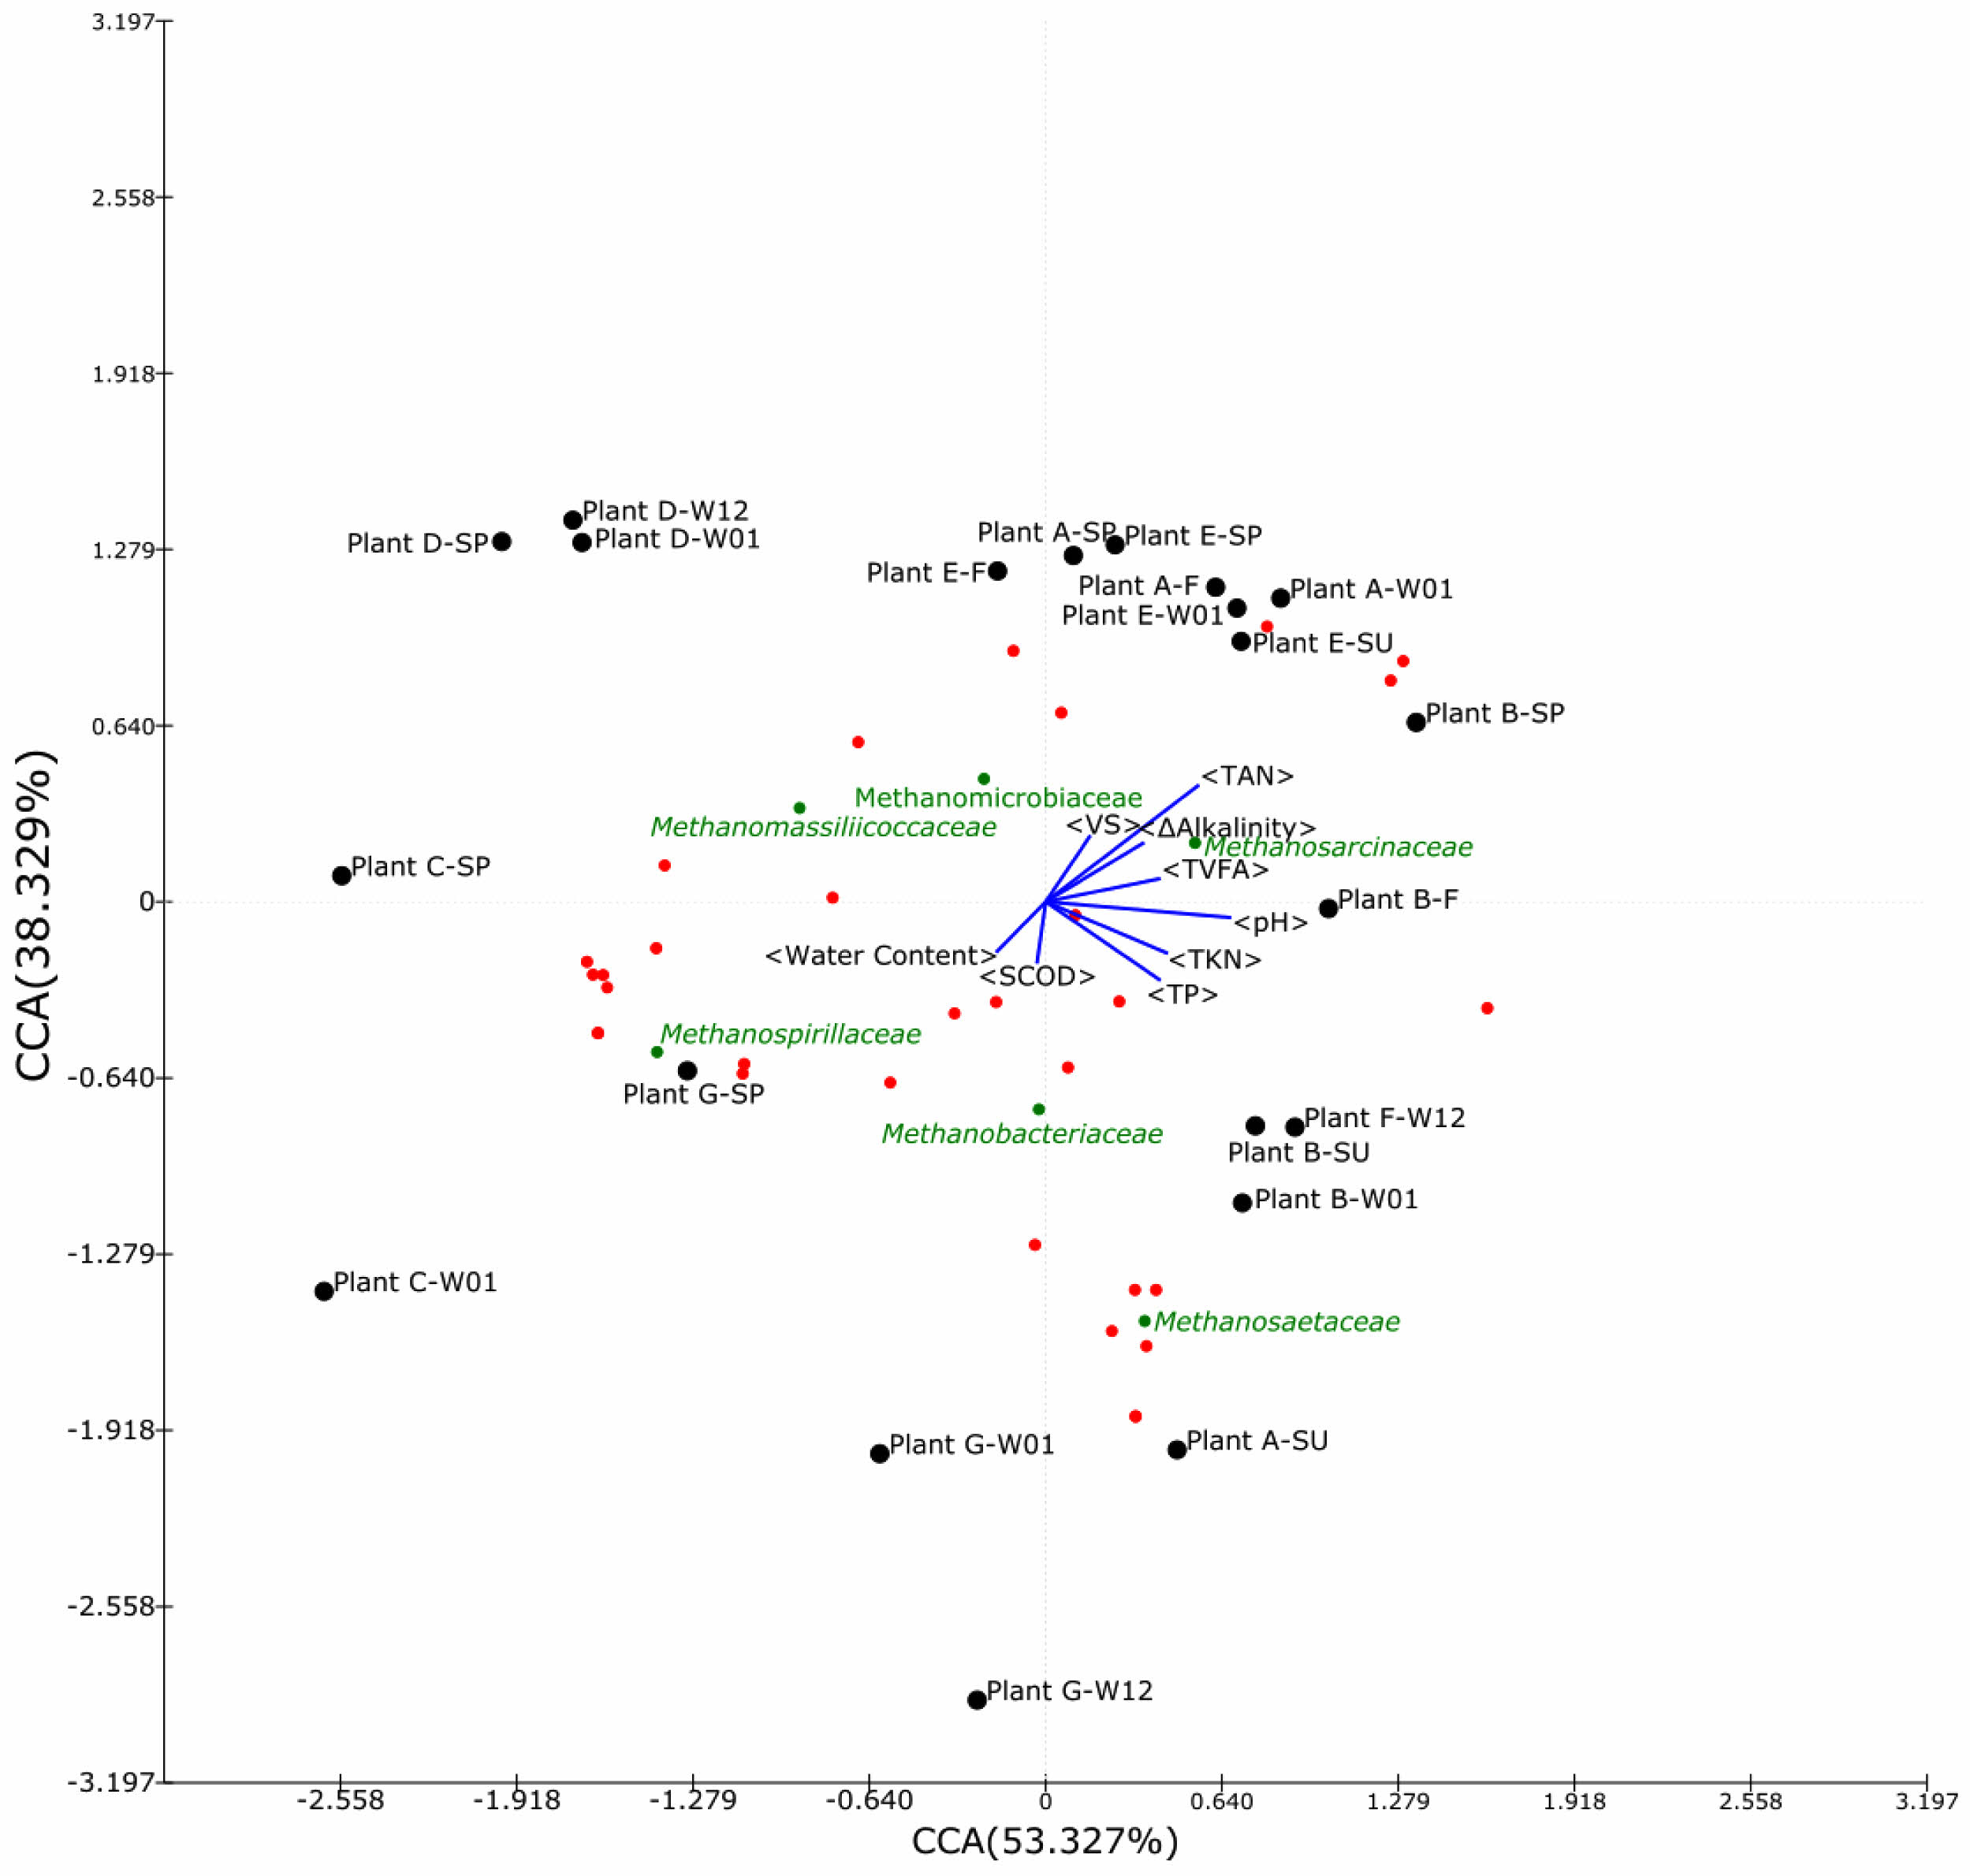
CCA focusing on Group 1 samples (metadata in Table S1; Fig. 6) highlighted water content as a driver in Plants C and D, whereas SCOD influenced Plant G. Methanosarcinaceae tended to predominate in systems exhibiting substantial alkalinity differentials between influent and effluent (Fig. 6), possibly due to their noted resilience to fluctuations in pH and VFA concentrations. The genus Methanimicrococcus, widely documented in pharmaceutical wastewater bioreactors [40] and in high-nitrate rumen ecosystems [41], exemplifies this adaptive versatility. One species, Methanimicrococcus blatticola, can metabolize methanol, methylamines, acetate, and H₂ [42], reinforcing the notion that metabolic flexibility contributes significantly to robust CH₄ production in diverse substrates.
Network Analysis of Bacteria–Methanogen Co-occurrence
Synergistic and Antagonistic Interactions
AD progresses through hydrolysis, acidogenesis, acetogenesis, and methanogenesis, where methanogens utilize acetate, methanol, or H₂/CO₂ produced by fermentative bacteria. Given the feedstock-dependent nature of these upstream steps, we examined co-occurrence patterns between bacterial phyla and methanogenic families to elucidate their functional interplay.
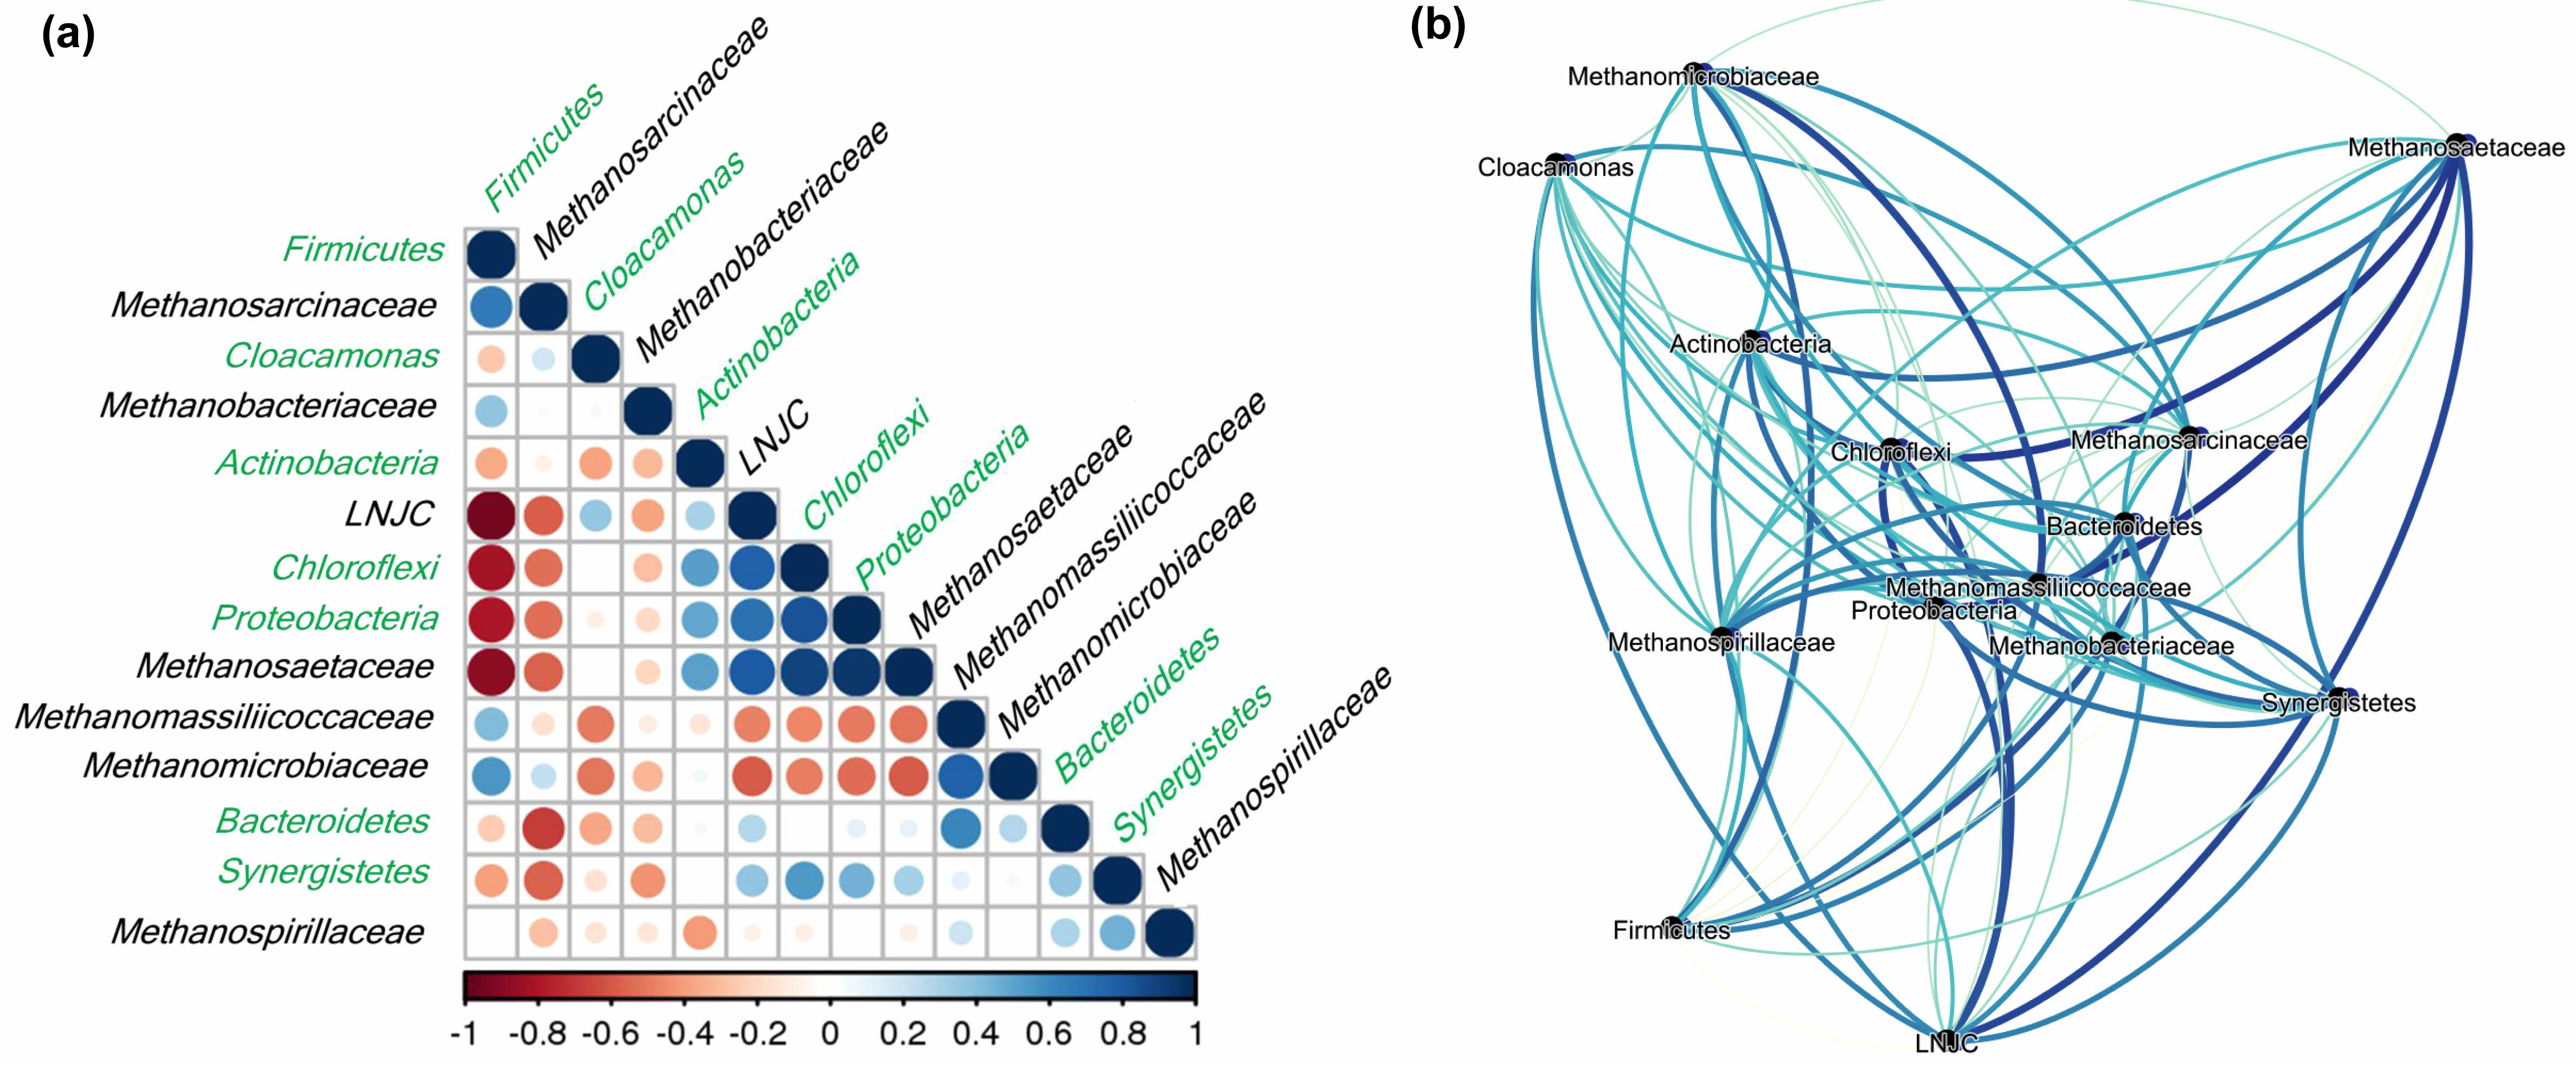
Multiple positive and negative associations emerged
(Fig. 7a). Firmicutes, strongly linked to higher VS
concentrations, exhibited significant positive correlations
with Methanosarcinaceae (r = 0.66), Methanomicrobiaceae (r = 0.55), Methanomassiliicoccaceae (r = 0.41), and Methanobacteriaceae (r = 0.37). Such relationships suggest synergistic partnerships whereby Firmicutes produce essential intermediates e.g., acetate, hydrogen, and VFAs that feed these methanogens. Consistent with this, Clostridium (Firmicutes) is known to generate substrates conducive to Methanosarcinaceae growth [43].
On the other hand, Firmicutes negatively correlated with LNJC (r = –0.94) and Methanosaetaceae (r = –0.88). This pattern might signify competition for limited substrates or distinct ecological niches. Because Methanosaetaceae thrive as obligate acetoclasts under low acetate conditions [44], Firmicutes-enriched environments characterized by higher VFA loads may not favor Methanosaetaceae proliferation.
Bacterial-Bacterial and Methanogen-Methanogen Interactions
LNJC (r = 0.77) and Methanosaetaceae (r = 0.89) both showed co-abundance with Chloroflexi, primarily of the Anaerolineae class known cellulose degraders [45]. This co-occurrence implies a putative syntrophic loop where Chloroflexi liberate acetate from polysaccharides, subsequently utilized by Methanosaetaceae and possibly LNJC. Notably, Methanosaetaceae also correlated strongly
with Proteobacteria (r = 0.94), suggesting additional syntrophic interactions. Though some studies associate Proteobacteria with higher total solids and reduced methane yields [46], the extent of their role may depend on environmental factors and specific community dynamics.
A noteworthy positive correlation emerged between Bacteroidetes and Methanomassiliicoccaceae (r = 0.61), implying a synergy wherein Bacteroidetes degrade complex carbohydrates into VFAs or methanol, fueling methylotrophic methanogens [38]. Network analyses also revealed significant bacteria–bacteria correlations, such as Chloroflexi with Proteobacteria (r = 0.83) and Proteobacteria with Synergistetes (r = 0.45), as well as a strong methanogen–methanogen correlation between LNJC and Methanosaetaceae (r = 0.80) (Fig. 7a). These patterns collectively suggest intricate microbial cooperation or shared environmental preferences.
Implications for Biogas Optimization
The co-occurrence network (Fig. 7b) underscores pivotal relationships that govern AD efficiency. Thick edges indicate high-correlation pairs e.g., Firmicutes–Methanosarcinaceae pointing to microbial consortia that likely optimize substrate turnover and methane generation. Conversely, correlations involving Methanosaetaceae and Proteobacteria or Chloroflexi suggest alternative metabolic pathways potentially prominent under lower VFA or specialized niche conditions. Recognizing these interactions has considerable practical relevance. For instance, fostering Firmicutes–Methanosarcinaceae partnerships might enhance methane yields in reactors processing high-VS feedstocks, whereas stimulatory strategies for Methanosaetaceae could be beneficial under low-acetate, stable pH conditions. Despite the clear potential, further validation in diverse AD environments is warranted. Metagenomic or metatranscriptomic studies could substantiate these network-based inferences, revealing the enzymatic pathways and functional genes involved.
Moreover, leveraging “hub microbes” for targeted bioaugmentation or early-warning diagnostics holds promise for maintaining process stability. Co-occurrence patterns can detect shifts in community composition that precede operational failures, offering plant operators a preventive management tool. As a result, these insights pave the way for the development of more sophisticated, computationally driven models that integrate dynamic microbial data into real-time process control strategies.
Overall, this work demonstrates that feedstock-specific microbial communities, particularly their interlinked bacterial and methanogenic members, decisively impact biogas plant performance. By elucidating core syntrophic relationships and unveiling potential biomarkers for methanogenic efficiency, we establish a foundation for practical interventions aimed at enhancing anaerobic digestion across a range of industrial conditions.
|
Fig. 1 The circle heat map presents the relative portion (phylum level) of bacteria. The size of the circle indicates the contribution (>5% relative abundance in at least one sample) of phyla to the total bacterial community. The sample was labeled as plant ID-Season. Season is indicated as SP (spring), SU (summer), F (fall), and W (winter, 12; December, 01; January). |
|
Fig. 2 Scatter plot of canonical correlation analysis (CCA) between environmental variables and the relative abundance of bacteria (phylum level) in biogas plants. Each spot indicates a bacterial phylum, and major bacteria (>5% in phylum level) are shown as green spots with phylum names. Correlation with performance parameters is indicated by the arrow. |
|
Fig. 3 The relative abundance of bacterial phyla (a) and archaeal families (b) in categorized AD plants with the type of feedstock. FW; FW, AS; activates sludge, SM; swine manure. Tentative names were given by adding a suffix to the GenBank accession numbers. |
|
Fig. 4 Volatile solid (VS) content affects the distribution of Firmicutes in biogas plants. (a) The VS content in each type of feedstock used in biogas plants. Error bars represent one standard deviation of the mean value, (b) the positive relationship of relative abundance of Firmicutes with VS content. |
|
Fig. 5 The circle heat map presents the relative portion (family level) in archaea. The size of the circle indicates the contribution (>5% relative abundance in at least one sample) of the archaeal family to the total archaeal community. The sample was labeled as plant ID-Season. Season is indicated as SP (spring), SU (summer), F (fall), and W (winter, 12; December, 01; January). |
|
Fig. 6 Scatter plot of canonical correlation analysis (CCA) between environmental variables and the relative abundance of archaea (family level) in biogas plants. Each dot indicates an archaeal family, and interesting methanogens are shown as green spots with the name of the family |
|
Fig. 7 Co-occurrence patterns of microbial organisms in biogas plants. (a) Positive or negative correlations between bacterial (green) and archaeal (black) abundance and the contribution to each bacteria and methanogen community. (b) The positive correlation between microbial organisms in biogas plants. The thickness of connecting lines (edge) is proportional to the correlation coefficient, calculated by the Spearman correlation method. |
This study comprehensively examined the microbial consortia in 18 full-scale AD plants across South Korea, illuminating how feedstock composition and operational factors shape biogas production. Our findings demonstrate a strong correlation between methane yield and the VS content of the feedstock, with Firmicutes emerging as potential VS-related biomarkers in high-yield digesters. By contrast, Chloroflexi, Proteobacteria, and Synergistetes were more prevalent in AS fed reactors that exhibited comparatively lower methane outputs. Network analyses highlighted the importance of co-occurrence patterns: Firmicutes correlated strongly with methanogens such as Methanosarcinaceae, Methanomassiliicoccaceae, and Methanomicrobiaceae in high-yield plants, whereas Methanosaetaceae co-occurred with Proteobacteria, Chloroflexi, Actinobacteria, Synergistetes, and Bacteroidetes in lower-yield facilities. These results underscore the critical role of feedstock-dependent microbial communities in governing AD performance and offer practical insights for optimizing biogas processes. By leveraging identified biomarkers and “hub microbes,” operators can proactively monitor reactor health and implement targeted strategies, such as adjusting feedstock composition or applying bioaugmentation to enhance process stability and methane generation. Additionally, the microbiome data can inform computational models for predicting metabolic responses and guiding operational interventions. This work advances our understanding of AD ecosystem dynamics and provides a foundation for more efficient, resilient, and data-driven biogas production across diverse industrial contexts.
JCPR_2025_026_03_440_Supplementary_Information.pdf (147 kb)
Supplementary Information
This work supported by the Korea Environment Industry & Technology Institute (KEITI) through the Development of Demonstration Technology for Converting Unconventional Waste Biomass to Energy, funded by the Korea Ministry of Environment (MOE) (2022003480001).
- 1. International Energy Agency, Key World Energy Statistics, Int. Energy Agency, Paris (2016).
-

- 2. Y.S. Kim, Y.M. Yoon, C.H. Kim, and J. Giersdorf, Renew. Sustain. Energy Rev. 16 (2012) 3430-3438.
-
- 3. J.J. Werner, D. Knights, M.L. Garcia, N.B. Scalfone, S. Smith, K. Yarasheski, T.A. Cummings, A.R. Beers, R. Knight, and L.T. Angenent, Proc. Natl. Acad. Sci. U.S.A. 108[10] (2011) 4158-4163.
-
- 4. J.D. Vrieze and W. Verstraete, Environ. Microbiol. 18[9] (2016) 2797-2809.
-
- 5. D. De Francisci, P.G. Kougias, L. Treu, S. Campanaro, and I. Angelidaki, Bioresour. Technol. 176 (2015) 56-64.
-
- 6. P. Wang, Z. Yu, J. Zhao, and H. Zhang, Bioresour. Technol. 249 (2018) 89-98.
-
- 7. A. Fontana, V. Patrone, E. Puglisi, L. Morelli, D. Bassi, M. Garuti, L. Rossi, F. Cappa, Bioresour. Technol. 218 (2016) 980-990.
-
- 8. Korea Energy Economics Institute, Production of energy from biogas in South Korea from 2013 to 2022 (in 1,000 metric tons of oil equivalent), Available from https://www.statista.com/statistics/1377643/south-korea-production-of-energy-from-biogas/, Accessed Jan. 18, 2025.
- 9. IEA Bioenergy, Country Report 2021: Korea, Available from https://www.ieabioenergy.com/wp-content/uploads/2021/11/CountryReport2021_Korea_final.pdf, Accessed Jan. 18, 2025.
- 10. Enviliance, South Korea's Strategy to Promote Biogas Production and Use, Available from https://enviliance.com/regions/east-asia/kr/report_12357. Accessed Jan. 18, 2025.
- 11. European Biogas Association, EBA Statistical Report 2022 (Short version), Available from https://www.europeanbiogas.eu/wp-content/uploads/2022/12/EBA-Statistical-Report-2022_-Short-version.pdf, Accessed Jan. 18, 2025.
- 12. T. Koo, S.G. Shin, J. Lee, G. Han, W. Kim, K. Cho, and S. Hwang, Bioresour. Technol. 228 (2017) 368-373.
-
- 13. S. Kang, A.K. Mathew, A. Abraham, O. Choi, and B.I. Sang, J. Ceram. Process. Res. 23[6] (2022) 853-861.
-
- 14. J. Lee, J. Chun, O. Choi, and B.I. Sang, J. Ceram. Process. Res. 21[5] (2020) 602-608.
-
- 15. A. Barberán, S.T. Bates, E.O. Casamayor, and N. Fierer, ISME J. 6[2] (2012) 343-351.
-
- 16. P. Oleskowicz-Popiel, Trends Biotechnol. 36[8] (2018) 747-750.
-
- 17. S. Peura, S. Bertilsson, R.I. Jones, and A. Eiler, Appl. Environ. Microbiol. 81[6] (2015) 2090-2097.
-
- 18. A.E. Rotaru, P.M. Shrestha, F. Liu, M. Shrestha, D. Shrestha, M. Embree, K. Zengler, C. Wardman, K.P. Nevin, and D.R. Lovley, Energy Environ. Sci. 7 (2014) 408-415.
-
- 19. J. Zhang, L. Mao, L. Zhang, K.C. Loh, Y. Dai, and Y.W. Tong, Sci. Rep. 7 (2017) 11293.
-
- 20. K. Faust and J. Raes, Nat. Rev. Microbiol. 10 (2012) 538.
-
- 21. W.E. Federation and APHA, Standard Methods for the Examination of Water and Wastewater (21st ed), Am. Public Health Assoc. (2005).
-
- 22. W. Boyle, in Microbial Energy Conversion (Elsevier, 1977) 119-138.
-
- 23. J. Chun, J.H. Lee, Y. Jung, M. Kim, S. Kim, B.K. Kim, and Y.W. Lim, Int. J. Syst. Evol. Microbiol. 57 (2007) 2259-2261.
-
- 24. O.S. Kim, Y.J. Cho, K. Lee, S.H. Yoon, M. Kim, H. Na, S.C. Park, Y.S. Jeon, J.H. Lee, H. Yi, S. Won, and J. Chun, Int. J. Syst. Evol. Microbiol. 62 (2012) 716-721.
-
- 25. M. Hamady, C. Lozupone, and R. Knight, ISME J. 4[1] (2010) 17-27.
-
- 26. C.A. Lozupone, M. Hamady, S.T. Kelley, and R. Knight, Appl. Environ. Microbiol. 73[5] (2007) 1576-1585.
-
- 27. M. Bastian, S. Heymann, and M. Jacomy, in Proceedings of the International Conference on Web and social media (ICWSM) 3[1] (2009) 361-362.
-
- 28. S. Campanaro, L. Treu, P.G. Kougias, D. De Francisci, G. Valle, and I. Angelidaki, Biotechnol. Biofuels 9 (2016) 26.
-
- 29. E. Pelletier, A. Kreimeyer, S. Bocs, Z. Rouy, G. Gyapay, R. Chouari, D. Riviere, A. Ganesan, P. Daegelen, A. Sghir, G.N. Cohen, C. Medigue, J. Weissenbach, and D.L. Paslier, J. Bacteriol. 190[7] (2008) 2572-2579.
-
- 30. D. Wilkins, S. Rao, X. Lu, and P.K.H. Lee, Front. Microbiol. 6 (2015) 1114.
-
- 31. M. Zamanzadeh, L.H. Hagen, K. Svensson, R. Linjordet, and S.J. Horn, Sci. Rep. 7 (2017) 17664.
-
- 32. Y. Kong, S.L. Ong, W.J. Ng, and W.T. Liu, Environ. Microbiol. 4[11] (2002) 753-757.
-
- 33. M. Wagner, R. Amann, H. Lemmer, and K.H. Schleifer, Appl. Environ. Microbiol. 59[5] (1993) 1520-1525.
-
- 34. M.K. Nobu, T. Narihiro, K. Kuroda, R. Mei, and W.T. Liu, ISME J. 10[10] (2016) 2478-2487.
-
- 35. D. Riviere, V. Desvignes, E. Pelletier, S. Chaussonnerie, S. Guermazi, J. Weissenbach, T. Li, P. Camacho, and A. Sghir, ISME J. 3 (2009) 700-714.
-
- 36. R. Chouari, D. Le Paslier, P. Daegelen, P. Ginestet, J. Weissenbach, and A. Sghir, Environ. Microbiol. 7[8] (2005) 1104-1115.
-
- 37. M.A. Horn, C. Matthies, K. Küsel, A. Schramm, and H.L. Drake, Appl. Environ. Microbiol. 69[1] (2003) 74-83.
-
- 38. X.D. Huang, G. Martinez-Fernandez, J. Padmanabha, R. Long, S.E. Denman, and C.S. McSweeney, Archaea 2016[1] (2016) 1-10.
-
- 39. I.A. Fotidis, D. Karakashev, and I. Angelidaki, Int. J. Environ. Sci. Technol. 11 (2014) 2087-2094.
-
- 40. K.K. Ng, X. Shi, S.L. Ong, and H.Y. Ng, Bioresour. Technol. 200 (2016) 1076-1079.
-
- 41. L. Zhao, Q. Meng, Y. Li, H. Wu, Y. Huo, X. Zhang, and Z. Zhou, BMC Microbiol. 18 (2018) 21.
-
- 42. W.W. Sprenger, M.C. van Belzen, J. Rosenberg, J.H. Hackstein, and J.T. Keltjens, Int. J. Syst. Evol. Microbiol. 50[6] (2000) 1989-1999.
-
- 43. J.G. Ferry, Front. Microbiol. 11 (2020) 1806.
-
- 44. D. Karakashev, D.J. Batstone, and I. Angelidaki, Appl. Environ. Microbiol. 71[1] (2005) 331-338.
-
- 45. Y. Xia, Y. Wang, F. Chin, and T. Zhang, Biotechnol. Biofuels 9 (2016) 111.
-
- 46. L. Hao, A. Bize, D. Conteau, O. Chapleur, S. Courtois, P. Kroff, E.D. Le Quemener, T. Bouchez, and L. Mazeas, Water Res. 102 (2016) 158-169.
-
 This Article
-
2025; 26(3): 440-449
Published on Jun 30, 2025
- 10.36410/jcpr.2025.26.3.440
- Received on Feb 24, 2025
- Revised on Mar 12, 2025
- Accepted on Mar 14, 2025
Services
- Abstract
introduction
materials and methods
results and discussion
conclusion
- Supplementary Information
- Acknowledgements
- References
- Full Text PDF
Shared
Correspondence to
- Hyunook Kim e, Byoung-In Sang b,g
-
bDepartment of Chemical Engineering, Hanyang University, 222 Wangsimni-ro, Seongdong- gu, Seoul 04763, Republic of Korea
eKorea Electric Power Research Institute, 105 Munji-ro, Yooseong-gu, Daejeon 34056, Republic of Korea
gClean-Energy Research Institute, Hanyang University, 222 Wangsimni-ro, Seongdong- gu, Seoul 04763, Republic of Korea
Hyunook Kim Tel : +82-2-6490-5456
Byoung-In Sang Tel : +82-2-2220-4717 - E-mail: h_kim@uos.ac.kr, biosang@hanyang.ac.kr
Clean-Energy Research Institute(CRI), Hanyang University, 222, Wangsimni-ro, Seongdong-gu, Seoul, 04763, Korea
E-mail: jcpr@hanyang.ac.kr