


- Effect of kaolin pretreatment on the structure and properties of metakaolin phosphate-based geopolymers
Xin Yu, Chengxin Ren, Wenlong Xu, Lina Xu and Qingbo Tian*
School of Materials Science and Engineering, Shandong Jianzhu University, Jinan 250000, China
This article is an open access article distributed under the terms of the Creative Commons Attribution Non-Commercial License (http://creativecommons.org/licenses/by-nc/4.0) which permits unrestricted non-commercial use, distribution, and reproduction in any medium, provided the original work is properly cited.
This study focused on the preparation of metakaolin-based phosphate-activated geopolymers (MKPGs) using kaolin pretreated at 950 °C for varying times as a precursor. It was found that kaolinite quickly transformed into amorphous metakaolin (MK) and then transitioned from a disordered phase to an ordered phase, resulting in precipitation of kyanite and mullite with increasing calcination time. The formation of the kyanite phase had an adverse effect on geopolymerization, which caused a decrease in the strength of the MKPGs. The precipitation of the mullite phase hindered the geopolymerization reaction between phosphoric acid and MK, and the geopolymer failed to solidify. As the calcination time increased from 10 min to 60 min, the compressive strength of the geopolymers increased and then decreased. The maximum strength of the geopolymers created from MK calcined for 30 min was 132.1 MPa.
Keywords: Geopolymers, Phosphoric acid, Metakaolin, Pretreatment temperature, Compressive strength.
Geopolymers are inorganic materials commonly produced by the activators of aluminosilicate at low temperatures [1]. Fine favorable mechanical properties, high-temperature resistance, chemical resistance, and low shrinkage are excellent properties exhibited by geopolymers [2]. The aluminosilicate raw materials for geopolymers mainly come from natural minerals, calcined clay, or industrial by-products [3]. Geopolymers were first generated by the dissociation of Si and Al in precursor materials by alkaline activators, followed by the condensation and curing of aluminosilicate gelling components to create new chemically bound gel materials [1, 4, 5]. Metakaolin (MK) is the most commonly used aluminosilicate for the preparation of geopolymers due to its disordered structure [6, 7, 8]. Previous work has shown that kaolinite is usually used after calcination at temperatures between 550-950 °C to obtain a more reactive phase (MK), with the loss of structural water and associated reorganization of the structure [1, 9]. The calcination temperature of MK is an important parameter that affects the properties of geological polymers [10]. Elimbi et al. [2] calcined kaolin in the temperature range of 450 °C to 800 °C and found that the optimum kaolin calcination temperature for the preparation of alkali-activated geopolymers was 700 °C. Risdanareni et al. increased the temperature of kaolin calcination to 900~1100 °C, demonstrating that the optimum calcination temperature for kaolinite should not exceed 900 °C [11].
Compared to alkali-activated geopolymers, acid-activated geopolymers have better properties, such as lower density [12], better fire resistance [13], greater high-temperature resistance [14], greater corrosion resistance [15], better insulation [16] and higher mechanical strength [17]. When MK dissolves in a phosphoric acid solution (PAS), Al3+ ions are released. These ions then interact with the PAS and condense to create a three-dimensional hydrated aluminum phosphate network [18]. The characteristics of MK are essential variables that impact the effectiveness of geopolymerization in MKPGs. During the calcination preparation process, MK is accompanied by the loss of structural water and associated reorganization of the structure, with the Al3+ ion changing from a 6-coordinate structure to 4- and 5-coordinate structures [6, 9, 19]. Tchakouté et al. calcined kaolin for 4 h at 700 °C to produce geopolymers with a compressive strength of 21.97 MPa [20]. Khabbouchi et al. and Wang et al. researched the thermal stability of MKPGs produced by the reaction of MK with PAS that was calcined at 750 °C for 2 h [14, 21]. He et al. and Cao et al. found that MK exhibited bonding and reactivity upon calcination at 480~900 °C, demonstrating that MK can react with phosphoric acid; however, MK was inactive upon calcination at 950 °C [22, 23]. The temperature range of MK pretreatment required for the production of MKPGs was unsuitable, and the cause of the reduction in the reactivity of MK at 950 °C was unclear. This study aimed to examine the influences of pretreating the precursor at 950 °C on the properties and structure of MKPGs.
Materials
The chemical composition of kaolin is shown in Table 1. SiO2 and Al2O3 were the main ingredients in kaolin, and its loss of ignition at 1000 °C was 19.6%. The D50 of the kaolin particles was 18 μm. Metakaolin (MK) was obtained by calcination at 950 °C for various times. Phosphoric acid solution (PAS) was the chemically pure agent of 85% H3PO4. Distilled water was used throughout the experiments.
Preparation of phosphoric acid-activated geopolymers
Appropriate amounts of MK, PAS, and distilled water were thoroughly mixed, with water-to-MK and Al/P ratios of 0.4 and 1.0, respectively. The obtained slurry of mixtures was poured into a mold (diameter, 31 mm; height, 30-35 mm), which was then vibrated for 1 min to remove air bubbles. The mold was covered with plastic film to prevent water loss. The specimens were cured at a constant temperature of 60 °C and 90% relative humidity for 24 hours and then demolded after cooling. Standard curing was performed for 28 days to produce MKPGs.
Characterization methods
The chemical composition of kaolinite was examined by X-ray fluorescence spectrometry (XRF: ZSX Primus II, Japan). X-ray diffraction (XRD: Bruker D8 Advance, Germany) was used for the phase analysis. XRD analysis was performed with Cu-Kɑ radiation at 40 kV and 40 mA. The scanning range was 10°~90° with a scan rate of 3°/min, and the step size was 0.02°.
Functional group changes were identified using Fourier transform infrared spectroscopy (FTIR: Bruker Ensor II, Germany). FTIR measurements were obtained in the 400~4000 cm-1 range. The samples were well mixed with KBr and pressed into sheet forms before testing.
Scanning electron microscopy (SEM: Gemini 300, ZEISS, Germany) was used to observe the microscopic morphology. Before observation, the samples were vacuum-dried for 24 h and gold-plated.
The compressive strength of the MKPGs was tested using a universal testing device (SANS-300B, China). The compressive strength of different groups of specimens was tested at 28 days. Three samples were taken from each group, and the average values were used to determine the strength.

XRD analysis
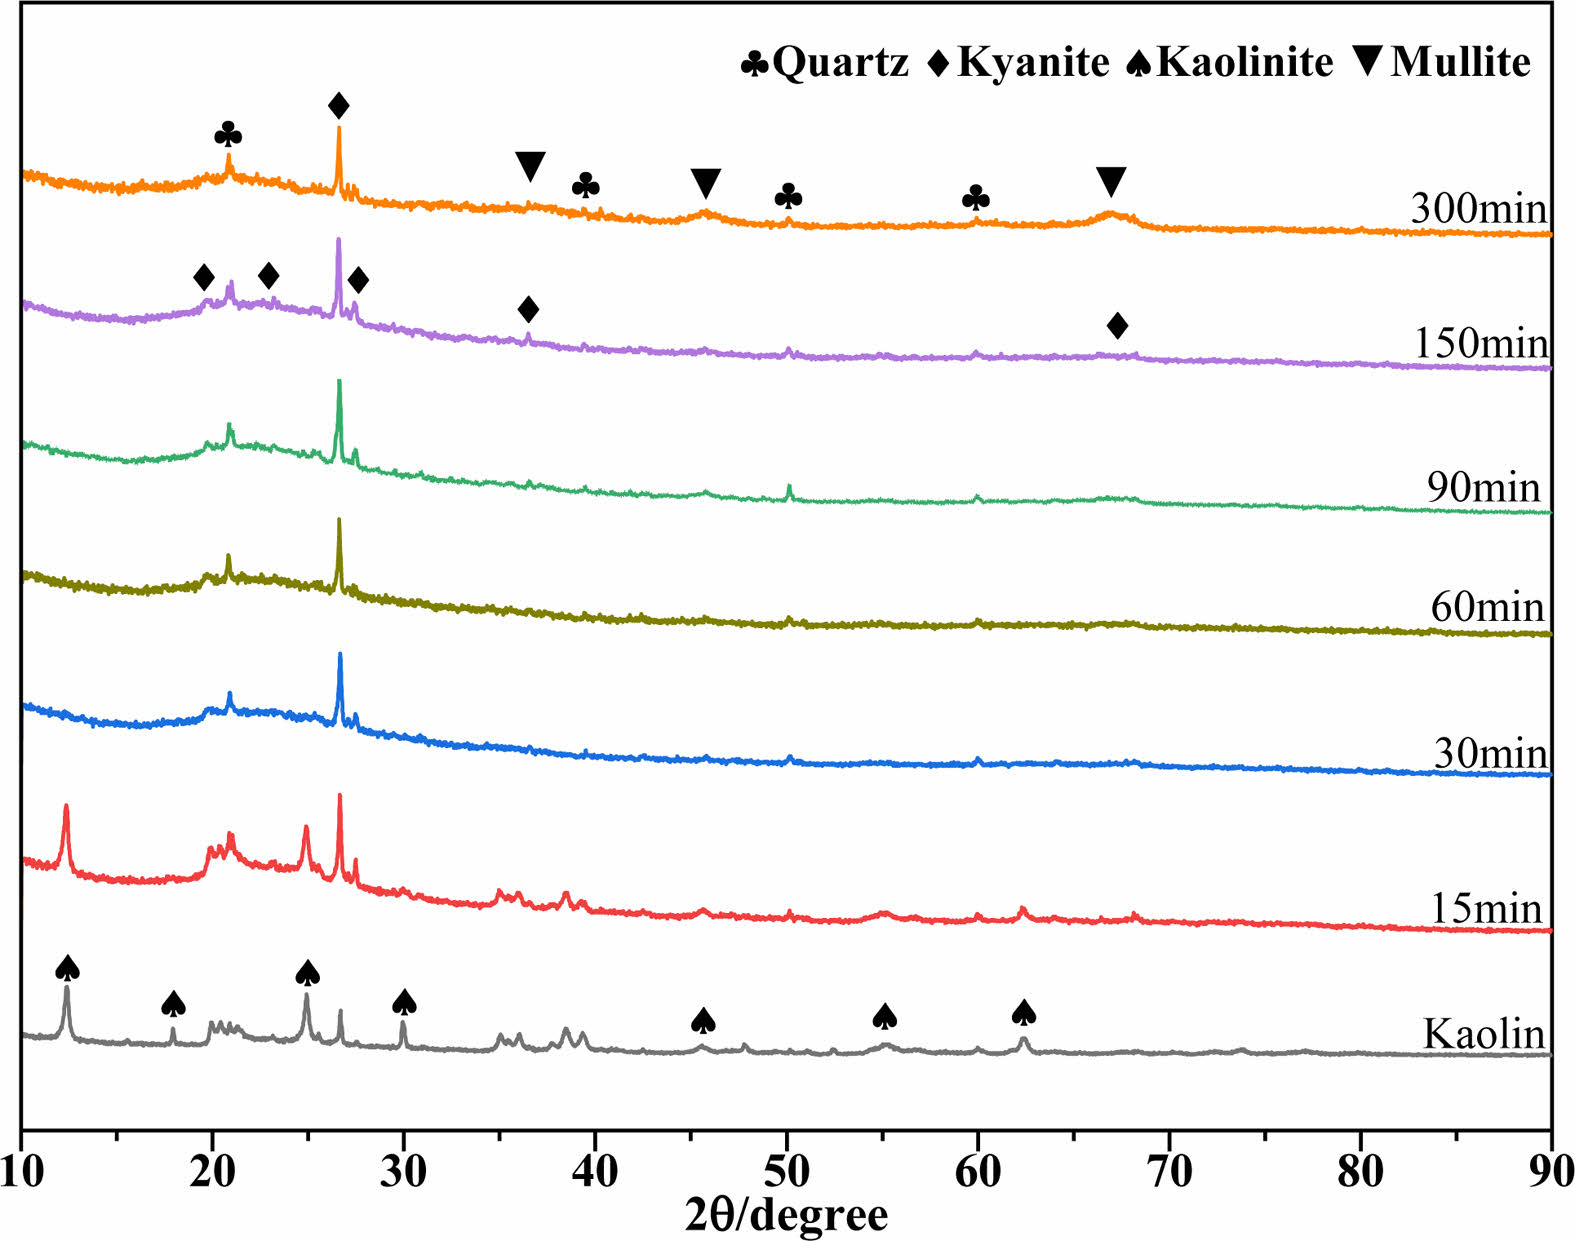
Figure 1 shows the XRD patterns of MK calcined at 950 °C for different times (0, 15, 30, 60, 90, 150, and 300 min). As observed in the figure, the adopted kaolin clay mostly consisted of the kaolinite phase (Al2(Si2O5)(OH)4, JCPDS No. 80-0885), with a trace quantity of the quartz phase (SiO2, JCPDS No. 46-1045). The diffraction peaks of kaolinite progressively decreased with increasing calcination time. The diffraction peaks of kaolinite vanished after 30 min of calcination, showing that kaolinite dehydroxylation transformed kaolinite into the amorphous phase of MK [24]. The diffraction peaks of the kyanite phase (Al2O3-SiO2, JCPDS No. 83-1568) were observed after calcination for more than 30 min, indicating that MK progressively transitioned into an ordered form. When the calcination time was further prolonged to 90 min, the diffraction peaks of the mullite phase (3Al2O3-2SiO2, JCPDS No. 79-1276) became visible. This change became more visible as the calcination time increased, indicating that the mullite phase was formed during calcination at 950 °C [25]. During the whole calcination process at 950 °C, the quartz phase did not change, as the diffraction peaks of the quartz phase did not change [26].
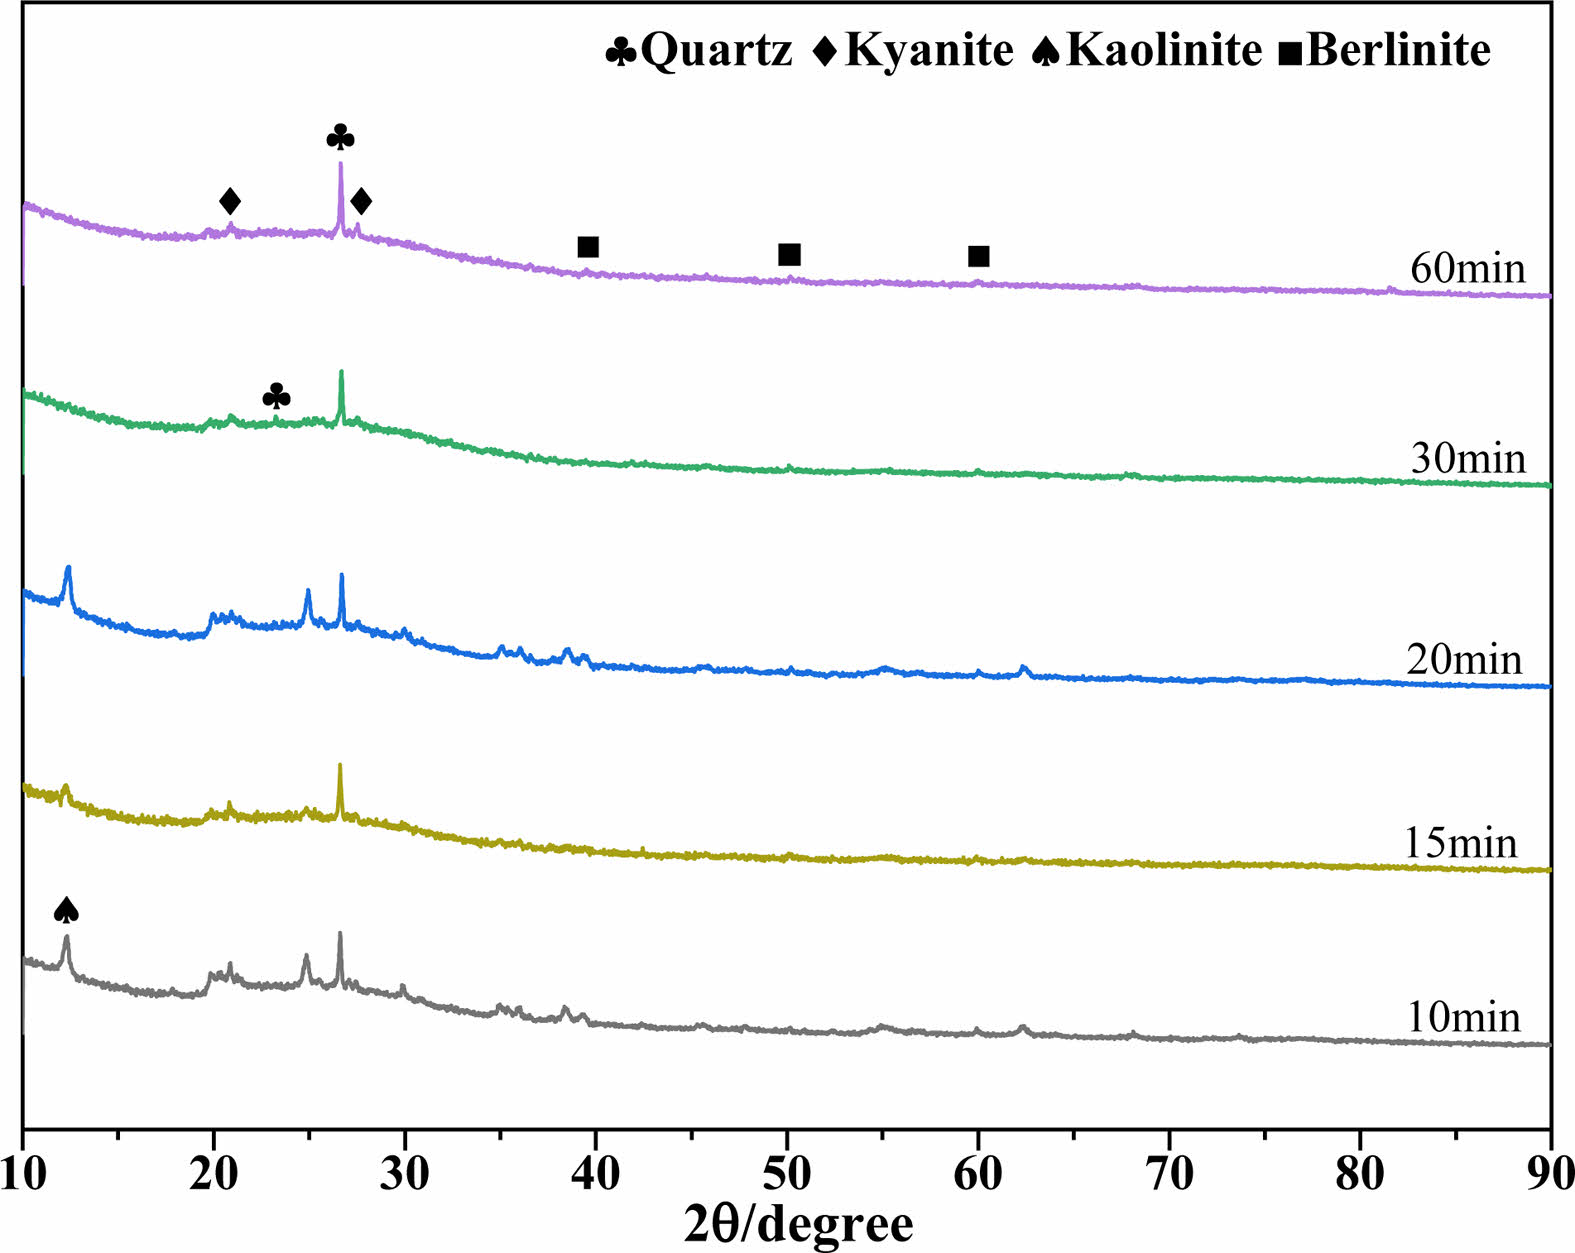
Figure 2 depicts the phases of the MKPGs that were produced when MK was calcined at 950 °C for various times. A broad amorphous diffraction peak was observed at 2θ values between 18° and 35°, indicating that a polymerization reaction occurred [18, 27]. Quartz was not involved in the polymerization since the strength of the diffraction peaks of the quartz phase remained mostly unchanged at various holding times [13]. The remaining kaolinite diffraction peaks vanished after 30 min of calcination [28]. A berlinite phase (AlPO4, JCPDS No. 76-0228) emerged as the calcination time reached 60 min. However, MK could not be hardened by the activity of PAS when the calcination time was 90 min. According to previous studies [24], the ordered transformation of MK (formation of kyanite) reduced, but did not completely eliminate, its activity. The failure to induce the polymerization of MK might be caused by the formation of mullite, consistent with the presence of mullite in the XRD pattern of kaolin calcined for 90 min.
FTIR analysis
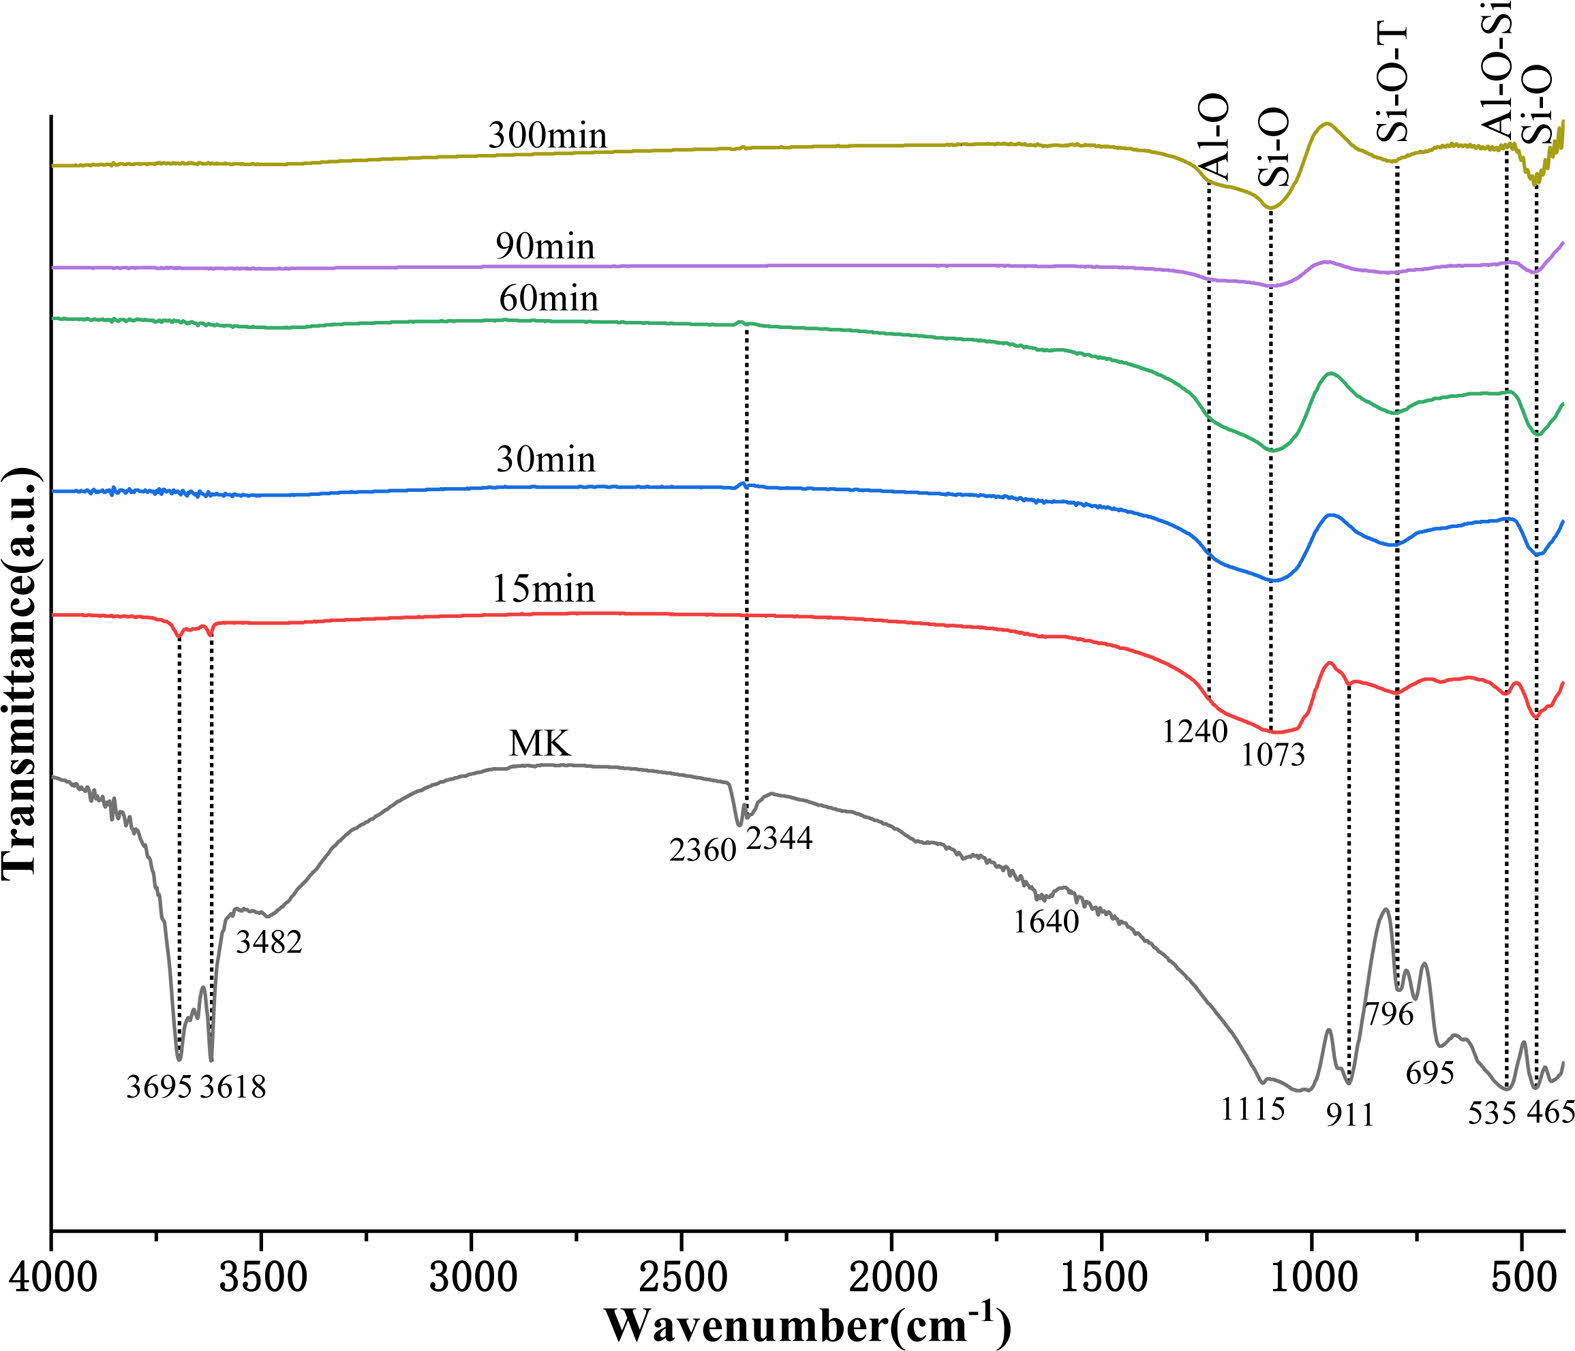
Figure 3 depicts the FTIR spectra of MK calcined at 950 °C for various times. The bands attributed to kaolin were observed at 3695, 3618, 3482, and 1640 cm-1, corresponding to stretching vibrations of external hydroxyl groups; 2360 and 2344 cm-1, corresponding to O-C-O stretching vibrations [29, 30];1115 and 796 cm-1,
corresponding to Si-O-T (T for Al or Si) stretching vibrations; 911 and 695 cm-1, corresponding to Al-OH bending vibrations; 535 cm-1, corresponding to Si-O-Al bending vibrations; and 465 cm-1, corresponding to Si-O bending vibrations [31, 32]. The O-H stretching vibrations of kaolinite at 3695, 3618, 3482, and 1640 cm-1 and the Al-OH bending vibrations at 911 cm-1 decreased in intensity with calcination time. This phenomenon indicated that structural water was removed by dehydroxylation during the thermally induced conversion of kaolin to MK [19, 33]. After 15 minutes of calcination, the O-H stretching vibration totally vanished, indicating that the majority of the structural water in kaolinite had been eliminated by this point. Additionally, the Si-O-T (T for Al or Si) tensile vibrations at 1115 and 796 cm-1, as well as the Al-O-Si bending vibrations at 535 cm-1, decreased, demonstrating that the Al-Si layer in kaolin was deformed and that the Al coordination changed from octahedral to tetrahedral with a more disordered structure [19, 34].
Al-O bending vibration bands at 1240 cm-1 and Si-O bending vibration bands at 1073 cm-1 were observed during the calcination process that converted kaolin into MK. The figure clearly shows that the bending vibration bands corresponding to Al-O and Si-O did not change considerably before a calcination time of 60 min. However, the Al-O and Si-O bending vibration dramatically diminished as the calcination time approached 90 min, indicating that the Al-O and Si-O bonds in MK were substantially broken. As the calcination time increased to 300 min, a significant increase in the bending vibrations associated with Al-O and Si-O was observed, suggesting that a new phase was formed. As seen from the XRD pattern (Fig. 1), the mullite phase precipitated as the calcination time reached 90 min. Obvious changes in the bands corresponding to Al-O and Si-O also occurred at a calcination time of 90 min. This indicates that the newly formed Al-O and Si-O bonds were from the mullite phase. It was also found that the vibrational band at 1073 cm-1 assigned to Si-O shifted to 1100 cm-1, which was associated with the modification of the second coordination environment of the Si atom [23].
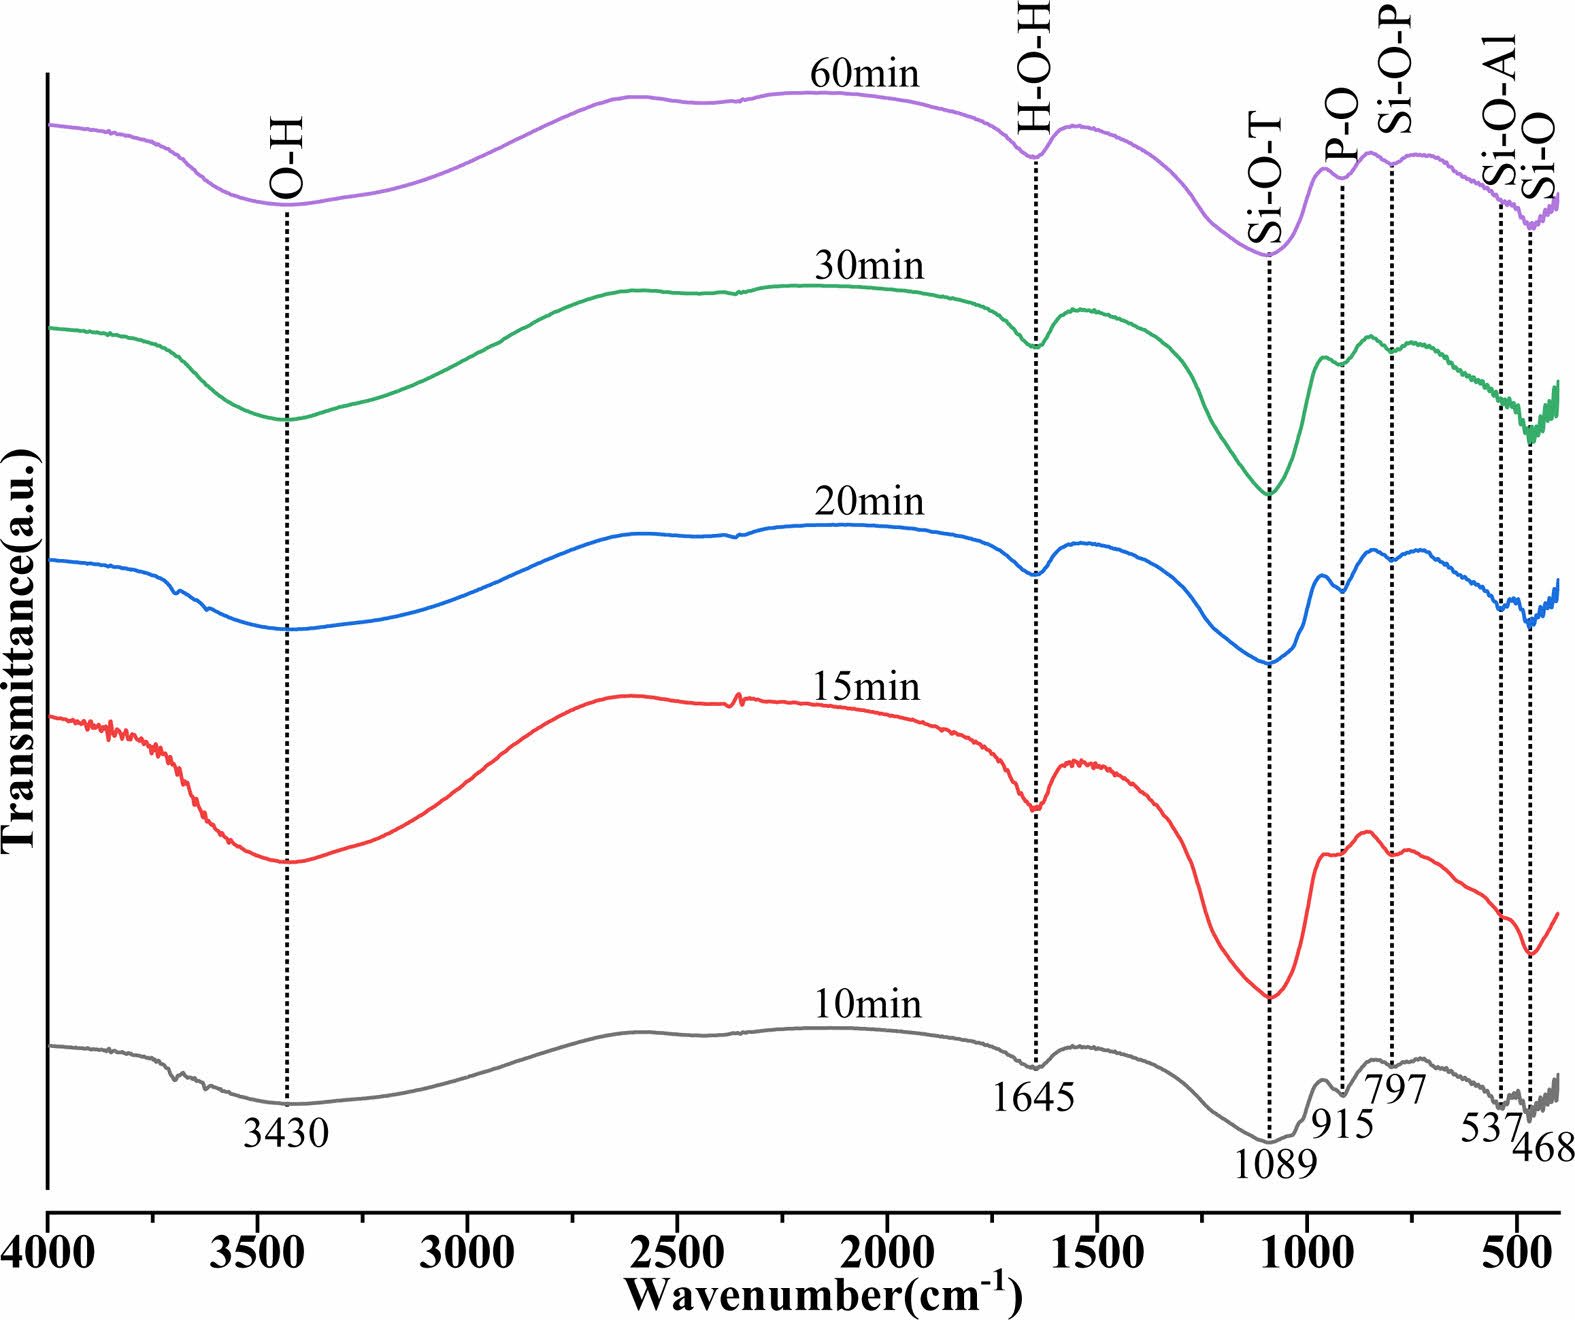
The FTIR spectra of the MKPGs produced by calcination at 950 °C for various times are displayed in Fig. 4. The band at 3430 cm-1 corresponds to the O-H stretching vibration, that at 1645 cm-1 was attributed to the H-O-H stretching vibration, the band at 1089 cm-1 was attributed to the Si-O-T (T is Al or Si) stretching vibration, that at 915 cm-1 was attributed to the P-O stretching vibration, that at 797 cm-1 corresponds to the Si-O-P bending vibration, the band at 537 cm-1 was attributed to the Si-O-Al bending vibration, and the band at 468 cm-1 was attributed to the Si-O bending vibration. The FTIR spectra show that the functional groups and chemical bonding species of MKPGs were affected little by the calcination time of MK, but the intensity of the peak corresponding to Si-O-T (T is Al or Si) was the highest when the calcination time reached 30 min. This indicates that the structure of the MKPGs was enhanced at this time. In addition, the emergence of a new peak at 797 cm-1 corresponding to Si-O-P suggested that MK and phosphoric acid reacted [13, 35]. The decrease in the intensity of the Si-O bending vibration peak resulted from an increase in the amount of free soluble silicon in the structure, which slowed the polymerization process and reduced the strength of the geopolymer [30, 36] (as shown in Fig. 5). The peak at 1089 cm-1 in the MKPG spectrum was wider. This broad band, which contained the bands of Si-O, Al-O, and PO43-, showed that the berlinite phase formed [37] and was consistent with the XRD results, as shown in Fig. 3.
Compressive strength
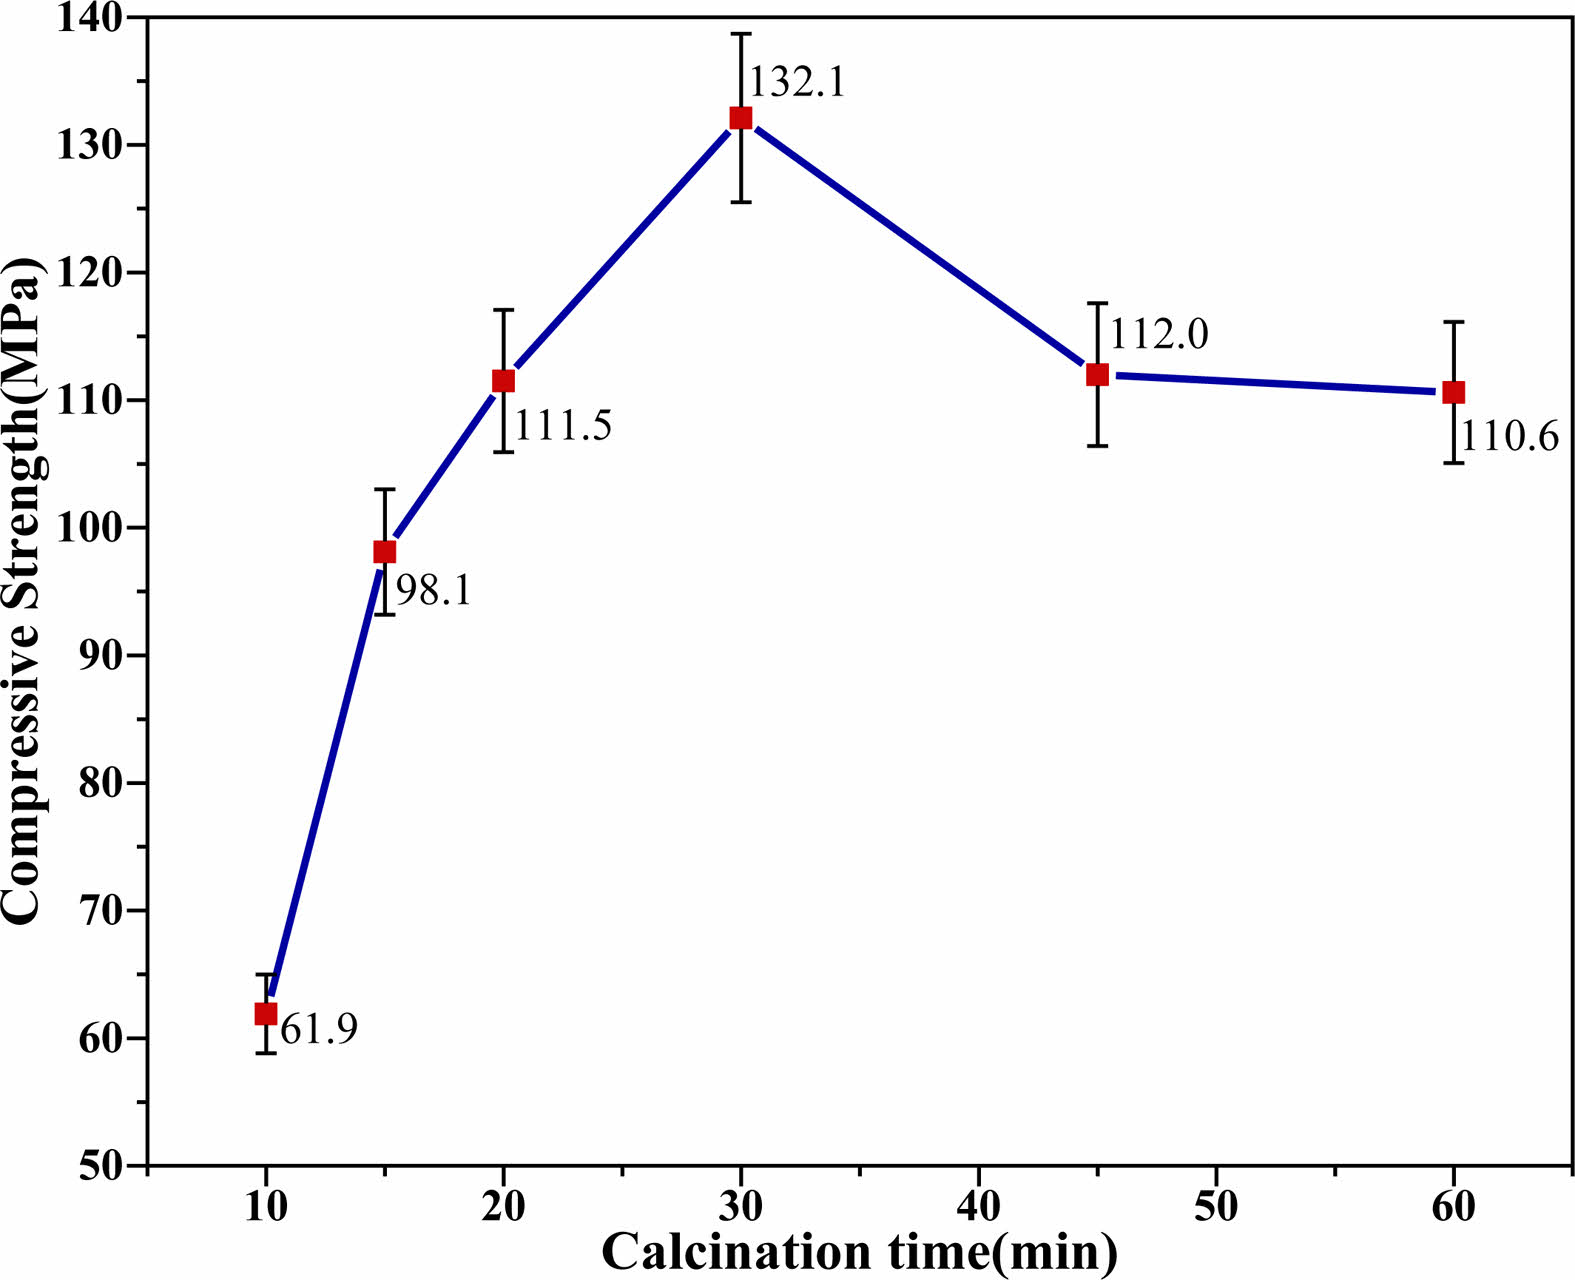
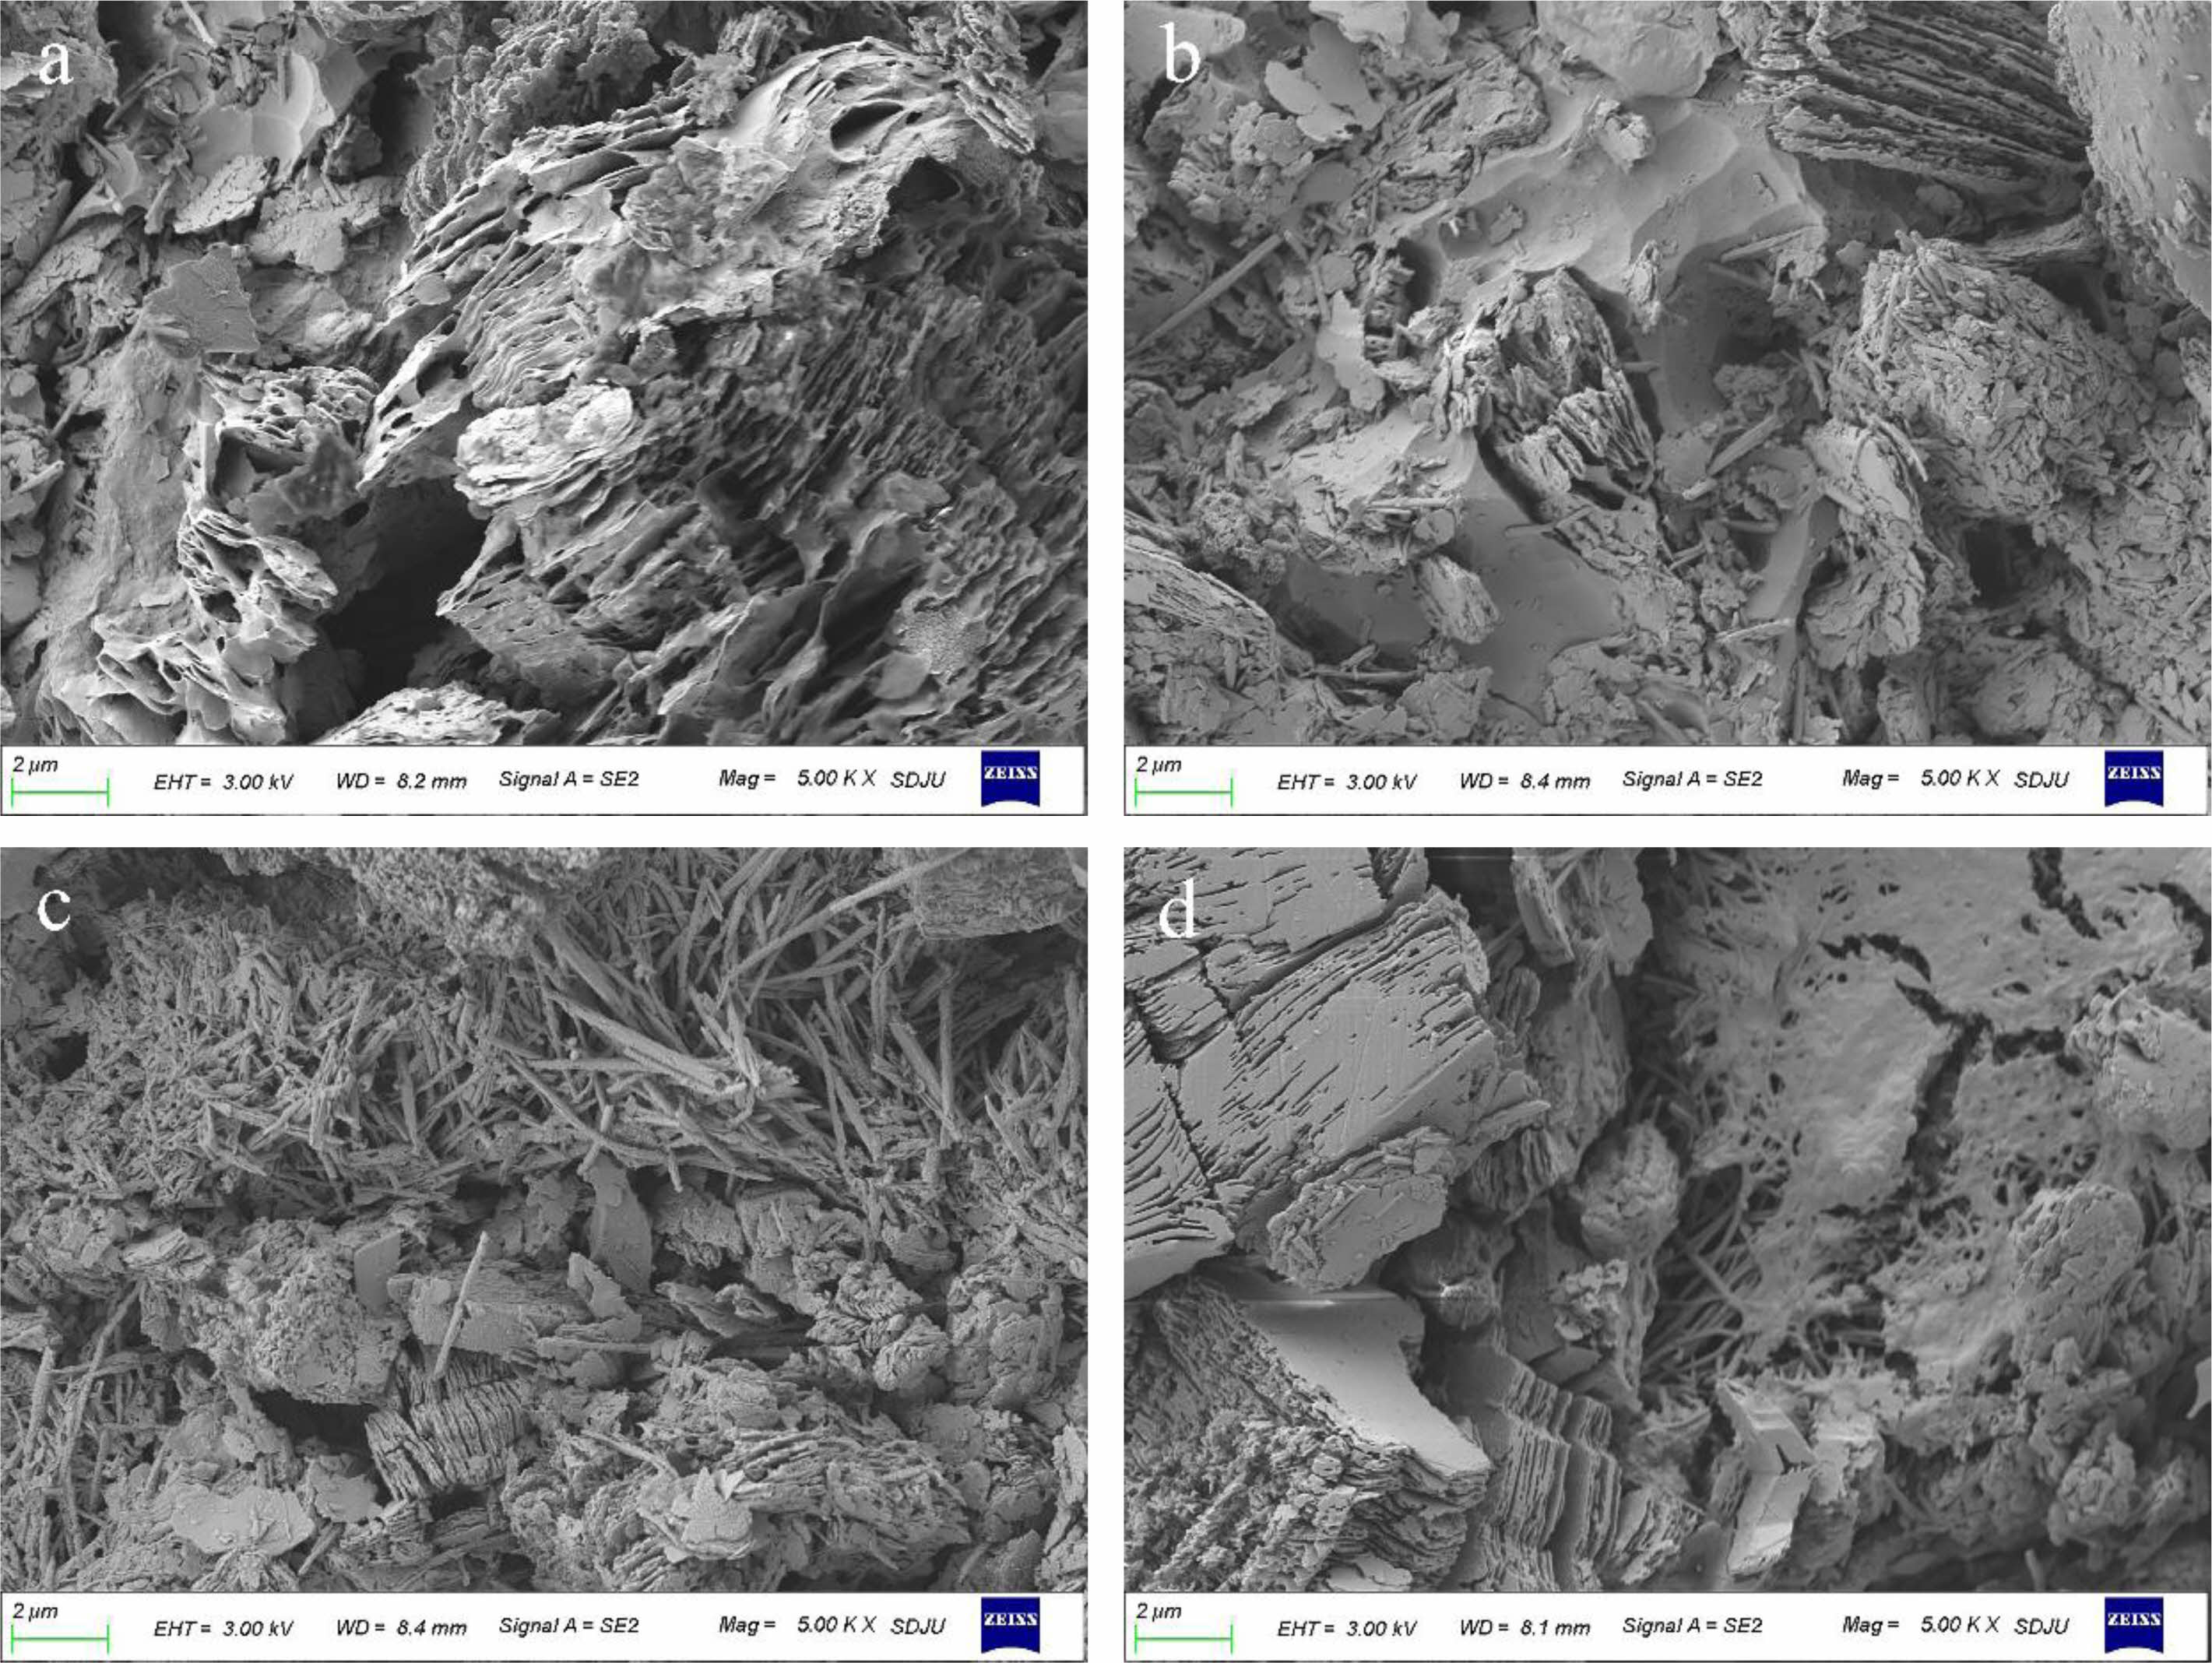
The compressive strength of the MKPG samples prepared from MK calcined at 950 °C for various times (10, 15, 20, 30, 45, and 60 min) is shown in Fig. 5. The compressive strength steadily increased with increasing calcination time. The compressive strength increased from 61.9 MPa at 10 min of calcination to 132.1 MPa at 30 min. As seen in the SEM images (Fig. 6(a, b, c)), the structural densification of MKPGs progressively increased, and the layer structure of MK gradually decreased with increasing calcination time This phenomenon indicates that as the calcination time increases, the reactivity of MK increases, and the polymerization reaction between MK and PAS becomes more intense. The polymerization reaction produces dense and homogeneous amorphous geopolymer matrices. From Fig. 6(a), it can be seen that there are large pore structures in the sample, which are generated during the curing process and harm the compressive strength of the sample. When the calcining time reached 30 min, the compressive strength reached a maximum of 132.1 MPa. At this time, the compressive strength of the MKPG reached a high level [38]. However, when the calcination time was greater than 30 min, the compressive strength of the MKPGs began to decline. In the samples that were calcined at 950 °C for 45 min and 60 min, the compressive strength decreased to 112.0 MPa and 110.6 MPa, respectively. This phenomenon was consistent with the decrease in intensity of the bending vibration corresponding to Si-O-T (T is Al or Si) with increasing calcination time, which was observed in the FTIR patterns (see Fig. 4). In addition, it was found that after calcination for more than 30 minutes, kyanite was formed, indicating that MK transformed from a disordered phase to an ordered structure (see Fig. 1). This further confirms that the decrease of the compressive strength corresponds to the formation of the ordered structure in the MK [24]. As seen in the SEM image of the sample calcined for 60 min (Fig. 6d), the layer structure expanded again, suggesting an increase in unreacted MK. At the same time, several microcracks appeared in the sample, which may have also caused a decrease in compressive strength.
As the calcination time reached 90 min, MK could not be activated by PAS, as previously mentioned, and the strength of the MKPG samples could not be detected. Cao et al. found that kaolin treated at 950 °C was inactive and could not be activated properly [39, 40]. However, based on our results, MK could be properly activated to achieve a high strength. MK did not completely lose its activity and could be activated by PAS until the calcination time reached a critical value; that is, mullite formed in MK before the ordered phase.
|
Fig. 1 XRD patterns of MK calcined at 950 ℃ for various times. |
|
Fig. 2 XRD patterns of MKPGs created with MK calcined at 950℃ for various times. |
|
Fig. 3 FTIR spectra of MK calcined at 950 ℃ for various times. |
|
Fig. 4 FTIR spectra of the MKPGs created from MK calcined at 950 °C for various times. |
|
Fig. 5 Influence of the calcination time on the compressive strength of MKPGs. |
|
Fig. 6 SEM images of MKPGs with MK calcined at 950 ℃ for various times: a) 10 min; b) 20 min; c) 30 min; d) 60 min. |
In this paper, kaolin calcined at 950 °C for different times was used to fabricate MKPGs. The compressive strength of the MKPGs increased with increasing calcination time. When the calcination time reached 30 min, a maximum strength of 132.1 MPa was achieved for the MKPGs. When the calcination time was longer than 30 min, the degree of order of MK increased, and the kyanite phase began to form. The formation of the kyanite phase reduced the activity of MK, leading to a decrease in the compressive strength from 132.1 MPa to 110.6 MPa when the calcination time was 30 min to 60 min. After 60 min of calcination, MK could not react with phosphoric acid, and the geopolymer did not solidify properly due to the formation of the mullite phase.
The authors declare that they have no known competing financial interests or personal relationships that could have appeared to influence the work reported in this paper.
- 1. J. Davidovits, J. Therm. Anal. 37 (1991) 1633-1656.
-

- 2. A. Elimbi, H.K. Tchakoute, and D. Njopwouo, Constr. Build. Mater. 25[6] (2011) 2805-2812.
-
- 3. A. Autef, E. Joussein, G. Gasgnier, S. Pronier, I. Sobrados, J. Sanz, and S. Rossignol, Powder Technol. 250 (2013) 33-39.
-
- 4. C. Boutterin and J. Davidovits, in Geopolymer’88, June 1988, edited by J. Davidovits and J. Orlinski (Geopolymer Institute Press, 1988) p.79.
- 5. Y. Rho and S.G. Kang, J. Ceram. Process. Res. 21[S1] (2020) 74-80.
-
- 6. H. Guo, P. Yuan, B. Zhang, Q. Wang, L. Deng, and D. Liu, J. Cleaner Prod. 285 (2021) 125430.
-
- 7. S. Sutardi, R. Septawendar, and A. Rachman, J. Ceram. Process. Res. 14[3] (2013) 400-404.
-
- 8. H. Celerier, J. Jouin, V. Mathivet, N. Tessier-Doyen, and S. Rossignol, J. Non-Cryst. Solids. 493 (2018) 94-98.
-
- 9. P. Sengyang, K. Rangsriwatananon, and A. Chaisena, J. Ceram. Process. Res. 16[1] (2015) 111-116.
-
- 10. S. Demir and S. Yasin, J. Ceram. Process. Res. 23[1] (2022) 41-47.
-
- 11. P. Risdanareni, J.J. Ekaputri, and Triwulan, AIP Conf. Proc. 1887 (2017) 020045.
-
- 12. H. Lin, H. Liu, Y. Li, and X. Kong, Cem. Concr. Res. 144 (2021) 106425.
-
- 13. H.Y. Zhang, V. Kodur, S.L. Qi, L. Cao, and B. Wu, Constr. Build. Mater. 55 (2014) 38-45.
-
- 14. Y.S. Wang, J.G. Dai, Z. Ding, and W.T. Xu, Mater. Lett. 190 (2017) 209-210.
-
- 15. R. Balasubramanian, and A.V.R. Kumar, Corros. Sci. 42 (2000) 2085-2101.
-
- 16. X. Cui, L. Liu, Y. He, J. Chen, and J. Zhou, Mater. Chem. Phys. 130[1-2] (2011) 1-4.
-
- 17. D.S. Perera, J.V. Hanna, J. Davis, M.G. Blackford, B.A. Latella, Y. Sasaki, and E.R. Vance, J. Mater. Sci. 43 (2008) 6562-6566.
-
- 18. V. Mathivet, J. Jouin, A. Gharzouni, I. Sobrados, H. Celerier, S. Rossignol, and M. Parlier, J. Non-Cryst. Solids. 512 (2019) 90-97.
-
- 19. S. Sperinck, P. Raiteri, N. Marks, and K. Wright. J. Mater. Chem. 21[7] (2011) 2118-2125.
-
- 20. H.K. Tchakouté, C.N. Bewa, D. Fotio, C.M. Dieuhou, E. Kamseu, and C.H. Rüscher, Appl. Clay Sci. 209 (2021) 106148.
-
- 21. M. Khabbouchi, K. Hosni, M. Mezni, C. Zanelli, M. Doggy, M. Dondi, and E. Srasra, Appl. Clay Sci. 146 (2017) 510-516.
-
- 22. Y. He, L. Liu, L. He, and X. Cui, Ceram. Int. 42[9] (2016) 10908-10912.
-
- 23. D.G. Cao, D.G. Su, Z.Y. Yang, and G.S. Song, Acta Mineral. Sin. 24[4] (2004) 366-372.
- 24. Q.B. Tian, X. Yu, Y.W. Sui, L.N. Xu, and Z. Lv, Ceram.-Silik. 66 (2022) 236-244.
-
- 25. A. Baccour, and R.D. Sahnou, J. Bouaziz, Powder Technol. 264 (2014) 477-483.
-
- 26. S. Louati, S. Baklouti, and B. Samet, Appl. Clay Sci. 132 (2016) 571-578.
-
- 27. A. Katsiki, T. Hertel, T. Tysmans, Y. Pontikes, and H. Rahier, Mater. 12[3] (2019) 442.
-
- 28. M.R. Wang, D.C. Jia, P.G. He, and Y. Zhou, Mater. Lett. 64[22] (2010) 2551-2554.
-
- 29. B. Yuan, Q.L. Yu, and H.J.H. Brouwers, Mater. Des. 86 (2015) 878-886.
-
- 30. Z. Khairunnisa, C. Heah, Y. Liew, A. Mustafa, S. Ong, and S. Mohd, Constr. Build. Mater. 270 (2021) 121486.
- 31. E. Makó, Z. Senkár, J. Kristóf, and V. Vágvölgyi, J. Colloid Interface Sci. 294[2] (2006) 362-370.
-
- 32. C. Vizcayno, R.M. De Gutierrez, R. Castello, E. Rodriguez, and C.E. Guerrero, Appl. Clay Sci. 49[4] (2010) 405-413.
-
- 33. E. Gasparini, S.C. Tarantino, P. Ghigna, M.P. Riccardi, E. Cedillo-Gonzalez, C. Siligardi, and M. Zema, Appl. Clay Sci. 80 (2013) 417-425.
-
- 34. P. Ptáček, D. Kubátová, J. Havlica, J. Brandštetr, F. Šoukal, and T. Opravil, Powder Technol. 204[2-3] (2010) 222-227.
-
- 35. M. Zribi, B. Samet, and S. Baklouti, J. Non-Cryst. Solids. 511 (2019) 62-67.
-
- 36. B.S. Gebregziabiher, R. Thomas, and S. Peethamparan, Cem. Concr. Compos. 55 (2015) 91-102.
-
- 37. A. Charfi, R.D. Sahnoun, and J. Bouaziz, Powder Technol. 235 (2013) 633-639.
-
- 38. M. Zribi, and S. Baklouti, Polym. Bull. 79[9] (2022) 6827-6855.
-
- 39. D. Cao, D. Su, B. Lu, and Y. Yang, J. Chin. Ceram. Soc. 33[11] (2005) 1385-1389.
- 40. X. Liu, J. Jiang, H. Zhang, M. Li, Y. Wu, L. Guo, W. Wang, P. Duan, W. Zhang, and Z. Zhang, Appl. Clay Sci. 196 (2020) 105769.
-
 This Article
-
2024; 25(1): 138-143
Published on Feb 29, 2024
- 10.36410/jcpr.2024.25.1.138
- Received on Jan 14, 2024
- Revised on Feb 8, 2024
- Accepted on Feb 15, 2024
Services
- Abstract
introduction
experimental
results and discussion
conclusion
- Declaration of Interest
- References
- Full Text PDF
Shared
Correspondence to
- Qingbo Tian
-
School of Materials Science and Engineering, Shandong Jianzhu University, Jinan 250000, China
Tel : +86 13153128675 Fax: +86 053186367285 - E-mail: tqb11@163.com
Clean-Energy Research Institute(CRI), Hanyang University, 222, Wangsimni-ro, Seongdong-gu, Seoul, 04763, Korea
E-mail: jcpr@hanyang.ac.kr