


- The behavior of NiO/GO nanoelectroseramics in different solvents: Synthesis, structural, thermal and electro-optical properties
Cihat Aydina,* and Oktay Emre Yildizb
aDepartment of Airframe and Powerplant Maintenance, School of Civil Aviation, Firat University, Elazig, Türkiye
bDepartment of Metallurgy and Materials Engineering, Faculty of Engineering, Mersin University, Mersin, TürkiyeThis article is an open access article distributed under the terms of the Creative Commons Attribution Non-Commercial License (http://creativecommons.org/licenses/by-nc/4.0) which permits unrestricted non-commercial use, distribution, and reproduction in any medium, provided the original work is properly cited.
The need for effective energy storage and clean energy alternatives is one of the greatest concerns in the modern world. The need can be met by the application of energy storage devices such as supercapacitors, batteries, fuel cells and other energy storage devices. Supercapacitors are devices dedicated to energy storage. In this study, graphene oxide/NiO nanoelectroseramics were synthesized using acetone, ethyl alcohol, 2-Methoxyethanol and pure water. NiO nanoparticles, which are the components of nanocomposites, were synthesized using the sol-gel method, and graphene oxide (GO) was synthesized using the Hummers method. XRD, SEM, FT-IR, DTA-TG, UV-vis analyzes were applied to the samples obtained. Nanosupercapacitive properties of metal oxide and graphene oxide doped nanocomposites obtained using different solvents were investigated. Electrochemical measurements of the produced nanoelectroseramics were carried out by cyclic voltammetry (CV), and the capacitance curves and impedance spectrometers of the electrodes were determined.
Keywords: Nanoelectroseramics, Supercapacitor, Metal oxide, Sol-gel, Hummers method.
Currently, renewable energy sources generate energy intermittently based on natural conditions, posing a challenge for consistent power supply. To address this limitation, energy storage systems with continuous energy availability, high power density, and high energy density are essential. Supercapacitor energy storage systems emerge as a promising solution to meet varying energy requirements. In the contemporary world, optimizing the design of renewable energy systems and high-performance storage devices is crucial for efficient energy utilization [1]. Supercapacitors have gained significant attention as a novel energy storage system due to their impressive power density and excellent cycling stability, bridging the performance gap between traditional capacitors and batteries [2].
Supercapacitors can be categorized into two types based on their energy storage mechanism: electrical double-layer capacitors (EDLC) and pseudocapacitors [3]. Among pseudocapacitors, NiO stands out as a distinctive material due to its cost-effectiveness, high capacitance, chemical and thermal stability, and straightforward fabrication process [4, 5]. However, NiO faces challenges such as poor rate performance and cycling stability resulting from low ion migration rates and volume changes during circulation [6]. Consequently, researchers have focused on enhancing NiO-based electrodes by introducing various porous structures or combining it with carbon materials like graphene, activated carbon, carbon nanotubes, and mesoporous materials to improve electrochemical performance [7, 8]. Notably, graphene/NiO-based electrodes have been extensively investigated, benefitting from graphene’s unique properties, including specific surface area, thermal stability, high conductivity [9], and the presence of carboxyl groups, making it easily soluble in various solvents, including water [10, 11].
In this study, graphene oxides (GO) with supercapacitive properties were synthesized using the Modified Hummers method. The resulting graphene oxide (GO) was then reinforced with NiO solutions, synthesized using different solvents through the sol-gel method.
Graphene Oxide Synthesis
The chemical approach known as the modified Hummers method was employed in this study to derive graphene oxide from graphite powder. Through oxidation of the graphite layers, the resultant oxide derivatives facilitated the opening of layers, subsequently separated through sonication to form graphene oxide layers.
In the experimental procedure, graphite powder, sodium nitrate (NaNO3), and sulfuric acid (H2SO4) were combined in an ice bath. In the subsequent stage, potassium permanganate (KMnO4), a potent oxidant, was gradually introduced to the solution and mixed at 35 °C. The third stage involved the addition of deionized water to the mixture, with continued mixing. Finally, 30% concentration hydrogen peroxide (H2O2) was added, and mixing persisted. Following these steps, the mixture underwent thorough washing with deionized water until reaching a pH of 7, after which it was filtered. Subsequent to the filtration process, the material was dried in an oven at 50 °C for 24 hours, resulting in the obtained graphene oxide (GO) in powder form.
Metal Oxide Production
Preparation of the pure metal oxide solution involved placing 10 ml of solvent and 2 M metal oxide powders into test bottles, which were thoroughly washed with de-ionized water and left to dry. The mixture was then stirred in a magnetic stirrer at 500 rpm, maintaining a temperature of 60 °C for 15-20 minutes. Upon completion of the mixing process, the resulting mixture exhibited a white color. Subsequently, 0.3 ml of monoEthanolamine solution, serving as a stabilizer, was added to the mixture. The solution underwent further mixing in a magnetic stirrer at 500 rpm, sustained at 60 °C for 2 hours, followed by an additional hour of mixing with an ultrasonic mixer. Upon completion of these processes, the initially white mixture transformed into a transparent state. These procedures were independently executed for each NiO variant with distinct solvents (Deionized water, Acetone, Ethyl alcohol, 2-Methoxyethanol), resulting in the generation of the respective metal oxide solutions.
Composite Sample Production
Graphene oxide powders, synthesized using the modified Hummers method, were individually dissolved in deionized water, 2-methoxy ethanol, acetone, and ethyl alcohol, followed by sonication. In each case, 1 g of graphene oxide powder was dissolved in 10 ml of the respective solvent. The resulting solutions were then added to metal oxide solutions obtained via the sol-gel method and subjected to mixing in a magnetic stirrer for 24 hours. Subsequently, the composite mixture obtained was dried at 175 °C for a duration of 6 hours. The resulting solid composite structure underwent a grinding process, yielding powders that were further shaped into pellets using a press. As a result, GO/NiO nanocomposites were successfully obtained.
Characterization techniques
The scanning electron microscope (ZEISS SIGMA 300) was employed to examine the surface structure and morphologies of the prepared films. Crystal structure and properties of the samples were characterized using Cu Kα (λ=0.15406 nm) radiation at a scanning speed of 0.02° with a PANalytical Empyrean X-ray diffraction device (XRD). Reflectance R(λ) measurements in the wavelength range of 200-900 nm were conducted using a Shimadzu UV-VIS-NIR 3600 model spectrometer to assess the films. Thermo Scientific Nicolet iS5 FT-IR was utilized to determine the chemical bonding between particles in the samples. Additionally, mass changes (TG) dependent on temperature and exothermic or endothermic changes (DTA) resulting from crystallization, melting, and sublimation in the sample were recorded using the Shimadzu DTG-60AH automatic simultaneous TG/DTA Device.
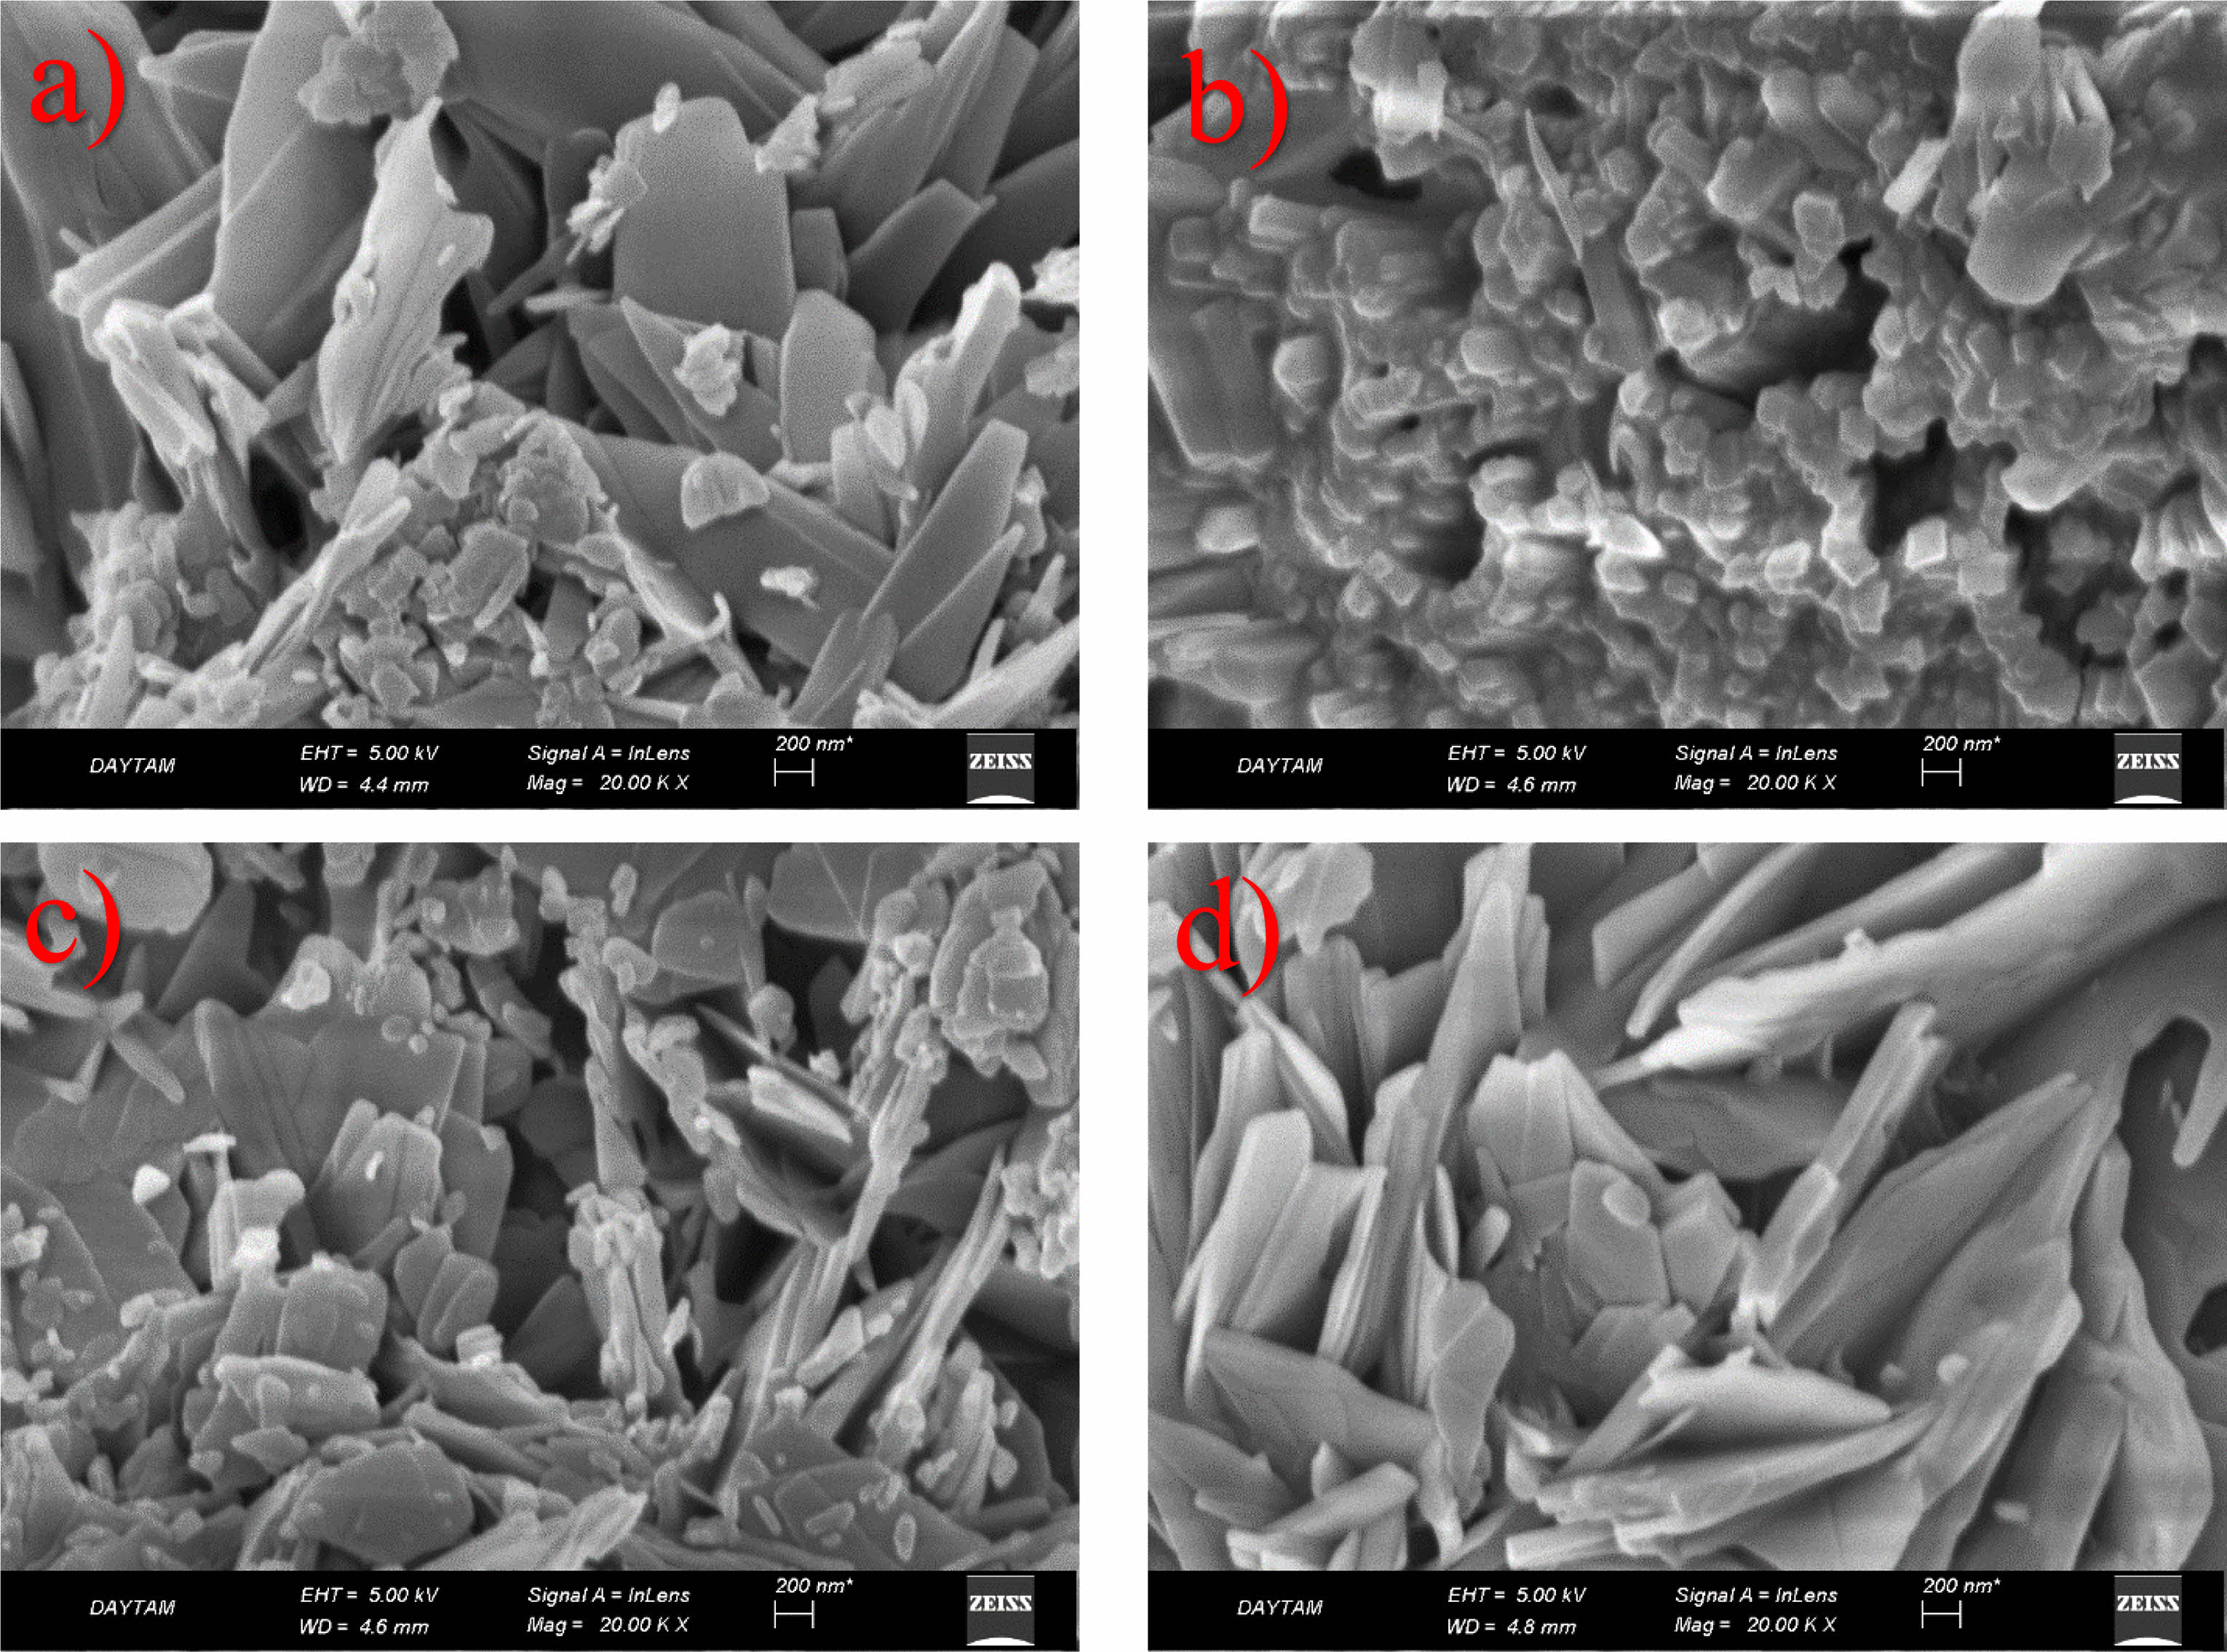
Figure 1 presents SEM images of the GO/NiO nanocomposite, a product of combining NiO nanoparticles obtained through the sol-gel method, dissolved in various solvents, and GO synthesized via the Hummers method. Upon closer examination of the SEM images, a distinct nano-sized arrangement of NiO particles emerges, strategically positioned between the layers of GO. The resulting microstructure showcases a hierarchical formation, with primary particles organized in layered configurations. The observed layers and structures, comprising both graphene and NiO components, exhibit not only homogeneity but also distinct orientations. This suggests that the distribution of these layers within the nanocomposite is not uniform, but rather exhibits variability. This non-uniform distribution may be attributed to potential interactions between solvents and solutes during the synthesis process, impacting the morphology and size of the final product [12]. These SEM observations provide valuable insights into the intricate interplay between graphene and NiO within the nanocomposite, shedding light on the hierarchical microstructure and its potential implications for the material’s properties and performance.
Nanocomposite supercapacitors combine carbon-structured materials with conductive polymeric materials or metal oxides and enable the formation of physical and chemical charge storage systems together in an electrode. The biggest factor here is surface area. If the surface area is increased, a high value capacitor is obtained. The main goal here is to increase the surface area without increasing the volume. Carbon-based materials create an electrical double layer and increase the contact surface of the electrolyte material with the upper surface area they provide, thus increasing ion exchanges. From this perspective, graphene, which has a porous structure, is a hierarchical material that exhibits unique properties such as extremely large surface area, high conductivity path and enhanced charge-carrying mobility, and lower resistance. In addition, NiO undergoes various oxidation states at certain potentials, leading to an increase in electrical conduction and electrical storage. It provides a large specific surface area to improve the contact between the active areas of the electrode and the electrolyte. The high amount of pores in the material causes an increase in the resistance of the material and a decrease in device performance. SEM analyzes are used to determine such features. It can be said that morphology is very important, especially in supercapacitor applications.
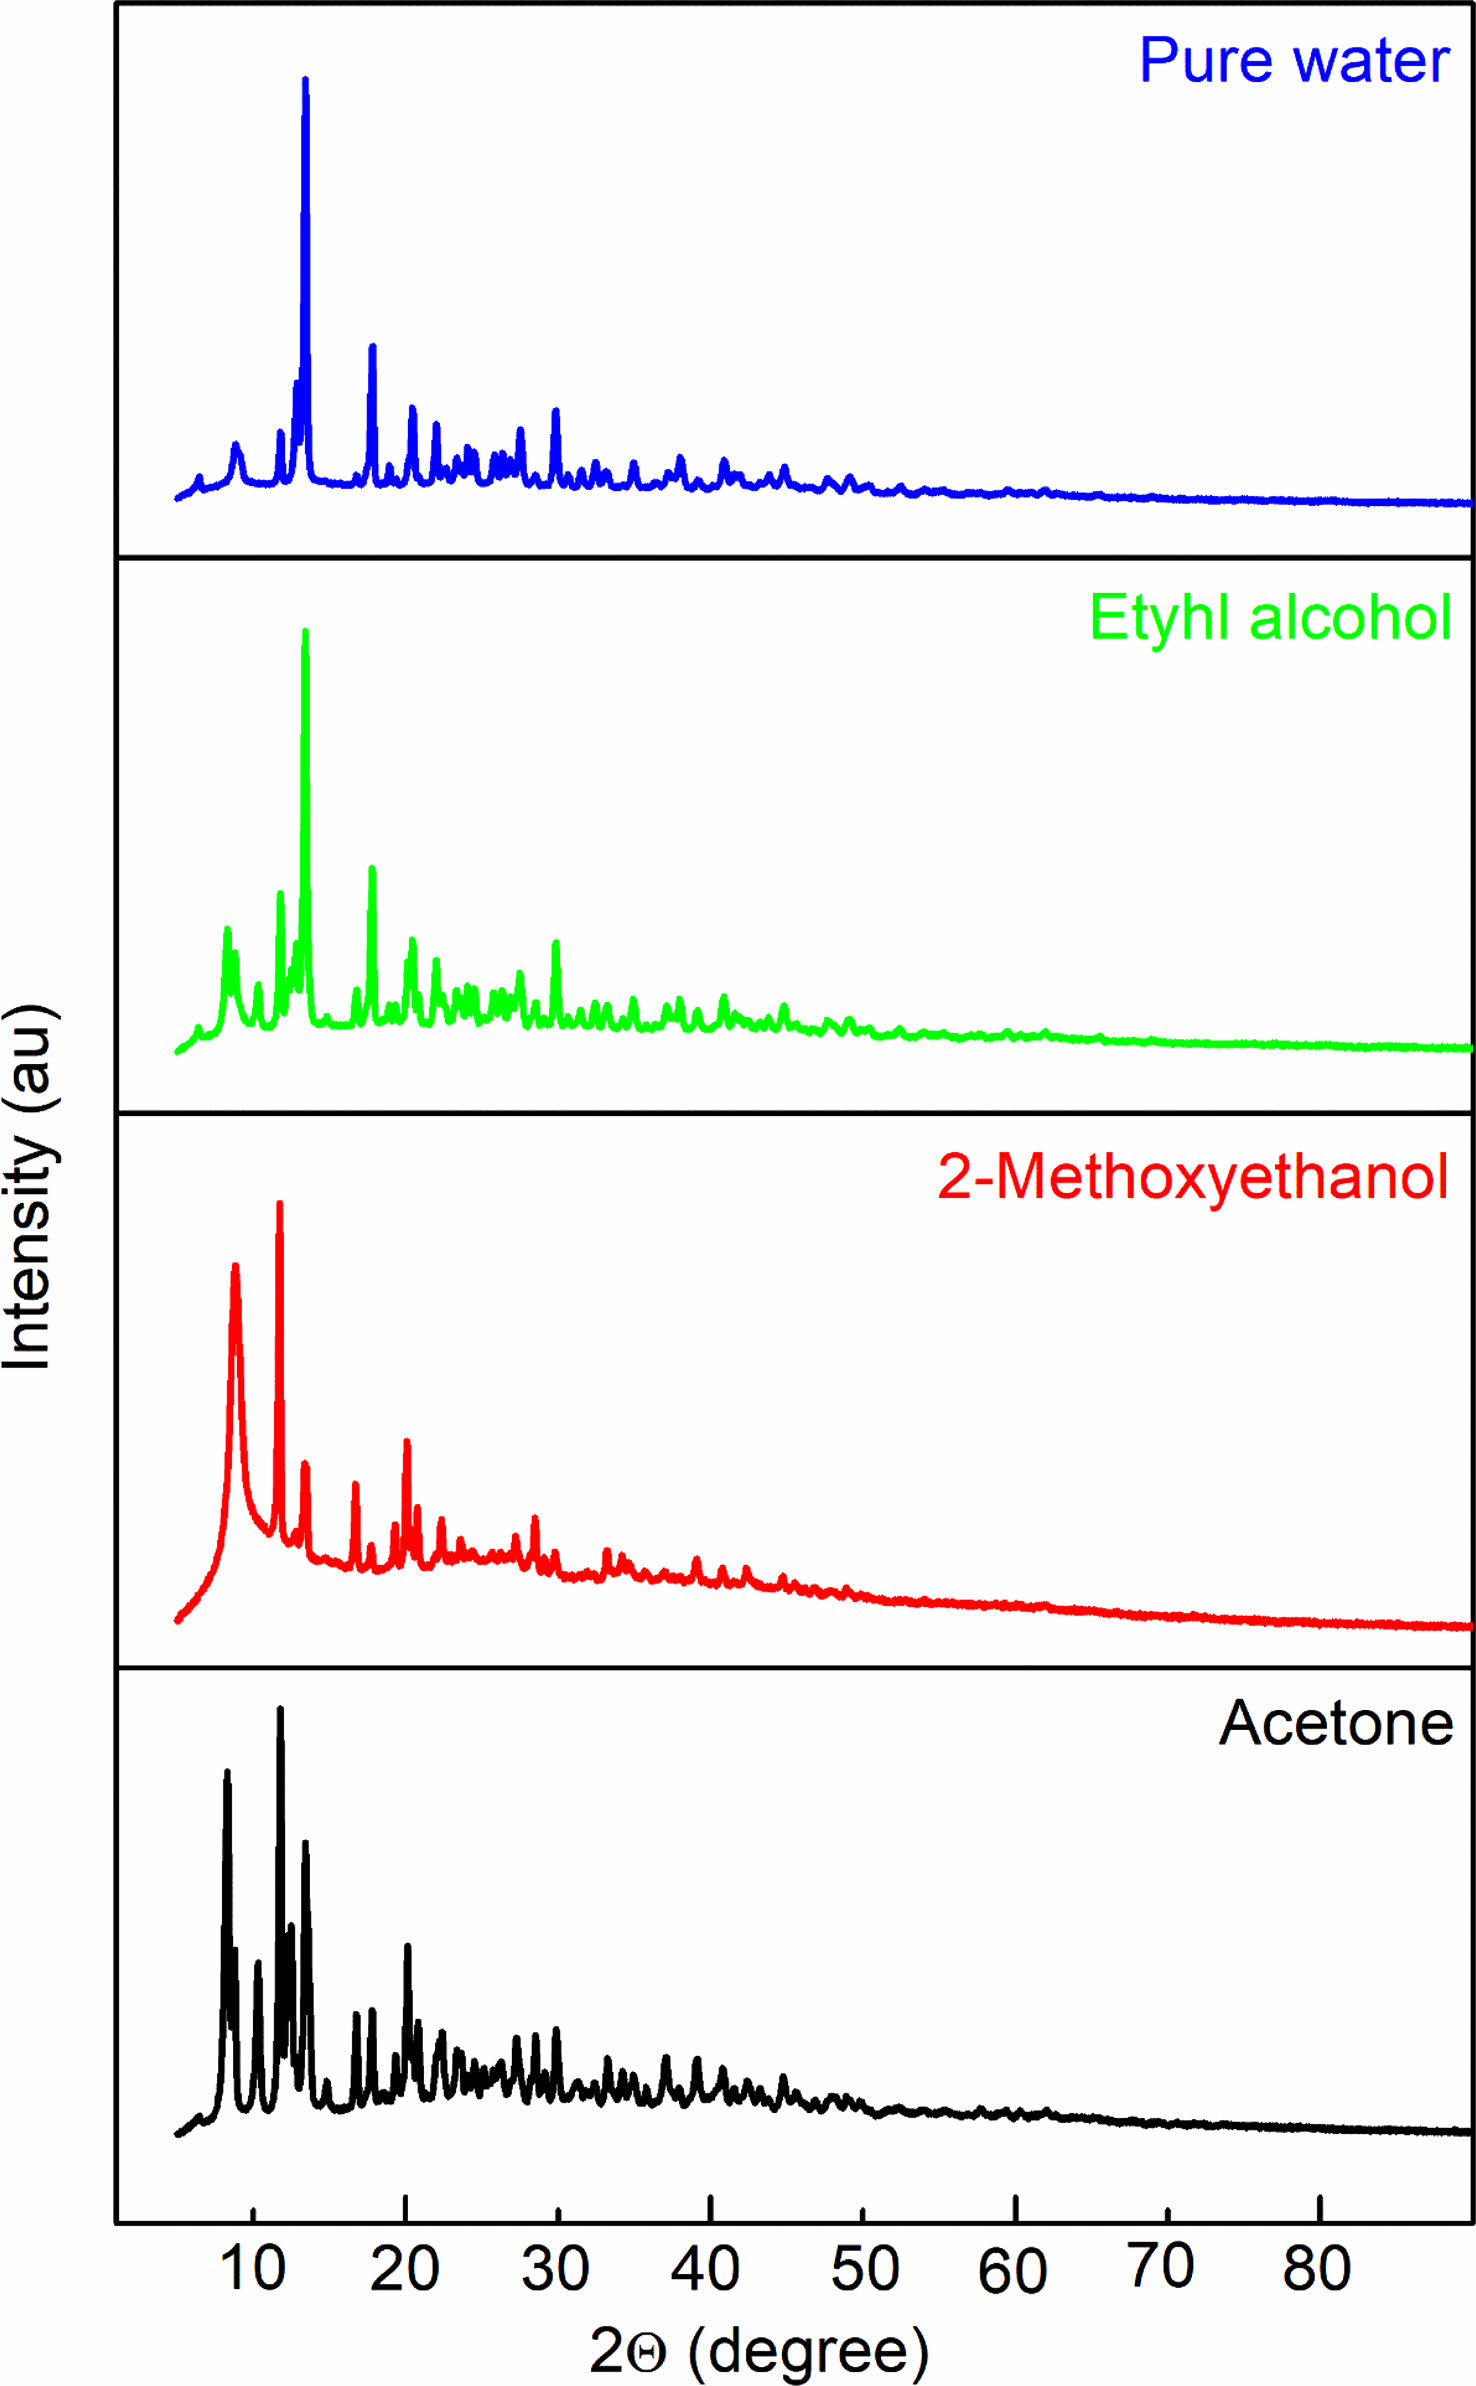
To scrutinize the structural characteristics of NiO/GO nanopowders synthesized through the sol-gel method using various solvents, XRD measurements were conducted at room temperature, and the corresponding XRD spectra are illustrated in Fig. 2. A careful examination of the diffraction spectra reveals notable differences in both peak intensities and widths among the samples. Interestingly, despite alterations in solvent composition, the crystal structure remains consistent, with only variations in peak intensities observed. The XRD spectra confirm the face-centered cubic (fcc) structure for the prepared nanostructured powders. Notably, the choice of solvent emerges as a significant factor influencing the degree of crystallinity in the materials.
Figure 2 distinctly demonstrates that the sharpness of diffraction peaks varies with changes in resolution. The narrow and sharp diffraction peaks in the XRD pattern signify the commendable crystallinity of the synthesized NiO samples [13]. However, the presence of additional peaks alongside NiO peaks indicates the existence of unreacted species. The appearance of diverse sharp peaks in samples dissolved in different solvents but sintered at the same temperature suggests the presence of defects in the crystal structure of the material. These impurities likely result from the oxidation of NiO particles or the incorporation of foreign elements into the crystal lattice during the dissolution process with different solvents.
Furthermore, the type of solvent has a discernible impact on crystallite size, as evident from the XRD graphs. In the analysis of the GO/NiO composite material, the peaks corresponding to nickel oxide were prominently observed, while the GO peak was less conspicuous. This discrepancy is attributed to the substantially smaller intensity of the GO peak compared to that of the NiO peak, aligning with findings in the literature. These XRD insights provide a comprehensive understanding of the intricate interplay between solvent choice and crystal structure, shedding light on the crystallinity and potential defects within the synthesized NiO/GO nanocomposites [14, 15].
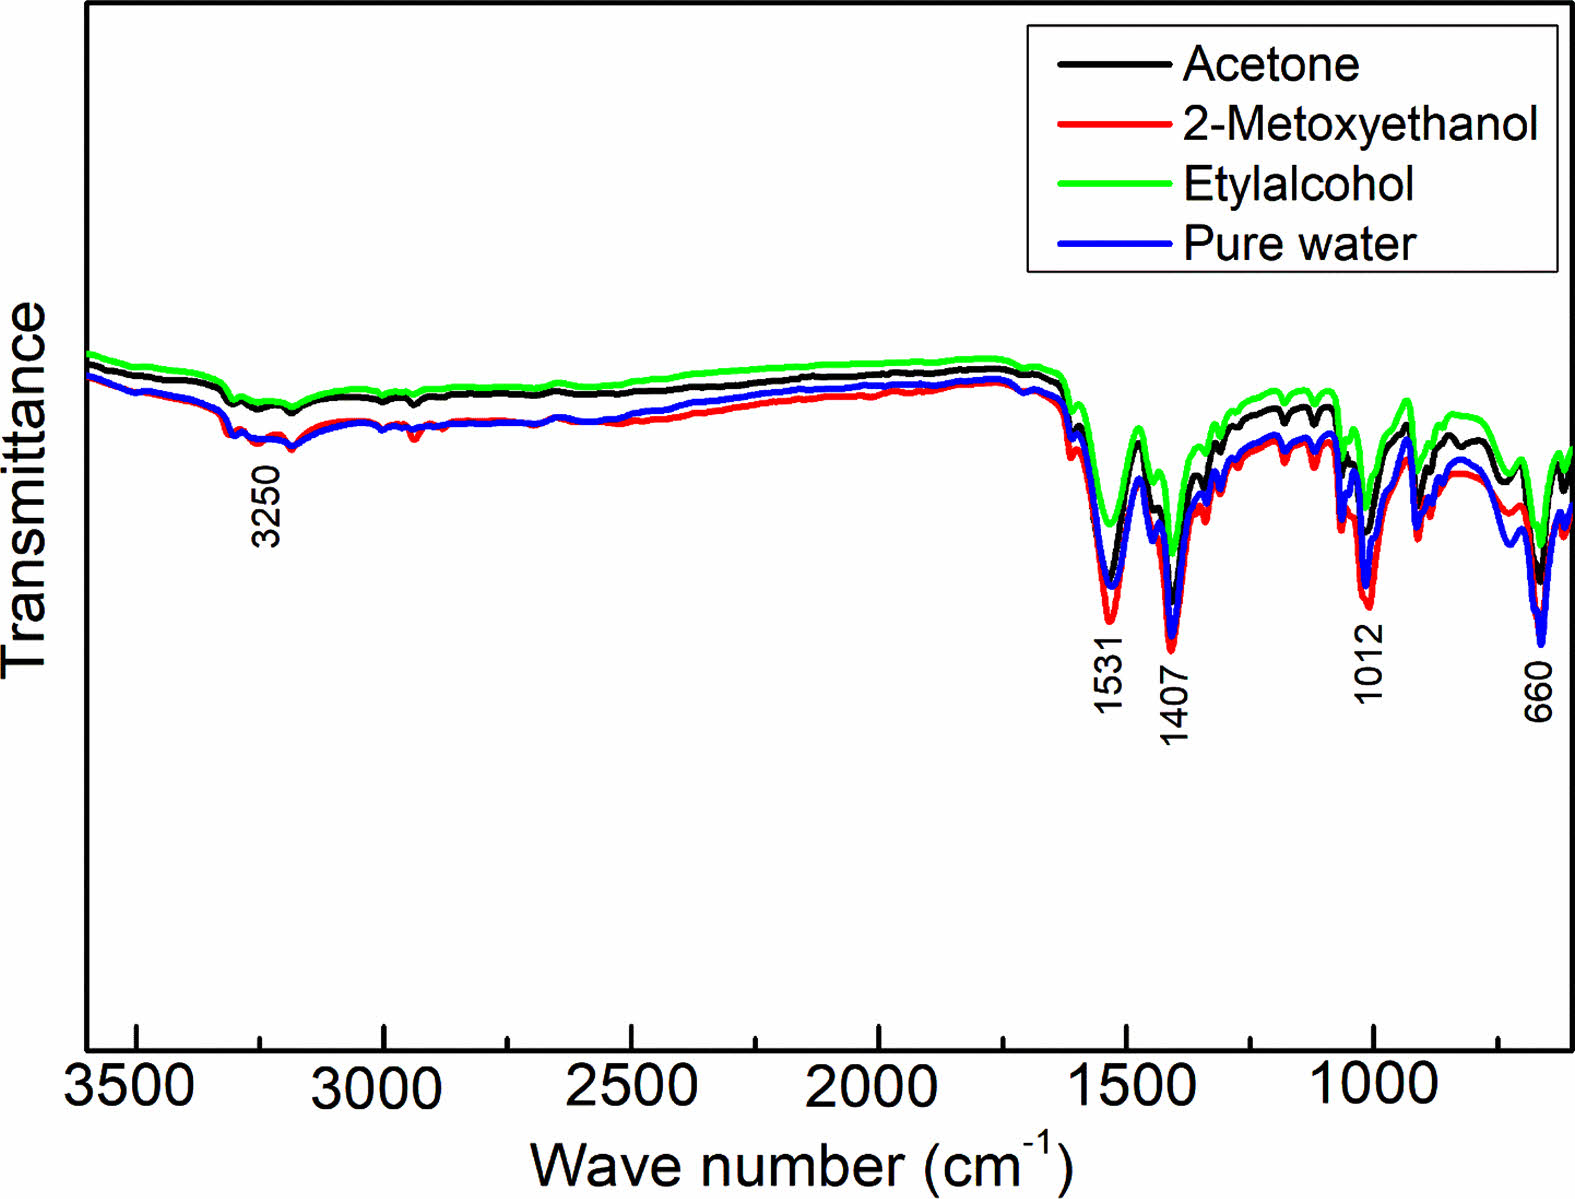
Figure 3 displays the FTIR spectra of the synthesized NiO/GO nanocomposites, offering valuable insights into the molecular composition. Within the FTIR spectrum of NiO/GO, a prominent and broad absorption peak at approximately 3250 cm-1 signifies the stretching and bending vibrations of OH groups associated with water. At 1626 cm-1, a peak emerges, attributed to the skeletal vibration of graphene layers. Additional robust peaks around 1102, 1407, and 1531 cm-1 are ascribed to the characteristic stretching vibrations of COOH groups, C-O, and C=O functionalities situated at the basal edges of GO sheets, respectively. The presence of these distinctive peaks strongly indicates the existence of various oxygen-containing functionalities on the surface of GO, confirming the successful oxidation of graphene sheets [16].
Specifically, the polar groups, notably surface hydroxyl groups, facilitate the formation of hydrogen bonds between graphite and water molecules, elucidating the inherently hydrophilic nature of graphene oxide. Moving on to the FTIR spectra of the nanocomposites, peaks at approximately 1398, 1657, and 3146 cm-1 can be attributed to the skeletal vibrations of oxygen-containing functional groups on the graphene oxide layer. Meanwhile, a peak at around 660 cm-1 corresponds to the stretching vibrations of Ni-O, affirming the presence of both GO and NiO in the synthesized nanocomposites [17].
These FTIR findings provide a comprehensive understanding of the molecular interactions and functionalities present in the NiO/GO nanocomposites, validating the successful synthesis and elucidating the distinctive vibrational characteristics associated with each component within the composite structure.
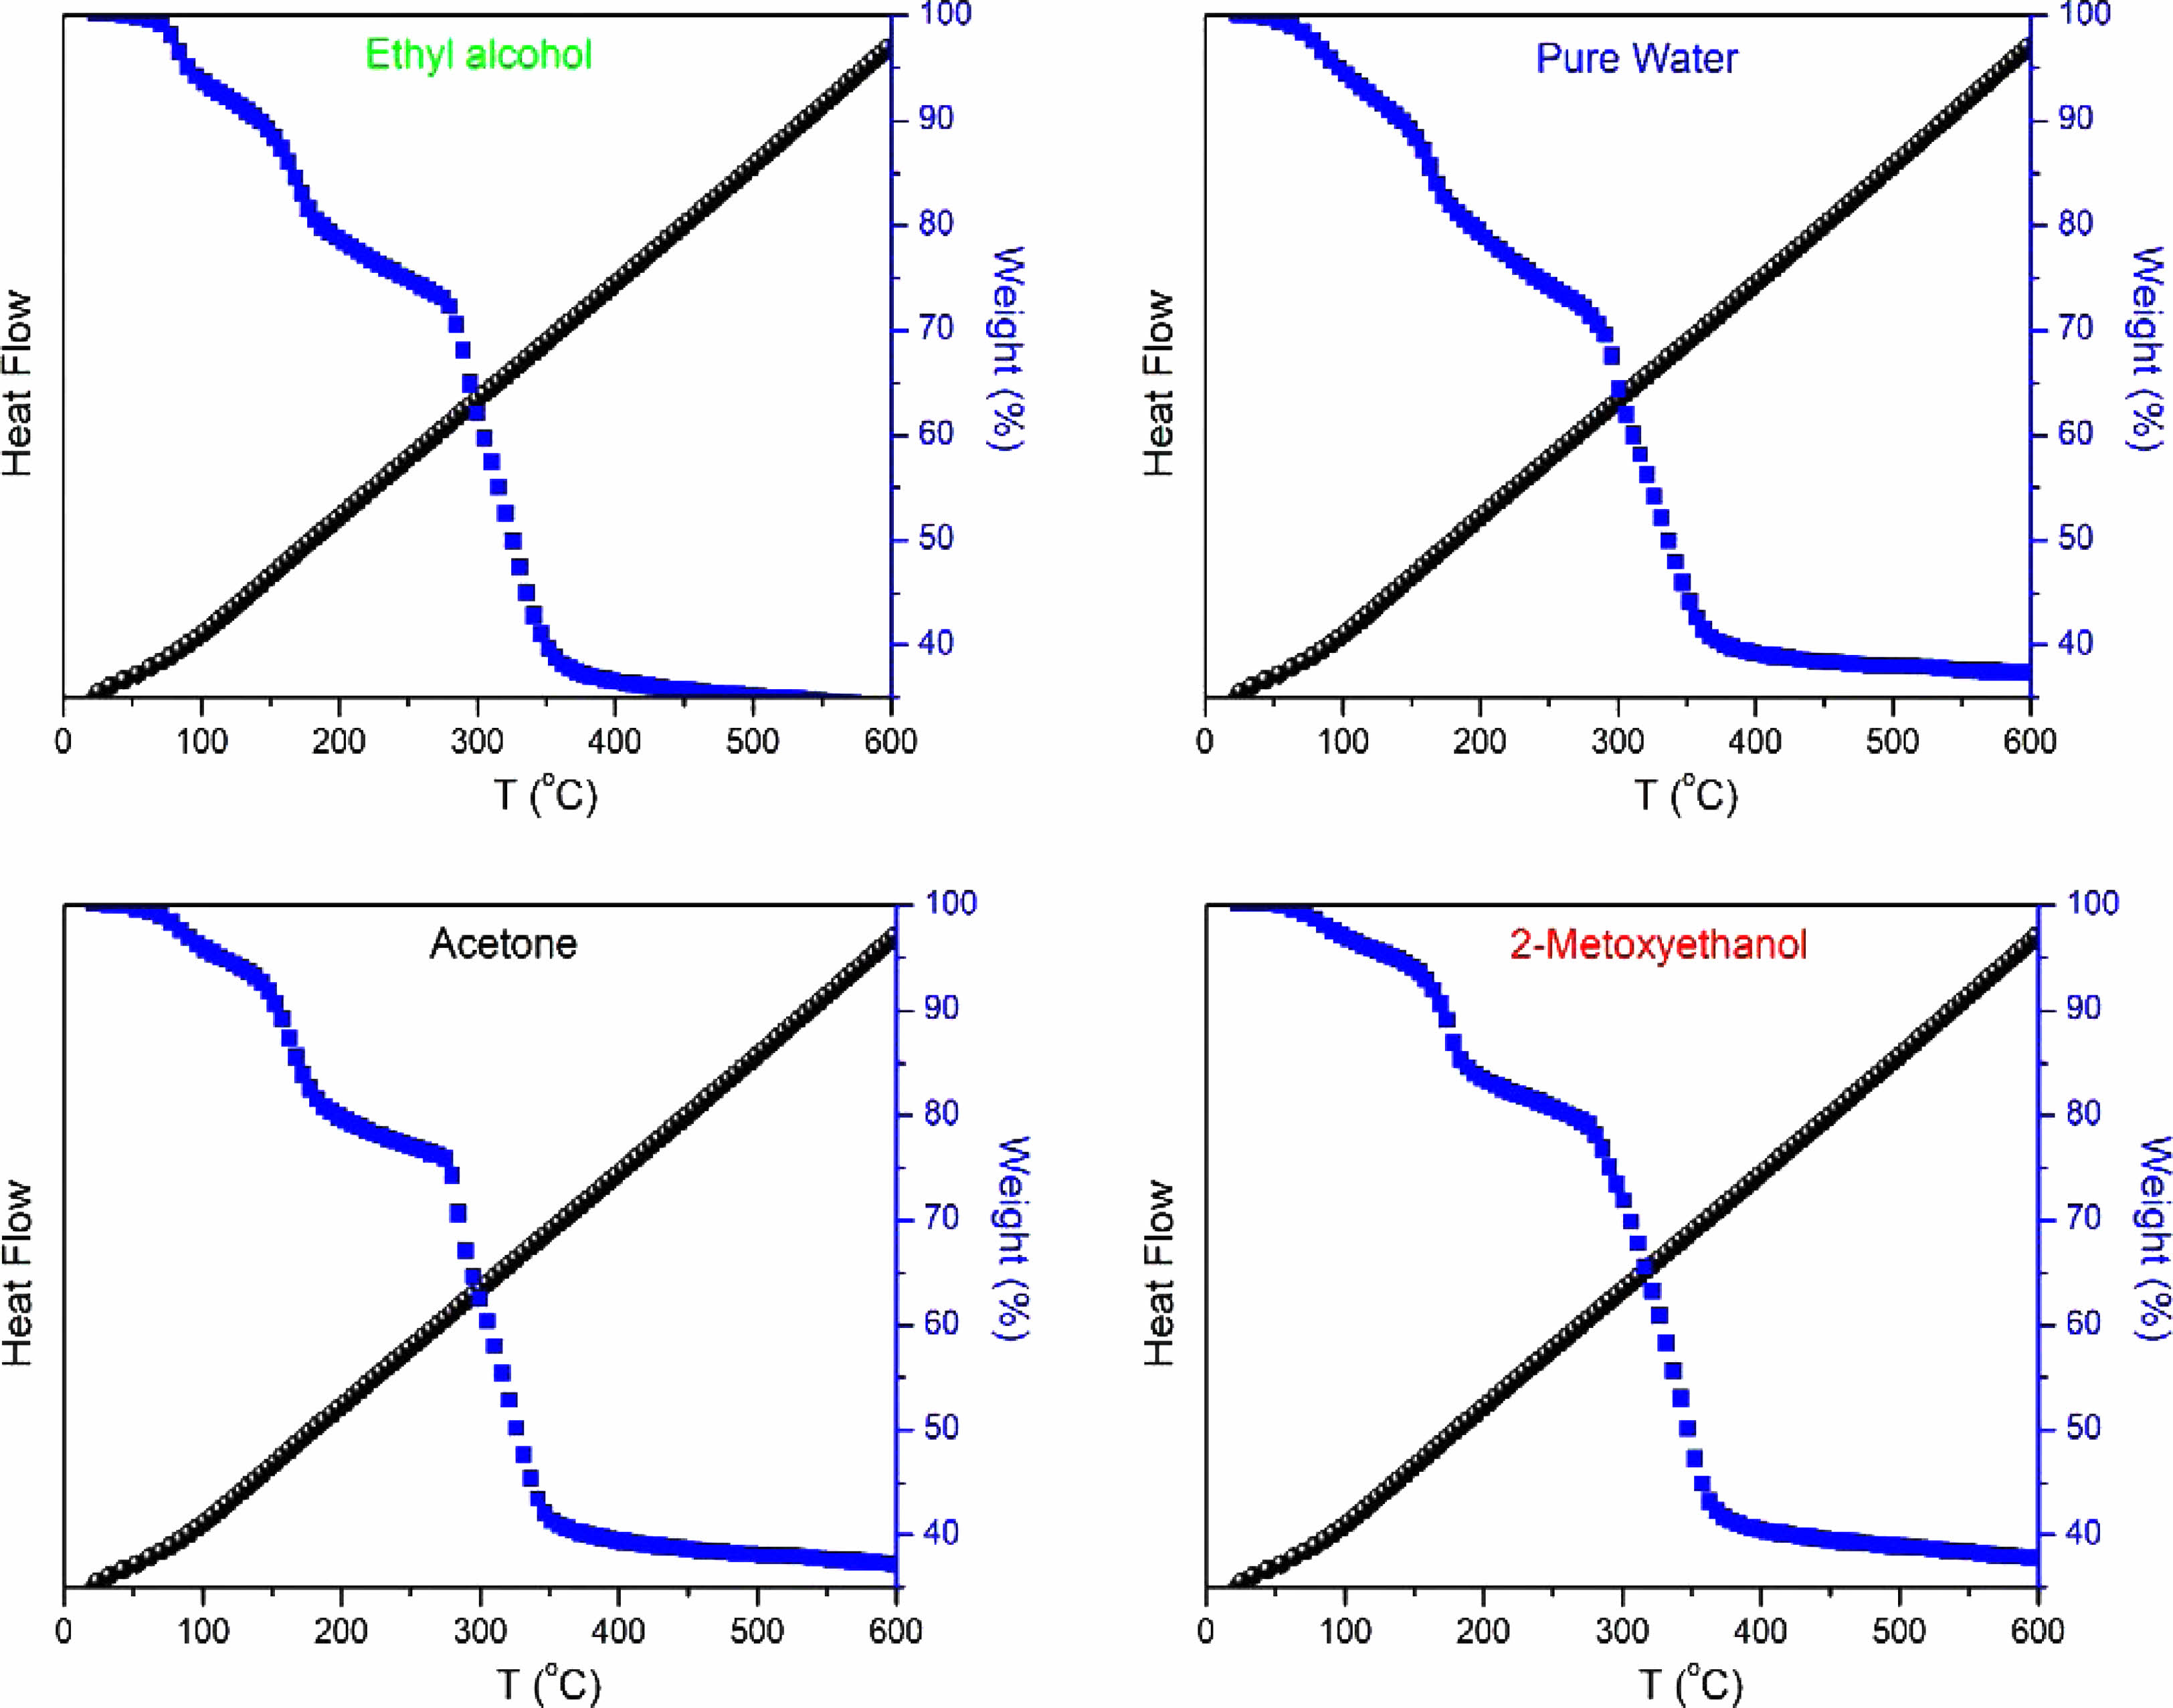
Figure 4 illustrates the TGA and DTA curves for samples containing nickel oxide, doped with graphene oxide, and dissolved in different solvents. A distinctive mass loss occurs around 250 °C, suggesting the elimination of weakly bonded water molecules and the dissociation of hydroxyl groups within the sample [18]. The gradual weight loss observed in the temperature range of 250 °C to 600 °C, accompanied by an exothermic peak, is attributed to water removal. These thermal analysis results harmonize with the insights gained from XRD analysis.
The TGA curves for all samples containing nickel oxide exhibit three notable weight losses at approximately 150 °C, 250 °C, and 350 °C. The weight loss at 250 °C coincides with a sharp DTA peak. The modest weight loss observed at 150 °C is attributed to water desorption, while the subsequent weight loss at 250 °C is linked to potential impurities or adsorbents within NiO and graphene oxide (GO). The weight loss at 350 °C is associated with the formation of defects, evident in the broad peak observed in the DTA curve for NiO and GO powder [19].
Comparative analysis of TG graphs reveals that the NiO/Ethyl Alcohol/GO sample exhibits the highest final mass loss, reaching 66.37%. Following closely are the NiO/2-Methoxyethanol/GO sample with a mass loss of 61.08%, the NiO/Acetone/GO sample with 63.25% mass loss, and the NiO/Pure Water/GO sample with 62.84% mass loss. These results provide comprehensive insights into the thermal stability and mass loss characteristics of the synthesized NiO/GO nanocomposites, emphasizing the influence of different solvents on their thermal behavior.
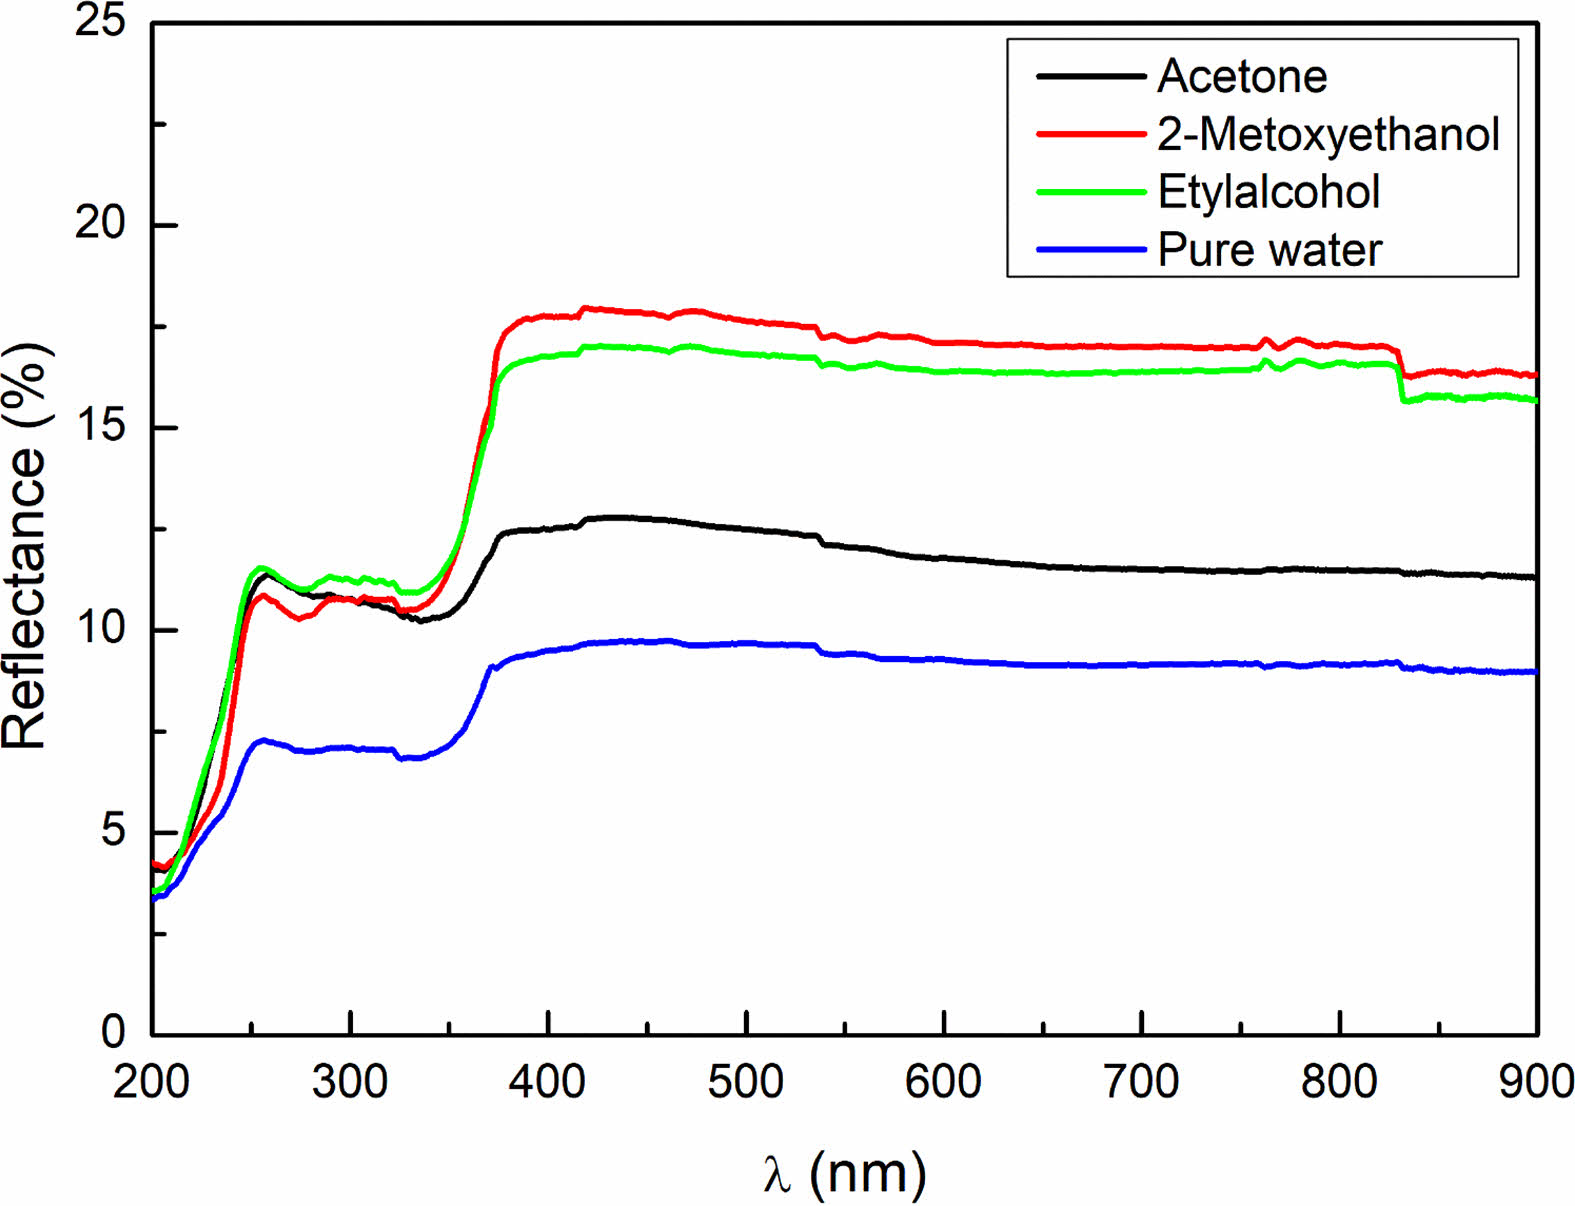
The optical characterization of NiO/GO nanocomposites, synthesized through the sol-gel method, was conducted in the 200-900 nm scanning region at room temperature. The resulting diffuse reflectance spectrum of the samples is presented in Fig. 5. Notably, the reflectance values of the samples exhibit a decrease in the visible wavelength range, followed by an increase at higher wavelengths beyond the visible region [20].
Figure 5. illustrates that the optical behavior of the NiO/GO nanocomposites is influenced by changes in crystal size, a consequence of altering the solvent during synthesis. This change in crystal size also impacts the number of grain boundaries within the nanocomposite, leading to variations in optical scattering [21]. As the number of grain boundaries changes, the optical reflection values of the samples undergo corresponding alterations due to the shifting dynamics of grain boundary scattering [22, 23].
These observations emphasize the sensitivity of the optical properties of the NiO/GO nanocomposites to solvent-induced changes in crystal size and grain boundary distribution. The optical characterization provides valuable insights into the structural features of the nanocomposites and their potential applications in optical devices.
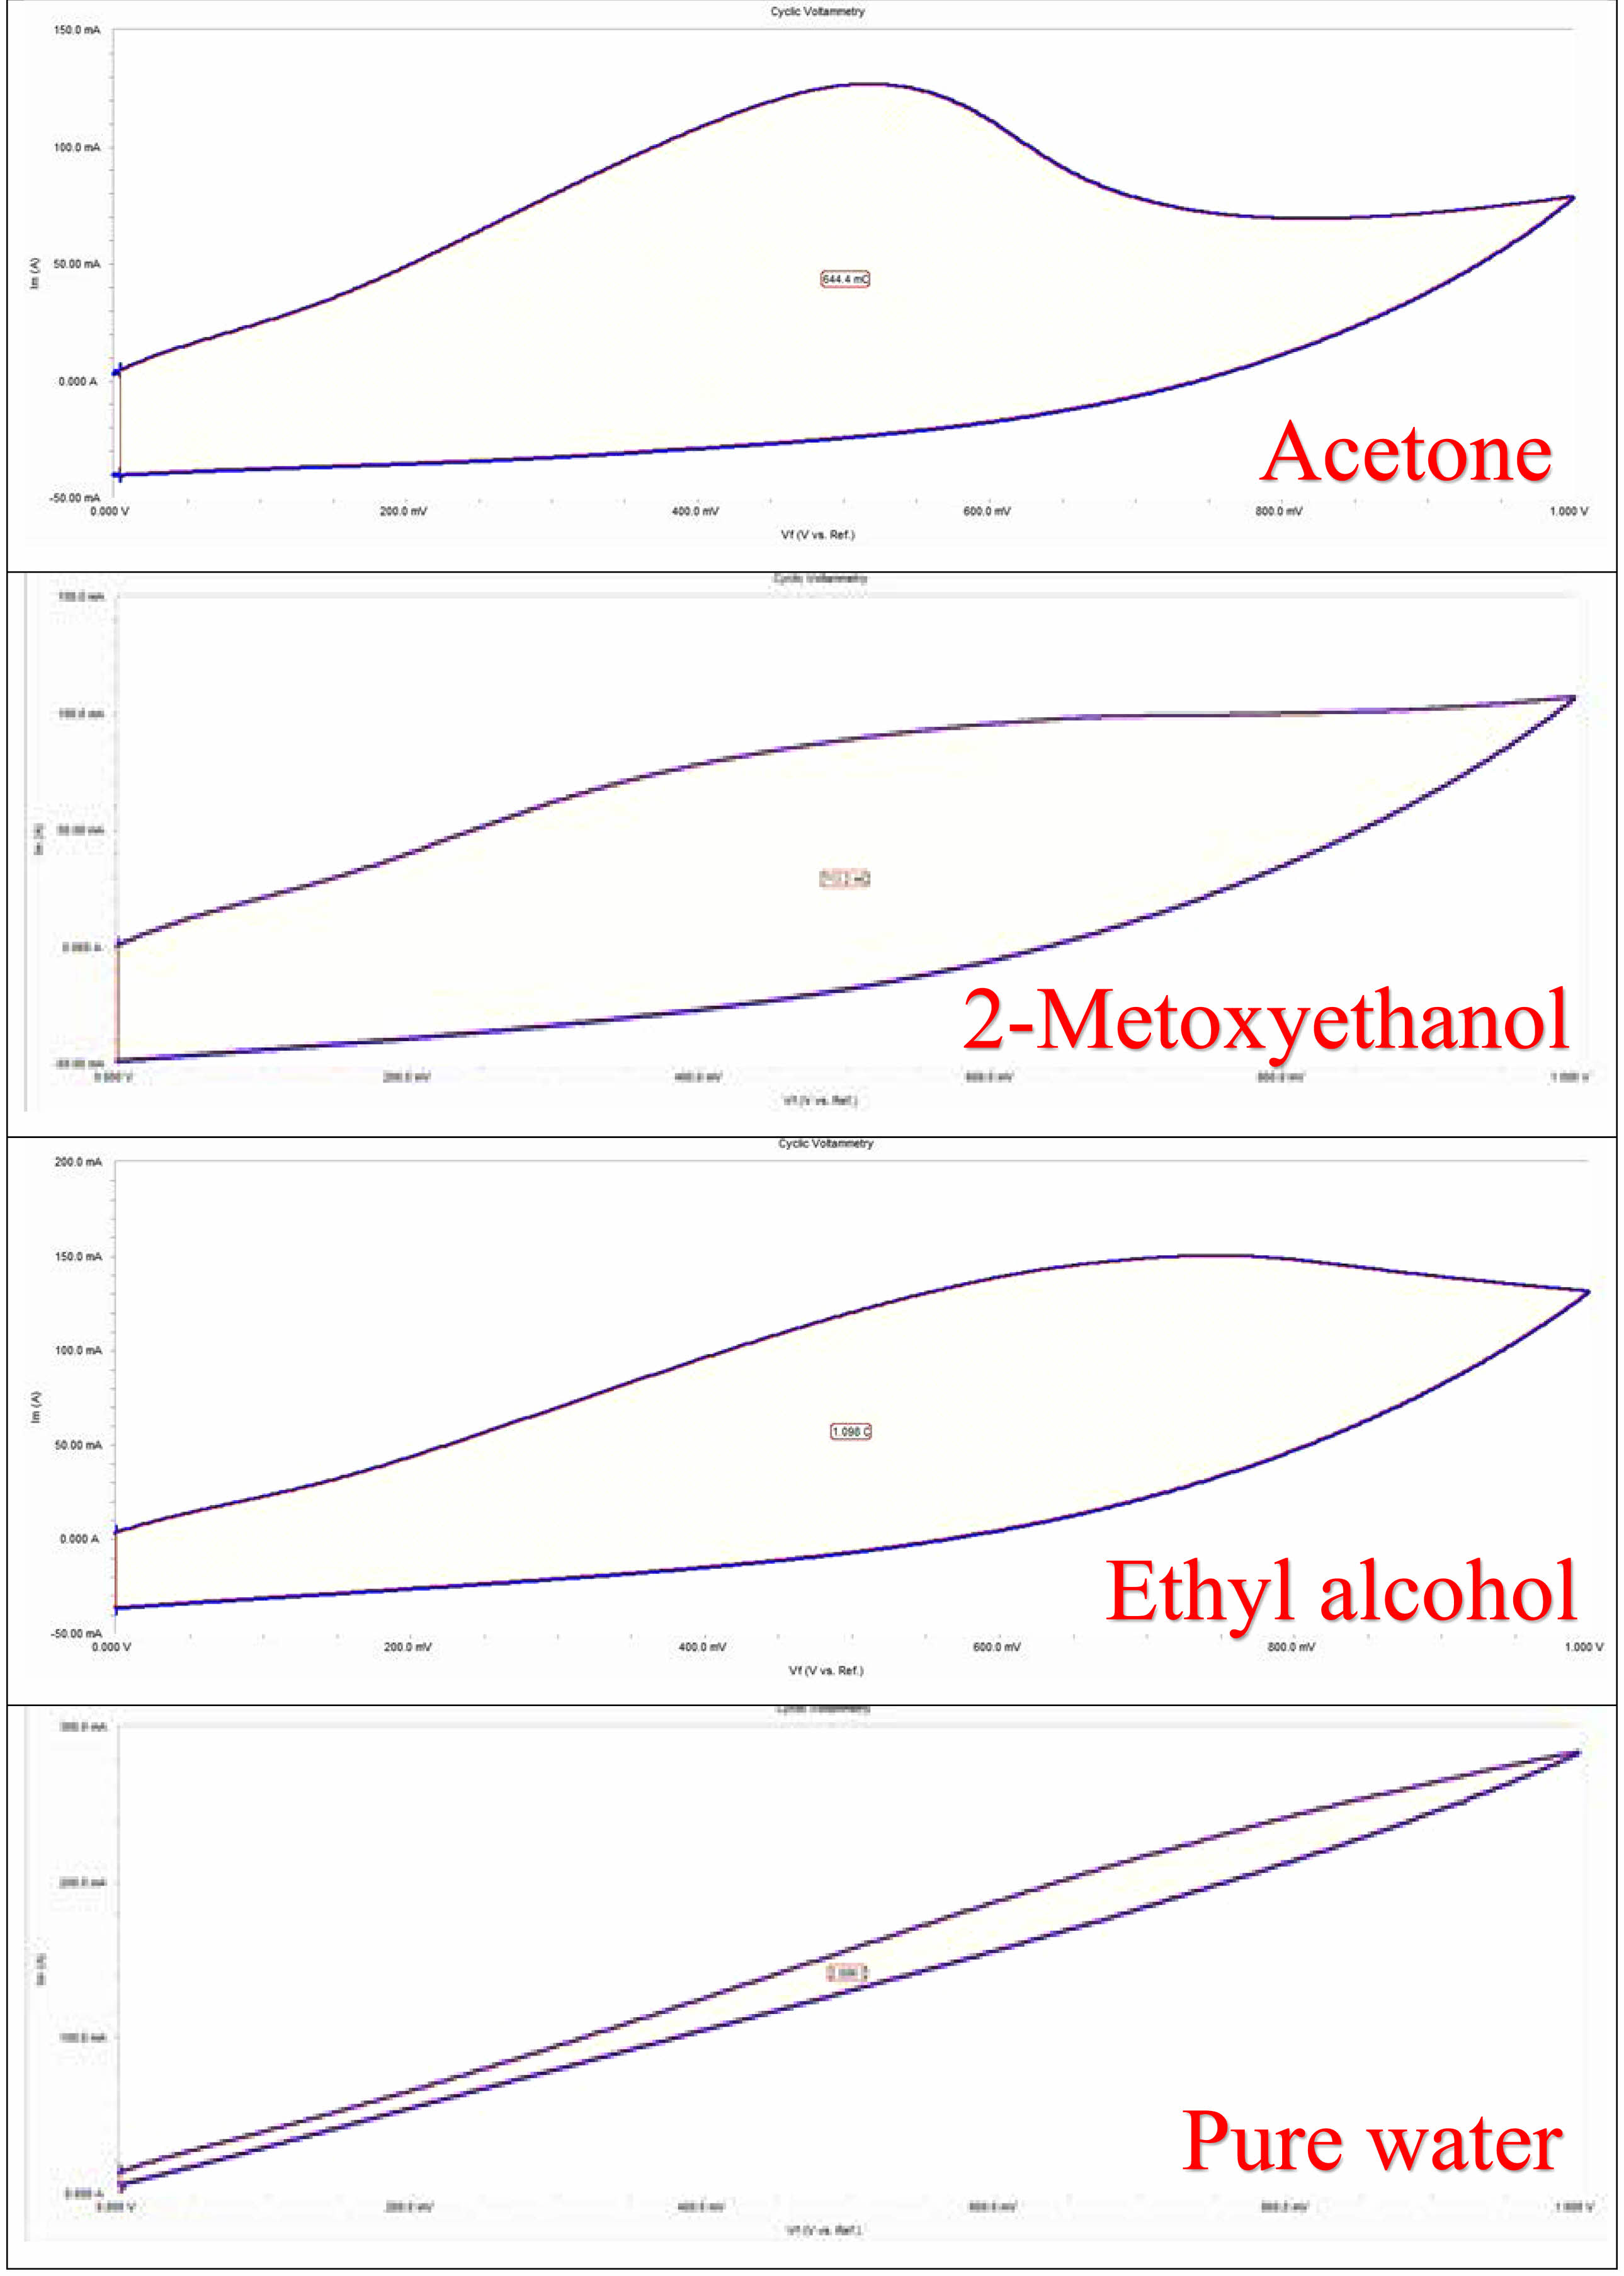
CV curves of GO/NiO nanocomposites dissolved in different solvents produced using NiO are shown in Fig. 6. CV analysis was performed at different scan speeds, from low scan speed to high scan speed. As the scanning speed increases, the current density increases [24]. It shows that at low scan rates, the charge storage and discharge phases occur quickly and reversibly, and the double layer formation on the electrode surface quickly reorganizes against potential changes. When the scanning speed increases, the voltammogram deviates from its quadrangular geometry as the interaction between ions and electrolyte increases. Electrochemical analyzes of nanocomposites were carried out in the 0 -1 V potential range. When the figures are examined, it is seen that the voltage at which the oxidation and reduction steps occur varies significantly depending on the scanning speed [25]. The curves indicate that the supercapacitor stores with both storage mechanisms. The CV of the nanocomposites showed that the composite showed excellent electro-chemical behavior as a supercapacitor electrode. The specific capacitances for the nanocomposite (calculated based on the total weight of active materials in the supercapacitor) was found as 13.59, 13.82, 23.48 and 49.54 Fg-1 for NiO/Acetone/GO, NiO/2-Methoxyethanol/GO, NiO/Ethyl Alcohol/GO, NiO/Pure Water/GO, respectively. The highest capacitance value was observed in the sample dissolved in pure water. Examining these properties of the composites shows that the specific capacitance increases due to the combined effect of EDLC and pseudo-capacitance of the composites. It is seen that the capacitance behavior between the electrode and electrolyte increases. Scanning rates increase and current density increases due to the change of anodic and cathodic current towards the reversible reaction. In these CV experiments, as the scan rate increased, the electrochemical supercapacitor properties also increased. The results obtained from CV measurements showed that the addition of graphene had a positive effect on the CV values of the materials and the capacity of the samples increased with the addition of GO.
|
Fig. 1 SEM micrographs of NiO/GO nanoelectroceramics |
|
Fig. 2 XRD patterns of GO-containing NiO electroceramics. |
|
Fig. 3 FTIR spectra of the as-prepared samples |
|
Fig. 4 DTA and TGA curves of the as-produced NiO/GO samples. |
|
Fig. 5 The diffuse reflectance as a function of the wavelength. |
|
Fig. 6 dissolved with different solvents CV plots of NiO/GO samples. |
In this study, graphene oxides (GO) with supercapacitive properties were synthesized using the Modified Hummers method. The resulting graphene oxide (GO) was then reinforced with NiO solutions, synthesized using different solvents through the sol-gel method. Upon closer examination of the SEM images, a distinct nano-sized arrangement of NiO particles emerges, strategically positioned between the layers of GO. The resulting microstructure showcases a hierarchical formation, with primary particles organized in layered configurations. The XRD spectra confirm the face-centered cubic (fcc) structure for the prepared nanostructured powders. Notably, the choice of solvent emerges as a significant factor influencing the degree of crystallinity in the materials. The presence of peaks belonging to GO and nickel oxide strongly indicates the existence of the nanocomposite structure formed. confirms the successful oxidation of graphene sheets. These thermal analysis results harmonize with the insights gained from XRD analysis. Findings from capacitance-voltage measurements underscore the impact of solvent selection on the electrochemical performance of GO/NiO supercapacitors and highlight the superior capacitance achieved with pure water as the dissolution medium.
This work was supported by the Management Unit of Scientific Research Projects of Mersin University (BAP) (Project Number: 2020-1- TP2- 4045). Authors wish to thank Mersin University BAP. This article was derived from Oktay Emre Yıldız’s master’s thesis, “Synthesis and Characterization of Graphene Oxide Based Nanosupercapacitive Materials with Different Solvents”, Mersin University Institute of Science and Technology, Department of Nanotechnology and Advanced Materials.
- 1. M.-H. Kim, J.-W. Lee, S.-M. Park, and K.C. Roh, J. Ceram. Process. Res 13 (2012) 265-269.
-

- 2. A. Sankar, S. Valli Chitra, M. Jayashree, M. Parthibavarman, and T. Amirthavarshini, Diam. Relat. Mater. 122 (2022) 108804.
-
- 3. R. Wu, Q. Jiang, H. Song, N. Li, Z. Chen, J. Xu, C. Liu, F. Jiang, X. Zhou, W. Zhou, and P. Liu, J. Electroanal. Chem. 952 (2024) 117986.
-
- 4. A.J. Haider, R. Al-Anbari, H.M. Sami, and M.J. Haider, J. Mater. Res. Technol. 8[3] (2019) 2802-2808.
-
- 5. S.-M. Bae, K.-S. Kang, C.-S. Park, and J.-H. Hwang, J. Ceram. Process. Res. 10[6] (2009) 710-715.
-
- 6. S. Sankar, S.K. Sharma, N. An, H. Lee, D.Y. Kim, Y.B. Im, Y.D. Cho, R.S. Ganesh, S. Ponnusamy, P. Raji, and L.P. Purohit, Optik 127[22] (2016) 10727-10734.
-
- 7. I.J. Mbonu, E.E. Ekereke, T.E. Gber, C. Iyen, I. Hossain, G. O. Egah, E.C. Agwamba, A. S. Adeyinka, and H. Louis, Chem. Phys. Impact 8 (2024) 100439.
-
- 8. S.-M. Sim, J. Ceram. Process. Res. 19[1] (2018) 1-4.
-
- 9. M. Lashanizadegan, F.Mousavi, and H. Mirzazadeh, J. Ceram. Process. Res. 17[6] (2016) 586-590.
-
- 10. F. Farzaneh, and S.H. Kashanie, J. Ceram. Process. Res. 14[6] (2013) 673-676.
-
- 11. Y.T. Ju, M.-Y. Cho, M.-H. Kim, J.-W. Lee, S.-M. Park, B. H. Choi, and K.C. Roh, J. Ceram. Process. Res. 13[S2] (2012) 159-162.
-
- 12. C. Aydin, J. Alloys Compd. 771 (2019) 964-972.
-
- 13. V. Rajendran, and K. Anandan, Mater. Sci. Semicond. Process. 38 (2015) 203-208.
-
- 14. Y.S. Lee, D.I. Jeong, Y. Yoon, B. Baek, H.W. Choi, S.B. Kwon, D.H. Kim, Y.J. Hong, W.K. Park, Y.H. Song, B.K. Kang, D.H. Yoon, and W.S. Yang, J. Ceram. Process. Res. 21[S1] (2020) 47-52.
-
- 15. S.H.S. Pai, A. Mondal, R. Barathy, T.B. Ajitha, J.J. Samuel, E., and Y.A.K. Reddy, Int. J. Hydrog. Energy 50[A] (2024) 928-941.
-
- 16. S.W. Hong, K.H. Kim, H.K. Jung, D. Kim, and H.W. Lee, J. Ceram. Process. Res. 13[S1] (2012) 154-157.
-
- 17. J. Ahmad, K. Majid, and M.A. Dar, Appl. Surf. Sci. 457 (2018) 417-426.
-
- 18. A. Sawaby, M.S. Selim, S.Y. Marzouk, M.A. Mostafa, and A. Hosny, Phys. B: Condens. Matter 405 (2010) 3412-3420.
-
- 19. X. Rong, F. Qiu, J. Qin , H. Zhao, J. Yan, and D. Yang, J. Ind. Eng. Chem. 26 (2015) 354-363.
-
- 20. S.L. Ko, Y. Noh, C.-W. Kim, D. Lee, C. Lee, and C. Jina, J. Ceram. Process. Res. 17[3] (2016) 213-217.
-
- 21. H. Aydin, C. Aydin, A.A. Al-Ghamdi, W.A. Farooq, and F. Yakuphanoglu, Optik 127 (2016) 1879-1883.
-
- 22. H. Aydin, F. Yakuphanoglu, and C. Aydin, J. Alloys Compd. 773 (2019) 802-811.
-
- 23. K. Anandan and V. Rajendran, Mater. Sci. Semicond. Process. 14 (2011) 43-47.
-
- 24. M. SappaniMuthu, P. Ajith, J. Agnes, M.S. Selvakumar, M. Presheth, and D.P. Anand, Mater. Today: Proc. (2023)
-
- 25. S.G. Sarwar, I.L. Ikhioya, S. Afzal, and I. Ahmad, Hybrid Advances 4 (2023) 100105.
-
 This Article
-
2024; 25(1): 131-137
Published on Feb 29, 2024
- 10.36410/jcpr.2024.25.1.131
- Received on Jan 9, 2024
- Revised on Feb 5, 2024
- Accepted on Feb 15, 2024
Services
- Abstract
introduction
materials and method
results and discussion
conclusions
- Acknowledgements
- References
- Full Text PDF
Shared
Correspondence to
- Cihat Aydin
-
Department of Airframe and Powerplant Maintenance, School of Civil Aviation, Firat University, Elazig, Türkiye
Tel : +90 424 2370000 Fax: +90 424 2555761 - E-mail: caydin@firat.edu.tr
Clean-Energy Research Institute(CRI), Hanyang University, 222, Wangsimni-ro, Seongdong-gu, Seoul, 04763, Korea
E-mail: jcpr@hanyang.ac.kr