


- Analysis of electrical behavior in LDPE/BaTiO3 ceramic filler nanocomposites for electrical cable insulation applications
N. Rajasekarana, C. Munirajb, T. Venkatesanc and A. Kumaraveld
a,cDepartment of Electrical and Electronics Engineering, K.S. Rangasamy College of Technology, Tiruchengode – 637 215, Tamil Nadu, India
bDepartment of Electrical and Electronics Engineering, Knowledge Institute of Technology, Salem – 637 504, Tamil Nadu, India
dDepartment of Mechanical Engineering, K.S. Rangasamy College of Technology, Tiruchengode – 637 215, Tamil Nadu, IndiaThis article is an open access article distributed under the terms of the Creative Commons Attribution Non-Commercial License (http://creativecommons.org/licenses/by-nc/4.0) which permits unrestricted non-commercial use, distribution, and reproduction in any medium, provided the original work is properly cited.
This paper reported about the enhancement of electrical properties for polyethylene based nanocomposites materials. Nanocomposites (LDPE + BaTiO3 ceramic) with different volume ratio of 0%, 1%, 3% and 5% were prepared by melt mixing method. Scanning Electron microscopy (SEM) results for nanocomposites materials shows that the nanofiller particle dispersed uniformly throughout the entire surface and there is no agglomeration of nanoparticles. BaTiO3 ceramic nanoparticle structure and crystallite size were investigated using X-ray diffraction (XRD) studies. Using energy-dispersive X-ray spectroscopy (EDS), the chemical composition of the composite material has been determined. EDS can have determined the types of elements present in the sample and their relative concentrations. To assess the behavior of nanocomposites, experimental test was conducted to predict the electrical parameters such as dielectric breakdown strength, DC volume resistivity, dielectric constant and Dissipation factor. The dielectric strength was estimated using a feed forward neural network (FFNN) and Artificial Neural Network and Fuzzy Inference system (ANFIS) technique under various conditions and filler percentages. From the test results, it was observed that nanocomposites with 3% wt has the highest dielectric strength. In Weibull analysis, feed forward neural network (FFNN) and Artificial Neural Network and Fuzzy Inference system (ANFIS) predicted that with the inclusion of nanofiller, the electrical breakdown strength of nanocomposite materials was increased. The results show that, dielectric permittivity and dissipation factor (tan delta) of the nanocomposites materials decreased and increased correspondingly with increase in frequency. Further increase in mixing proportion of nanocomposites, it was found that the inter particle distance is decreased due to that the mobility of charge carrier is increased and the material loses its dielectric property. From the experimental test results, it was found that LDPE/BaTiO3 ceramic filler nanocomposites materials with 3% wt have better electrical properties compared to neat LDPE.
Keywords: Polyethylene, Barium titanate ceramic filler, Nanocomposites, Weibull analysis, Dielectric property, Permittivity, Dissipation factor.
Polyethylene is frequently used as insulation materials for underground cable insulation system due to high dielectric strength and thermal conductivity. To resolve the engineering issues in underground insulation system, it is necessary that the physical and chemical properties of polymeric materials must be strengthen. However, further improvement in the polymers is achieved by adding inorganic fillers which will results in increasing the dielectric strength of the polymeric materials. Because of its many benefits, low-density polyethylene (LDPE) is frequently used as an insulating material for electrical cables. It is an excellent choice for a variety of cable applications due to its exceptional toughness, flexibility, and electrical insulating qualities. Its ability to withstand moisture, chemicals, and standard processing methods adds to LDPE’s manufacturing versatility. Its affordability combined with strong dielectric strength emphasises its appropriateness for cable insulation even more. In the past research, micro size filler (e.g micro-silica) was doped into the LDPE which results in limited success have been achieved. From the study it was concluded that the major problem arises are due to dispersion of filler creates agglomeration and interfacial distance between the fillers creates some defects like void or cavity, which reduces the actual strength of the materials In recent decades, many researcher’s focuses on a new class of dielectric materials – nanofillers based nanocomposite materials. Several studies already reported that the nanomaterials which produces non linearity in the composite materials which results in enhancing the material properties compare to neat polyethylene and conventional micro composites. Reaction theory of composite materials helps explain the dielectric behavior of BaTiO3/MgO ceramics. Addition of BaTiO3 ceramic filler decreases the dielectric constant [1]. When compared to coarser-grained material, fine-powered BaTiO3 with an average particle size of 1 µm showed lower transition energy, lower ferroelectric transition temperature (Tc), and higher dielectric constant [2]. The Microwave Synthesis BaTiO3 sample has a low loss tangent and a somewhat higher dielectric constant [3-4]. In Fe-doped BTR ceramics, tetragonal and hexagonal phases coexisted, and an improvement in dielectric permittivity was noted [5]. It was discovered that both alkaline and acidic solutions could corrode Al2O3 ceramic compositions. The life of the alumina ceramics can be predicted using the shape and scale parameters of the Weibull statistical analysis [6]. While the dielectric loss is significant in the lower frequency range, it almost completely depends on Ce content in the higher frequency range as the doping concentration rises. Due to the samples’ improved compaction, the dc resistivity decreased as the Ce doping concentration increased [7]. According to the structural characterization, the undoped sample crystallises in the pure tetragonal phase, and the addition of Li causes the tetragonal phase to change into a pseudo-cubic phase [8]. Weibull statistical analysis, and its probability distribution characteristics were investigated. For higher concentration of SiC, the heat treatment increases and scale parameter decreases [9]. The maximal electrical conductivity was demonstrated by the surface conductivities of MWCNTs and polyethylene produced using DP catalyst [10]. The phase composition and porosity levels of the ceramic composites have a significant impact on their dielectric characteristics. An increase in Si2N2O phase formation led to a decrease in the composites’ dielectric characteristics [11]. Using a vacuum evaporation technique, Ag was evaporated onto n-Si at two substrate temperatures: 200 K for a cold substrate and 300 K for a hot substrate. This caused the production of Schottky diodes [12]. Dielectric constant decreases with increase in volume ratio of BaTiO3 at 1300K temperature [13]. Nano size BaTiO3 increases the fractional interaction therefore electrical properties amplifies [14]. At higher temperature, electrical conductivity is decreased due to reduction in grain size [15]. Dielectric constant increases with increase in doping concentration of TiO2 at room temperature. Charged core boundaries are responsible for enhancement in dielectric constant [16]. Excessive NBT would result in small grain size and impurity phases, which would enhance relaxor Ferro electricity and degrade piezoelectricity, while marginally improved electrical properties would be observed [17]. Hillborg found that at low temperature and rotation velocity of the twin screw extruder which decides the dispersion of nanofillers into base matrix, there by breakdown strength of the materials gets increased. Form the study, Smaller agglomeration of the nanofillers results in higher breakdown strength and larger agglomeration of nanofillers results in low breakdown strength [18]. Kumaravel et al. studied the influence of piezo (BaTiO3 Ceramic) and magnetic constants (CoFe2O4 ceramic) on displacement, electric and magnetic potential across the thickness direction under steady state conditions [19]. Meng guo et al. conducted a study on xylene solution blending with LDPE/POS structure. Compared to pure LDPE, the POS/LDPE composites has somewhat higher dielectric permittivity was found from the results [20]. Shan LUO et al.performed a study on CB nanocomposites added with LDPE. It was noted that there is an increase in DC breakdown strength whereas dielectric permittivity and dielectric loss remains same as that of neat LDPE [21]. Youyuan wang et al. conducted a study on MgO nanofiller incorporated with LDPE. After stretching it is noticed that the breakdown strength was found to be decreased and also volume resistivity decreased except 1%wt of nanocomposite. Permittivity of all samples increases after stretching in the frequency range of 0.1-100 Hz [22]. Manoj Pradhan et al. conducted a study on Silicone rubber filled with FGM, ZnO filler, from the results it was found that there is an increase in dielectric loss and permittivity [23]. Fuquiang Tian et al. have observed that electron avalanche occurs in polymers due to large voids and cavity present in the material [24]. Ahmed Thabet Mohamed reported that LDPE/clay nanocomposites with 5% of clay mixtures have more ability to improve the dielectric strength. And also it is observed that For more than 5% of clay nanocomposites it leads to increases the accumulation of electric withstand forces there by electrical breakdown takes place [25]. Shaymaa et al. reported that the dielectric strength of SiR/TiO2 composites can be predicted using a feed forward neural network for intermediate levels of untested samples [26]. Similar to many other domains, predicting how insulating materials would react to different stress is a typical application of artificial intelligence technologies [27].
The objective of this paper is to analyse the behaviour of electrical properties of nanocomposite materials for underground electrical insulation system. From the exprimental study the following eletrical parametrs such as beakdown strength, volume resistivity, dielectric constant and dissipation factor were analysed. Also feed forward neural network (FFNN) and adaptive neuro-fuzzy inference system (ANFIS) technique is employedto anticipate the dielectric strength of untested samples at intermediate values.
Selection of base material and nanofiller materials
In the preparation of composite dielectric material, low-density polyethylene (LDPE) was selected as the polymer matrix. The LDPE (density 0.922 g/cm3 was supplied from Pandian Plastic Industries Private Limited, India. The nano size filler materials utlized in the dielectric composites was cubic Barium Titanate (size 50 nm) powder (density 6.08 g/ml at 25 °C clit). Nanofillers was imparted by sigma Aldrich, USA.
Preparation of nanocomposites
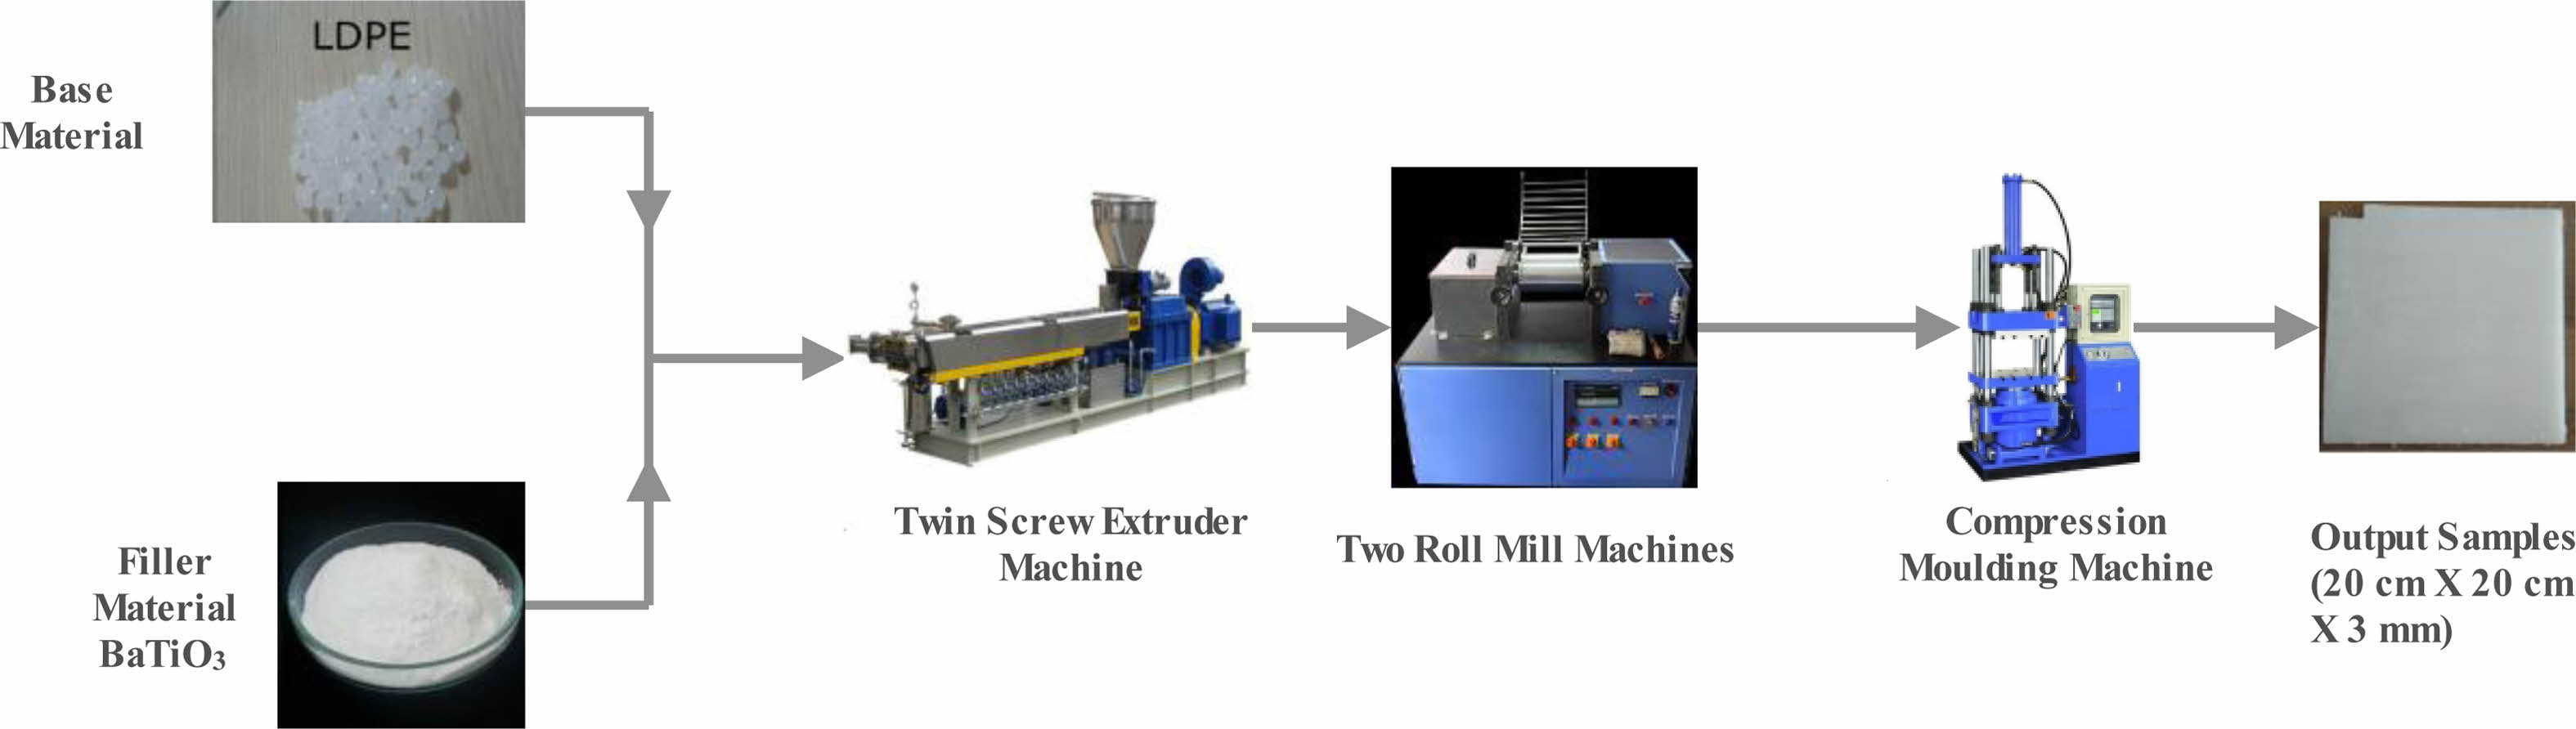
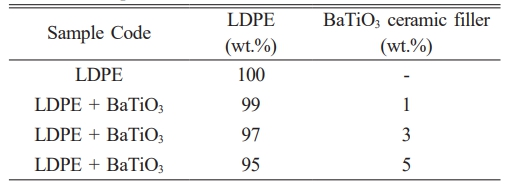
By melt blending method the nanocomposite have been prepared by mixing LDPE with BaTiO3 ceramic nano filler with a content of 0%, 1%, 3% and 5%. Table 1 shows that different mixing ratio of filler content. The next stage by using twin screw extruder, the homogenous mixture of nano BaTiO3 ceramic filler and LDPE was carried out. Pre-treat the BaTiO3 ceramic filler powder by drying it in an oven or removing any moisture or impurities. This step is important to ensure the quality of the mixture. Twin Screw Extruder, M/s.Specific Engineering Model: ZV20 is used for the mixing process. Preheat the mixing chamber to the appropriate temperature for LDPE melting. LDPE typically has a melting point around 110-120 °C (230-248°F). Start the mixing process by introducing the LDPE pellets into the preheated mixing chamber. The pellets will gradually melt and form a molten LDPE phase. Once the LDPE has melted and formed a molten phase, begin adding the BaTiO3 ceramic filler powder to the mixing chamber. The powder should be introduced gradually to ensure proper dispersion and avoid agglomeration. Continuously mix the molten LDPE and BaTiO3 ceramic filler powder using the mixing mechanism of the extruder or mixer. The screws in the twin-screw extruder, help in dispersing the powder and promoting mixing. Now the mixture is allowed to cool in a clean surface. Maintain the mixing temperature and mixing speed for a sufficient duration to ensure thorough dispersion and distribution of the BaTiO3 ceramic filler particles within the LDPE matrix. Simultaneously Two roll mill (M/s. Neopast Engineering Pvt. Ltd, model TRM 155/350 tm) and compression moulding (M/s. Neopast Engineering Pvt. Ltd max capacity 30 ton/150 bar) were carried out in a curing process at temperature of 125°C with a constant pressure of 164 bar for a duration of half an hour. Now a plate with size of 20 × 20 cm with thickness of 3 mm are obtained. For testing purpose the prepared samples were cut according to ASTM standards. Fig. 1 shows the preparation method of nanocomposite material.
|
Fig. 1 Preparation of nanocomposite. |
Scanning Electron Microscopy (SEM)
Morphology of the LDPE nanocomposites was characterized by scanning electron microscopy (SEM, Hitanchi S4700). The samples were immersed in fluid nitrogen prior to inspection their cross segments were faltered with gold in a vacuum.
X-ray diffraction (XRD)
Grazing incidence x-ray diffraction is used to assess thin crystalline films (20-200 nm depending on mean atomic number) on polished, flat surfaces in order to investigate the effects of nano-BaTiO3 ceramic filler on the LDPE crystalline morphology. Dealing with many films is doable to a certain extent. When testing nano-BaTiO3 ceramic filler, pure LDPE, and nano-BaTiO3 ceramic filler/LDPE composite materials with various concentrations, two-dimensional scans to view the diffraction patterns in two-dimensional texture analysis are used for metallic samples.
Test condition: Continuous spectrum scanning, Cr target radiation (λ=1.54 Å), tube voltage is 25KV, current is 30 mA, scanning range is 17°-130°.
Energy dispersive X-ray spectroscopy (EDS)
In this method, an electron beam strikes the test sample’s surface. The beam’s energy is normally in the range of 10 to 20 keV, which causes the sample to release X-rays. The test sample mostly determines the energy of the X-rays that are released. Images of each element are obtained when the electron beam traverses the sample.
Characterization technique
SEM analysis
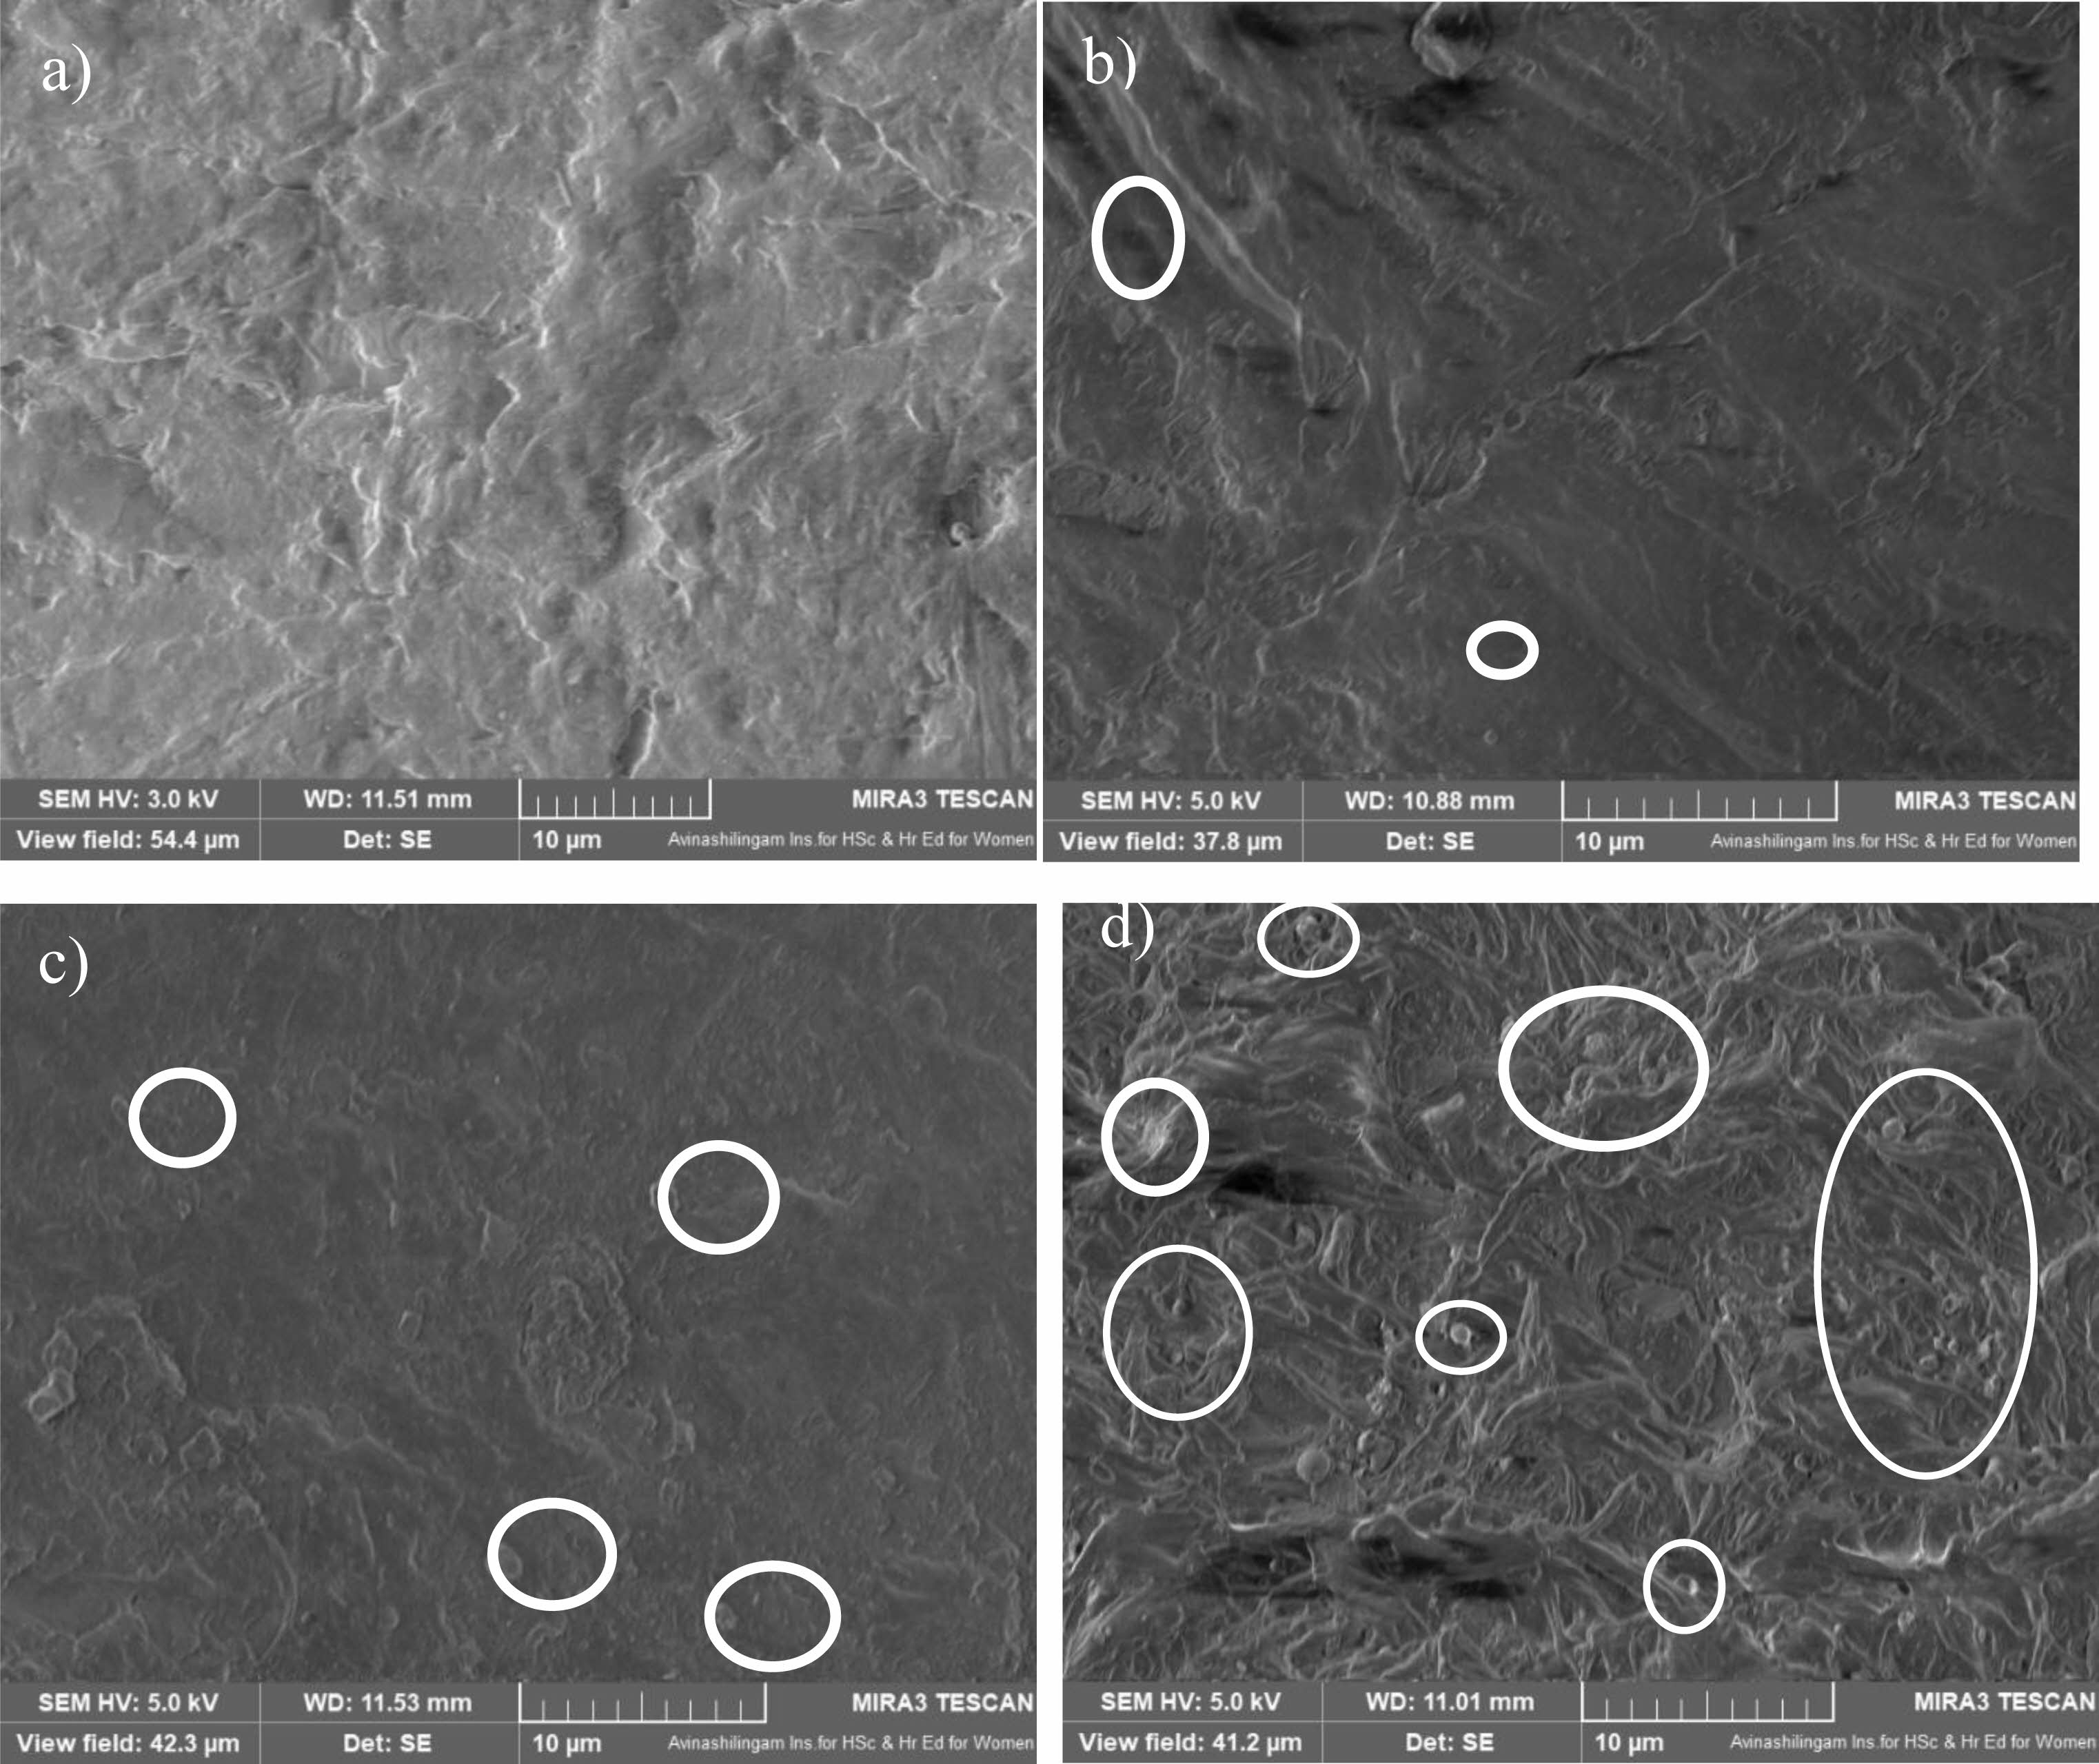
SEM images of LDPE/BaTiO3 ceramic filler nanocomposites shown in Fig. 2. The BaTiO3 ceramic filler nanoparticles are equally dispersed in LDPE. The size of the particles are about 50 nm. There will be no agglomeration were found in the below images.
BaTiO3 nanoparticles with size of 50 nm was commercially purchased from sigma Aldrich, USA and which is used as a ceramic filler in LDPE. Thus, the BaTiO3 nanoparticles are randomly distributed with slight agglomeration in LDPE sheet as shown in SEM image. The agglomeration of nanoparticles are due to its large surface area with active surface forces (e.g., van der Waals forces, electrostatic forces) which play a significant role in their stability. As can be noticed in Fig. 2, the BaTiO3 ceramic filler nanoparticles were spread in a gradient across the LDPE matrix. In addition, there are no clear interactions between the adjacent levels. The excellent melting characteristics created the continuing interface. Figure 2 represents SEM images of a BaTiO3-loaded LDPE nanocomposite sheet. Four different samples were prepared: 0%, 1%, 3%, and 5% BaTiO3 loaded with LDPE. Fig. 2a. Pure LDPE with no filler component. Fig. 2b. LDPE with a 1% BaTiO3 filler component. At low loading conditions, the BaTiO3 ceramic filler material appeared relatively uniform and undisturbed. Fig. 2c. LDPE with a 3% BaTiO3 filler component. At moderate loading conditions, the increased BaTiO3 ceramic filler material may start to reveal deformation features. This could include the beginning of plastic deformation or the reorientation of fibers or grains. At moderate filler loading, the observation showed better integration between the filler and matrix phases. Fig. 2d. LDPE with a 5% BaTiO3 filler component. Higher filler loading might result in agglomeration or clustering of filler particles. This would affect the mechanical and thermal properties of the composite. SEM images may show regions where multiple filler particles have clustered together. As the loading increases, there is a higher concentration of filler particles across the surface.
X-ray diffraction
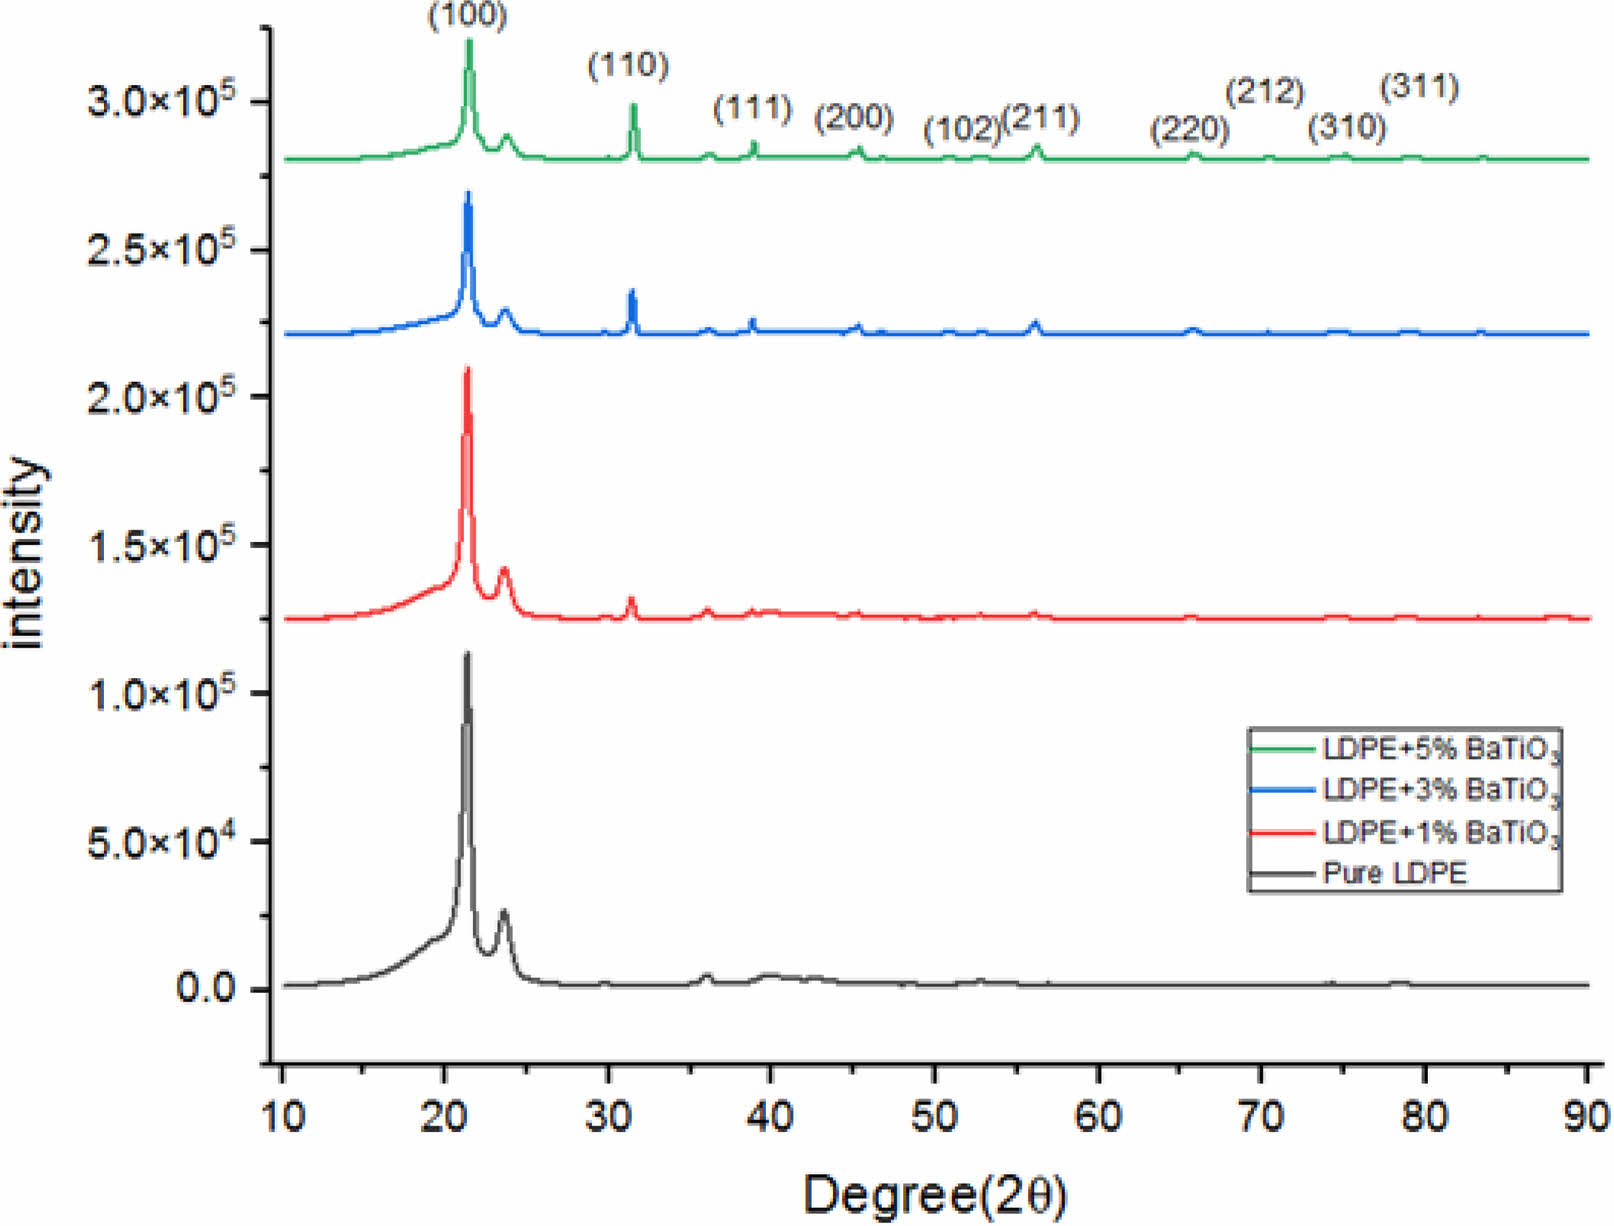
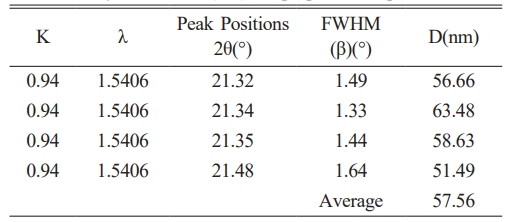
Pure LDPE and various concentrations of a composite material made of nano BaTiO3 ceramic filler/LDPE were subjected to XRD diffraction testing. Fig. 3 shows the measurement’s result. BaTiO3 peaks (2θ) shown in Table 2 and the calculated crystalline size is shown in Table 3.
Pure LDPE will become more crystalline after being combined with nano-BaTiO3 ceramic filler. because LDPE can crystallize in either one of two ways: homogeneous nucleation or heterogeneous nucleation. Inorganic particles act as nucleating agents and cause an increase in the heterogeneous nucleation of LDPE when nano-BaTiO3 ceramic filler is added to it. Table 2 confirm the formation of perovskite barium titanate.
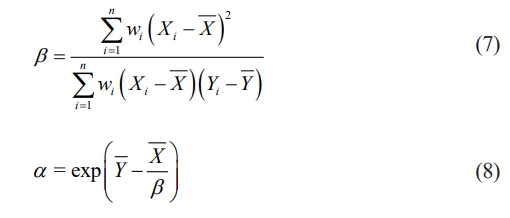
Scherrer equation
D is the crystallite size (nm)
K Scherrer constant, 0.68 to 2.08, 0.94 for spherical crystallite with cubic symmetry
λ is the wavelength constant
Full width at half maximum (FWHM) of peaks (β) in radian located at any 2θ in the pattern.
By applying Debye Scherer’s eq. (1) and broadening of the intensity peak, it was determined that the minimum average crystallite size of LDPE with nano BaTiO3 ceramic filler thin film was 57 nm shown in Table 3.
The diffraction angle of the nano-BaTiO3 ceramic filler/LDPE composite material is larger and increases compared with pure LDPE. This phenomenon happens as a result of the crystallization peak shifting to a narrow angle due to the nanoparticles’ small crystal size in the nanocomposite material. Some nanoparticles bind together when the concentration of nanoparticles rises to raise the mean size of the nano composite material in the crystal. And as a result, a sharp angle is created at the pinnacle of crystallization.
Energy-Dispersive X-ray Spectroscopy (EDS)
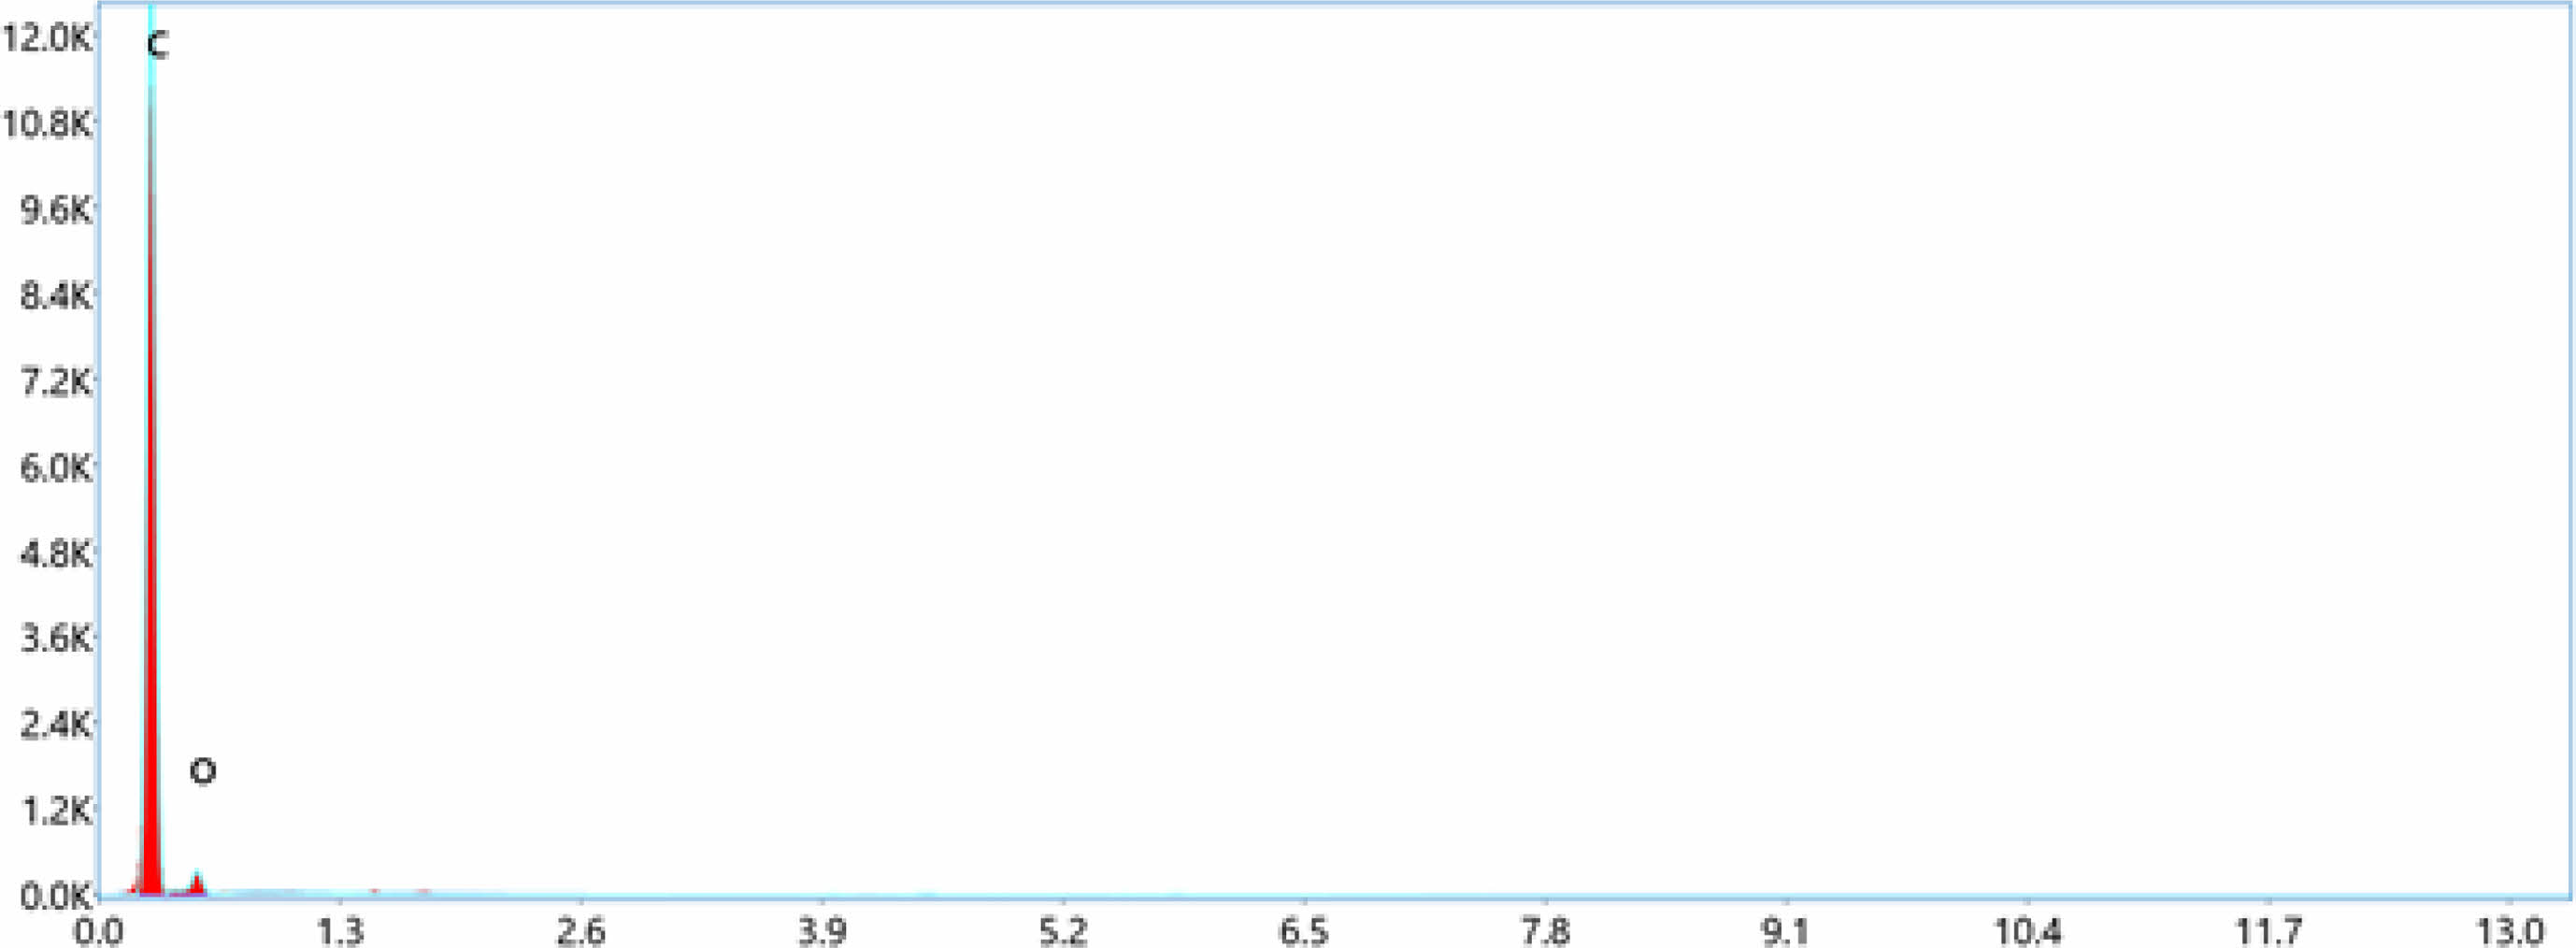
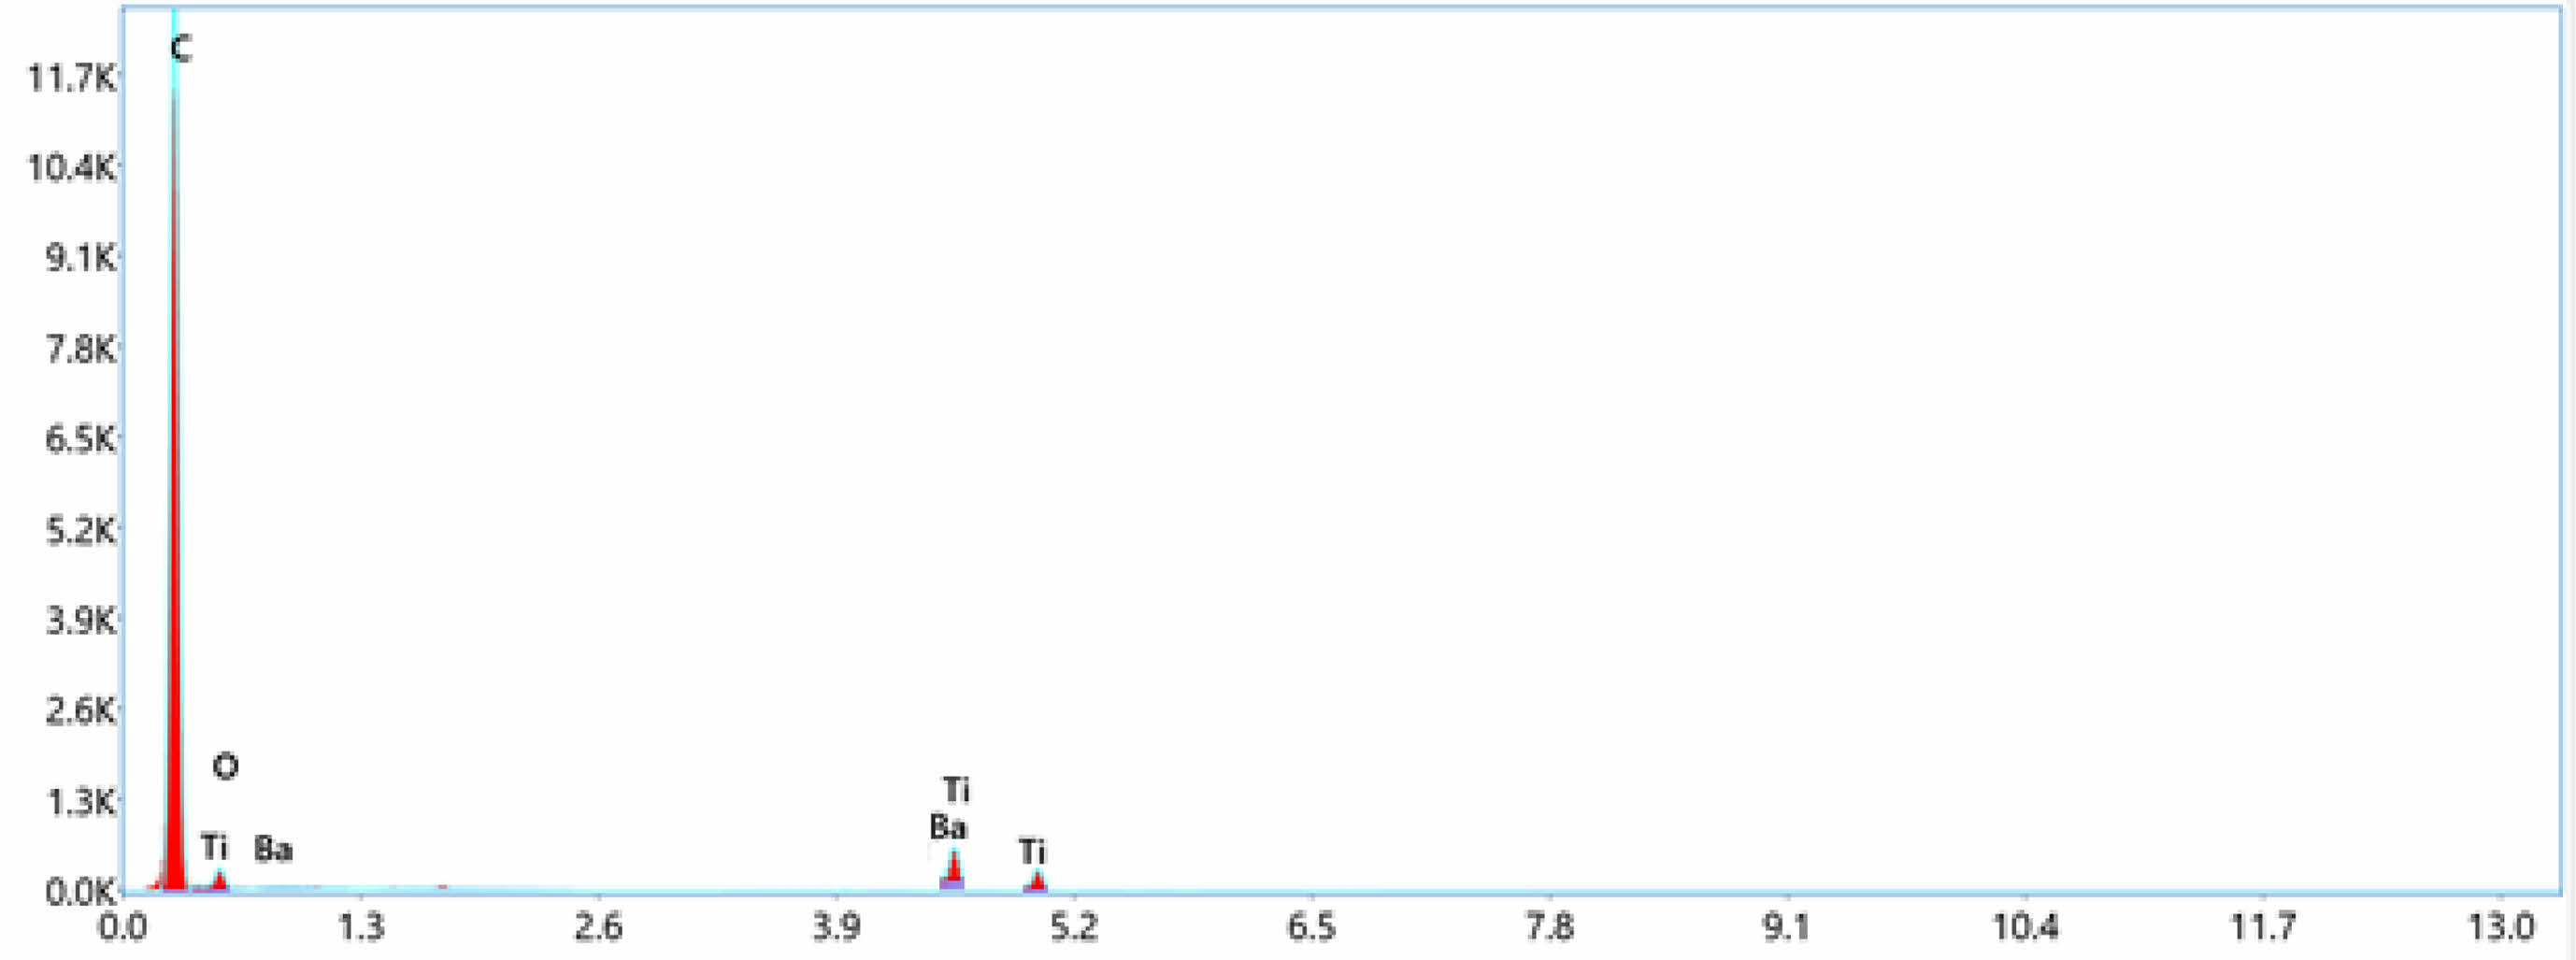
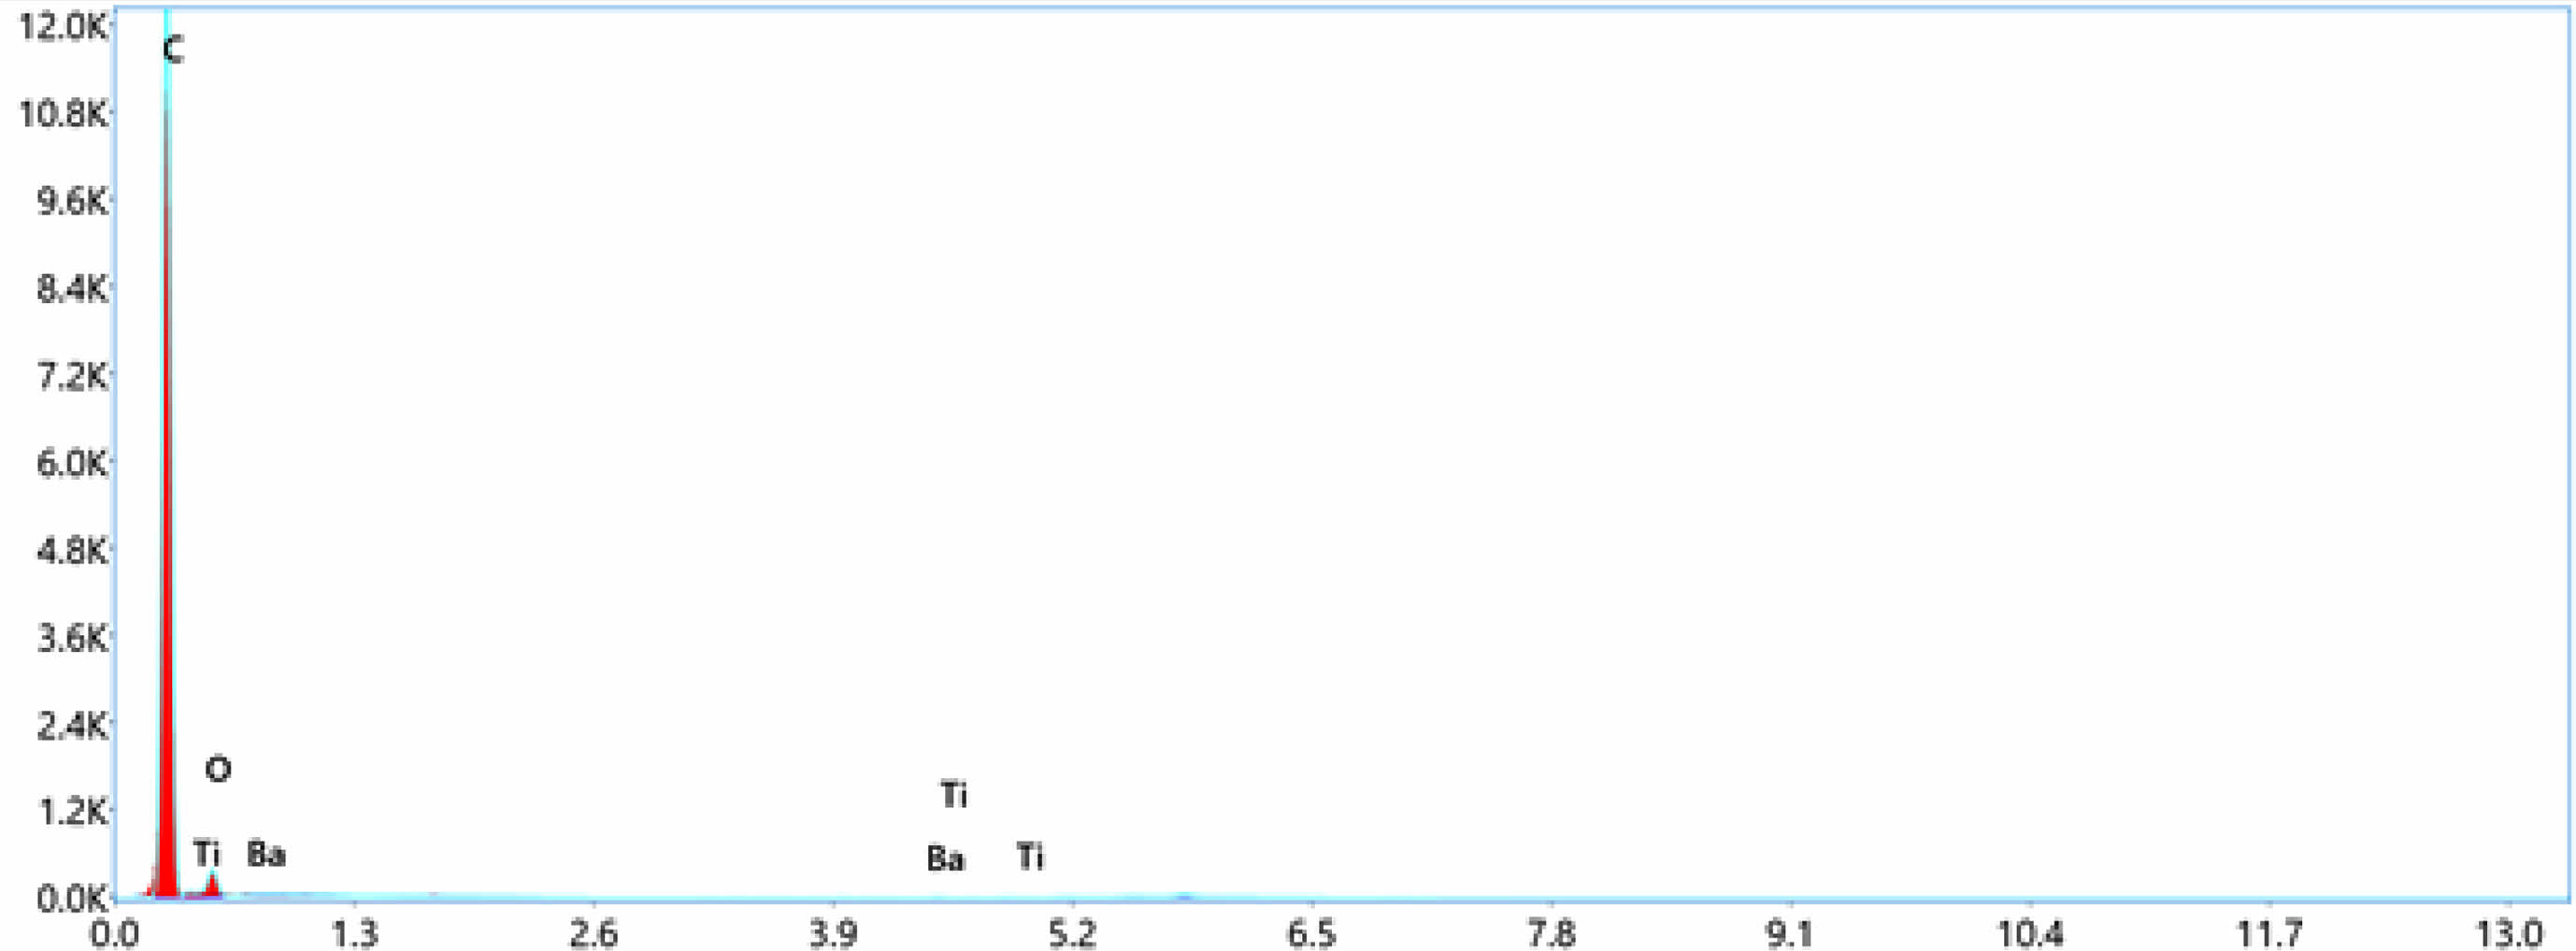
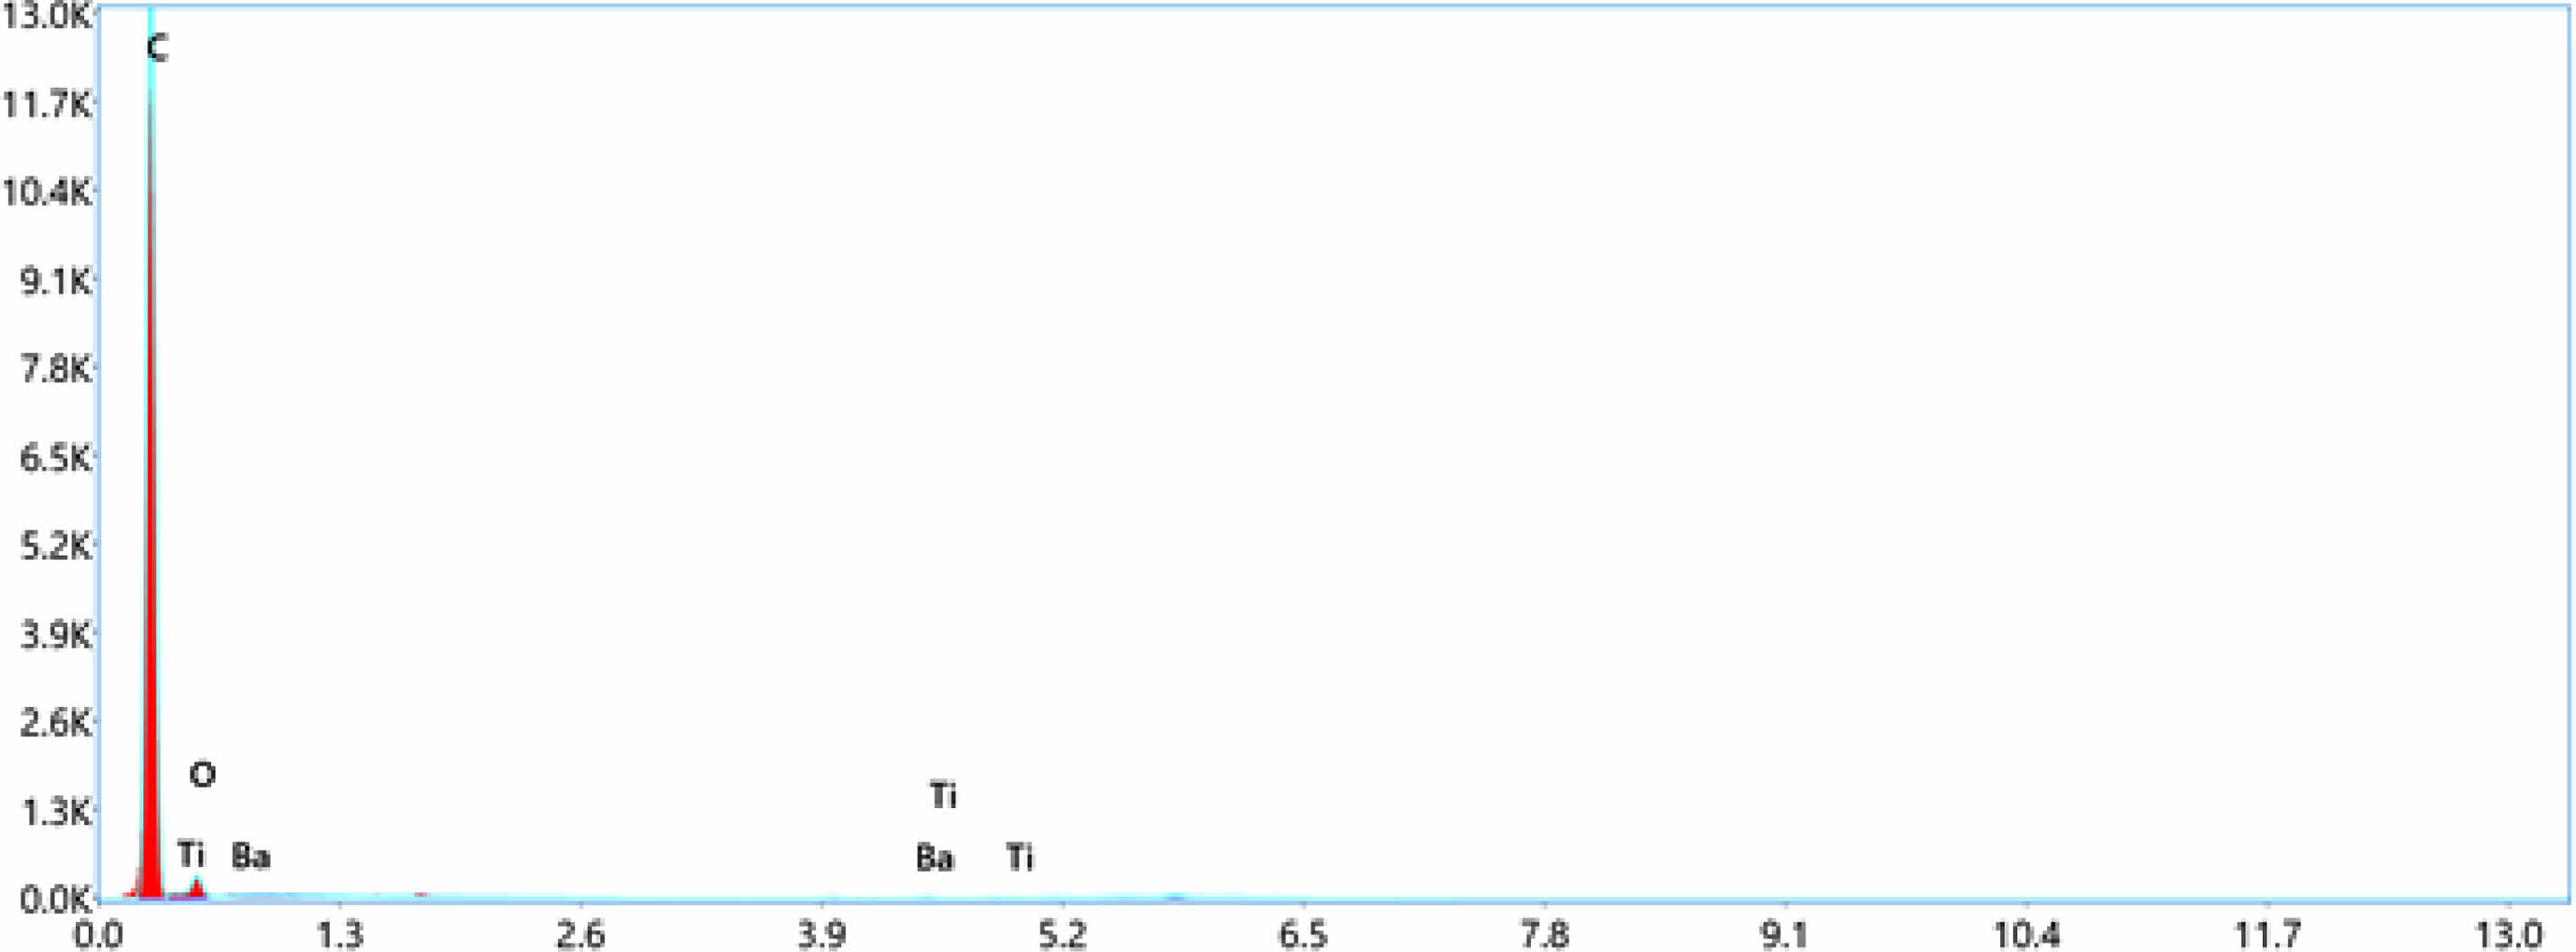
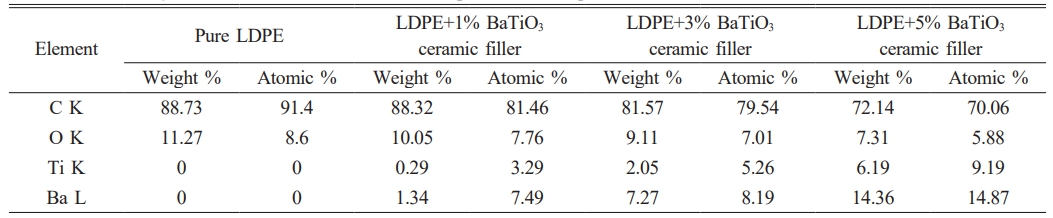
EDS can determined the types of elements present in the sample and their relative concentrations.In this case of LDPE with nano BaTiO3 composite, the primary elements that would be detected are carbon (C), hydrogen (H), oxygen (O), barium (Ba), and titanium (Ti). LDPE contains mainly carbon and hydrogen, while BaTiO3 is composed of barium, titanium, and oxygen. EDS confirmed the presence of these elements and quantify their concentrations in the nano composite material displayed in Table 4. The concentration of these elements increases toward the incerse the concentration of nano BaTiO3 ceramic filler into LDPE material. From Fig. 4 shows the pure LDPE samples, it has only carbon and oxizen elements and other samples were mixed with nano BaTiO3 ceramic filler with ratio of 1%, 3% and 5% shown in Fig. 5, 6 & 7.
|
Fig. 2 SEM images of BaTiO3 loaded LDPE nanocomposite sheet; a) Pure LDPE, b) 1 wt.% BaTiO3 in LDPE, c) 3 wt.% BaTiO3 in LDPE d) 5 wt.% BaTiO3 in LDPE. |
|
Fig. 3 XRD Spectra of Samples |
|
Fig. 4 Energy dispersive spectroscopy (EDS)-Pure LDPE. |
|
Fig. 5 Energy dispersive spectroscopy (EDS)-LDPE+1%BaTiO3 ceramic filler |
|
Fig. 6 Energy dispersive spectroscopy (EDS)-LDPE+3%BaTiO3 ceramic filler. |
|
Fig. 7 Energy dispersive spectroscopy (EDS)-LDPE+5%BaTiO3 ceramic filler. |

Dielectric breakdown strength test
The ASTM D149 standard was used to determine the dielectric breakdown strength (Max. Capacity 100 kV) shown in Fig. 8. The prepared samples were placed into a two spherical electrodes of 12.5 mm diameter and it is immersed in a test cell containing insulating oil in order to avoid surface flashover. The electric potential was increasing from minimum (zero) to the breakdown voltage level at a step of 500 volts/sec. When the failure occurs, the operating voltage is automatically cut off and the breakdown voltage is recorded. Four different samples of pure LDPE, 1 wt.%, 3 wt% and 5 wt.% of LDPE/BaTiO3 ceramic filler taken for test . Each comprises of 10 specimen with same thickness unde.rgone for different dielectric breakdown strength Test as given below [28].
The following is a list of the numerous test conditions:
● The first group of samples was examined in a dry state using AC voltage.
● The second group of samples was examined under moist conditions using AC voltage.
● All samples were dip in two different concentrations of sodium chloride (NaCl) to study the environmental impact of polymer materials.
Dry condition
To acquire a high-accuracy measurement during a dry dielectric strength test, the following procedures were applied to all samples:
● To avoid flashover, the samples should be soaked in oil, and if flashover occurs, the sample should be discarded.
● The specimens need to be dry and spotless before starting the high voltage test in order to get removal of any surface contaminants like dust.
● As shown in Fig. 8, the voltage was raised steadily until the voltage breakdown occurred at a constant rate of 2 kV/s. The test was evaluated according to ASTM-D149 at 25°C room temperature with a relative humidity of 51%.
Wet condition:The findings of this study helped researchers better understand the impact of water on the electrical properties (dielectric strength) of BaTiO3 ceramic filler composites. The samples must be thoroughly submerged in a container of boiling distilled water. The samples should be removed from the container after 120 minutes and cooled in distilled water stored at room temperature. The samples should be removed from the water one at a time after 15 minutes, any surface water should be wiped off with a dry cloth, and then the samples should be dipped into the oil to prevent surface flashover, per ASTM-D570.
Salty wet condition
Saline attack accelerates the corrosion of high-voltage underground cable in the sea, which is a major problem. The amount of salt in a body of water affects the acidity of that body of water. Artificial pollutants were produced using a conspicuous mixture of sodium chloride and pure water. The samples were subsequently stored at room temperature within an obvious solution container. The specimens were taken one by one from the salient solution after 24 hours, wiped dry with a cotton pad, and submerged in oil to conduct a dielectric strength test as per according to ASTM D570.
The dielectric strength of the produced samples was examined using Weibull statistical distribution coefficients.
Volume Resistivity
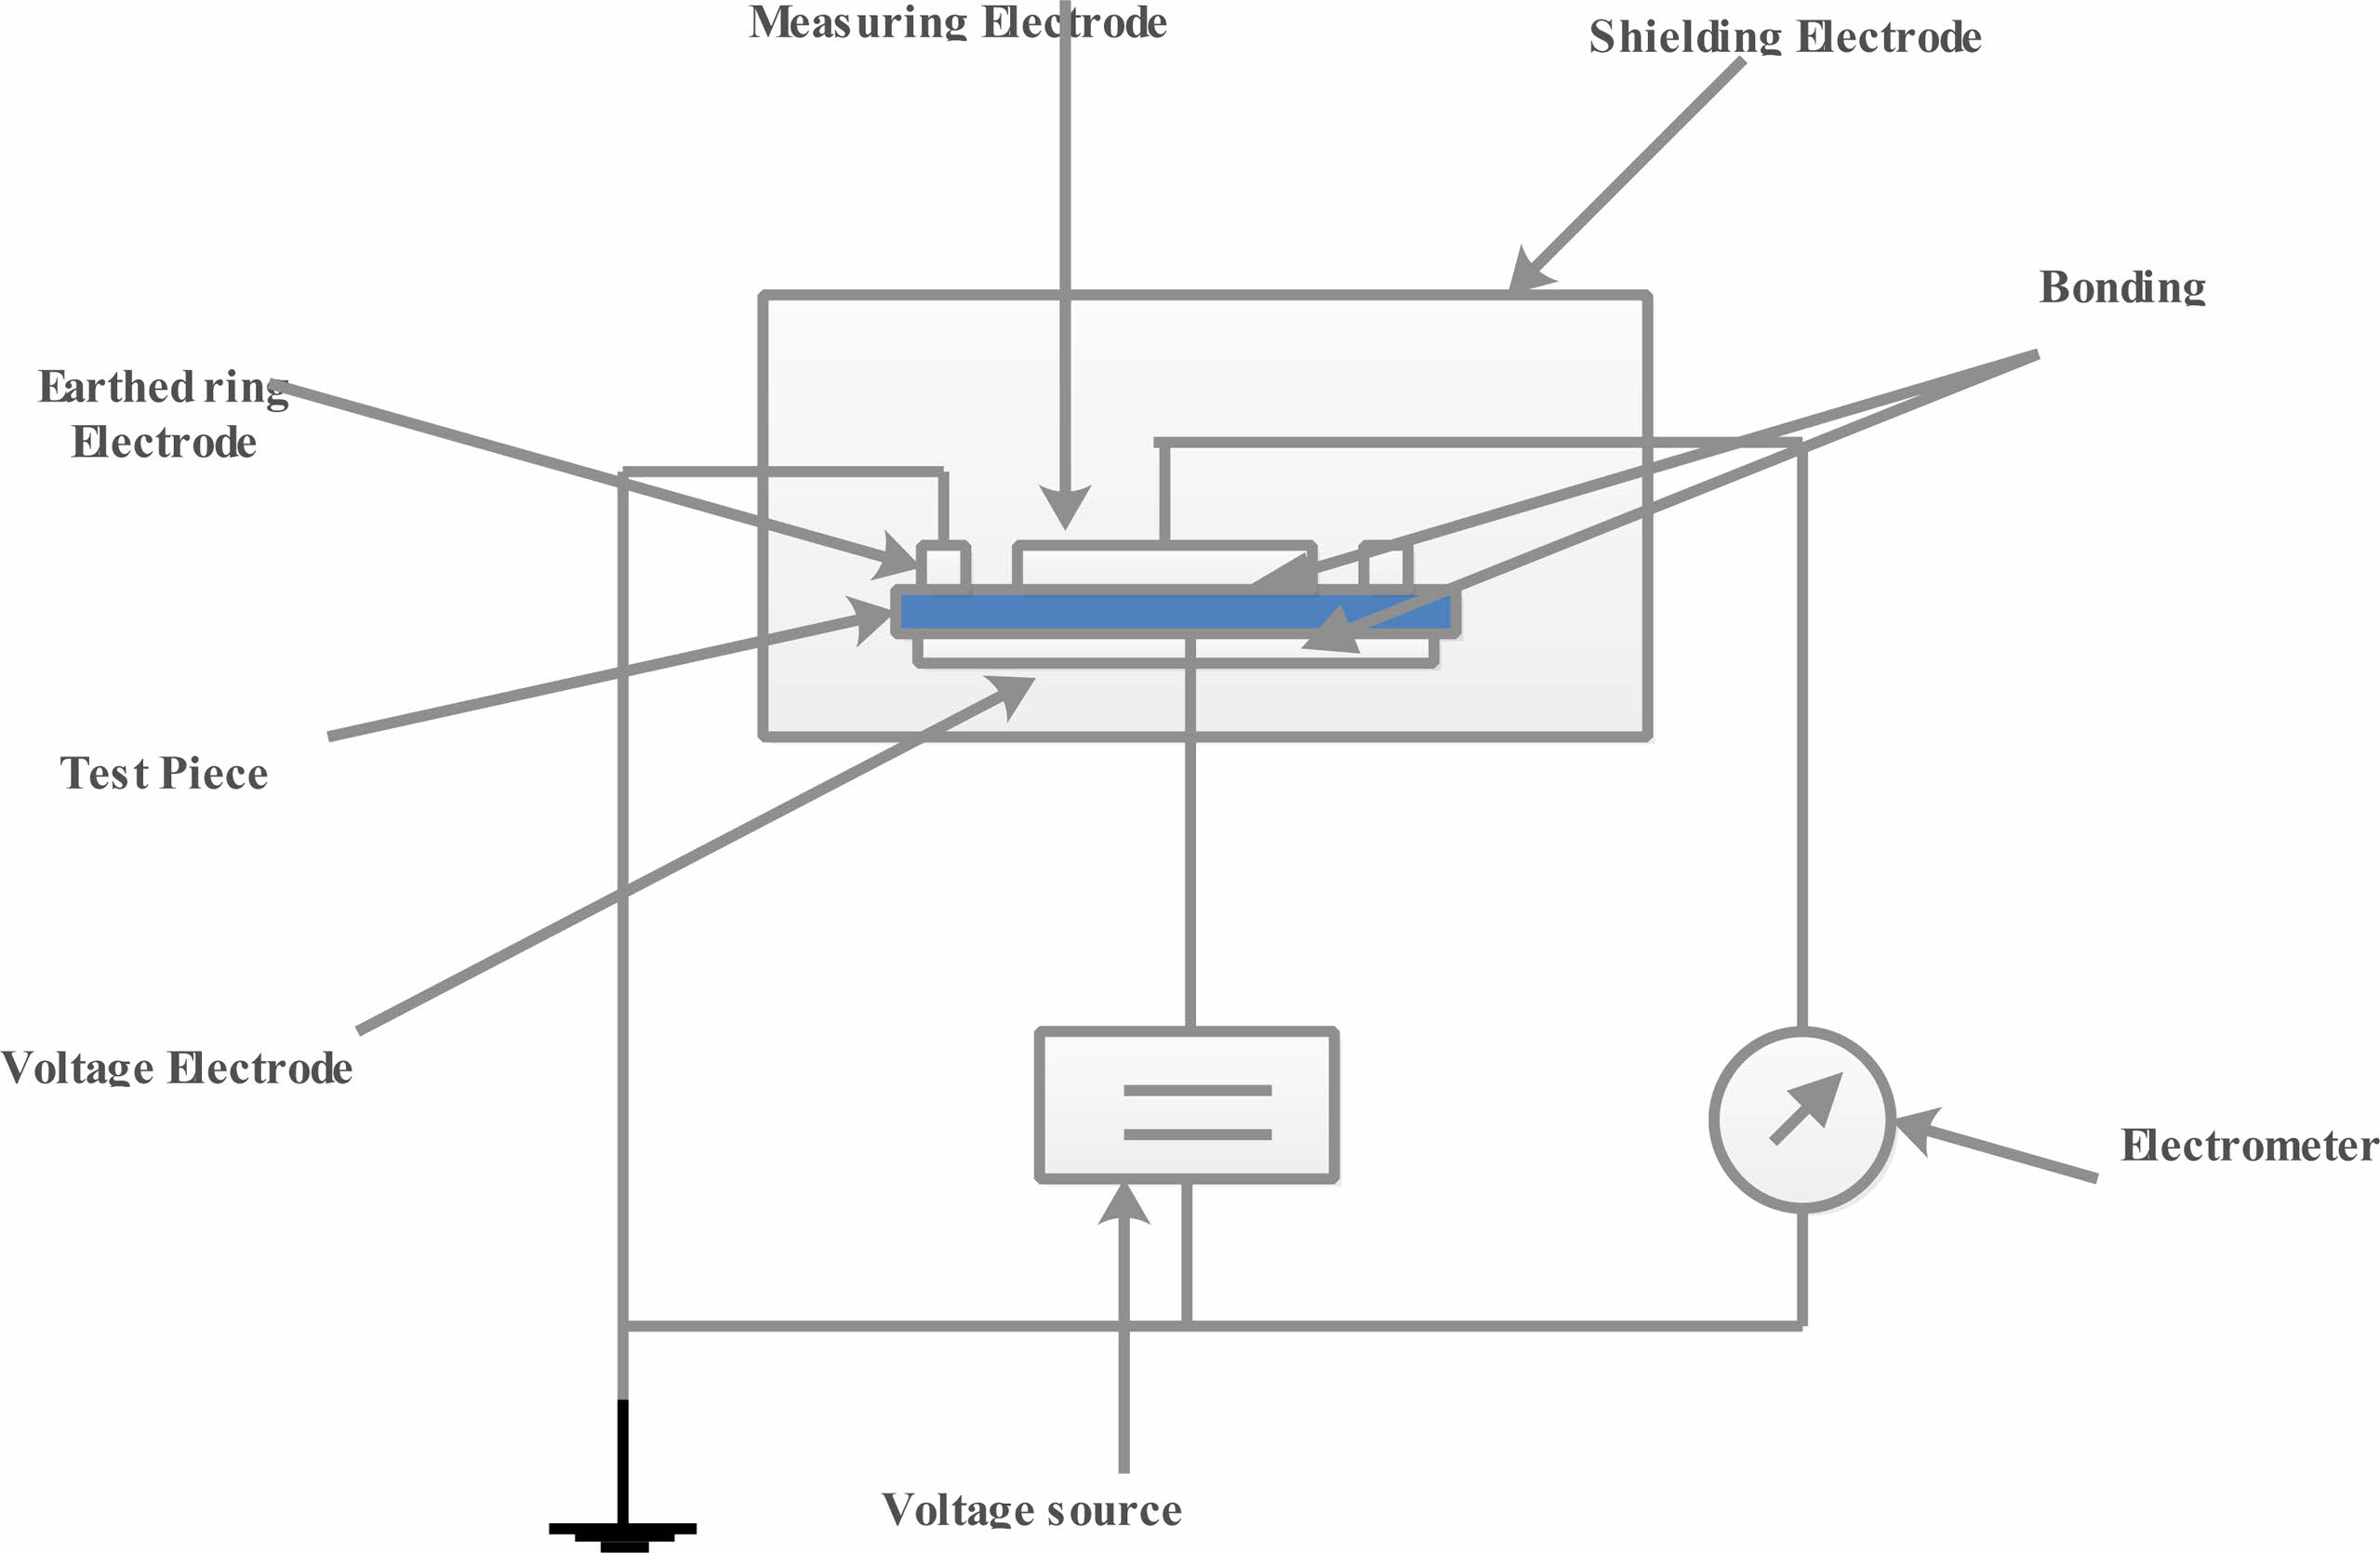
Volume resistivity was measured to prepared sample as per ASTM D257 using tera ohmeter (Temperature limit : -20 °C to 50 °C) shown in the Fig. 9. The prepared samples has been cut and having radius of 50 mm has been placed into the sample container and charged for 1 minute at 500 V. At room temperature (25 +1 °C), the volume reistance has been measured. volume resistivity =21.237 . Where Rv = volume resistance in Ω. t = thickness of the sheet. The test was conducted for 5 different specimen for each sample and its avearge value taken for result.
Dielectric constant and dissipation factor
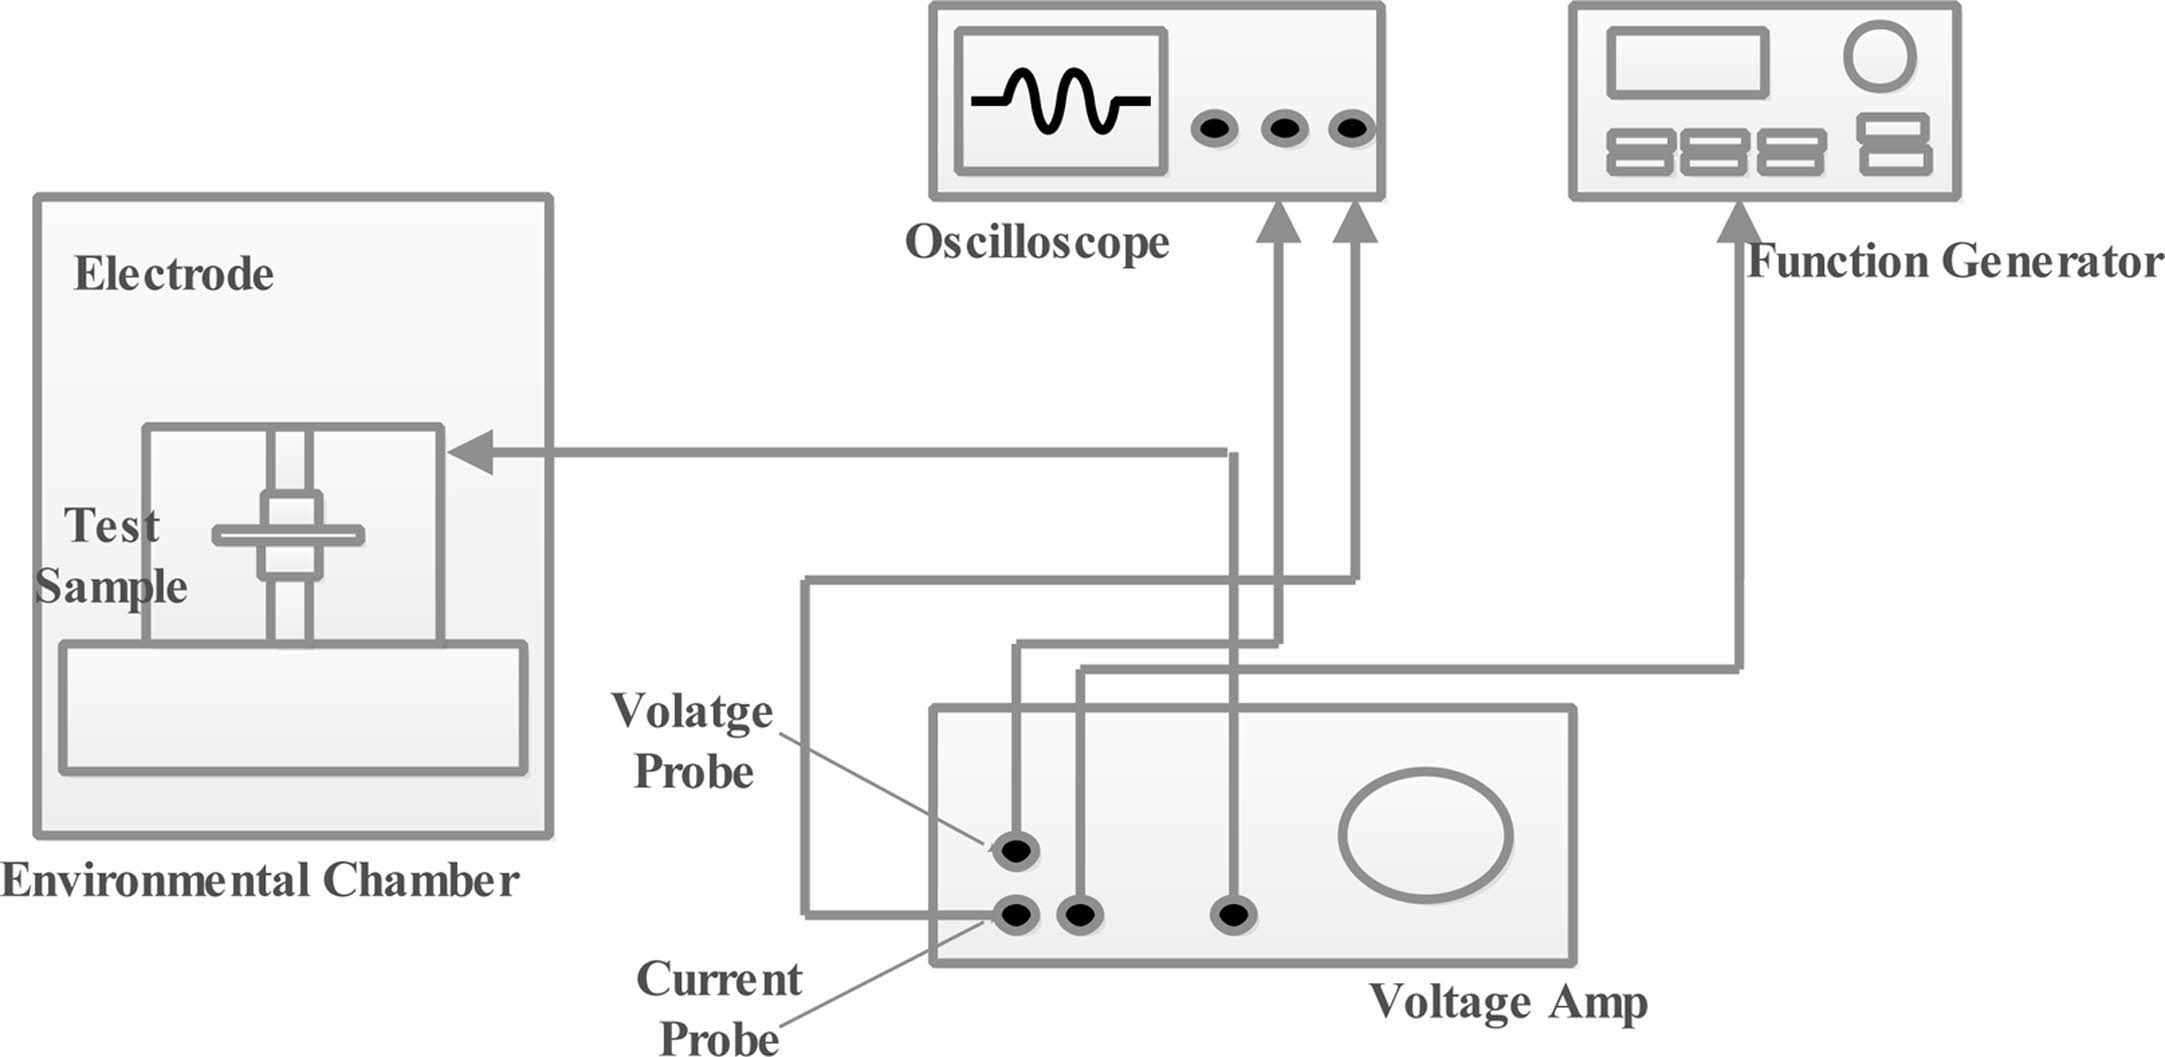
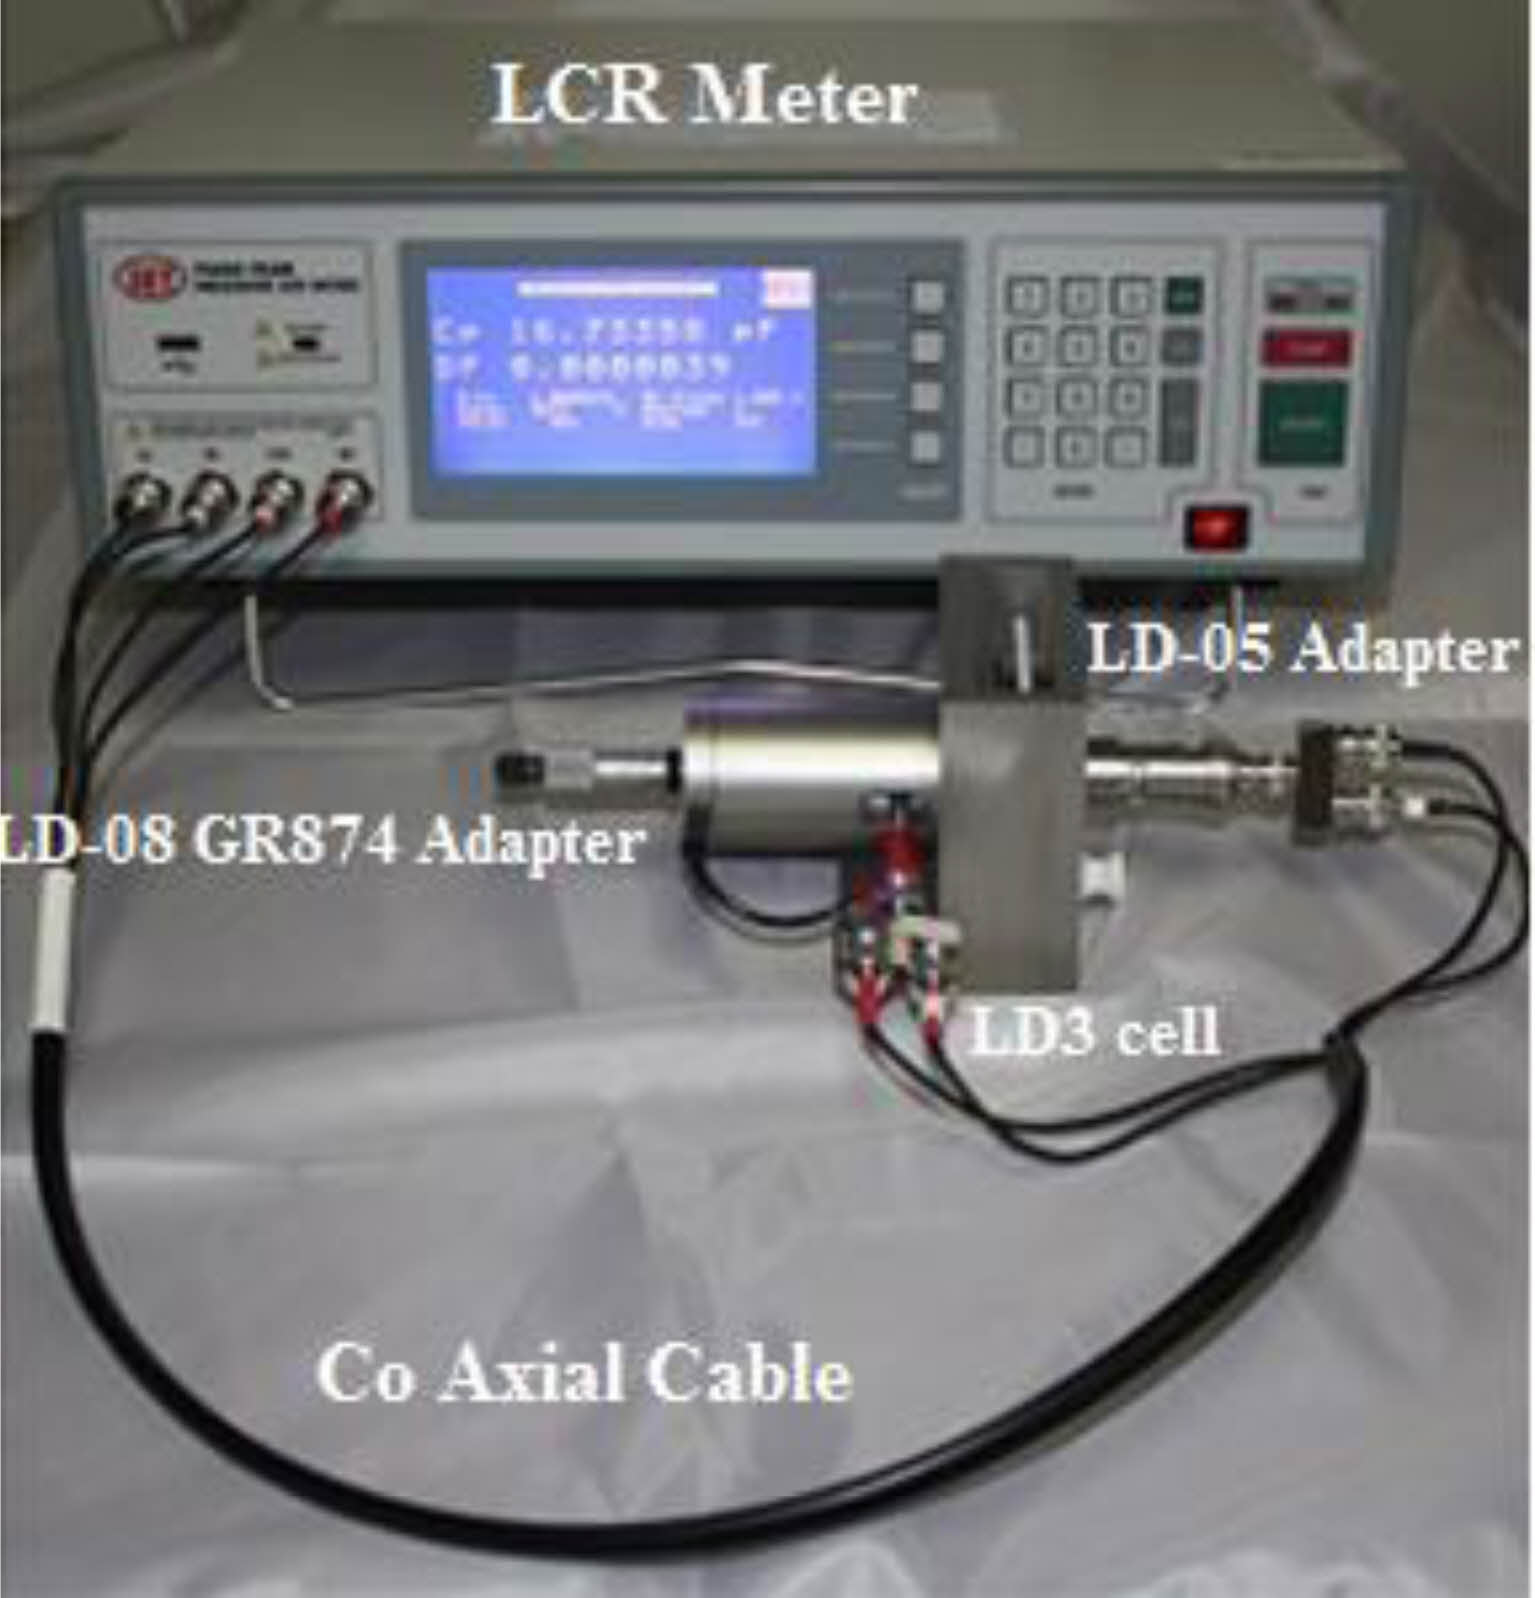
Dielectric constant and dissipation factor are measured according to ASTM D 150 using LCR meter (Max. frequency: 1 MHz) at room temperature (23 °C) shown in Fig. 10. The test was carried out at different frequencies, often in the range of 10 Hz-1 MHz. The sample should be flat and larger than the 50 mm (2 inch) circular electrodes used for the measurement.
|
Fig. 8 Experimental setup of dielectric strength. |
|
Fig. 9 Exprimental setup of Volume resistivity |
|
Fig. 10 Exprimental setup of dielectric constant and dissipaton factor. |
Dielectric breakdown strength
Weibull analysis
The breakdown strength of LDPE nano-composite is analyzed by two-parameter Weibull analysis [29].
Weibull distribution of breakdown field strength has been described as follows;
Probability of Failure is usually expressed in percentage and its given in eq. (2)
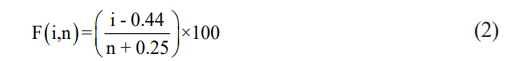
n represents number of test carried out for single sample.
Rank, i = 1,2,…., n
ti = Breakdown voltage (or) Breakdown time
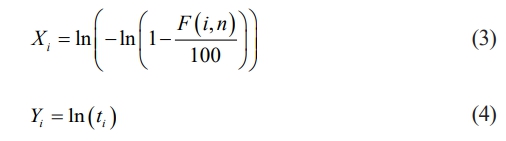
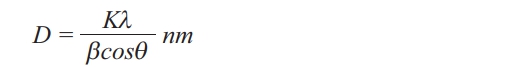
calculated weighted average of Xi and Yi as shown in eq. (2) & (3)
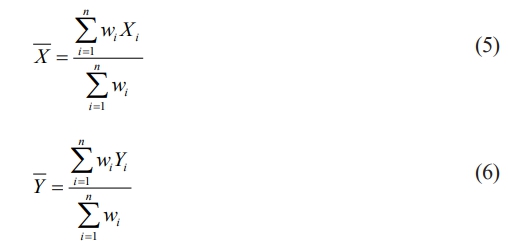
* weighted factors taken from IEEE 930-2004 standards [30]
Using the eq. (5) and (6) to estimate the shape parameter β and scale parameter α
β = represents the dispersion of sample.
α = scale parameter represents the characteristics breakdown strength during the cumulative probability of dielectric breakdown is 63.2%.
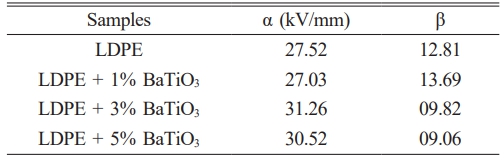
Table 5 gives the result of comparison between undoped and doped BaTiO3 ceramic filler with LDPE. It is clear that incorporation of nano filler which reduces the short time breakdown strength upto 12% [31, 32].
From Table 5, the scale parameter α increase after adding BaTiO3 ceramic filler nano particle which increases the breakdown strength.
It is observed that adding BaTiO3 ceramic filler on more volume concentration, interface between LDPE and nano filler is high and at some point an overlapping occurs. This may be the reason for high charge densities and space charge distribution. It is also observed that, the filler distribution effect is homogeneous which leads to uniform electrical stress [33].
On the other side, low value of α appeared for 1% BaTiO3 ceramic filler doped concentration, the nano particle are not uniformly distributed and nano particle agglomeration were formed. This may be produce more charge accumulation and partial discharges. This defects produces weak interface between LDPE matrix and nano fillers.
The shape parameter β represent the measured range of the failure time or voltage. The range of β is larger, breakdown time or voltage is smaller range. The breakdown mechanism of the LDPE was changed after introducing BaTiO3 ceramic filler, because shape factors β of LDPE is lower value than LDPE/BaTiO3 nanocomposite. It is evident that the incorporation of the BaTiO3 ceramic filler increases the dispersion of electrical stress to breakdown in the doped material.
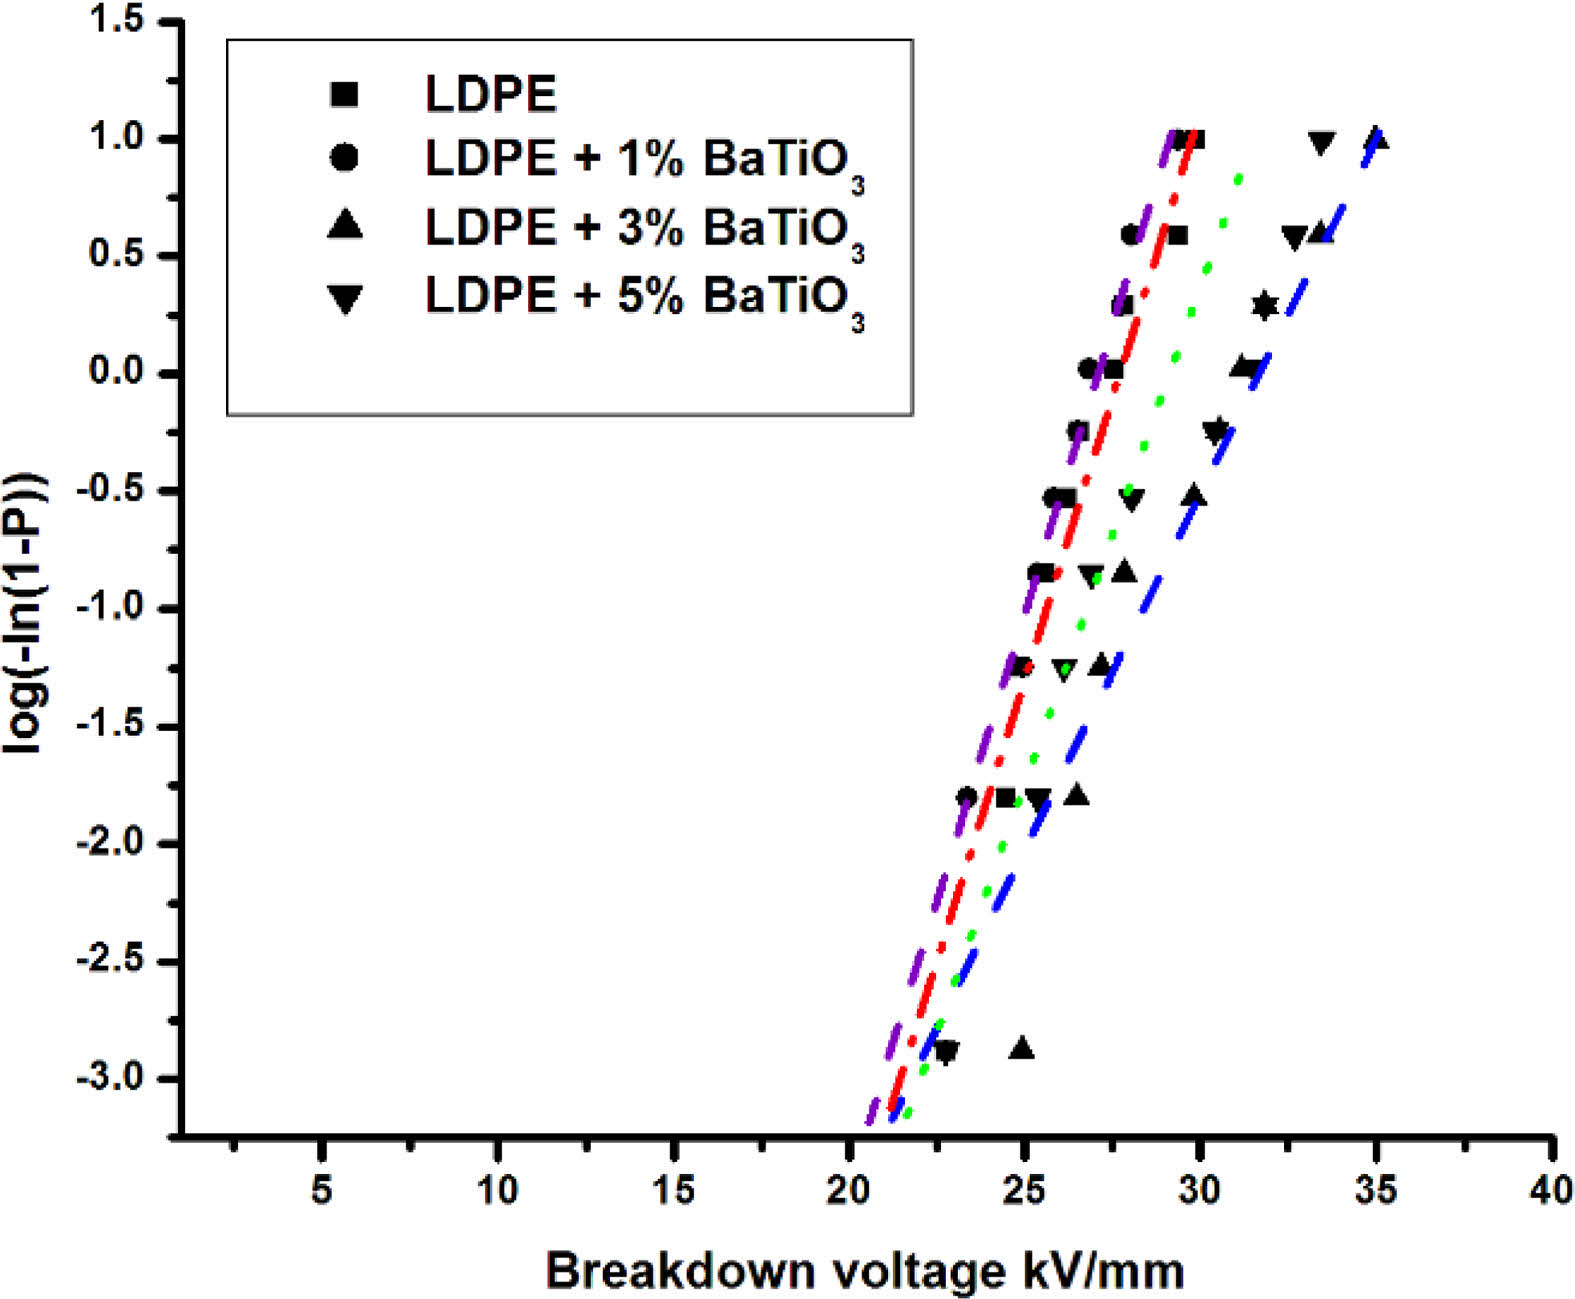
Fig. 11 shows the weibull distribution plot of the cumulative probability of the dc breakdown strength. It is plotted between breakdown voltage vs log(-ln(1-P)). From the plot it is clear that undoped LDPE has low breakdown strength compare to 3% wt BaTiO3 ceramic filler doped LDPE.
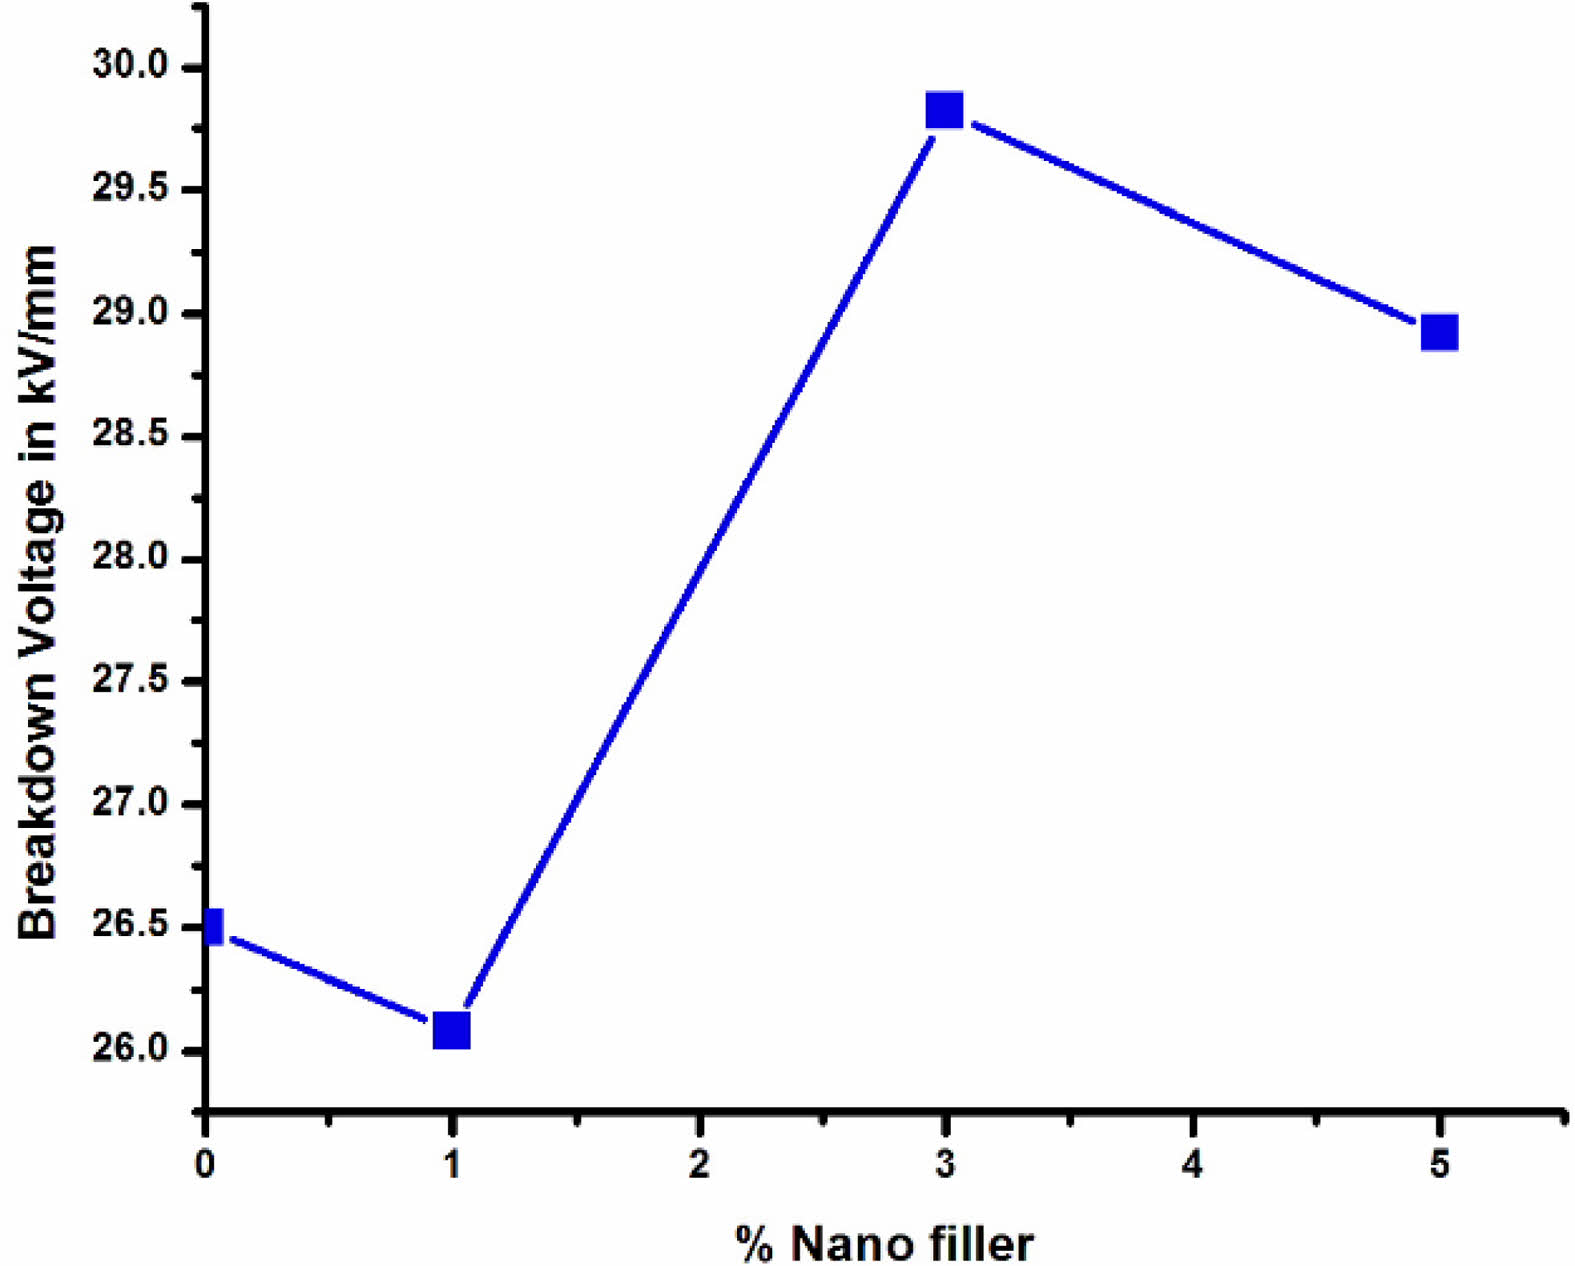
Fig. 12 shows the breakdown strength of neat LDPE and LDPE nanocomposites. 3%wt BaTiO3 ceramic filler nanocomposite LDPE have highest breakdown strength. From the above graph it was found that the breakdown strength of undoped LDPE has 26.5 kV/mm and for 1 %wt of LDPE/BaTiO3 ceramic filler has the breakdown strength of 26.08 kV/mm. For 3% and 5% of doped LDPE/BaTiO3 ceramic filler has the breakdown strength of 29.82 kV/mm and 28.92 kV/mm respectively. From above results it was observed that 3% wt of nano filler has highest breakdown strength when compared to undoped LDPE. Further increase in nano filler ratio it is clear that the breakdown strength was reduced. The reduction in breakdown was occurs due to minimal interface distance between the LDPE and nanofiller.
Dielectric strength measurements in various condition for LDPE composite samples with BaTiO3 ceramic filler
Different weight ratios of nano-BaTiO3 ceramic filler have been used to study the dielectric strength of LDPE under various conditions, including dry, wet, salty wet, and extremely salty wet. All of the practical outcomes were meticulously collected and plotted so that they could be discussed and analyzed easily.
FFNN Technique
In this experiment, various LDPE composite samples were examined to determine their dielectric strength. To predict the dielectric strength, a feed-forward back propagation neural network model was trained using two inputs: the proportion of nano-BaTiO3 ceramic fillers in the LDPE and the test conditions. This information is illustrated in Fig. 13, where the neural network model takes these inputs and generates a corresponding output. MATLAB neural network toolkit and m-file code were used to generate the FFNN model (built-in function).
In this research study, nanocomposite materials were created and tested under various environmental conditions, including dry conditions, wet conditions, saline conditions, and highly saline conditions. The nanocomposites were formulated with different volume ratios of filler loading, specifically 0%, 1%, 3%, and 5% BaTiO3 nano powder. Dielectric strength measurements were conducted using conventional methods, revealing variations in dielectric strength corresponding to different filler loadings and environmental conditions.
For each setting, the dielectric strength was studied in five samples. Four of them were utilized in the FFNN model’s training process. The fifth sample was utilized to evaluate the FFNN model, compare it to the experimental findings, and determine the error percentage. Even when only a tiny quantity of data was given, the FFNN approach was effective in forecasting dielectric strength values.
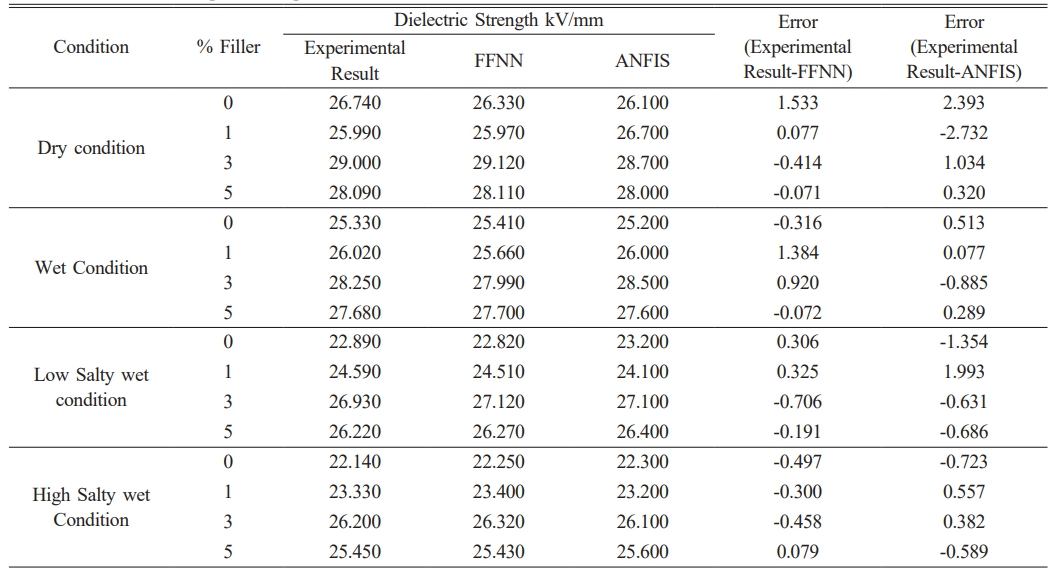
In this study, a feed-forward neural network model (FFNN1) was trained to predict the dielectric strength of nano-BaTiO3 ceramic filler /LDPE composite samples under different test conditions. The results of the FFNN1 model were analyzed and presented in Table 6, which includes the dielectric strength tests conducted on LDPE samples with varying concentrations of nano-BaTiO3 ceramic filler under different conditions such as dry, wet, low salty wet, and high salty wet.
The accuracy of the FFNN model in forecasting the dielectric strength of LDPE composites has been validated, demonstrating its reliability for practical applications. Specifically, the model can be applied in the creation and design of low voltage electrical cables, where the dielectric strength is a critical factor.
After the training process, the FFNN model achieved a root-mean-square error of 0.205, indicating its effectiveness in capturing the relationship between the proportion of nano-BaTiO3 ceramic fillers in LDPE and the resulting dielectric strength.
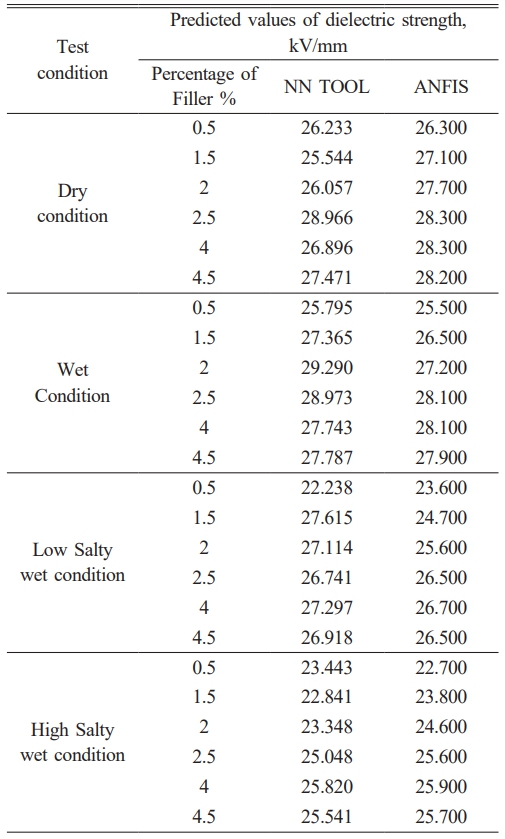
In this case, the FFNN model was employed to predict the dielectric strength of nano-BaTiO3 ceramic filler/LDPE composite samples under diverse conditions. Table 7 presents the observational data, predicted outcomes, and residual value percentage obtained from the FFNN model.
It is important to highlight that the FFNN model has undergone training to ensure accurate forecasts of the dielectric strength of LDPE composites across different concentrations of nano-BaTiO3 ceramic filler. The model’s performance is reflected in its root-mean-square error of 0.9900, indicating its ability to effectively capture the relationship between the input variables and the dielectric strength output.
By utilizing the FFNN model, researchers and practitioners can make reliable predictions regarding the dielectric strength of LDPE composites, enabling informed decision-making in various applications and design considerations.
Case 3: In this case, the FFNN model was utilized to predict the dielectric strength of nano-BaTiO3/LDPE composite samples under different test conditions. The FFNN model proves to be particularly useful in estimating dielectric strength values for composite samples that lie between the experimental results.
By leveraging the FFNN model, researchers and engineers can obtain reliable predictions for the dielectric strength of various nano-BaTiO3 ceramic filler/LDPE composites, even when there are no specific experimental data points available for a particular composition. The model’s ability to interpolate between existing data points allows for more comprehensive predictions and a better understanding of the dielectric behavior of composite materials.
This capability of the FFNN model aids in enhancing the efficiency and accuracy of dielectric strength estimation, enabling informed decision-making and design optimization for nano-BaTiO3 ceramic filler/LDPE composite samples in different practical applications.
The trained FFNN model, as shown in Tables 6 and 7, is a reliable predictor for any other filler percentage, such as 0.5, 1.5, 2.5, 3.5, and 4.5 percent for nano-BaTiO3 ceramic filler. The estimated dielectric strength values of LDPE composites were realistic, based on the experimental dielectric strength values in Tables 6 and 7.
Adaptive Neuro Fuzzy Inference System (ANFIS)
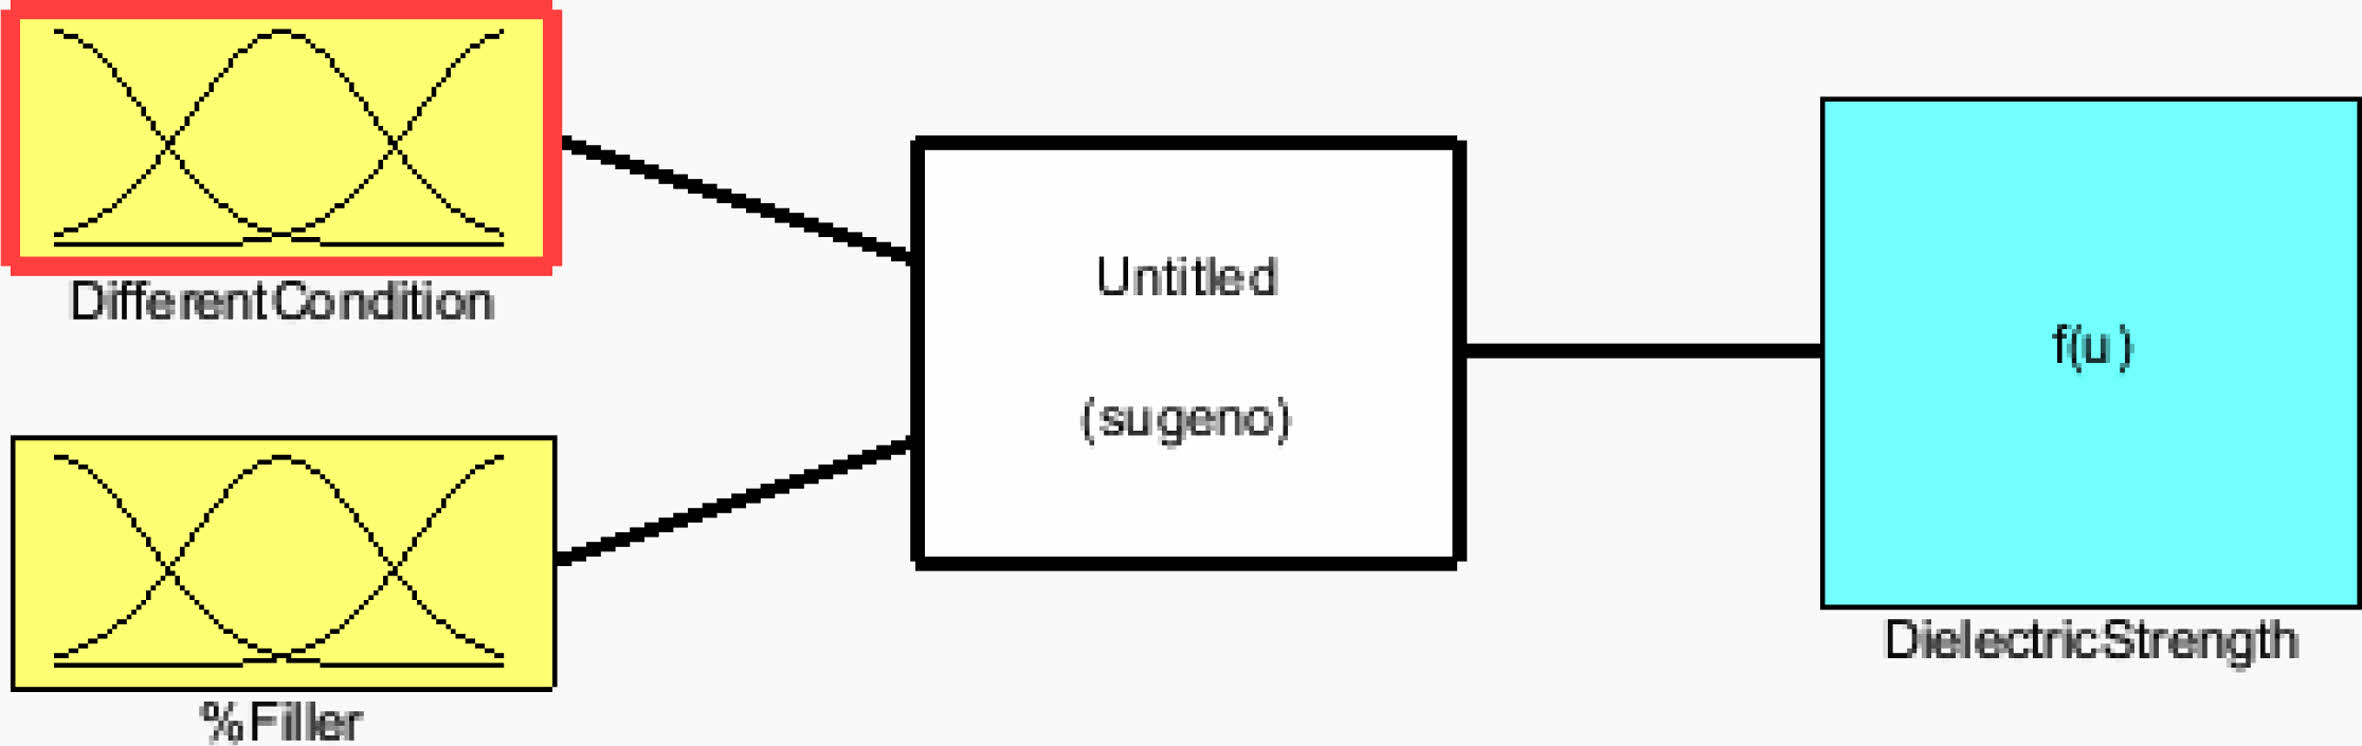
In complex systems, ANFIS is utilized for modelling, control, and parameter estimation. ANFIS combines the artificial neural network (ANN) and the fuzzy inference system (ANFIS) (FIS). Combining the benefits of ANN and fuzzy-set theory can assist overcome the shortcomings of both approaches. The ANFIS model can be taught without relying solely on expert information, which is required for a fuzzy logic model. The ANFIS method benefits from integrating linguistic and numerical skills. ANFIS additionally makes use of the ANN’s capacity to classify data and identify trends. The ANFIS model is easier to use than the ANN and produces less memorization errors. As a result, the ANFIS has various advantages, including its ability to adapt, nonlinearity, and rapid learning capacity. This method is essentially a fuzzy logic rule-based model, with the rules established during the training process. Data is used to guide the training process. The membership function parameters for ANFIS’ fuzzy inference system (FIS) are determined from the training samples. Mamdani and Sugeno are the most widely used fuzzy inference systems. The output membership functions of the Sugeno system are either linear or constant, which is the primary difference between Mamdani and Sugeno. The output membership functions of the Mamdani system, on the other hand, can be triangular, Gaussian, and so forth. Because the Sugeno-type fuzzy inference system is more computationally efficient, it was chosen over the Mamdani type in this investigation. The Mamdani personality relies heavily on expert knowledge. The Sugeno type, on the other hand, is based on real-world facts [34].
Back-propagation and hybrid approaches are two learning algorithms used by the ANFIS to reduce the error between observed and anticipated data. An ANFIS that is well-designed can resolve any nonlinear or complex issue with great precision. An ANFIS was constructed in this work to estimate dielectric strength shown in Fig. 14.
DC volume resistivity
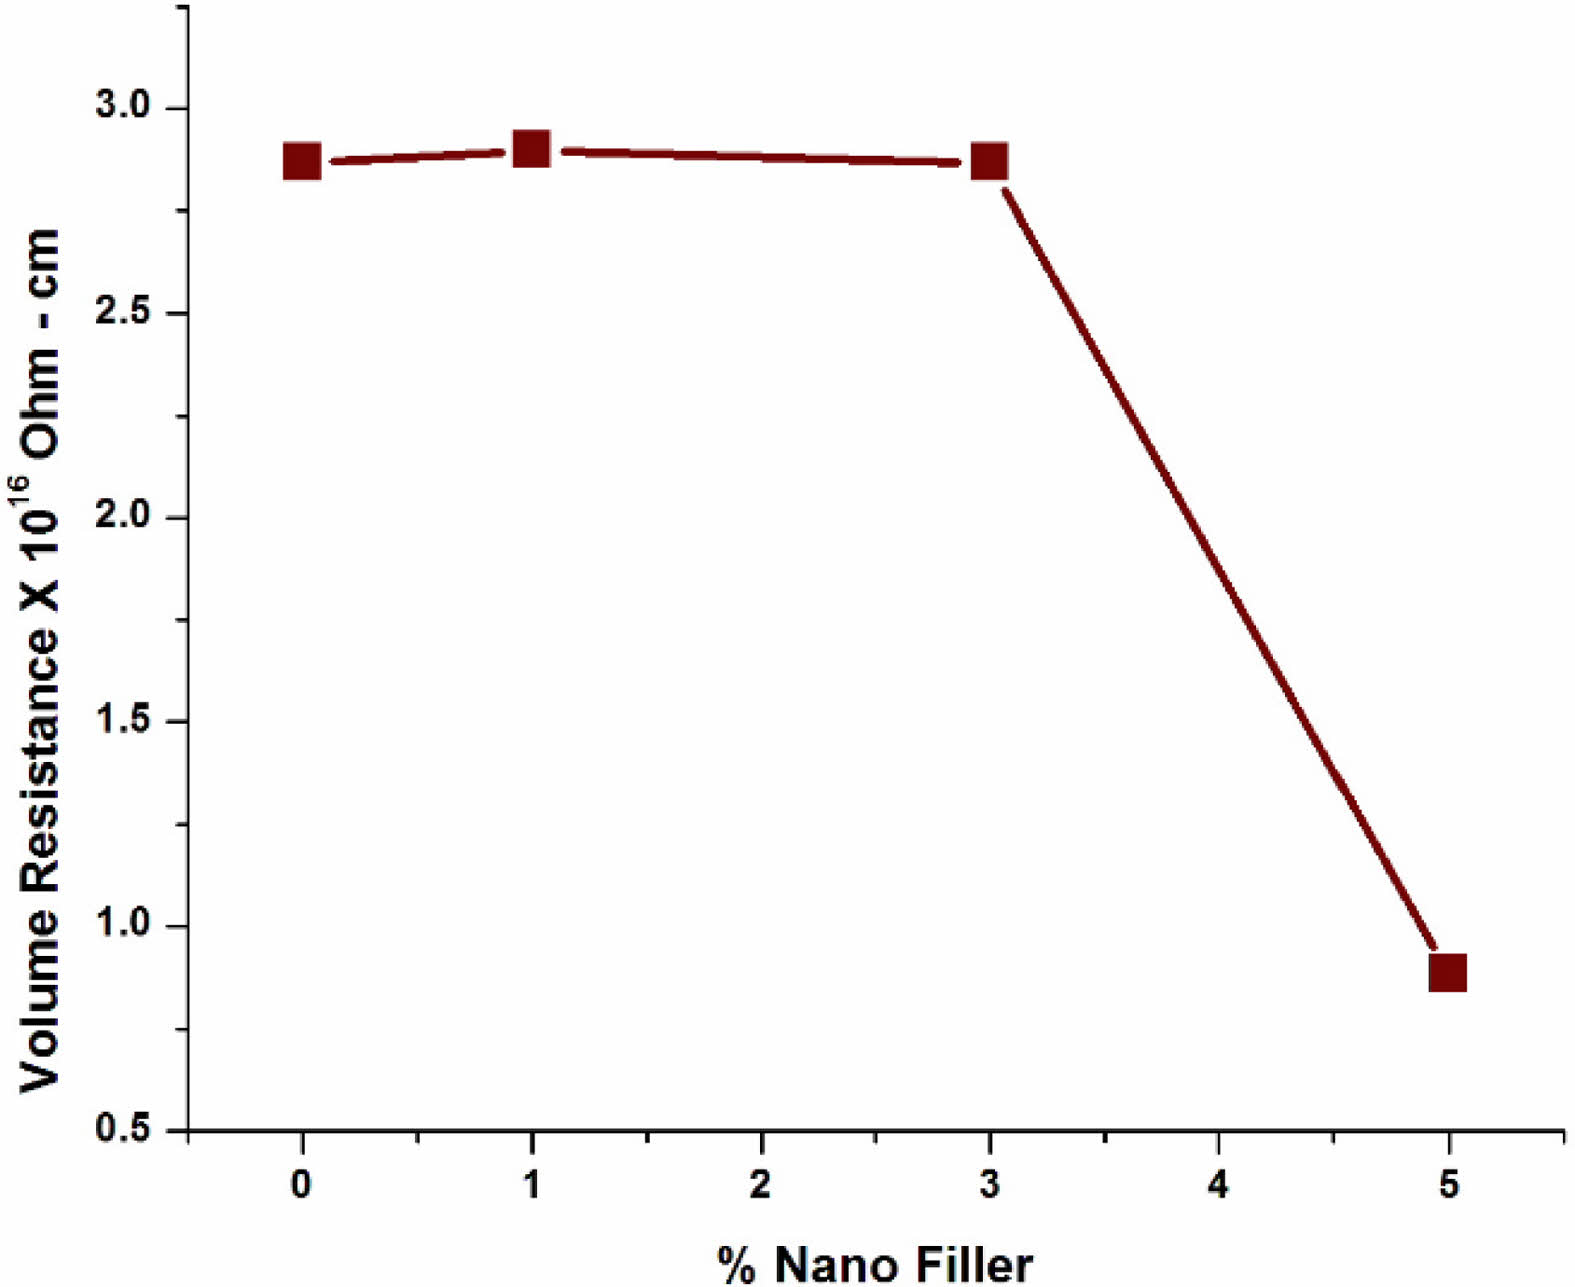
The volume resistivity of pure LDPE and LDPE with BaTiO3 ceramic filler nanocomposites are displayed in Fig. 15. From measured value of volume resistivity, it was found to be slight increases after adding BaTiO3 ceramic filler for 3% wt and it decrease by further addition of BaTiO3 ceramic nanofiller. The addition of inorganic fillers results in the production of free ions in the samples, which increases the electrical conductivity of the nanocomposites [35, 36]. The nanocomposite with a mass of upto 3% wt has the highest value of volume resistance.
From the previous study, it is concluded that the interface between polymer matrix and nanoparticles in LDPE/BaTiO3 ceramic filler nanocomposites which reduces the portability of the charge carrier. For unfilled LDPE has no charge carriers and it has high volume resistivity. When the concentration of nanofiller is high, then the interfacial distance between the nanoparticles is less, which induces the mobility of the charge carrier is high. From the graph it was oberved that for 1% and 3% filler concentration with LDPE nanocomposite has high volume resistivity, and it resists the leakage current. Thus, it is evident that electrical conductivity gets enhanced by adding more volume of nano fillers and inturn the morphology changes was also takes place. For above 3% nanoparticle loading, the interparticle distances are low [37]. Therefore, the charge carriers can drift through the nanocomposite material between the electrodes effortlessly, which leads to a smaller value of volume resistivity in the prepared nanocomposite.
Dielectric constant
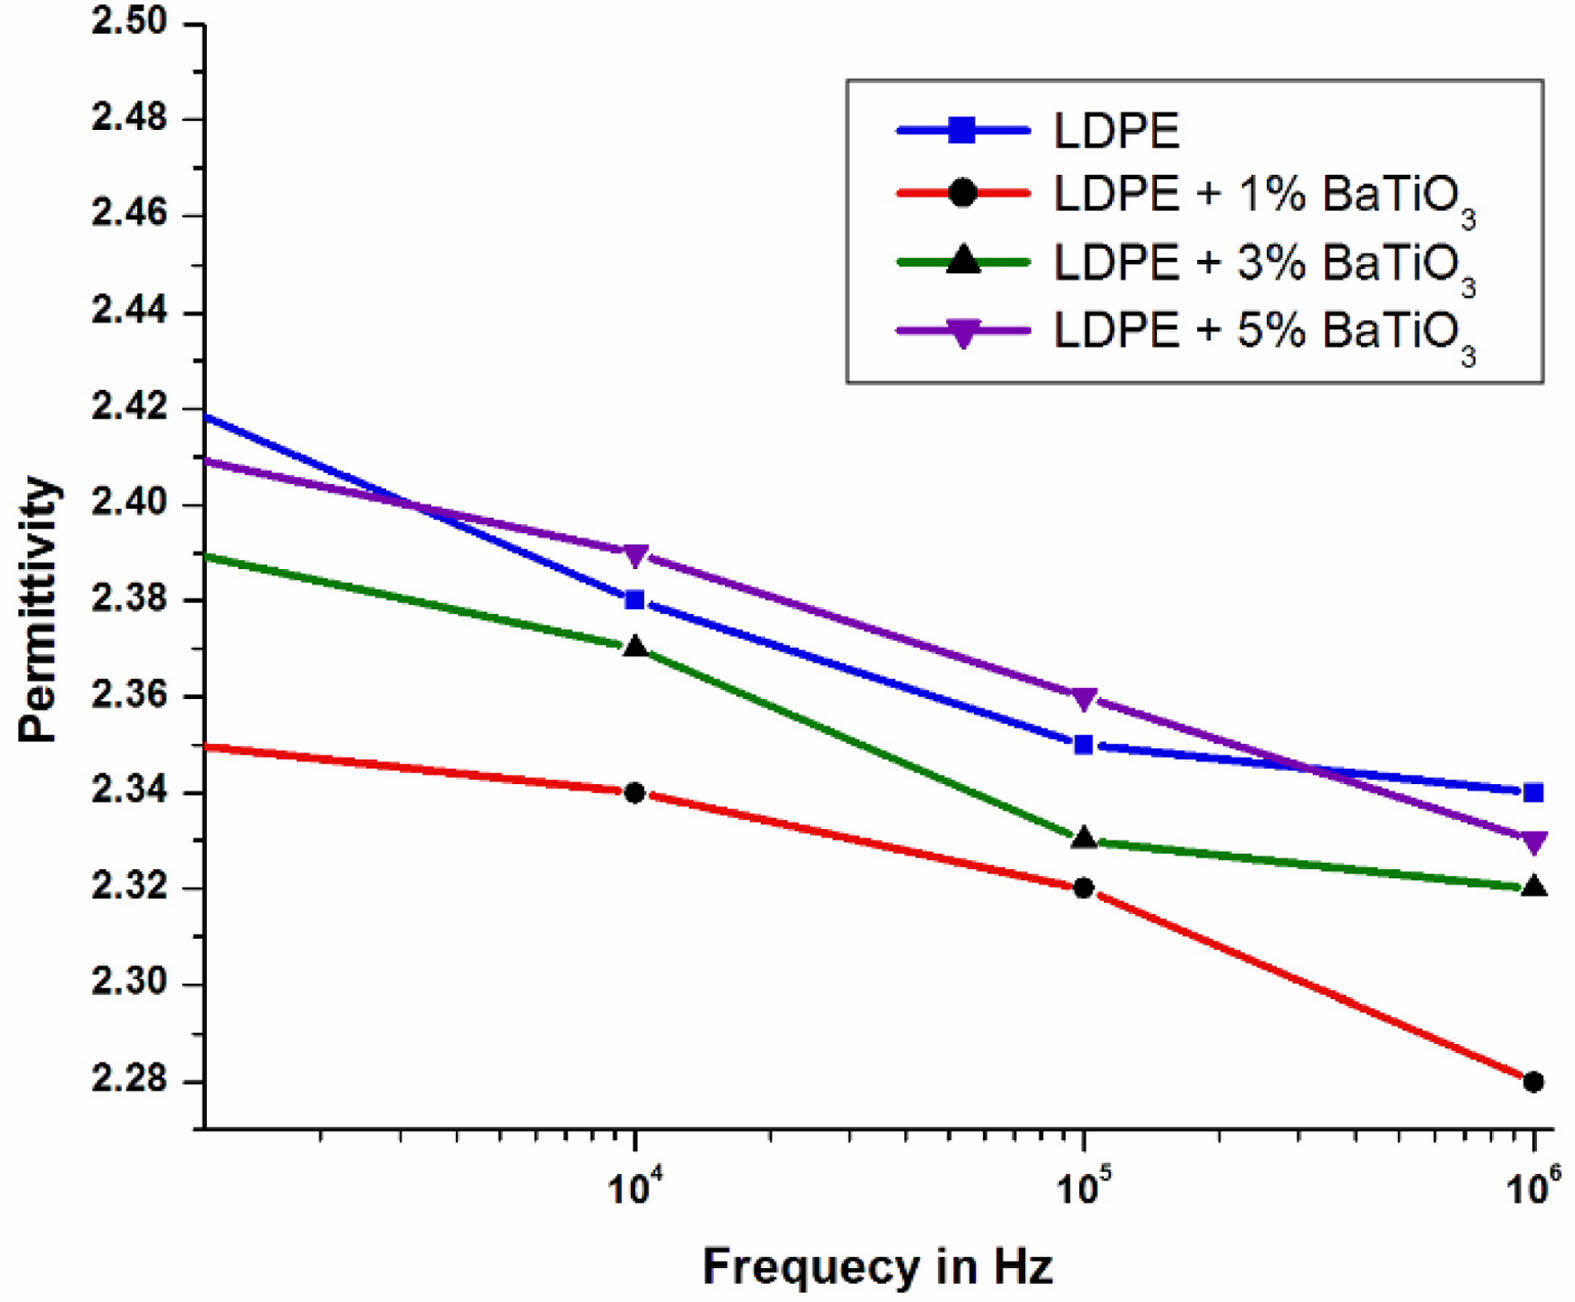
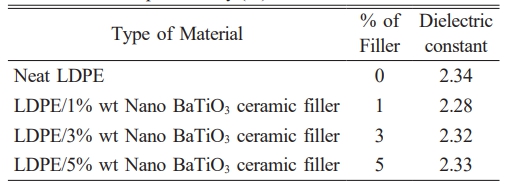
Table 8 shows that the value of relative dielectric permittivity has a lower value for LDPE nanocomposites compare to LDPE material [38]. The LDPE doped with BaTiO3 ceramic filler has lower dielectric constant in the entire frequency range compare to LDPE [39].
The Fig. 16 presents the dielectric permittivity of pure LDPE and LDPE doped with BaTiO3 for the frequency range of 106 Hz. From the graph it was observed that 1%wt and 3%wt LDPE/BaTiO3 ceramic filler nanocomposites have lower dielectric constant when compared to 5%wt and undoped LDPE.
The dielectric constant is a frequency dependent parameter in a dielectric material. Dielectric polarization is exhibited when the dielectric material is placed between alternating fields. The positive ions are oriented in the electric field’s direction, while negative ions are arranged in the opposite direction. This produces an electric dipole in the nanocomposite. The process is completed in a limited amount of time depends on the type of polarization. In the lower frequency range, as the electric field is applied, all free dipoles in the LDPE-based nanocomposite will self-orient, resulting in a high dielectric constant at lower frequencies. In the higher frequency range, as the electric field is applied, more charge is separated and a larger dipole is produced, which makes it difficult to align itself, resulting in a decrease in the dielectric constant at high frequencies.
From the plot, it is inferred that, if the frequency of the applied electric field is increased then the relative dielectric constant gets decreased.
At 1% wt of nano-BaTiO3 ceramic filler, the relative dielectric constant value is low, and the slope of the dielectric constant is between 10 Hz and 104 Hz, which is the same as the slope of 3% and 5% filler loading. However, when the frequency is greater than 104 Hz, the slope is increased compared to 3% and 5%. The change in slope was observed due to the effect of BaTiO3 ceramic filler at higher frequencies. According to the above information, the dielectric constant of the material depends not only on the influence of the filler, but also on the polarization of the bulk material. Interfacial polarization occurs due to impurities and excess free charge associated with nanoscale BaTiO3 ceramic filler particles. Due to the limitation of polarization, the value of the dielectric constant decreases. which means that hindering the carrier mobility in the dipole group results in a decrease in the dielectric constant. The interconnection between the polymer and the nanofiller results in the appearance of a highly fixed polymer layer near the surface of the nanofiller and the polymer chain. The immobilized polymer nanolayers limit all mobility of the charge carriers present. As described in the table 8, it has been seen that the neat LDPE has highest value of permittivity and addition of BaTiO3 ceramic filler to LDPE which marginally increases the permittivity. The present study suggested that the occurrence of lower permittivity for nanocomposites due to the immobility of polymer chain.
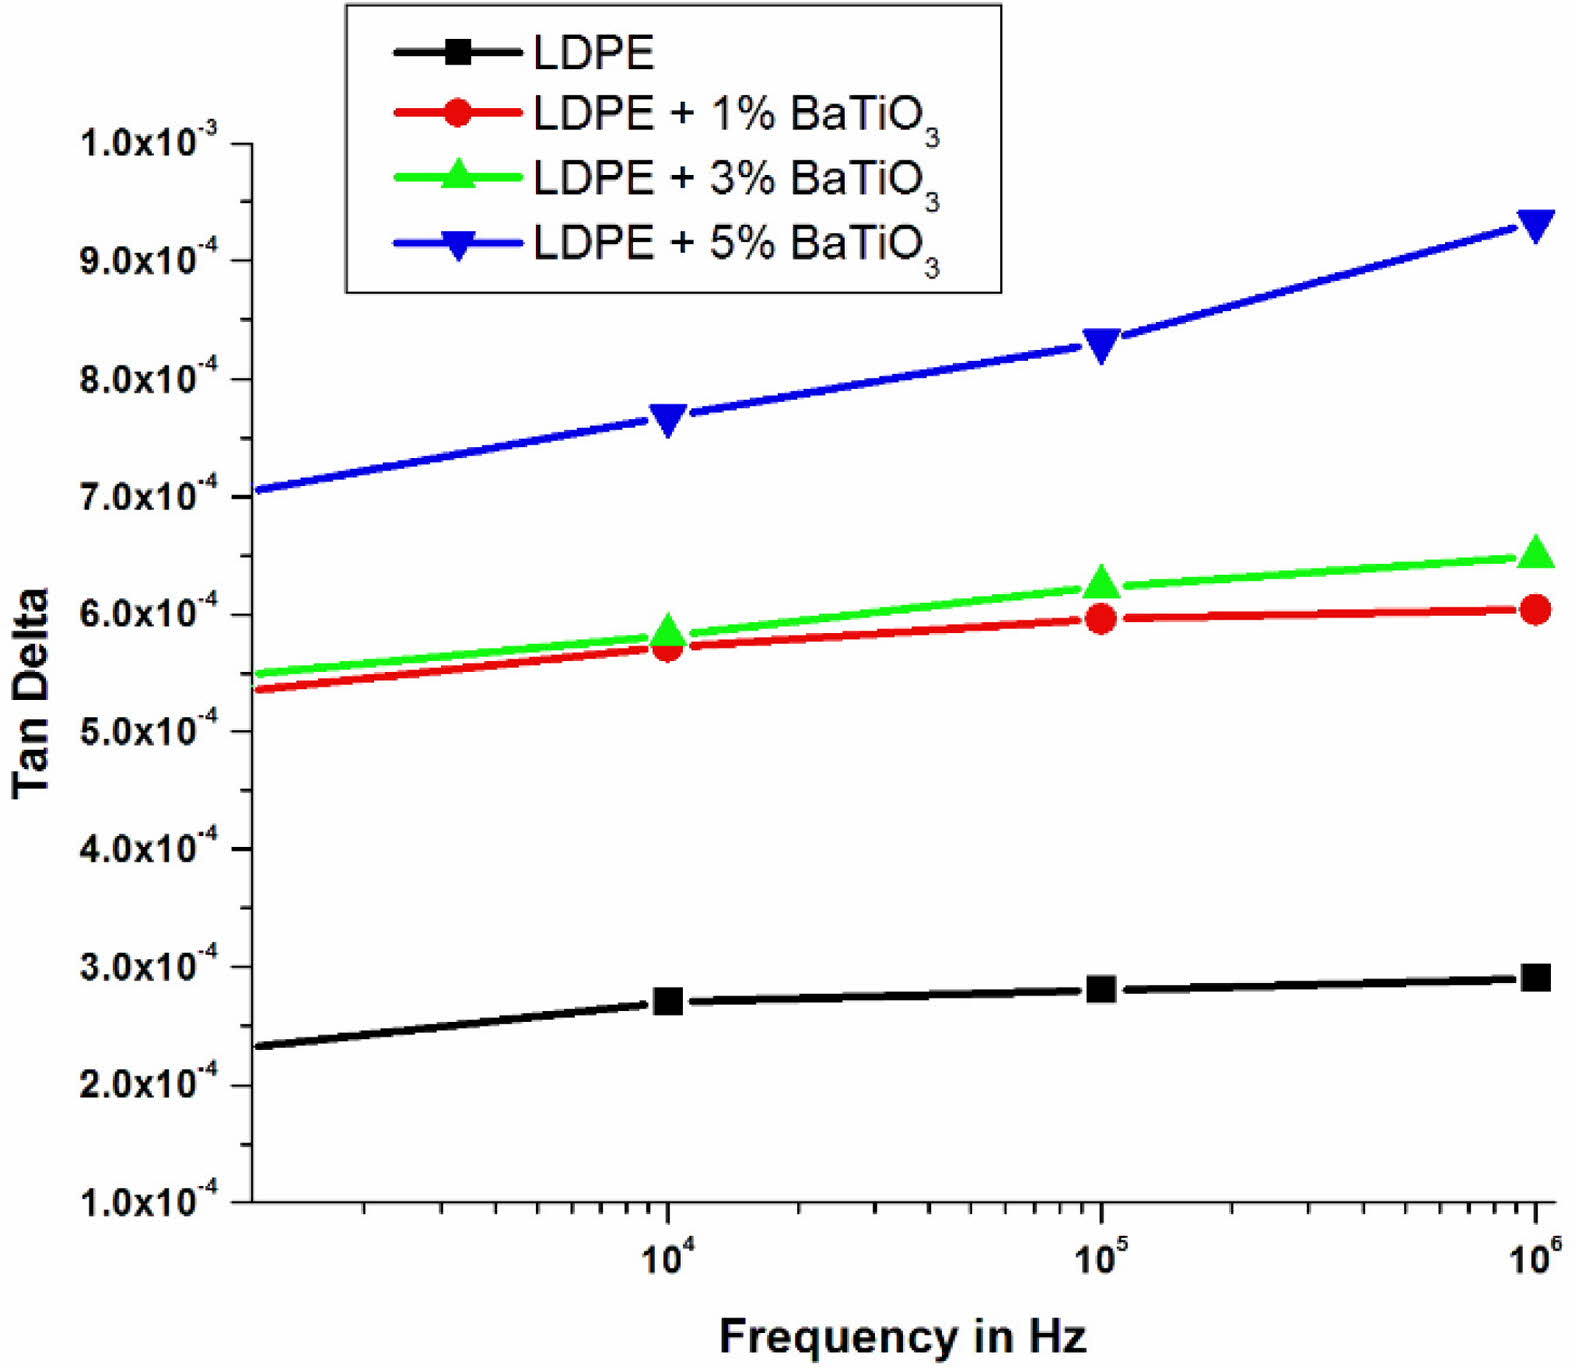
Dissipation factor
An alternating voltage having 500 V peak was given over the sample and the range of frequency between 10 Hz to 106 Hz at atmosphere temperature.
Fig. 17 shows about the variation of dissipation factor of LDPE and LDPE doped with BaTiO3 ceramic filler. Dissipation factor depends on the conductivity of the material. The conductivity depends on the charge carrier relaxation time, the frequency of the applied electric field and number of charge carriers in the material. Since temperature measurements are kept constant, the effect on carrier relaxation time is ignored.LDPE doped with 5% wt nano BaTiO3 ceramic filler composites has high highest dissipation factor when compared to pure LDPE. Because of nanoparticles have a high surface area to volume ratio and an increased interfacial area compared to pure LDPE [40]. The presence of a significant quantity of nanofillers in the system has a notable impact on the conductivity mechanism of the nanocomposites.Furthermore, the addition of an inorganic nanofiller to the polymer matrix which increases the dissipation factor of the LDPE doped BaTiO3 ceramic filler composite because increasing the sources of charge carriers. The dissipation factor value of the unfilled LDPE is low due to reduction in conductivity of the material because of charge transport barriers through different chains and interfaces [41].When the filler concentration reaches 5% by weight, the presence of a larger number of nanoparticles in the nanocomposite leads to a decrease in the distance between particles. This proximity increases the likelihood of particle interactions and facilitates charge transfer within the system. Additionally, the higher number of free carriers in the system further contributes to an increase in conductivity. Another factor influencing conductivity is the overlap of interfacial regions within the nanocomposite. At a 5% nanofiller load, the interfacial regions start to overlap, allowing charge carriers to penetrate more easily. This overlap is influenced by the dispersion of nanoparticles in the LDPE matrix and the size of the filler particles. If the nanocomposite contains agglomerates, the interface regions are more likely to overlap, resulting in localized charge transfer. Furthermore, the average size of the nanoparticles plays a role in determining the filler loading level at which the nanofillers begin to agglomerate. This agglomeration can affect conductivity and the overall performance of the nanocomposite. Overall, the presence of a large number of nanofillers in the system, particularly at a 5% concentration, affects the conductivity mechanism through factors such as particle interactions, charge transfer, interfacial region overlap, and filler dispersion. These factors collectively contribute to changes in conductivity properties in the nanocomposite.With the same concentration of filler, number of nano particles present in the small size nano particle is high compared to large size nano particle. This creates more overlapping in the interfacial region with low filler loading. Fig. 17 shows that a comparison of the tan delta characteristics of four different samples which indicates that the 5%wt nano BaTiO3 ceramic filler -LDPE nanocomposite exhibits a very high dissipation factor value. This is because more free charges enter the system without obstacles.
|
Fig. 11 Weibull distribution plot of dielectric breakdown strength for neat LDPE and LDPE/BaTiO3. |
|
Fig. 12 Breakdown Strength of LDPE/BaTiO3 ceramic filler nanocomposites. |

|
Fig. 13 The structure of the FFNN model’s input and output. |
|
Fig. 14 The structure of the proposed ANFIS model. |
|
Fig. 15 Volume resistivity of pure LDPE & LDPE/ BaTiO3 ceramic filler nanocomposites. |
|
Fig. 16 variety of dielectric permittivity with frequency for neat LDPE & LDPE/BaTiO3 ceramic filler nanocomposites. |
|
Fig. 17 variation of dissipation factor with frequency for LDPE & LDPE/BaTiO3 ceramic filler nanocomposites. |
|
Table 5 Scale and shape specification of the dielectric breakdown of pure LDPE and LDPE with BaTiO3. |
|
Table 6 Comparison between the dielectric strength results obtained from the FFNN model and experimental data for nano-BaTiO3 ceramic filler/LDPE composite samples tested under different conditions. |
|
Table 7 Results of FFNN for estimating the dielectric strength of nano-BaTiO3 ceramic filler/LDPE composite samples in various condition |
In summary, the LDPE filled with BaTiO3 ceramic filler nanoparticles with different volume ratio of pure LDPE and mixtures (1%, 3%, 5%) LDPE/BaTiO3 ceramic filler of 10 specimen of each samples were prepared by using melt mixing technique. From the SEM images, the dispersion of nano filler were observed.
To obtain the electrical parameters, the experimental test were carried out. From the test results, the following inference was found
1) XRD analysis was used to study structural characteristics. The X-ray diffraction (XRD) pattern was used to calculate the average crystallite size of BaTiO3 ceramic filler nanoparticles, which was found to be 57 nm. EDS analysis has confirmed the presence of all the elements barium, titanium, oxygen and carbon. The study of the nanoparticles using scanning electron microscopy (SEM) revealed that they aggregated to form spherical-shaped particles.
2) Incorporation of BaTiO3 ceramic filler nanoparticle could increase the breakdown strength when compared to neat LDPE. The same was Weibull analysis results also verified that 3% wt of BaTiO3 ceramic filler/LDPE nanocomposites gave the highest breakdown strength.
3) FFNN model and ANFIS model used to determine the breakdown strength of LDPE nanocomposite with different filler ratio. Also it used to determine the unspecified filler ratio of LDPE nanocomposites. Result shows that FFNN model has less percentage of error as compared to ANFS model for prediction of new filler ratio.
4) Volume resistivity of LDPE nanocomposite was decreased when increasing the percentage of nanofillers. Because of the interfacial distance between the particles is decreased when increasing the volume concentration of nanofillers and also overlapping occurs in some places. This effect increases the charge transport between the top and bottom surfaces which leads to a decrease in the volume resistance of the nanocomposites.
5) For LDPE with BatiO3 ceramic filler of 1 wt%, the dielectric constant of the nanocomposite decreases and LDPE with 3 wt% and 5 wt% of BaTiO3 ceramic filler increases slightly. This study shows that due to the strong bonding between charged particles, the interaction between the polymer chain and the nanoparticles leads to the formation of a fixed chain. This is the cause of the decrease in the dielectric constant.
6) Dissipation factor (tan delta) for LDPE doped with nano BaTiO3 ceramic filler increases when compared to neat LDPE. The tan delta value increased marginally when increasing the frequency. At LDPE with 5 %wt BaTiO3 ceramic filler, tan delta value is higher because of more number of nanoparticle presents on the surface, which increases the charge transfer due to more free charges in the system without barriers.
The author might want to thank members of faculty at the CIPET Kochi for their support in terms of preparing samples and the author would like to thank several colleagues at the CIPET Chennai for their support in terms of testing of different samples as per the IEC standard and also technical discussion related to fundamentals.
The authors declare that they have no conflict of interest
The data used to support the findings of this study are available from the corresponding author upon request.
- 1. W.C. Vittayakorn, D. Bunjonga, R. Muanghlu, and N. Vittayakorn, J. Ceram. Process. Res. 12[5] (2011) 493-495.
-

- 2. B.W. Lee and K.H. Auh, J. Ceram. Process. Res. 2[3] (2001) 134-138.
- 3. O.P. Thakur, C. Prakash, and D.K. Agrawala, J. Ceram. Process. Res. 3[2] (2002) 75-79.
- 4. Sonia, R.K. Patel, C. Prakash, and P. Kumar, J. Ceram. Process. Res. 12[6] (2011) 634-639.
-
- 5. R. Bounouioua, T. Bezzi, S.E. Berama, B. Boudine, and M.T. Benlahrache, J. Ceram. Process. Res. 20[2] (2019) 187-197.
-
- 6. S.H. Ahn, and K.W. Nam, J. Ceram. Process. Res. 18[9] (2017) 646-658.
-
- 7. S. Yasmin, S. Choudhury, M.A. Hakim, A.H. Bhuiyan, and M.J. Rahman, J. Ceram. Process. Res. 12[4] (2011) 387-391.
-
- 8. F. Krimech, S. Sayouria, and T. Lamcharfi, J. Ceram. Process. Res. 18[7] (2017) 536-542.
-
- 9. K.H. Lee and K.W. Nam, J. Ceram. Process. Res. 19[1] (2018) 75-79.
-
- 10. S. Park, S.W. Choi, and C. Jin, J. Ceram. Process. Res. 20[5] (2019) 464-469.
-
- 11. M. Vaseghi, S. Baghshahi, M. Mashhadi, and A. Nemati, J. Ceram. Process. Res. 20[5] (2019) 512-517.
-
- 12. V. Nevruzoglu, M. Manir, and G. Ozturk, J. Ceram. Process. Res. 21[2] (2020) 256-262.
-
- 13. S. Uddin, A. Zaman, I. Rasool, S. Akbar, M. Kamran, N. Mehboob, A. Ali, A. Ahmad, M.F. Nasir, and Z. Iqbal, J. Ceram. Process. Res. 21[6] (2020) 745-750.
-
- 14. D. Suastiyanti and Y.N. Maulida, J. Ceram. Process. Res. 22[1] (2021) 61-65.
-
- 15. A. Sachdeva, Aarushi, J.K. Anand, and R.P. Tandon, J. Ceram. Process. Res. 23[1] (2022) 99-108.
-
- 16. L. Cui, R. Niu, D. Wang, and W. Wang, J. Ceram. Process. Res. 24[2] (2023) 348-352.
-
- 17. S. Li, M. Ma, Y. Tian, R. Li, X. Hu, and P. Liu, J. Ceram. Process. Res. 24[4] (2023) 693-699.
-
- 18. W. Li, H. Hillborg, and U.W. Gedde, IEEE Trans. Dielectr. Electr. Insul. 22[6] (2015) 3536-3542.
-
- 19. A. Kumaravel, N. Ganesan, and R. Sethuraman, Mater. Struct. 16[16] (2007) 282-295.
-
- 20. M. Guo, M. Frechette, E. David, N.R. Demarquette, and J.C. Daigle, IEEE Trans. Dielectr. Electr. Insul. 24[2] (2017) 798-807.
-
- 21. S. Luo, S. Wang, Y. Tu, C. Wang, and S. Qin, IEEE Trans. Dielectr. Electr. Insul. 24[3] (2017) 1390-1395.
-
- 22. Y. Wang, C. Wang, W. Chen, and K. Xiao, IEEE Trans. Dielectr. Electr. Insul. 23[3] (2016) 1713-1722.
-
- 23. M. Pradhan, H. Greijer, G. Eriksson, and M. Unge, IEEE Trans. Dielectr. Electr. Insul. 23[2] (2016) 768-778.
-
- 24. F. Tian, Q. Lei, X. Wang, and Y. Wang, IEEE Trans. Dielectr. Electr. Insul. 21[1] (2014) 236-243.
- 25. A.T. Mohamed, Int. J. Electr. Power Energy Syst. 24 (2015) 469-475.
-
- 26. S. Haggag, L. Nasrat, and H. Ismail, J. Adv. Dielectr. 11[4] (2021) 1-10.
-
- 27. A. Doblies, B. Boll, and B. Fiedler, Polym. 11[2] (2019) 1-16.
-
- 28. J.W. Zha, Z.M. Dang, W.K. Li, Y.H. Zhu, and G. Chen, IEEE Trans. Dielectr. Electr. Insul. 21[4] (2014) 1989-1996.
-
- 29. IEEE Std 930-2004, (2005).
- 30. M.S. Khalil, IEEE Trans. Dielectr. Electr. Insul. 7[2] (2000) 261-268.
-
- 31. D. Ma, R.W. Siegel, J.I. Hong, and L.S. Schadler, J. Mater. Res. 19[3] (2004) 857-863.
-
- 32. Y. Murakami, M. Nemoto, and S. Okuzumi, IEEE Trans. Dielectr. Electr. Insul. 15[1] (2008) 290-293.
- 33. S.A. Qenawy, L.S. Nasrat, H.M. Ismail, and J.N. Asaad, IET Nanodielectr. 3[3] (2020) 74-80.
-
- 34. S. Singha and M.J. Thomas, IEEE Trans. Dielectr. Electr. Insul. 15[1] (2008) 12-23.
-
- 35. Y. Murata, Y. Murakami, M. Nemoto, and Y. Sekiguchi, In Proc. Ann. Rep. Con. Elect. Ins. Dielec. Phen. (CEIDP), (2005) 158-161.
- 36. S. Singha, and M.J. Thomas, IEEE Trans. Dielectr. Electr. Insul. 16[2] (2009) 531-542.
-
- 37. B. Zazoum, M.F. Frechette, and E. David, IEEE Trans. Dielectr. Electr. Insul. 23[5] (2016) 2505-2507.
-
- 38. Z. Zhang, Y. Gu, S. Wang, M. Li, J. Bi, and Z. Zhang, Composites, Part A. 74 (2015) 88-95.
-
- 39. J.S. Chahal and C.C. Reddy, IEEE Trans. Dielectr. Electr. Insul. 23[2] (2016) 683-691.
-
- 40. J.W. Zha, Z.M. Dang, W.K. Li, Y.H. Zhu, and G. Chen, IEEE Trans. Dielectr. Electr. Insul. 21[4] (2014) 1989-1996.
-
- 41. S.H. Ahn and K.W. Nam, J. Ceram. Process. Res. 18[11] (2017) 767-776.
-
 This Article
-
2024; 25(1): 104-118
Published on Feb 29, 2024
- 10.36410/jcpr.2024.25.1.104
- Received on Dec 22, 2023
- Revised on Jan 20, 2024
- Accepted on Jan 24, 2024
Services
- Abstract
introduction
materials
characterization
experimental setup
results and discussion
conclusions
- Acknowledgements
- Conflict of Interest
- Data availability statement
- References
- Full Text PDF
Shared
Correspondence to
- N. Rajasekaran
-
Department of Electrical and Electronics Engineering, K.S. Rangasamy College of Technology, Tiruchengode – 637 215, Tamil Nadu, India
Tel : 918056875723 Fax: 04288-274745 - E-mail: rajasekaran.n@ksrct.ac.in
Clean-Energy Research Institute(CRI), Hanyang University, 222, Wangsimni-ro, Seongdong-gu, Seoul, 04763, Korea
E-mail: jcpr@hanyang.ac.kr