


- Influence of SiO2 and Al2O3 compositional variations on glaze structure and properties
Ji-Soo Kim, Ung-Soo Kim*, Jung-Hoon Choi, Jin-Ho Kim and Kyu-Sung Han
Korea Institute of Ceramic Engineering and Technology, Icheon 17303, Republic of Korea
This article is an open access article distributed under the terms of the Creative Commons Attribution Non-Commercial License (http://creativecommons.org/licenses/by-nc/4.0) which permits unrestricted non-commercial use, distribution, and reproduction in any medium, provided the original work is properly cited.
Ceramic glazes are glassy coatings applied to ceramic product surfaces. Glaze compositions were formulated using the Unity Molecular Formula (UMF), and changes in the surface and mechanical properties, crystalline phases, ion leaching characteristics, and molecular structures were investigated. The results indicated that the properties of the glaze were influenced by SiO2 and Al2O3 additions as well as their respective ratios. An increase in the SiO2 content reduced glossiness, whereas an increase in the Al2O3 content enhanced glossiness. Crystalline phases were observed on the glaze surface of the samples with the highest SiO2/Al2O3 ratio of 10.5. Both α-quartz and α-cristobalite phases were formed in the heat-treated glazed surfaces, where an increase in the SiO2 content increased the cristobalite crystalline phase fraction. Raman spectral analyses of the glaze indicated that an increase in the SiO2/Al2O3 ratio correlated with an increased Q0 ratio. Additionally, the SiO2/Al2O3 ratio affected the hardness and ion leaching characteristics of the glaze, exhibiting contrasting trends with a transition point at approximately 8.5. The findings of this study can potentially serve as guidelines for predicting changes in the glaze properties resulting from compositional variations in the Stull diagrams.
Keywords: Glaze, Unity molecular formula, Properties, Crystalline phases, Molecular structure.
Ceramic glaze, commonly applied to products such as tableware, tiles, and sanitaryware, refers to a glassy coating formed on the surface of a ceramic monolith through a high-temperature firing process [1, 2]. Glaze composition, as well as firing temperature and atmosphere, impart various qualities such as luster, color, and texture, which in turn influence its classification. Glazes are used to create a protective layer on the surface of a product to prevent contamination and enhance its mechanical strength and chemical durability.
Numerous studies have been conducted to predict the characteristics of glazes based on their composition for tailored applications in product development [3-17]. Stull introduced the Unity Molecular Formula (UMF) in 1912 to define the correlation between the glaze composition and melting properties [3-5]. The UMF categorizes oxides into alkali, neutral, and acidic oxides based on their roles. A two-dimensional composition chart with acidic and neutral oxides on the x- and y-axes is obtained by converting all oxides into molar ratios and dividing neutral and acidic oxides by the sum of alkali oxides. Stull marked the glaze gloss characteristics and boundaries on this chart to allow prediction of the glaze melting properties from its composition (SiO2 to Al2O3 ratio).
Prior studies have consistently attempted to predict the physical and chemical properties and crystallization behavior of glaze molecular structures [6-17]. The fundamental structure of glass-forming SiO2 involves a network of SiO4 tetrahedra sharing oxygen atoms. The addition of flux elements, such as Na+, K+, and Ca2+, disrupts this network, creating non-bridged oxygen atoms. This reduction in the number of bridging sites lowers the connectivity of the glass network, thereby affecting the melting temperature and properties. Furthermore, at a constant flux concentration, changes in the SiO2/Al2O3 ratio affect the glaze structure and crystalline phase types and quantities. The molecular structure of heat-treated glaze at temperatures above 1200 ℃ is based on Si-O bonds forming a silicon-oxide framework. Decreasing the SiO2/Al2O3 ratio decreases the number of Si-O-Al bonds and increases the number of Si-O-Si bonds. These bond changes are related to the composition of the crystalline phases that precipitate within the glaze.
A reported methodology was employed in this study to investigate the correlation between the glaze composition and functional characteristics. The impact of the glaze composition on practical properties, such as the mechanical properties and leaching behavior, was analyzed. The glaze compositions were formulated using UMF, with the glazes for subsequent analysis fabricated by a firing process in an oxidizing atmosphere. Changes in the surface properties, mechanical properties, crystalline phases, and ion-leaching characteristics were examined based on the glaze composition. Raman spectroscopy was used to analyze the correlation between the glaze molecular structure and its characteristics. The findings could potentially serve as guidelines for predicting changes in the glaze properties resulting from compositional variations in Stull diagrams.
Five distinct glaze compositions were formulated using the UMF approach by maintaining a fixed alkaline and alkaline-earth oxide ratio of 3:7 and adjusting the proportions of silica (SiO2) and alumina (Al2O3) within the ranges of 0.425-0.525 and 3.5-4.5, respectively. Glaze compositions were selected based on prior research, which identified a glossy region characterized by minimal surface roughness to mitigate its impact on the leaching behavior [2].
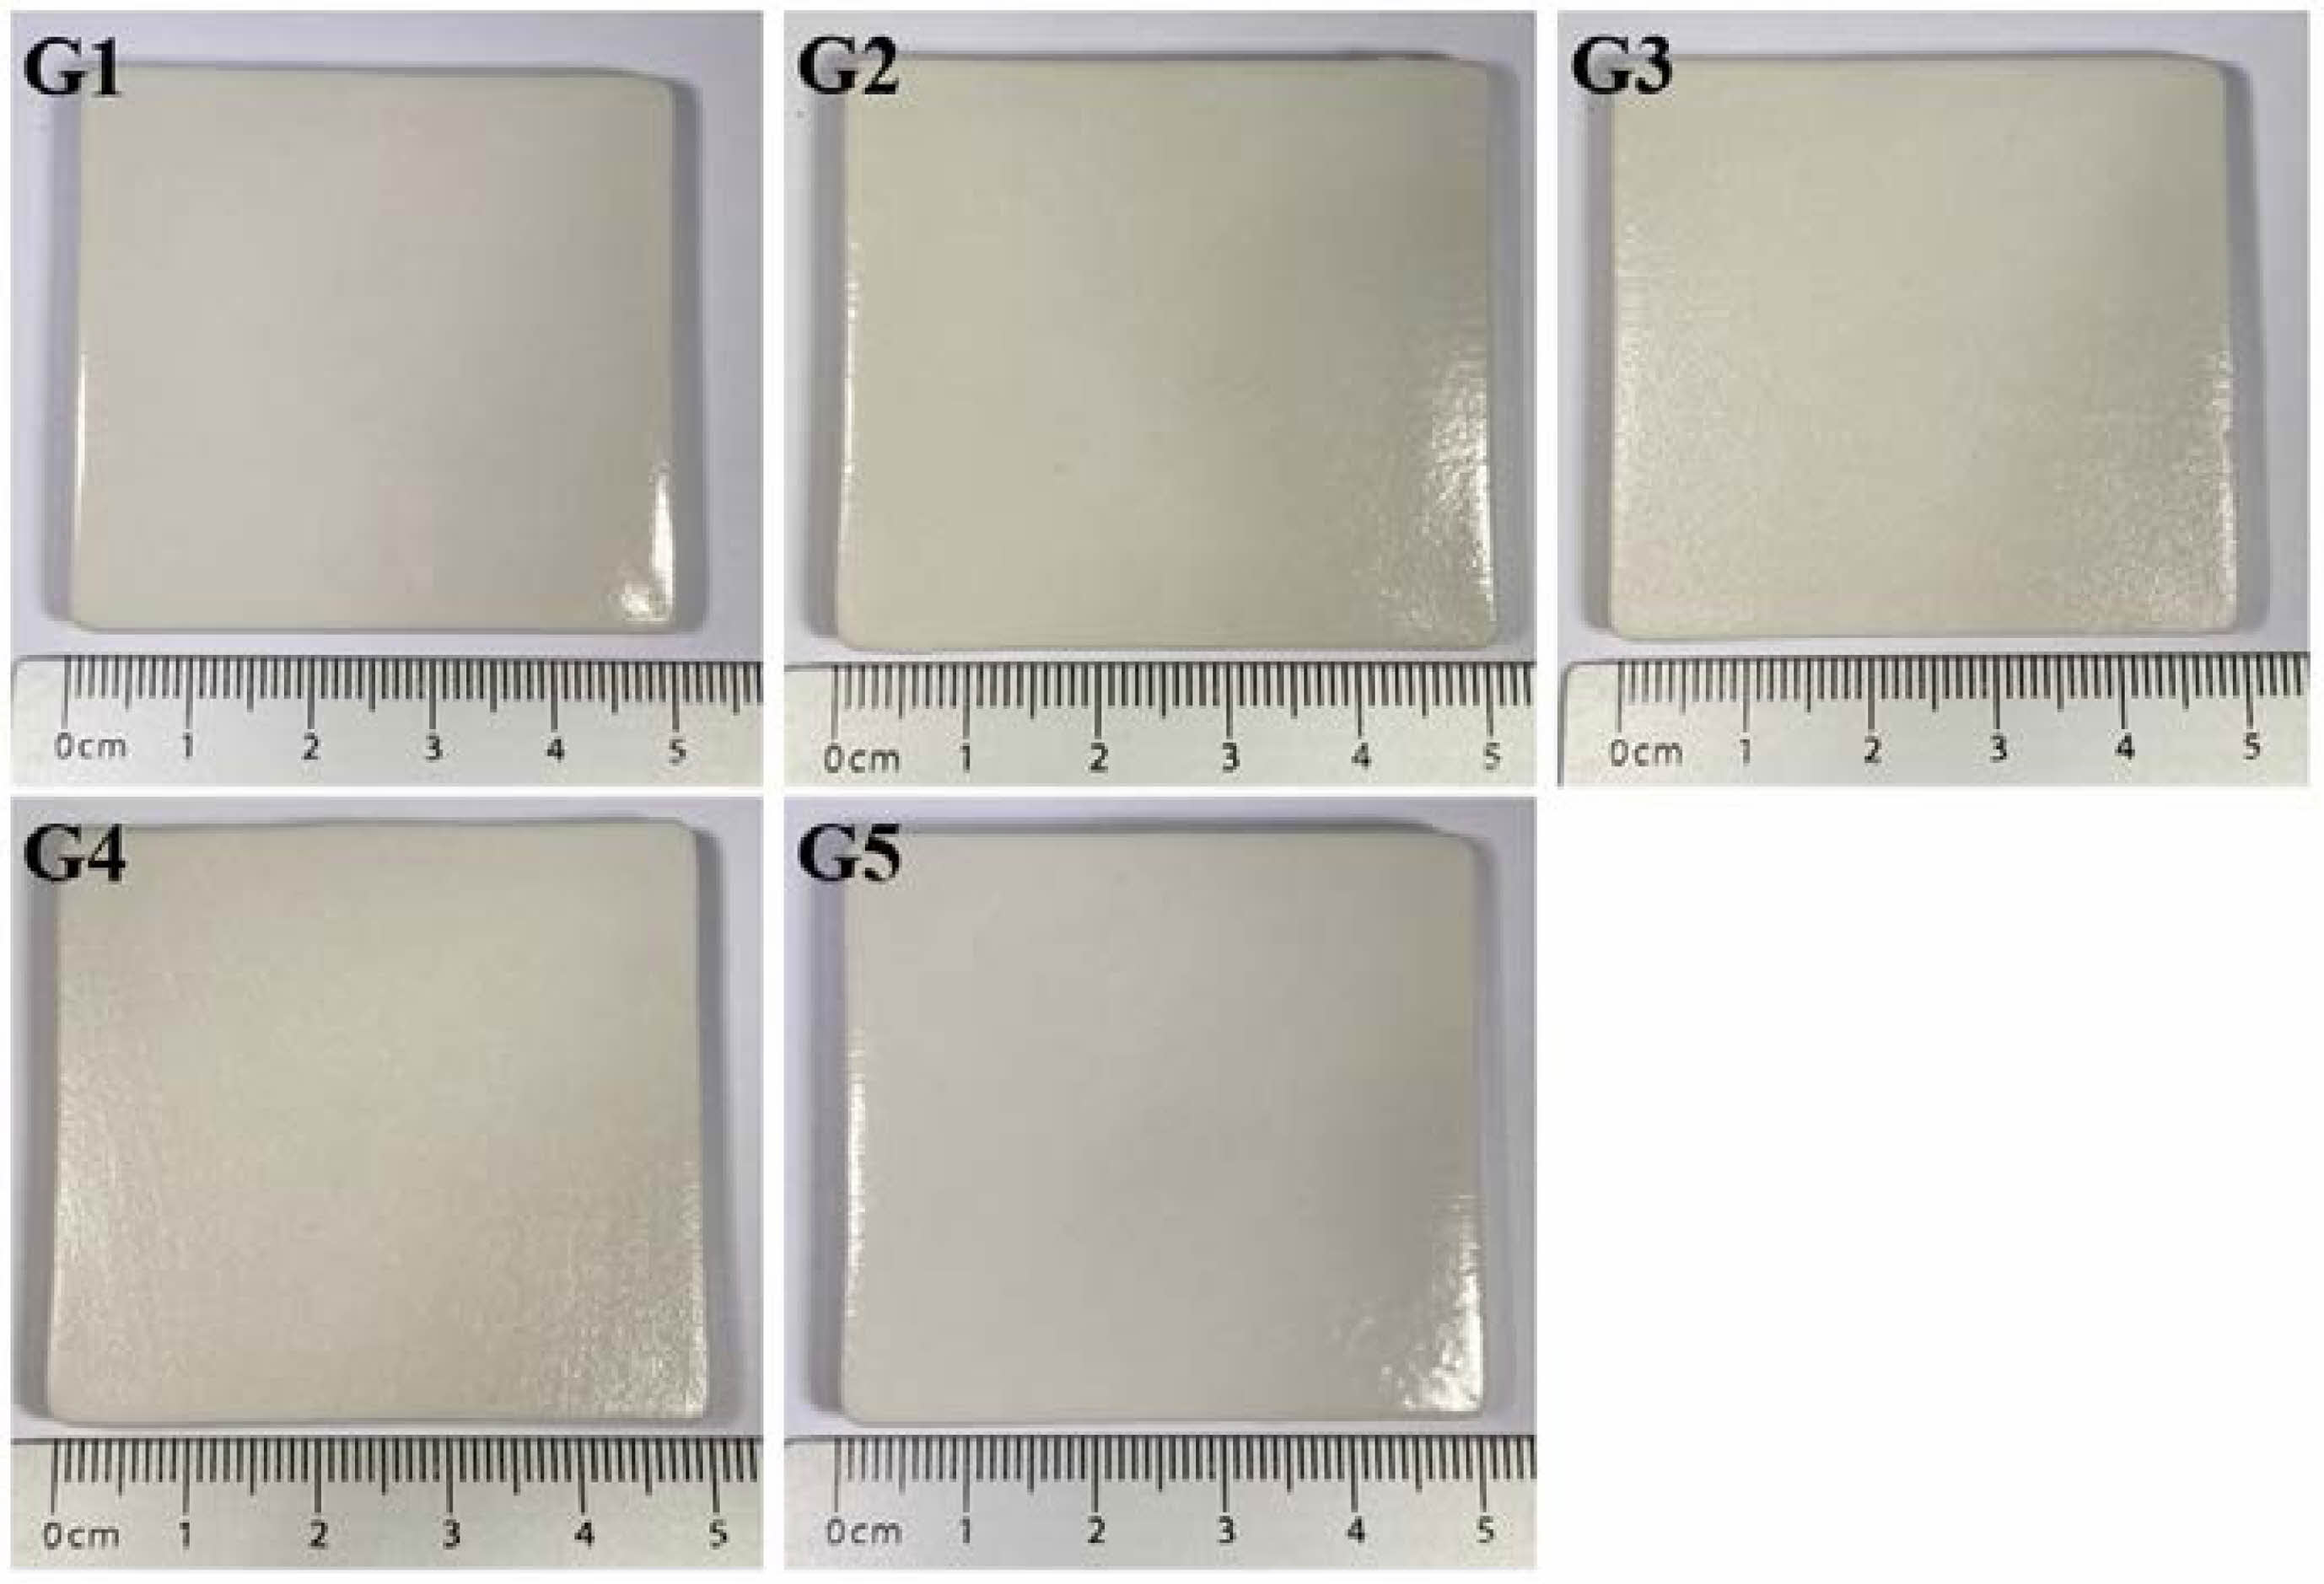
The glaze mixtures were created by accurately weighing and mixing feldspar, kaolin, Na2CO3, CaCO3, and quartz with distilled water in a 1:1 ratio, followed by ball milling for 24 h. Table 1 lists the glaze compositions. The formulated glazes were spray-coated onto 50 × 50 mm porcelain tiles. Subsequently, the tiles were fired in an oxidizing atmosphere at 1250 °C using a temperature increase rate of 3 °C/min; the tiles were held at this temperature for 1 h and then naturally cooled. Fig. 1 visually depicts the tile samples.
The glossiness of the glaze surfaces was quantitatively assessed by measuring the reflectance at a 60° angle using a micro-TRI-gloss meter (BYK Gardner, Germany). A laser confocal microscope (OLS40-SU, Olympus Corporation, Japan) was employed to analyze the surface roughness. A microhardness tester (Shimadzu HMV Series Micro Hardness Tester, Japan) was used to determine the surface hardness. The Vickers hardness values were obtained by applying a specific pressure to the glaze surface using a diamond tip, measuring the diagonal lengths of the resulting indentations (in micrometers), and subsequently interpreting the data according to the KS L1603 standard. The surface zeta potential was measured by immersing the glaze specimens in 40 ml of distilled water supplemented with monitor particles. A flat-surface zeta cell unit (ELSZ, Otsuka Electronics, Japan) was used to precisely measure the zeta potentials.
X-ray diffraction (XRD) analyses, employing a scan speed of 10°/min within the range of 10° ≤ 2θ ≤ 80°, were performed using a Dmax-2500 (Rigaku, Japan) to investigate the crystalline phases present in the glaze. Raman spectroscopy (inVia, Renishaw, UK) was employed to obtain spectral peaks from the glaze surfaces, which were subsequently subjected to fitting procedures using OriginPro software. The data was subjected to baseline subtraction, with all Raman lines modeled as Gaussian distributions to facilitate the analysis of the peak positions, intensities, and full widths at half maxima.
Cup-shaped specimens were prepared to analyze the leaching constituents of the glazes, with each specimen exposed to 45 ml of distilled water for 24 h, following which the leachates were subjected to elemental analysis using inductively coupled plasma optical emission spectrometry (Optima 5300DV, Perkin Elmer, USA).
|
Fig. 1 Photographs of the various glaze samples produced in this study. |
|
Table 1 (a) Mineralogical composition of the glazes (wt.%) and (b) UMF presentation of the glaze compositions. |
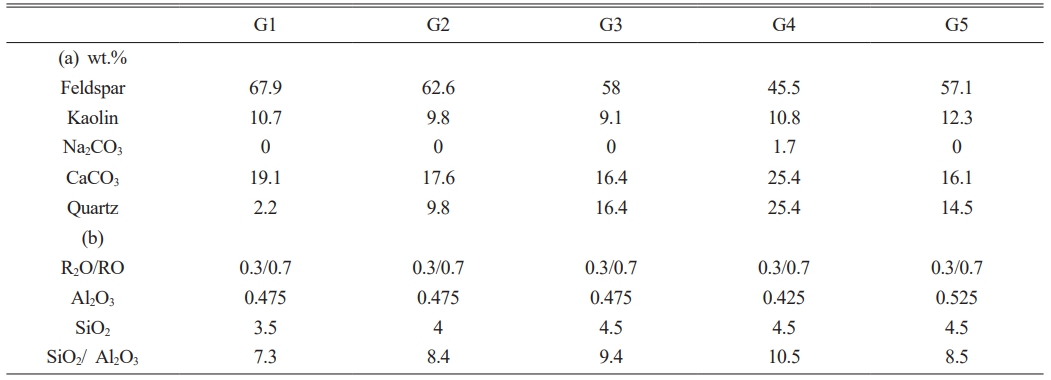
Figure 1 shows photographic images of the glaze specimens. G1, G2, G3, and G5 exhibited transparent glazes with a glossy appearance, whereas crystalline phases were visible on the glaze surface of G4. The SiO2/Al2O3 ratio of G4 was the highest at 10.5, as listed in Table 1. According to the Stull glaze texture map, all glaze compositions produced in this study were located within the glass formation boundary, suggesting that they should display the characteristics of glossy glazes. However, the distinct presence of crystals, as observed in G4, can be attributed to the incomplete melting of the starting materials due to lower processing temperatures than those in the study by Stull (1315 °C) [3].
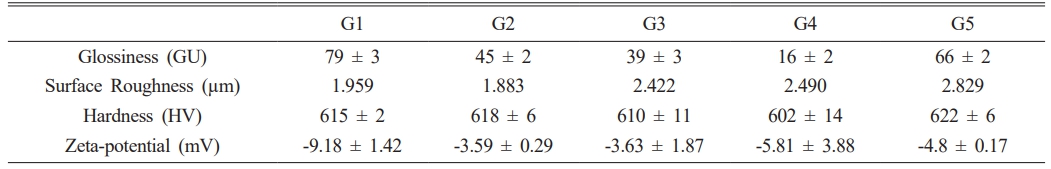
Table 2 summarizes the glaze characteristics. The glossiness decreased from 78.7 to 38.8 GU when the SiO2 composition increased from 3.5 to 4.5 under a constant Al2O3 concentration. Conversely, the glossiness increased from 15.7 to 66.2 GU when the Al2O3 content increased from 0.425 to 0.525 under a constant SiO2 concentration. G4, which had visible crystalline phases on the glaze surface, exhibited the lowest glossiness (15.7 GU). The surface roughness of the glaze did not show any correlation with the SiO2 or Al2O3 concentrations but remained relatively stable. The glazes exhibited minimal variations in the Vickers hardness within the composition range of this study, except for an increase from 602.9 to 621.9 HV when the Al2O3 composition was increased under a constant SiO2 concentration. The surface zeta potential of all glazes was consistently below -10 mV, with no direct correlation observed between the SiO2 and Al2O3 composition ratios.
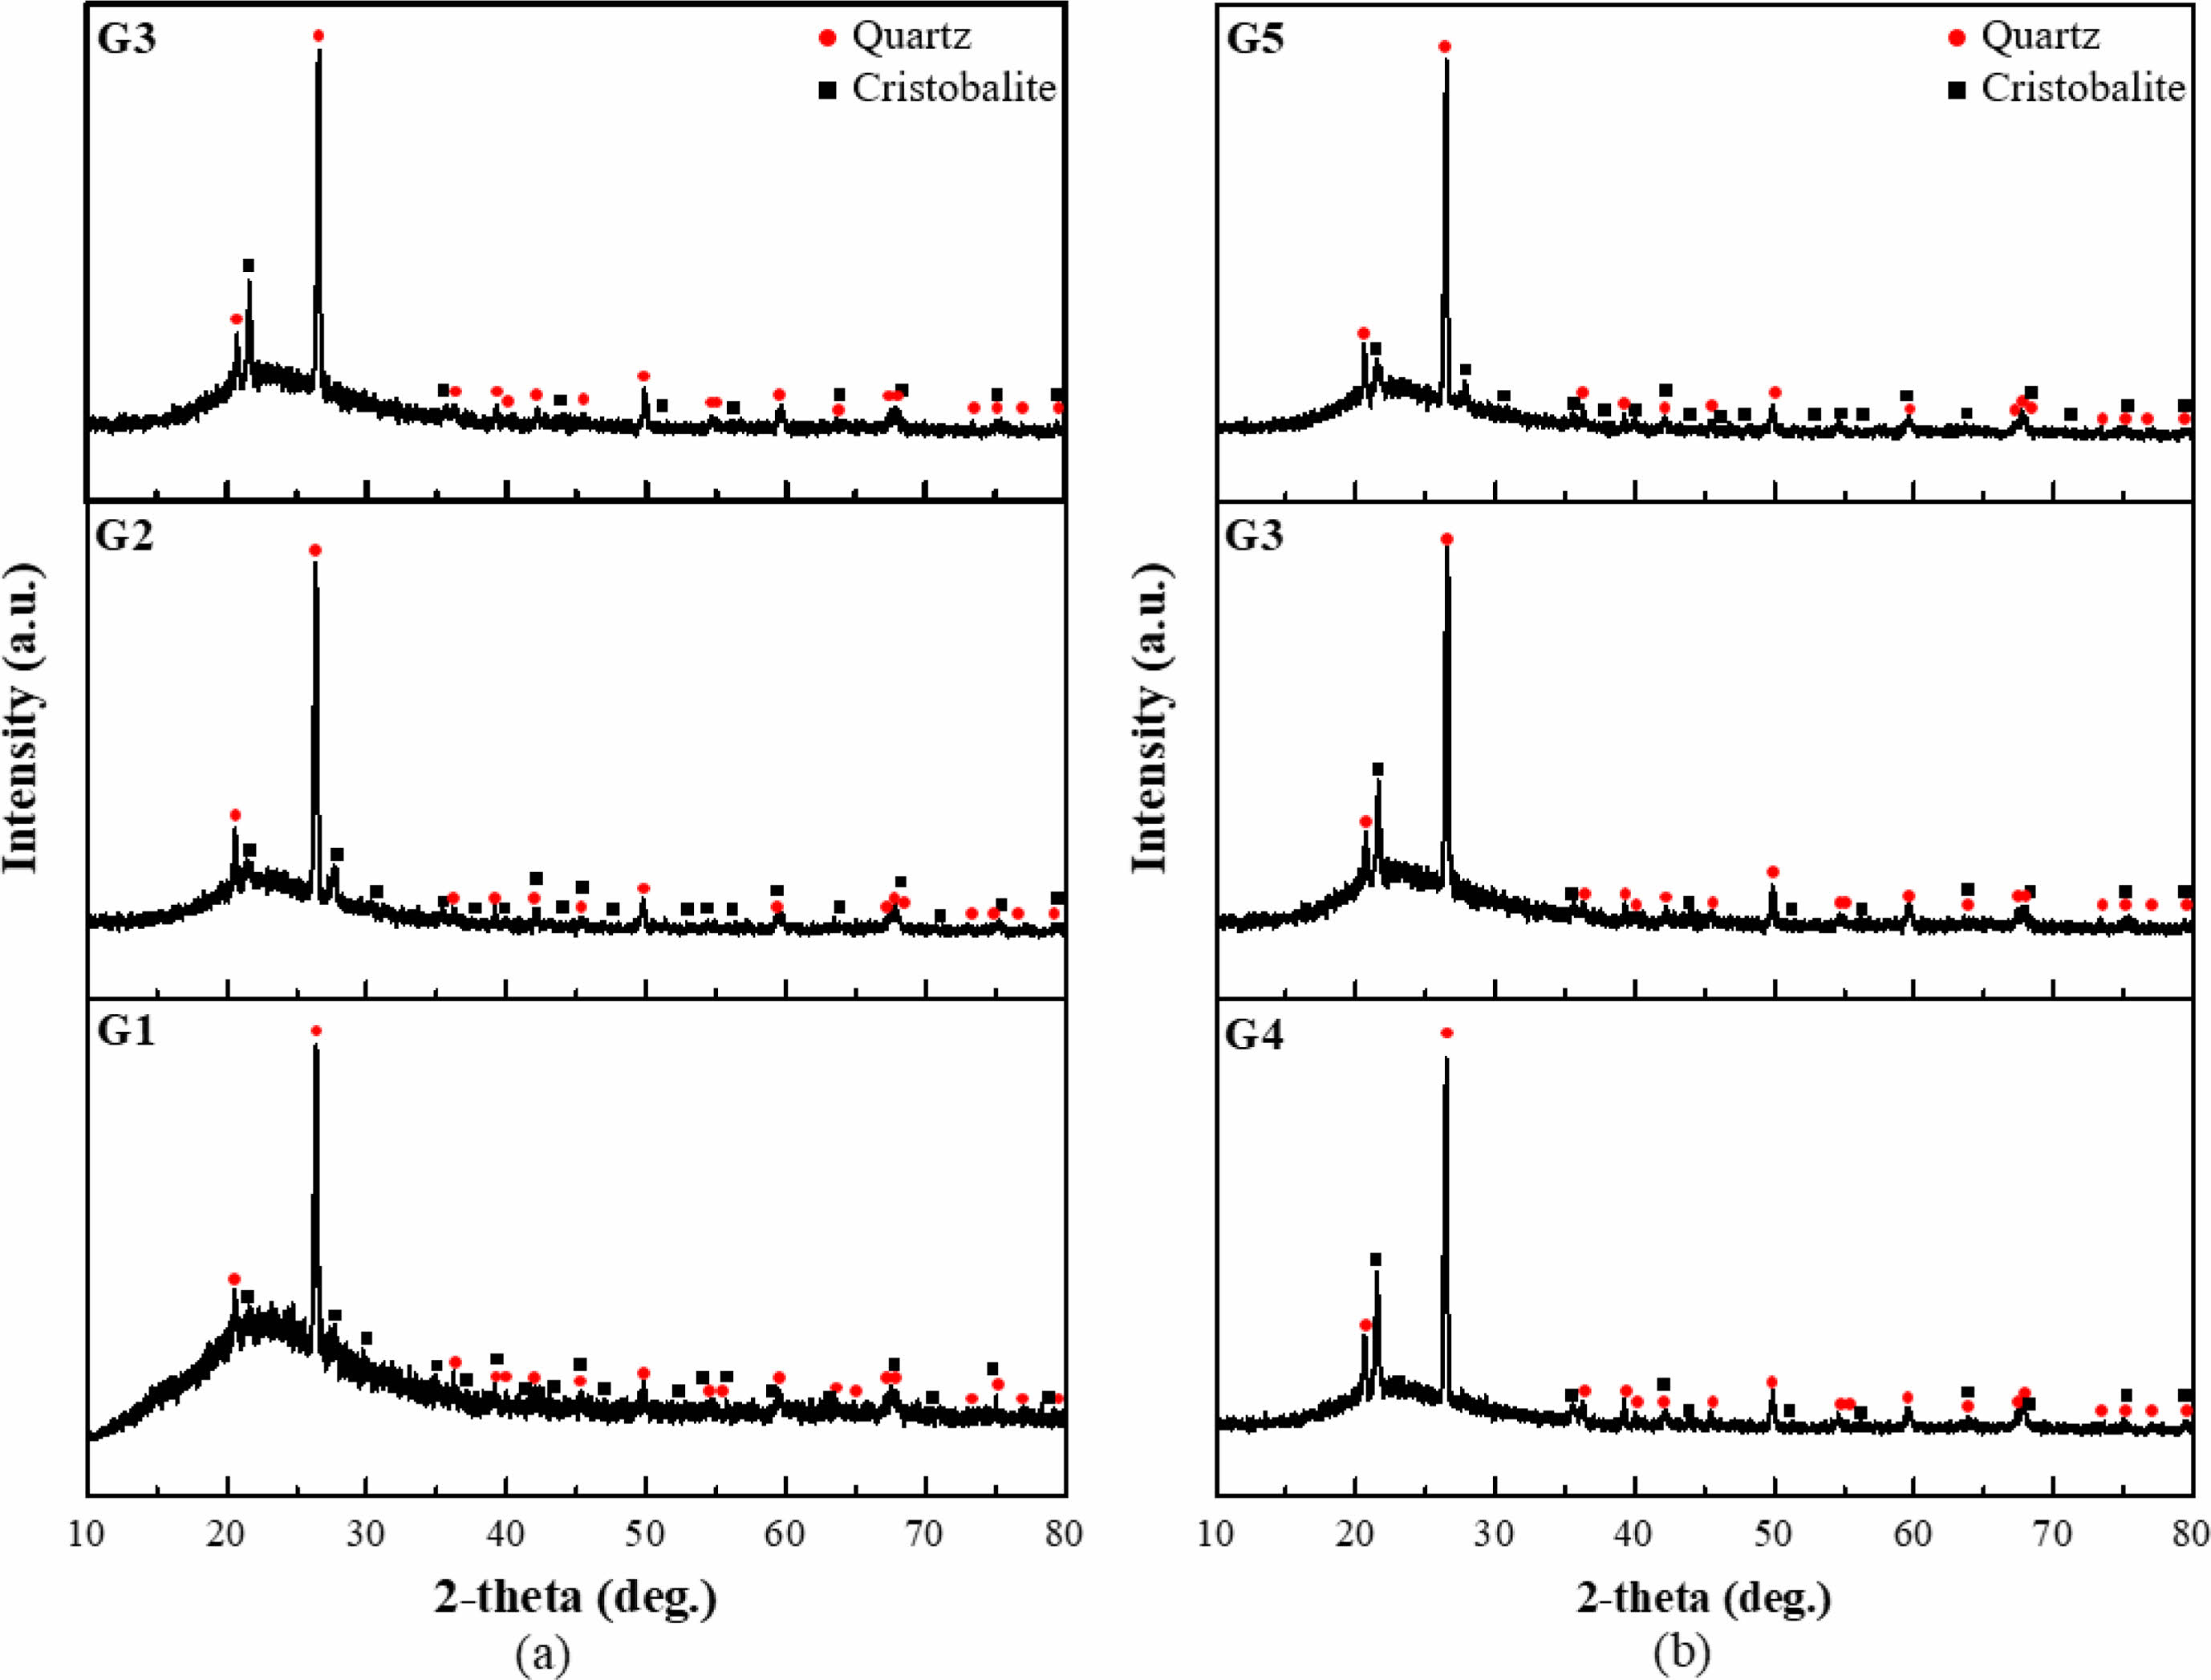
Figure 2 shows the XRD patterns of the glazes. All specimens exhibited a broad peak at 2θ = 20-30°, indicative of an amorphous phase. Additionally, crystalline phases of α-quartz and α-cristobalite were identified. The presence of α-quartz was attributed to the unmelted starting materials. The intensity of the cristobalite peaks increased with an increasing SiO2 content under a constant Al2O3 content. Similarly, an increasing Al2O3 content at a constant SiO2 composition decreased the cristobalite intensity.
α-quartz is a stable phase of SiO2 at low temperatures, which transforms into β-cristobalite at 1470 °C and transitions back to α-cristobalite when cooled [18, 19]. However, all samples in this study were fired at 1250 °C, which revealed that the formation of α-cristobalite is not solely temperature-dependent. α-cristobalite is considered a metastable phase that forms below 1470 °C and originates from quartz in the presence of alkali oxides [20, 21]. Components in the glaze composition, such as potent fluxing agents of Na2O and K2O, react with silica to activate the crystal lattice, enhance the reactivity, and facilitate the solid-state transformation from quartz to cristobalite. Such transformation to α-cristobalite is evident in glaze compositions containing fluxing agents.
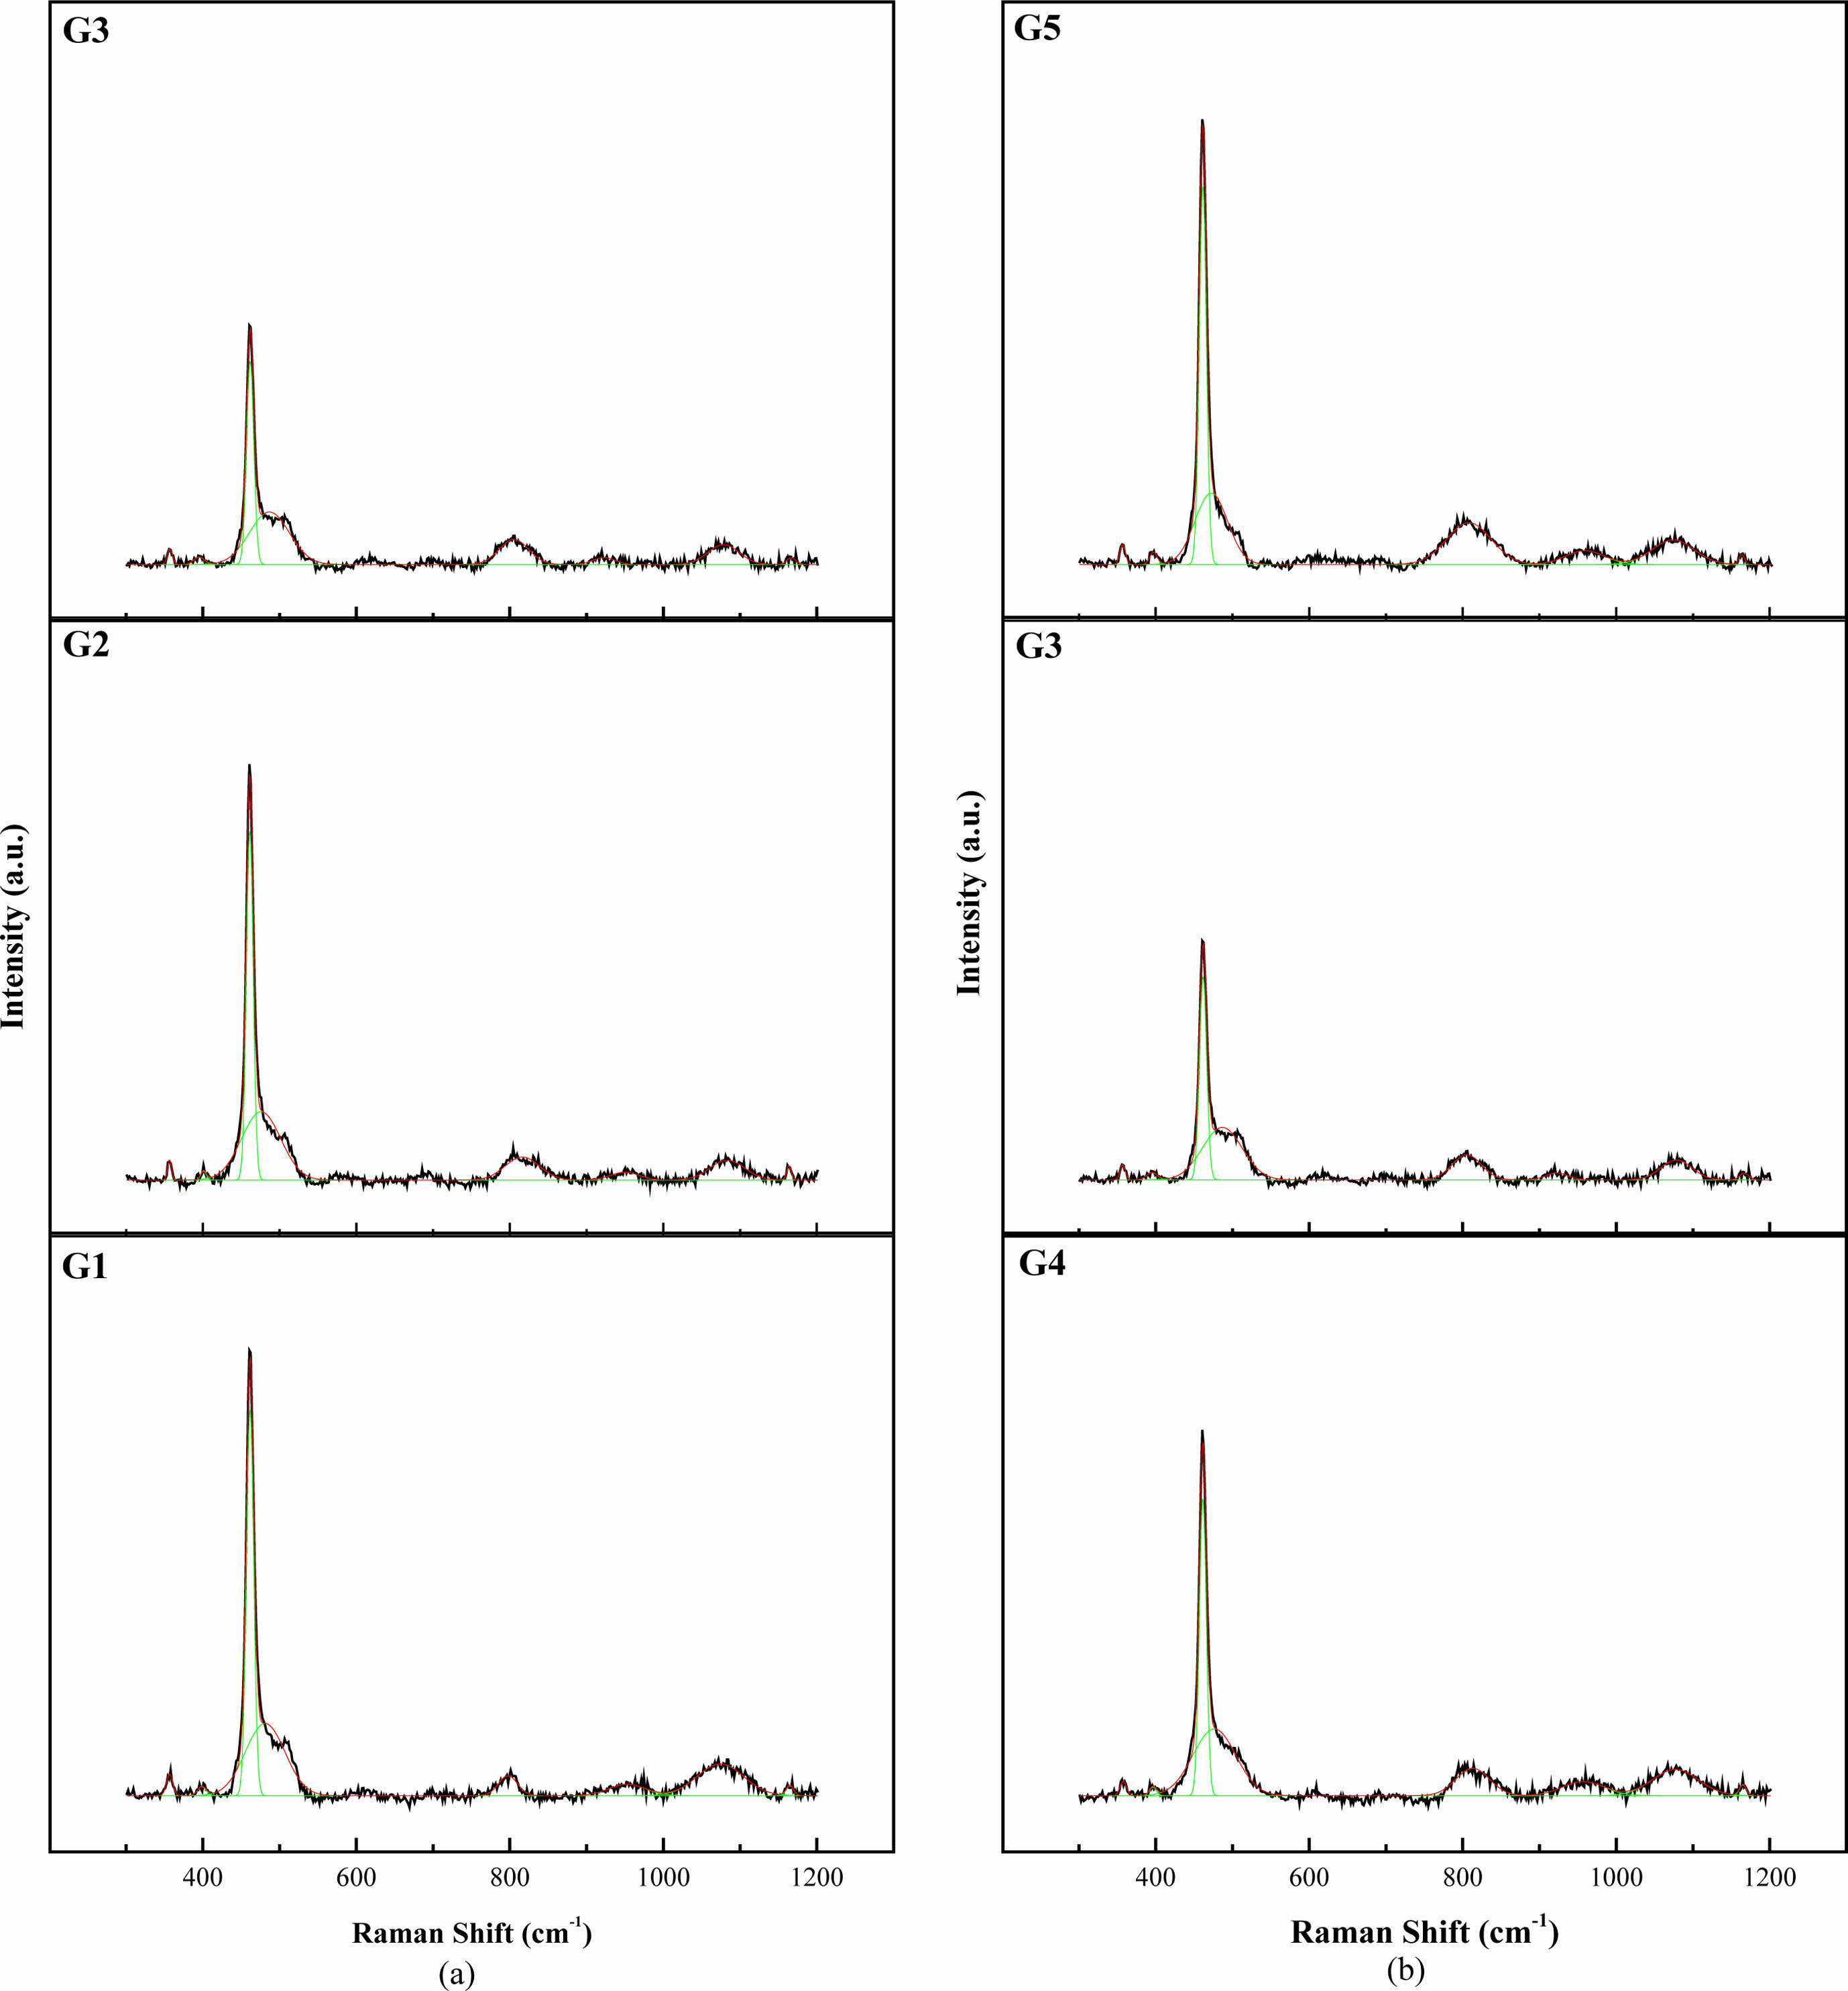
Figure 3 shows the Raman spectra of the glazes. All specimens exhibited a strong peak at approximately 464 cm-1, attributed to α-quartz formation. An increasing SiO2 content under a constant Al2O3 content decreased the intensity of the α-quartz peak, attributed to SiO4 tetrahedra vibrations. The Raman and XRD analysis results suggest that the added SiO2 transformed into cristobalite. In contrast, the Raman peaks associated with Al2O3 were not observed.
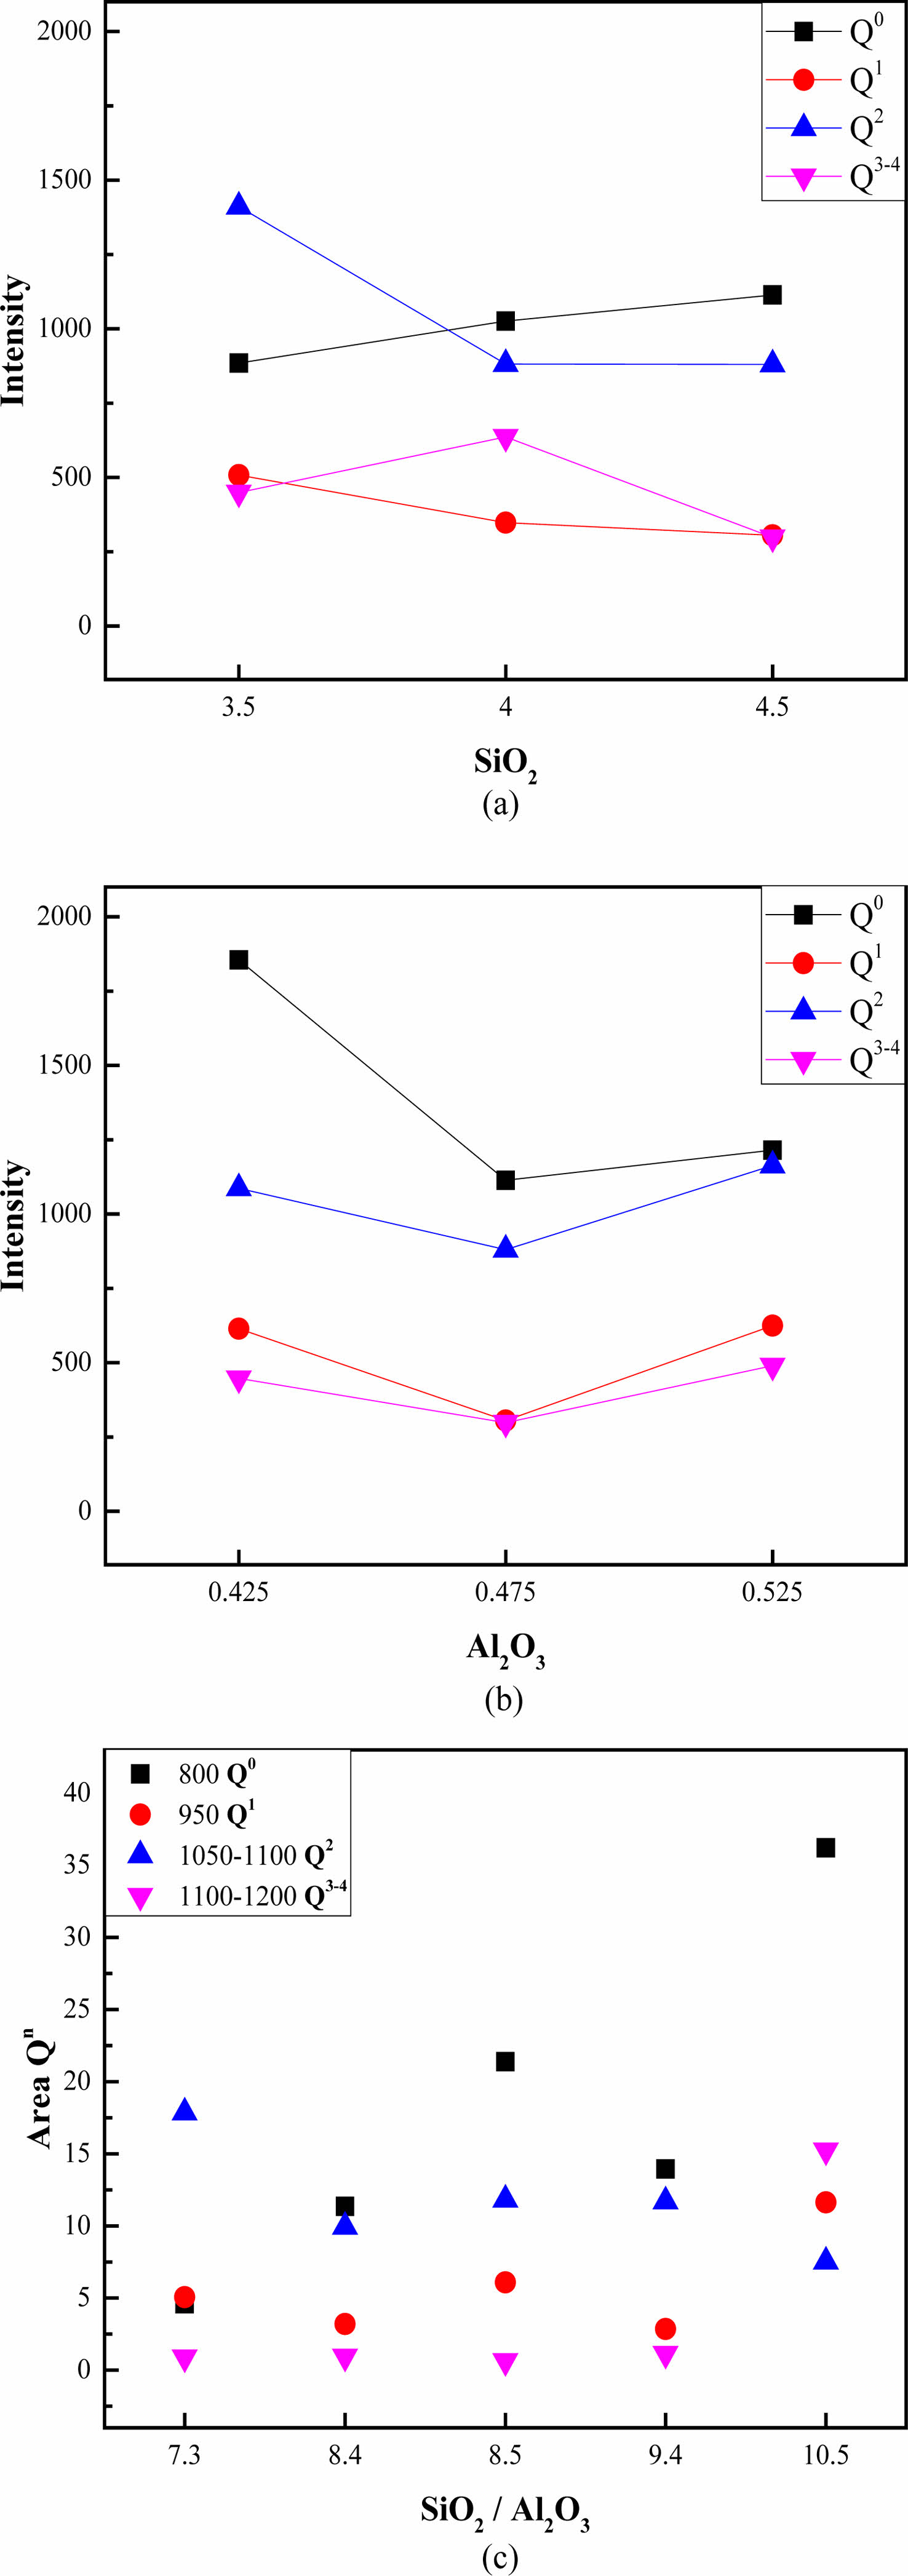
The Raman spectra of the glazes can be divided into three regions—low (~400-700 cm-1), intermediate (~700-900 cm-1), and high frequency (~900-1200 cm-1)—each offering distinct structural information. The high-frequency region provides insight into the bridging oxygen concentration, represented by stretching modes denoted as Qn, where Q0 (800-850 cm-1, SiO4), Q1 (950 cm-1, –SiO3), Q2 (1050-1100 cm-1, =SiO2), and Q3-4 (1100-1200 cm-1, ≡SiO, SiO2) are classified [8, 9, 13].
An increase in the SiO2 content under a constant Al2O3 content increased Q0 and decreased Q1 and Q2, whereas Q3-4 increased and then decreased (Fig. 4). Increasing the Al2O3 content under a constant SiO2 content decreased and subsequently increased Q0, Q1, and Q2. Q3-4 did not exhibit significant variation within the experimental range. An increase in the SiO2/Al2O3 ratio typically corresponded to an increase in the Q0 ratio.
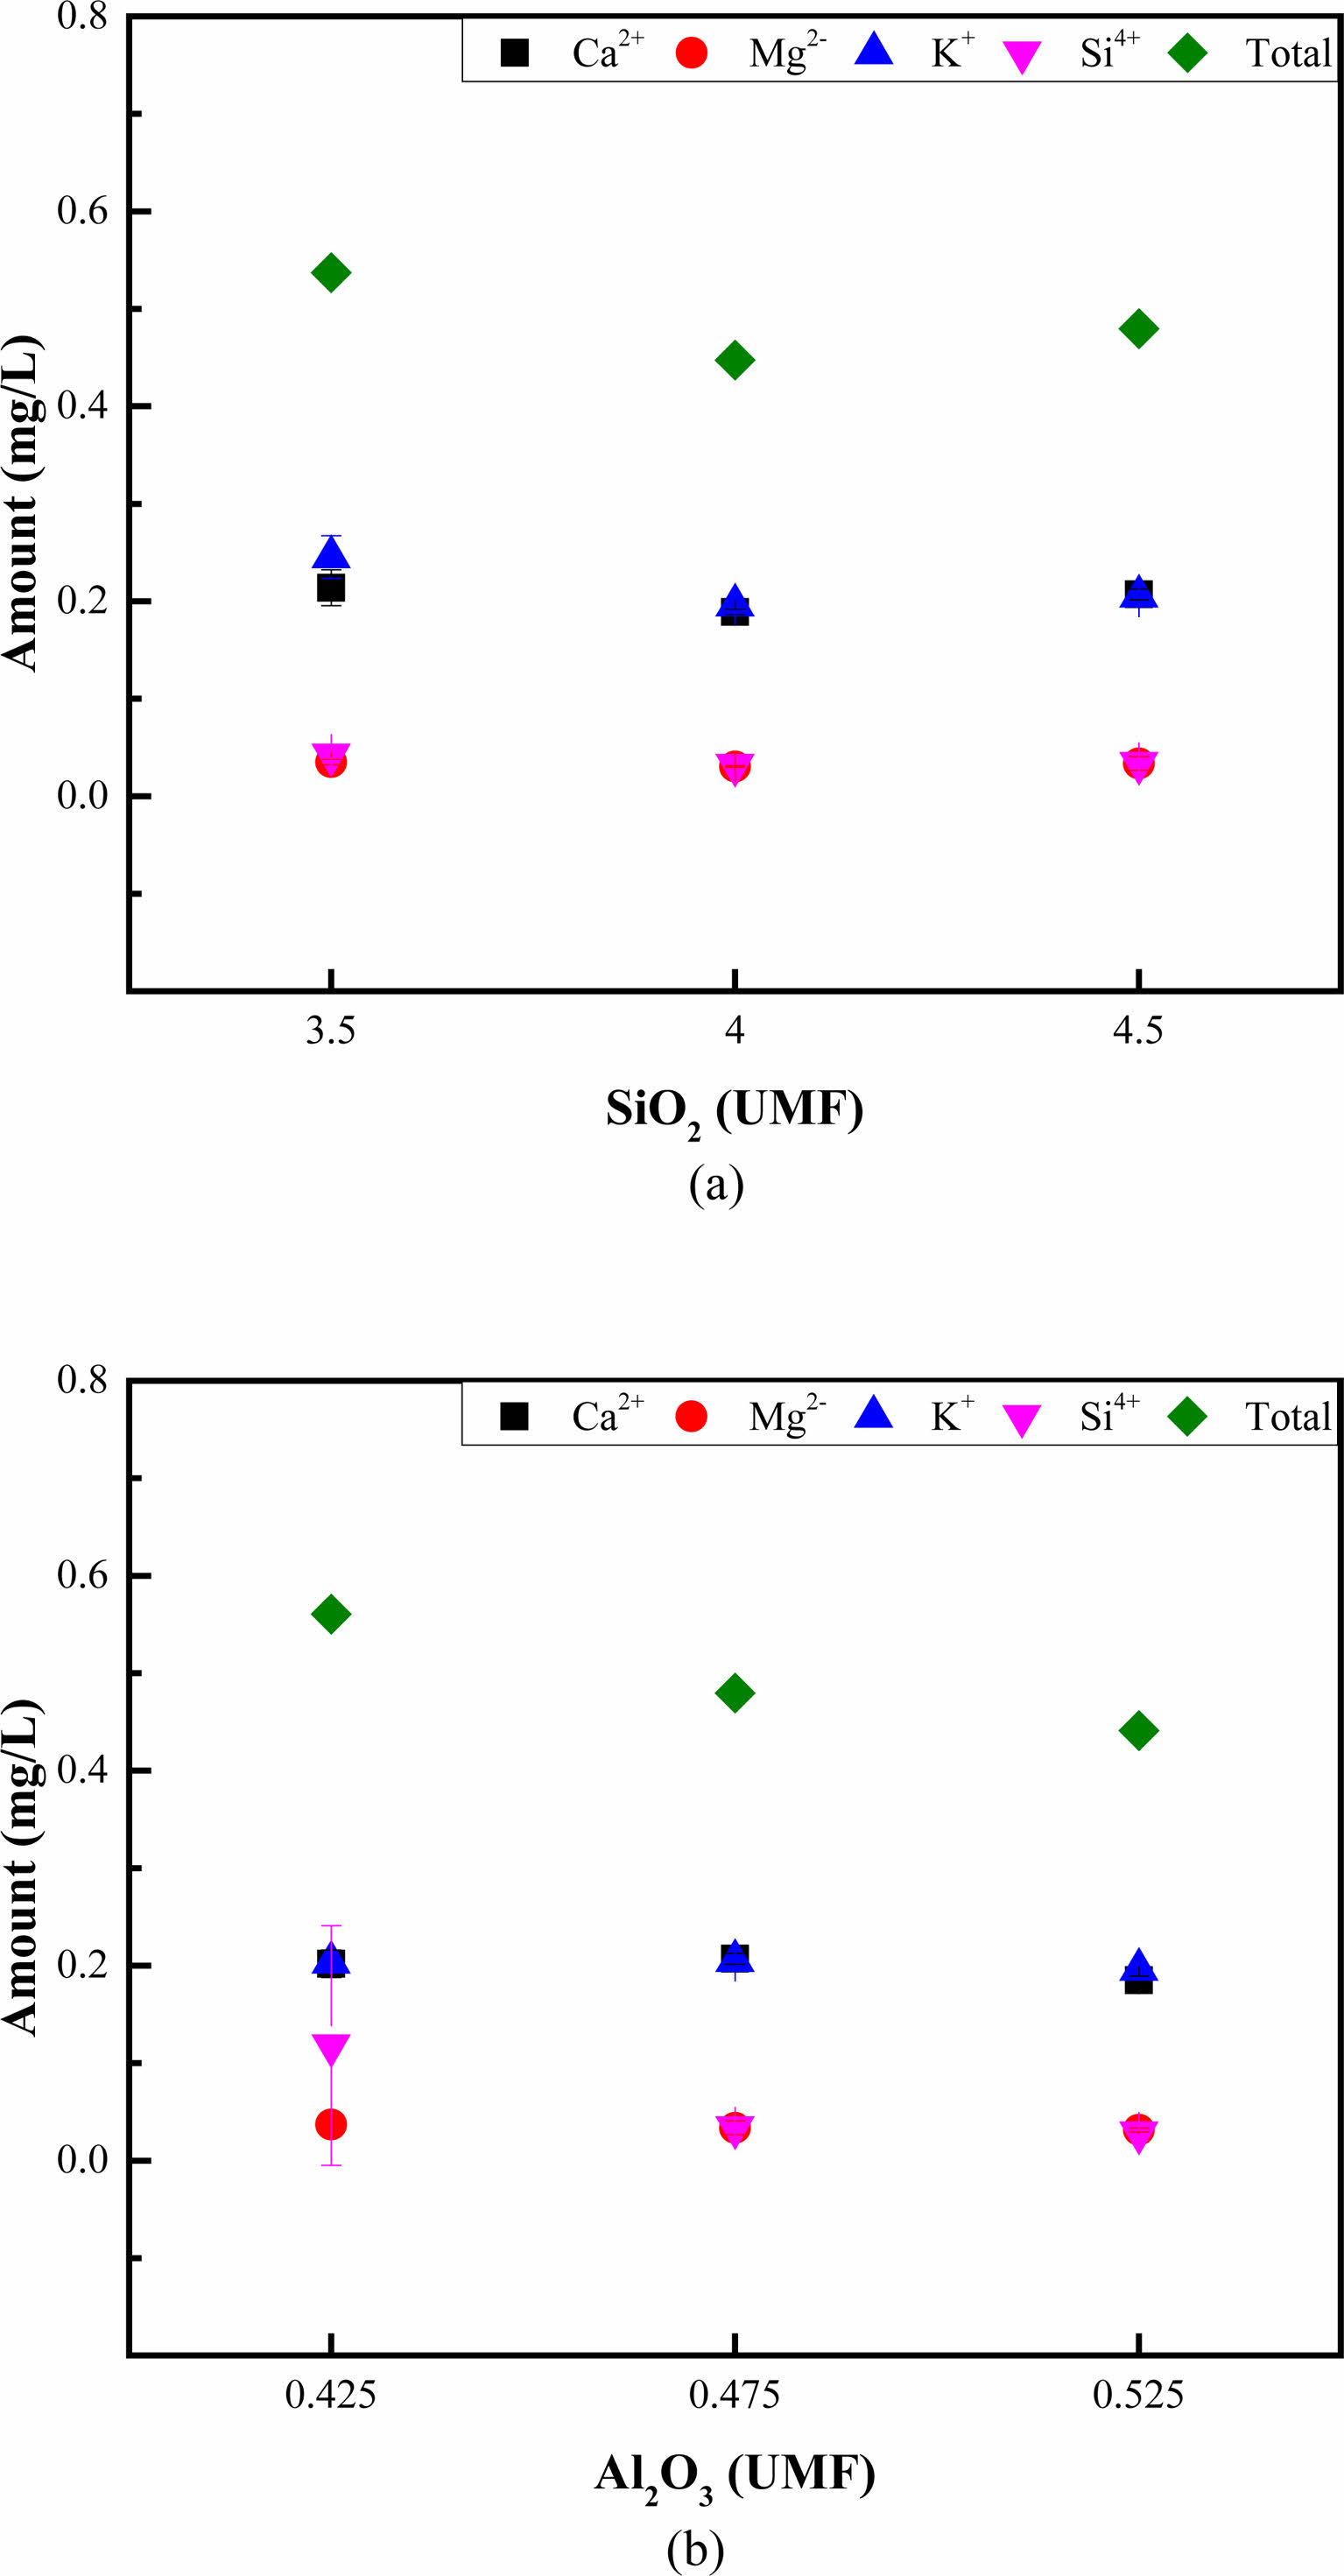
Figure 5 summarizes the ion-leaching behaviors of the glazes. The total ion leaching amount of the glaze decreased slightly with an increasing SiO2 or Al2O3 content, whereas the types of ions that leached remained consistent. An increasing SiO2 content seemingly exerted the most significant influence on the leaching of K+ ions. Conversely, an increasing Al2O3 content slightly decreased Si4+ ion leaching, influencing the total ion leaching. Among the glazes produced in this study, G4, which had the lowest Al2O3 content, exhibited the highest ion leaching, with the ions generally leaching in the order of K+, Ca2+, and Si4+.
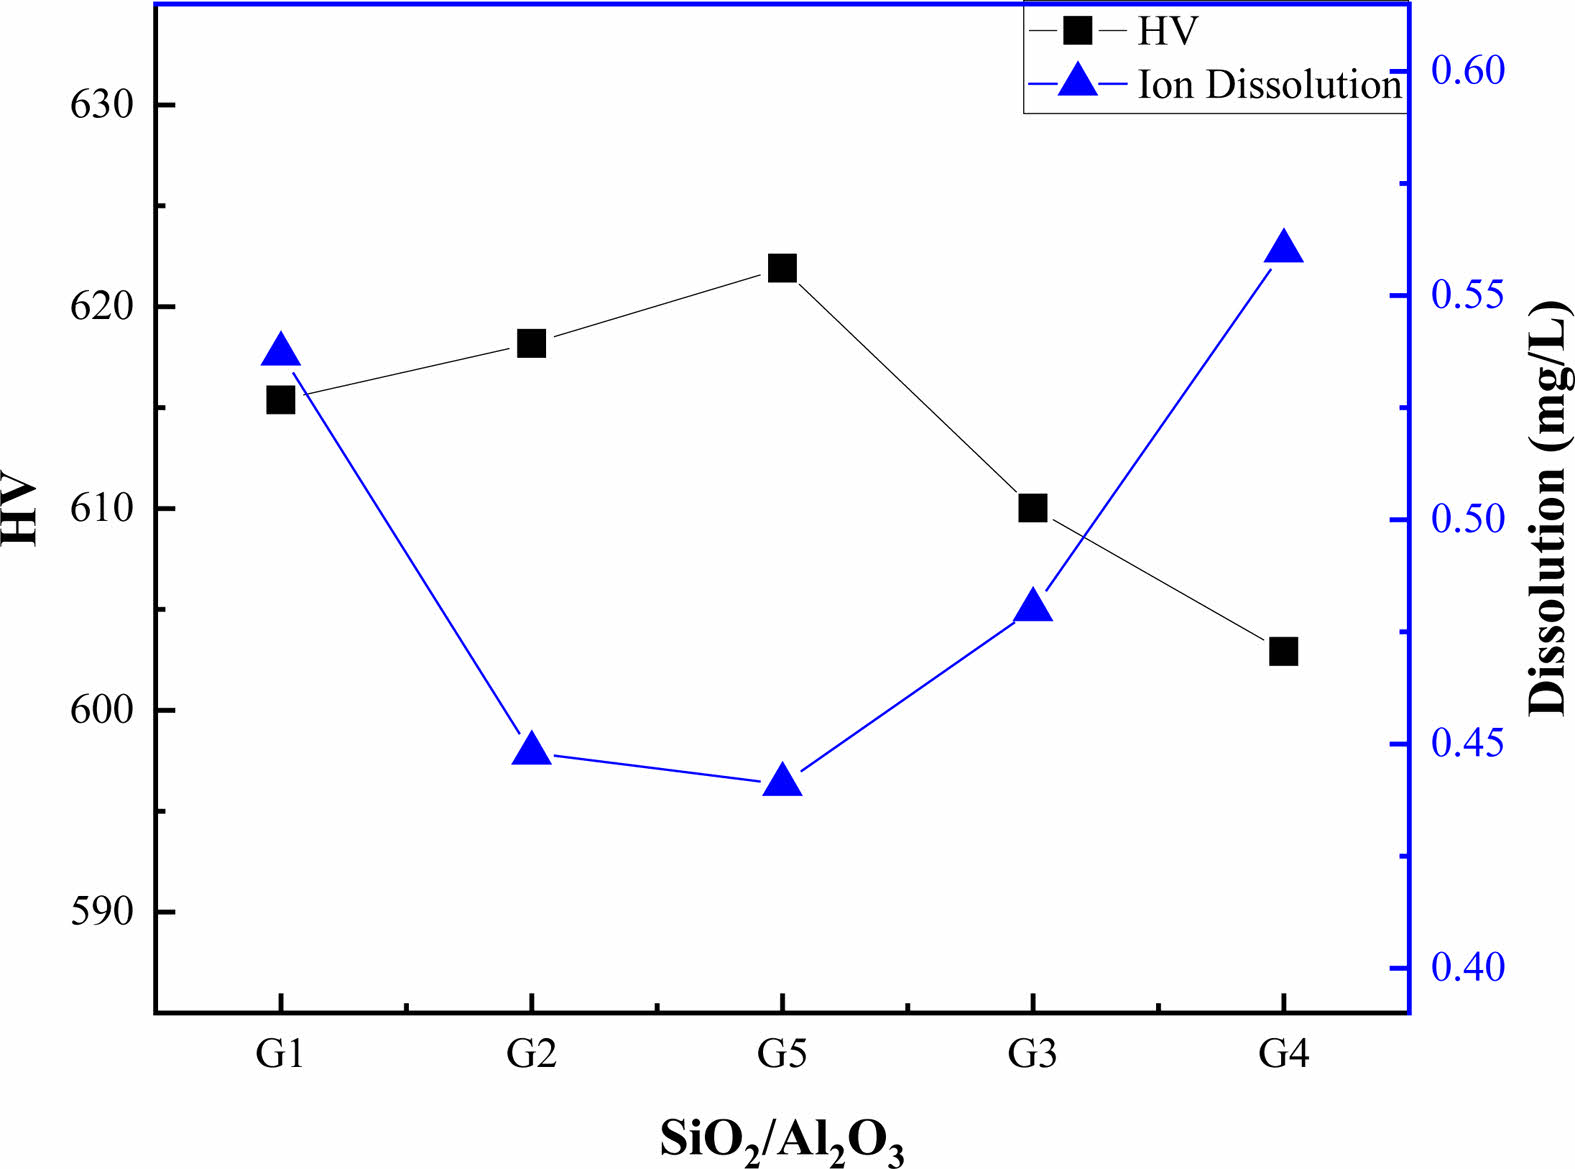
To analyze the correlation between the glaze composition and the characteristics, the glaze hardness and ion leaching concentration were plotted as a function of the SiO2/Al2O3 ratio, as shown in Fig. 6. The hardness and leaching of the glaze exhibited a reverse trend, i.e., the hardness initially increased, peaked at a SiO2/Al2O3 ratio of 8.5, and then decreased with an increasing SiO2/Al2O3 ratio. Conversely, the leaching of ions decreased, reached a minimum at a SiO2/Al2O3 ratio of 8.5, and then increased with an increasing SiO2/Al2O3 ratio.
The dissolution mechanism of glass can be explained by ion exchange, hydrolysis, and dissolution processes, leading to the formation of a layer on the glass surface that is depleted of alkali ions and enriched in silica [22-24]. In other words, the alkaline ions that balance the charge can be easily dissolved through ion exchange with an increasing number of non-bridged oxygen atoms in the glass. The evolving depolymerized network structure based on the SiO2/Al2O3 ratio at constant flux concentrations appears to affect the leaching concentration of the glaze.
|
Fig. 2 XRD patterns of the various glazes (a) under a constant SiO2 content and (b) under a constant Al2O3 content. |
|
Fig. 3 Raman spectra of the glazes produced in this study (a) under a constant SiO2 content and (b) under a constant Al2O3 content. |
|
Fig. 4 Bridging oxygen concentration as a function of (a) the SiO2 and (b) Al2O3 contents, and (c) SiO2/Al2O3 ratio. |
|
Fig. 5 Ion leaching behavior of the glazes produced in this study under constant (a) SiO2 and (b) Al2O3 contents. |
|
Fig. 6 Vickers hardness and ion dissolution rate of the glazes as a function of the SiO2 and Al2O3 ratio. |
|
Table 2 Measured glaze properties: Glossiness, surface roughness, hardness, and Zeta-potential. |
The UMF formula was used to investigate the surface characteristics, mechanical properties, crystal phases, ion release characteristics, and molecular structural changes in ceramic glazes based on their composition. The specimens produced in this study exhibited transparent glazes with glossy appearances. However, the G4 specimen with the highest SiO2/Al2O3 ratio of 10.5 exhibited visible crystal phases on the surface owing to incomplete melting of the starting materials, resulting in the lowest glossiness. The glossiness of the glaze decreased with an increasing SiO2 content in the glaze composition, whereas the glossiness increased with an increasing Al2O3 content.
XRD analyses confirmed that the glazes heat-treated at 1250 °C, along with α-quartz, formed a metastable phase of α-cristobalite due to the flux materials. The intensity of the cristobalite peak increased and decreased with increasing SiO2 and Al2O3 contents, respectively.
Strong peaks were observed at 464 cm-1 in the Raman spectra of all the glazed specimens, attributed to α-quartz formation. The α-quartz peak intensity decreased with an increasing SiO2 content under a constant Al2O3 content, indicating a phase transition to cristobalite. An analysis of the stretching compositions (Qn) representing the bridging oxygen numbers indicated that an increase in the SiO2/Al2O3 ratio generally increased the Q0 ratio.
The total ion release from the glazes decreased slightly with an increasing SiO2 or Al2O3 content, with K+, Ca2+, Mg2+, and Si4+ ions being released. Changes in the SiO2/Al2O3 ratio of the glazes revealed an inverse relationship between the hardness and ion release. The ion release concentration transitioned from a decrease to an increase, while the hardness transitioned from an increase to a decrease at the SiO2/Al2O3 ratio of 8.5. The findings of this study can potentially serve as guidelines for predicting the glaze property changes resulting from compositional variations in Stull diagrams.
This work was supported by the National Research Foundation of Korea (NRF) grant funded by the Korean government (MSIT; grant No. 2018M3C1B5052153).
- 1. C.W. Marmelee, in “Ceramic Glazes” (Cahners Books, 1973) p. 1-7.
- 2. H.G. No, S.M. Kim, U.S. Kim, and W.S. Cho, J. Korean Ceram. Soc. 53[5] (2016) 535-540.
-

- 3. R.T. Stull, in Transactions of the American Ceramic Society, XVI. March 1912, edited by H.F. Staley (The American Ceramic Society, 1914) pp. 62-70.
- 4. W.M. Carty, M. Katz, and J. Gill, in Materials & Equipment/Whitewares: Ceramic Engineering and Science Proceedings Volume 21, May 1999, edited by W.M. Carty (The American Ceramic Society, 2000) pp. 95-107.
- 5. H. Hecht and E. Cramer, in “The collected writings of Hermann August Seger” (Chemical Publishing Company, 1902) pp. 453-469.
- 6. A.K. Varsheneya, in “Fundamentals of Inorganic Glasses” (Academic Press, Inc., 1993) pp. 88-105.
- 7. T.K. Bechgaard, G. Scannell, L. Huang, R.E. Youngman, J.C. Mauro, and M.M. Smedskjaer, J. Non Cryst. Solids. 470 (2017) 145-151.
-
- 8. P. Colomban and O. Paulsen, J. Am. Ceram. Soc. 88[2] (2005) 390-395.
-
- 9. P. Colomban, J. Non Cryst. Solids 323[1-3] (2003) 180-187.
-
- 10. J. Partyka, M. Sitarz, M. Leśniak, K. Gasek, and P. Jeleń, Spectrochim. Acta A Mol. Biomol. Spectrosc. 134 (2015) 621-630.
-
- 11. M. Leśniak, J. Partyka, K. Pasiut, and M. Sitarz, J. Mol. Struct. 1126 (2016) 240-250.
-
- 12. A. Tunali, J. Ceram. Process. Res. 15[4] (2014) 225-230.
-
- 13. S.Y.R. López and J.S. Rodríguez, J. Ceram. Process. Res. 16[1] (2015) 162-168.
-
- 14. Ö. Cengiz and A. Kara, J. Ceram. Process. Res. 19[3] (2018) 189-197.
-
- 15. F. Karimi, S. Baghshahi, M.N. Khezrabad, and N. Riahi-Noori, J. Ceram. Process. Res. 20[4] (2019) 357-362.
-
- 16. Y. Rho, K. Kim, and J.H. Kim, J. Ceram. Process. Res. 21[Special 1] (2020) s9-s15.
-
- 17. J.U. Eom, S. Kang, K. Kim, and J.H. Kim, J. Ceram. Process. Res. 22[5] (2021) 568-575.
-
- 18. W.D. Kingery, H.K. Bowen, and D.R. Uhlmann, in “Introduction to Ceramics” (A Wiley-Interscience Publication, 1975) p. 87.
- 19. L. Pagliari, M. Dapiaggi, A. Pavese, and F. Francescon, J. Eur. Ceram. Soc. 33[15-16] (2013) 3403-3410.
-
- 20. W. Li, C. Xu, A. Xie, K. Chen, Y. Yang, L. Liu, and S. Zhu, Crystals. 11[12] (2021) 1481.
-
- 21. J. Kim and J.H. Lee, J. Korean Cryst. Growth Cryst. Technol. 4[3] (1994) 315-324.
- 22. J. Lee, H. Lee, and W.J. Chung, Ceramist. 25[3] (2022) 267-276.
-
- 23. G.S. Frankel, J.D. Vienna, J. Lian, J.R. Scully, S. Gin, J.V. Ryan, J. Wang, S.H. Kim, W. Windl, and J. Du, npj Mater. Degrad. 2 (2018) 1-15.
-
- 24. F. Angeli, D. Boscarino, S. Gin, G.D. Mea, B. Boizot, and J.C. Petit, Phys. Chem. Glasses. 42[4-5] (2001) 279-286.
 This Article
-
2024; 25(1): 65-71
Published on Feb 29, 2024
- 10.36410/jcpr.2024.25.1.65
- Received on Oct 13, 2023
- Revised on Dec 5, 2023
- Accepted on Dec 11, 2023
Services
- Abstract
introduction
experiments
results and discussion
conclusion
- Acknowledgements
- References
- Full Text PDF
Shared
Correspondence to
- Ung-Soo Kim
-
Korea Institute of Ceramic Engineering and Technology, Icheon 17303, Republic of Korea
Tel : +82-31-645-1422 Fax: +82-31-645-1485 - E-mail: ukim@kicet.re.kr
Clean-Energy Research Institute(CRI), Hanyang University, 222, Wangsimni-ro, Seongdong-gu, Seoul, 04763, Korea
E-mail: jcpr@hanyang.ac.kr