


- Effect of sintering temperature and ccalcium oxide content on microstructure and properties of geopolymer porous ceramics
Zhenfan Chena, Shaofeng Zhua,b,*, Qingqing Wanga and Xianbiao Wanga
aSchool of Materials Science and Chemical Engineering, Anhui Jianzhu University, Hefei, 230601, China
bAnhui Engineering Research Center for Building Energy Conservation, Hefei, 230022, ChinaThis article is an open access article distributed under the terms of the Creative Commons Attribution Non-Commercial License (http://creativecommons.org/licenses/by-nc/4.0) which permits unrestricted non-commercial use, distribution, and reproduction in any medium, provided the original work is properly cited.
Geopolymer porous ceramics with high porosity were prepared using casting process with metakaolin as the main raw material and coconut diethanolamide as the blowing agent. The effects of sintering temperature and calcium oxide content on the phase composition, microstructure and physical properties of geopolymer porous ceramics were investigated through X-ray diffraction, scanning electron microscopy, etc. The results show that for the samples without calcium oxide, the compressive strength and volume shrinkage gradually increase, while the open porosity gradually decreases with the sintering temperature increases. After the green body was sintered at 1200 ℃ for 2 hours, porous ceramic product with compressive strength of 22.9 MPa, open porosity of 41.8%, and leucite as the main phase was obtained. The addition of calcium oxide in the preparation process not only accelerate the solidification of geopolymer gel slurries and make the pores distribute in the height direction more evenly, but also acts as a modifier to lower the crystallization temperature of leucite in the sintering process. When the relative mass of calcium oxide to metakaolin is 6%, after sintering at 1000 ℃ for 2 hours, porous ceramic products with uniform pore size distribution containing leucite phase can be obtained. In addition, the potential of geopolymer porous ceramics as adsorbing material was validated by adsorption experiment of Pb(Ⅱ) solution.
Keywords: geopolymers, porous ceramics, sintering process, calcium oxide
Porous ceramics not only have good chemical stability, high stiffness, and other excellent characteristics over ordinary ceramics, but also have unique properties due to their pore structure, such as low density, large specific surface area, small thermal conductivity, etc [1, 2]. These properties make porous ceramics widely used in adsorbing material [3], filtration materials [4], catalyst carriers [5], and thermal insulators [6].
Porous ceramics are prepared in a variety of ways, of which the physical foaming method is widely used due to its simple process and low cost. The physical foaming method refers to mechanical stirring by adding foaming agent or directly adding foam to make the slurry solidified to form green bodies, and then sintered to produce porous ceramic products [7, 8]. However, this method has the problem of poor stability of foam in slurry [9, 10]. Rapid solidification of slurry can reduce the aggregation of foam in slurry. Geopolymers are high-strength inorganic materials formed by aluminosilicates under alkaline excitation conditions, with covalent and ionic bonds as the main bonds [11-13], can be used as a gel system combined with foaming method to prepare geopolymer green bodies containing foam, and then the amorphous foamed geopolymer can be transformed into the crystalline geopolymer porous ceramics with higher mechanical strength through heat treatment [14, 15]. In the process of geopolymerization, the formation of sol and dehydration reaction can be fast by some means to stabilize the foam. Therefore, the introduction of foam into the geopolymer slurry is expected to prepare porous ceramics with high strength and high porosity.
He et al. [16] obtained a ceramic product with the relative density of 93% and the flexural strength of 70 MPa by sintering the geopolymer green bodies at 1000 ℃ for 2 hours. Xie et al. [17] crushed and ground the geopolymer into powder, and formed the geopolymer ceramic green bodies through cold isostatic pressing. After the green bodies were sintered at 1200 ℃ for 3 hours, ceramic products with the relative density of 96% and the bending strength of 140 MPa were obtained. Kovářík et al. [18] sintered polyurethane foam with adhesive geopolymer slurry at 1300 ℃ for 4 hours, they obtained porous ceramic with open porosity of 78.8% and compressive strength of 0.85 MPa. In previous studies, there have been more studies on the preparation of dense ceramics using geopolymer, while there have been less studies on the preparation of porous ceramics using geopolymer.
In this paper, metakaolin was used as the main raw material to form geopolymer gel slurry by alkali excitation, which was poured into shape after adding Coconut diethanolamide as foaming agent and calcium oxide as modifier, and porous ceramics samples were obtained after being sintered. Coconut diethanolamide, as a non-ionic surfactant possess hydrophilic groups without electric charges, the electrostatic repulsion between this non-charged hydrophilic group and the ions (K+, Al3+, SiO42-) in the geopolymer slurry is weak, so coconut diethanolamine has better foaming performance and better foam stability in the geopolymer [19]. Meanwhile, Coconut diethanolamide has lower toxicity, it is a kind of environmentally friendly foaming agent [20]. Therefore, in this paper, coconut diethanolamide was selected as the foaming agent. The added amount of calcium oxide selected in this paper is 0-6% of the relative mass of metakaolin, and higher amounts of calcium oxide added may lead to an increase in the temperature of the geopolymer slurry, resulting in uneven expansion of the green bodies and causing cracking of the sample after molding; Moreover, the higher the mass fraction of Ca2+ in the system, the higher the coordination number of calcium oxygen coordination polyhedra, resulting in an increase in the distance between [SiO4] tetrahedral monomers and [AlO4] tetrahedral monomers, so the degree of polymerization decreases, and the stability of the geopolymer obtained deteriorates [21, 22], resulting in a low strength of the obtained green body, which may lead to sample collapse during sintering.
The effects of sintering temperature and the calcium oxide content on the phase composition, microstructure, and physical properties of geopolymer porous ceramics prepared by the above method were studied. Furthermore, the potential of the prepared geopolymer porous ceramics as high-performance adsorbing material was demonstrated by adsorption experiment of Pb(Ⅱ).
Raw materials
The solid raw material used in the experiment is metakaolin, which is made by calcining kaolin (Industrial pure, Tianjin Zhiyuan Chemical Reagent Co., Ltd.) at 800 ℃.
The average particle size and specific surface area of metakaolin are 8.5 μm and 0.429 m2/g respectively. The molar ratio of SiO2 to K2O in the potassium silicate solution (Chemically pure, Zhengzhou Borun Chemical Reagent Co., Ltd, China) used in the experiment is 3.3.
Preparation for geopolymer ceramics
The steps to prepare porous geopolymer ceramics as follow: The potassium hydroxide solution of 12 mol/L was added into potassium silicate solution to adjust the molar ratio of SiO2 and K2O to 1.2, and alkali activator solution was obtained.
1.91 g of polyacrylic acid (Analytical reagent, Shanghai Aladdin Biochemical Technology Co., Ltd, China) and 32 g of metakaolin were added to 22.4 g of alkaline excitation solution and stirred for 30 minutes at 500 rpm to obtain geopolymer slurry. 2.6 g of coconut diethanolamide (Technical grade, Zhengzhou Kaiyuan Chemical Co., Ltd, China) were added to the geopolymer slurry, stirred at 800 rpm for 7 minutes, then calcium oxide was added to the geopolymer slurry, and stirred for 3 minutes.
The geopolymer slurry was injected into a mold with a size of Φ20 mm×20 mm and cured at 70 ℃ for 24 hours. After demolding and then drying, the porous polymer ceramic bodies was obtained. The green bodies were denoted as C0, C2, C4, and C6 based on the relative mass fractions of calcium oxide in metakaolin at 0%, 2%, 4%, and 6%, respectively. The green bodies were placed into a high-temperature furnace (KSL-1700X, Hefei Kejing Material Technology Co., Ltd, China), and heated at heating rate of 2 ℃/min to the predetermined temperature, and then kept for 2 hours.
Static adsorption of Pb(II)
Simulate wastewater containing Pb(II) using lead nitrate aqueous solution, add Fe2O3 loaded geopolymer porous ceramics to the waste liquid with an initial Pb(Ⅱ) concentration of 60 mg/L at a dose of 1 g/50 mL, and stir at a speed of 120 r/min on a constant temperature magnetic stirrer for adsorption experiments. Measure the residual concentration of Pb(II) in the solution using an atomic absorption spectrophotometer, and calculate the adsorption capacity of geopolymer porous ceramics l and the removal rate of Pb(II), as shown in Eq. (1) [23] and (2) [3]:
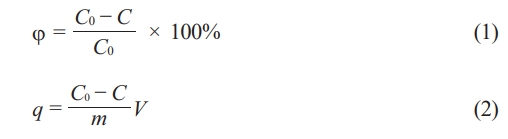
Where φ represents removal rate (%), C0 and C represent the initial and final ions concentrations of the solution, respectively. And q represents the adsorption capacity (mg/g), m represents the mass (g) of adsorbent and V represents the volume (L) of the solution.
Characterization
The volume shrinkage of the samples was calculated by measuring the diameters and the heights of samples before and after being sintered. The porosity of the sintered samples was measured by the Archimedes drainage method. The cross-section from the middle of the sample was cut, ground and polished, and then observed under a stereomicroscope. The images were analyzed by Image-pro plus software to calculate the average pore size and evaluate the distribution of pores in the samples. The compressive strength of the samples was tested by compression testing device (JBC-LY, Shenyang Hexing Testing Equipment Co., Ltd, China). The microstructures of the sample were characterized by scanning electron microscope (SU8020, Hitachi Co., Ltd, Japan). The phases of samples were determined by X-ray diffractometer (D8-Advance, Bruker Co., Ltd, Germany) using Cu Ka radiation at tube voltage 40 kV, tube current 30 mA and a scanning speed 2 ℃/min with scanning range from 10° to 80°.
The concentration of Pb(Ⅱ) before and after adsorption were analyzed by an atomic adsorption spectrometer (A3, Puxi Scientific Instrument Co., Ltd, China).
Phase composition
Effect of sintering temperature on phase composition of geopolymer porous ceramics
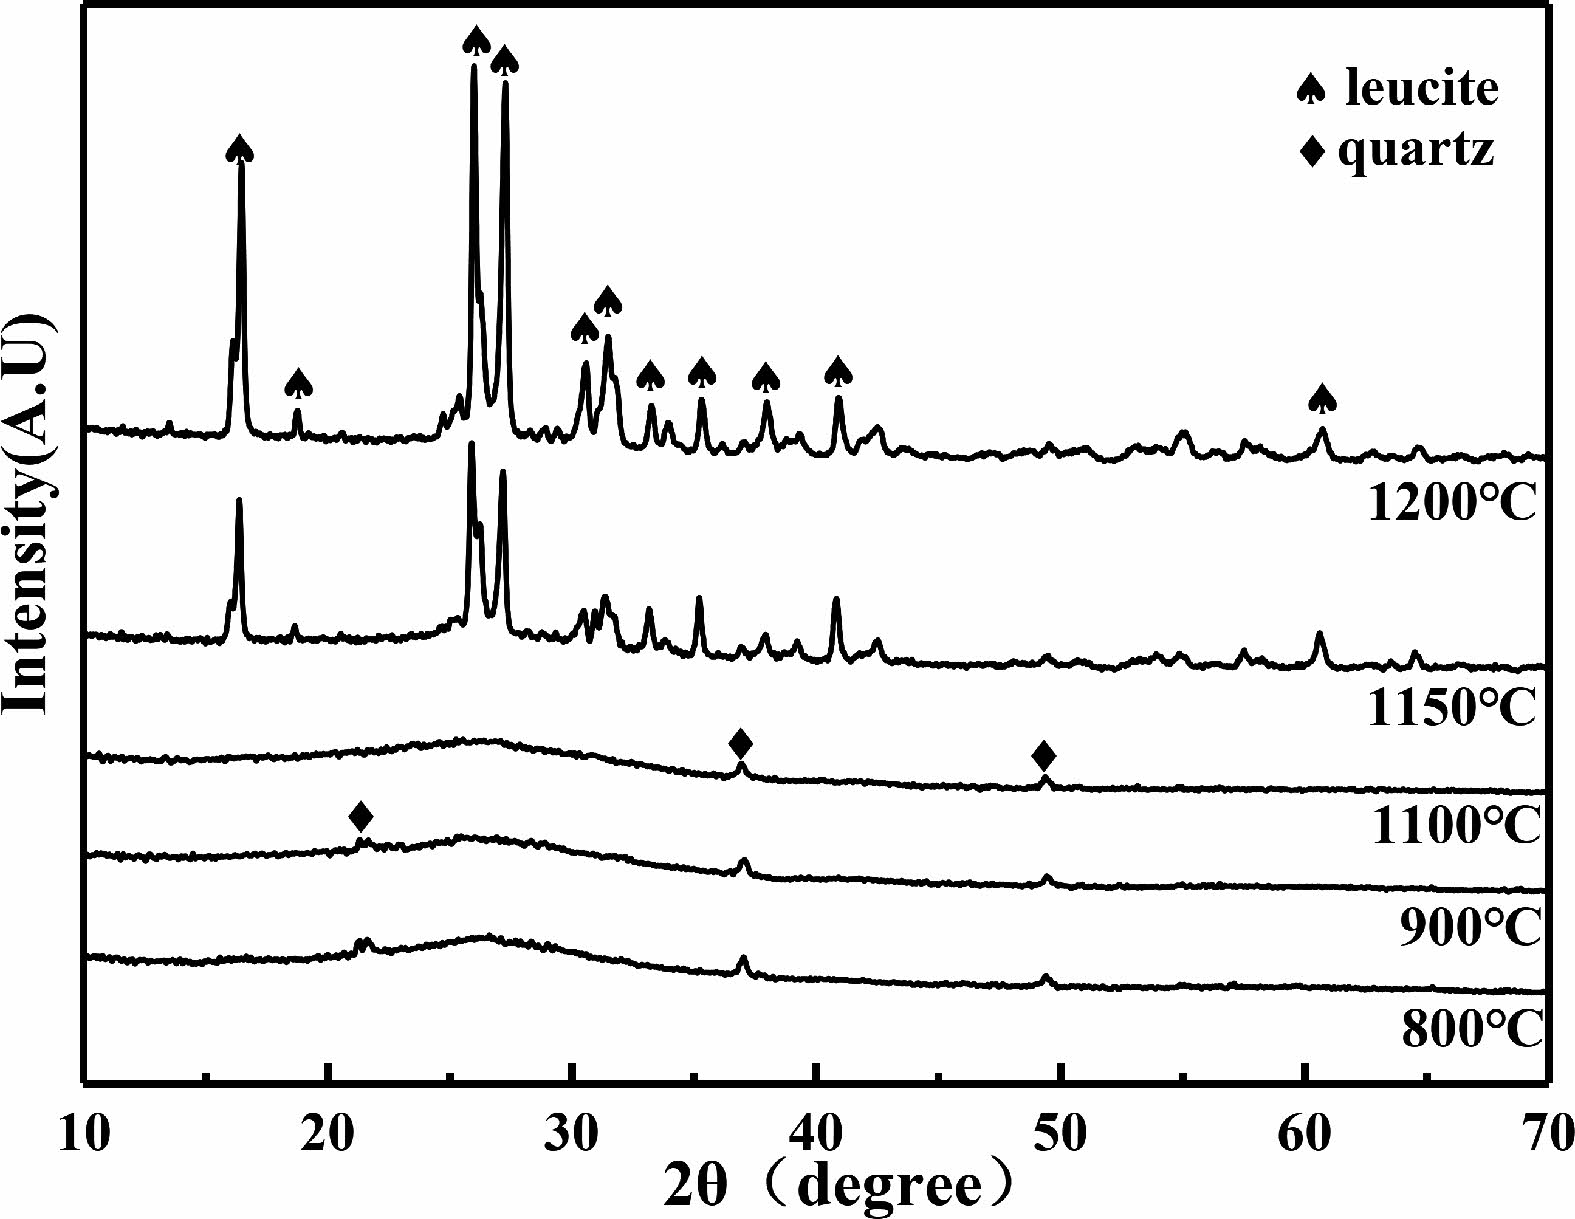
The XRD patterns of the C0 samples after being sintered are shown in Fig. 1. It can be observed that after being sintered at 800 ℃, the samples are composed of amorphous phase and quartz (SiO2) phase. After being sintered at 1150 ℃ and 1200 ℃, quartz phase disappears and leucite (K2O·Al2O3·4SiO2) phase appears in the XRD patterns.
During the heating process at lower temperatures, the geopolymer gradually removes free water, the T-OH (T=Si, Al) is condensed and polymerize to water which is also evaporated subsequently. The atoms inside the geopolymer tend to arrange more regularly [24]. After being sintered at 1150 ℃, a large amount of leucite phases (K2O·Al2O3·4SiO2) begins to appear. The reaction formula for the reaction is shown in Eq. (3) [25, 26]:

Effect of calcium oxide content on phase composition of geopolymer porous ceramics
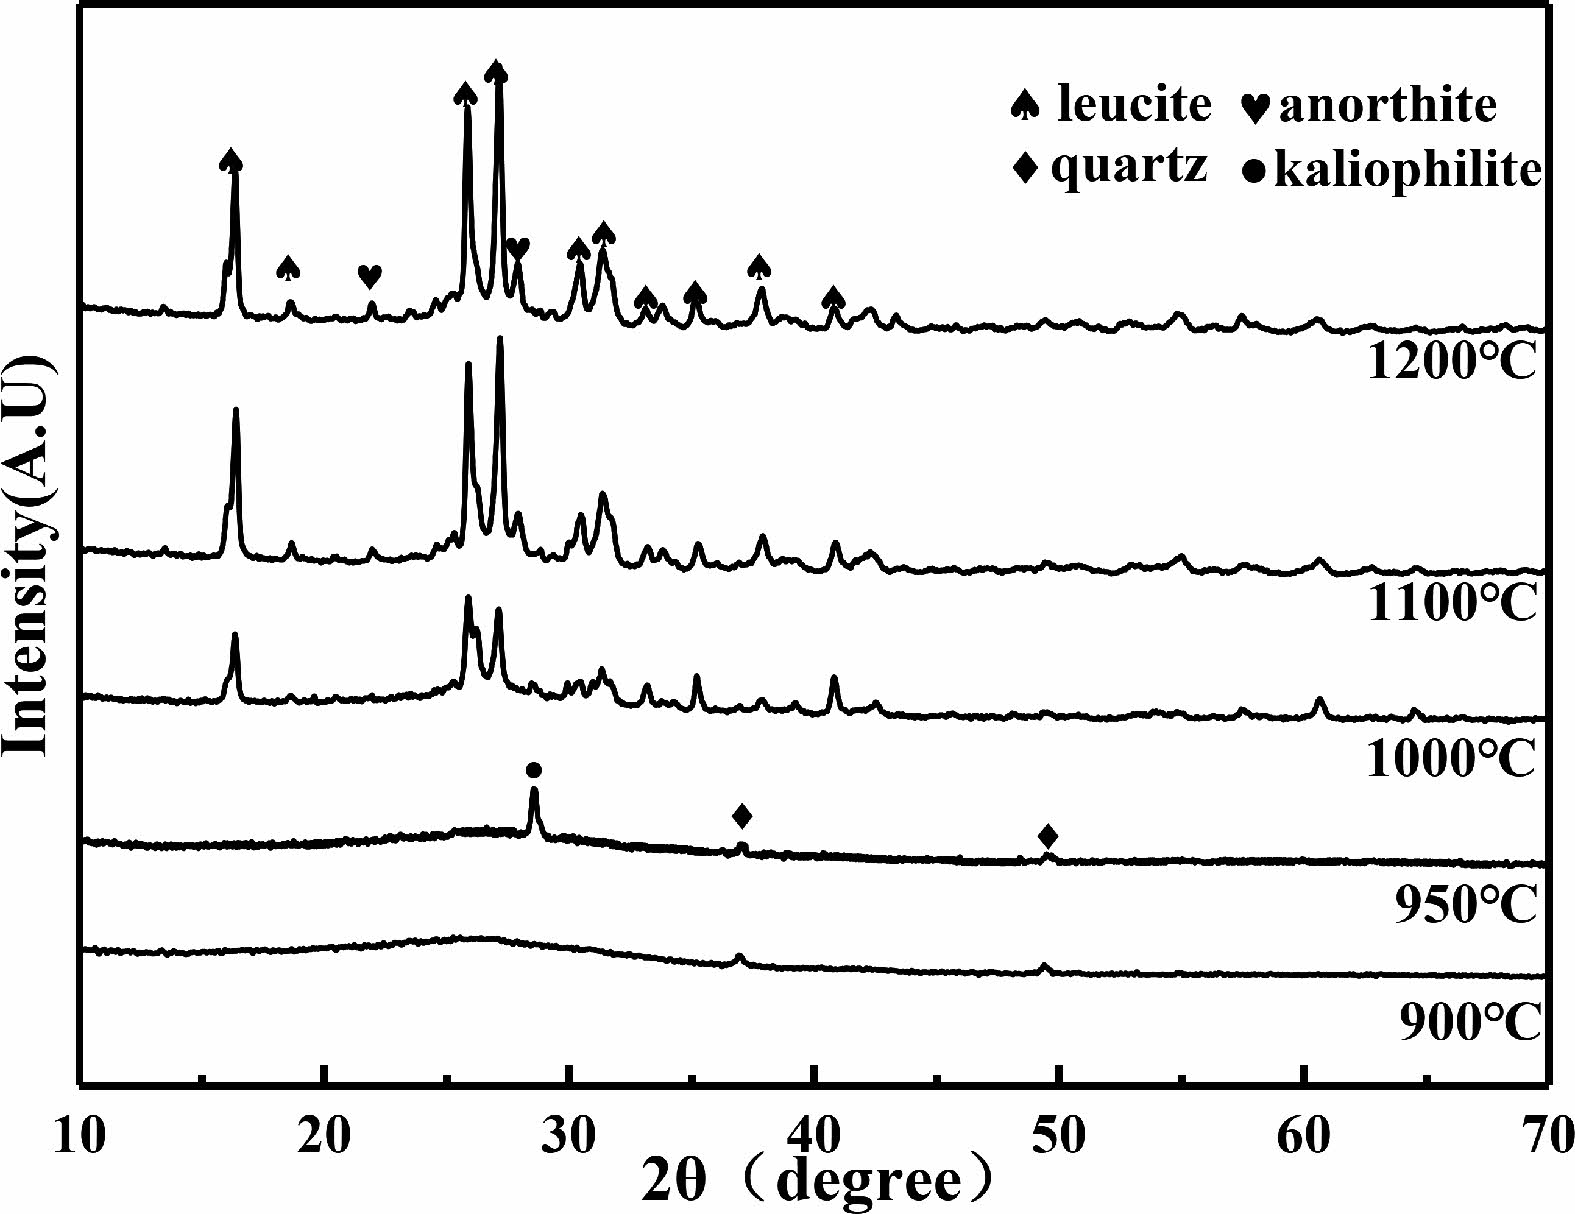
Fig. 2shows the XRD patterns of the C6 samples after being sintered. The samples are composed of the amorphous phase and quartz phase when they were sintered at 900 ℃. After being sintered at 950 ℃, kaliophilite (K2O·Al2O3·2SiO2) phase begins to appear. After being sintered at 1000 ℃, in addition to the kaliophilite phase, there is also leucite phase appears in XRD patterns. After being sintered at 1100 ℃, anorthite (CaO·Al2O3·2SiO2) phase begins to appear. The reaction formula for generating anorthite is shown in Eq. (4) [27]:

The kaliophilite phase disappears and the intensity of the diffraction peaks of leucite is enhanced.
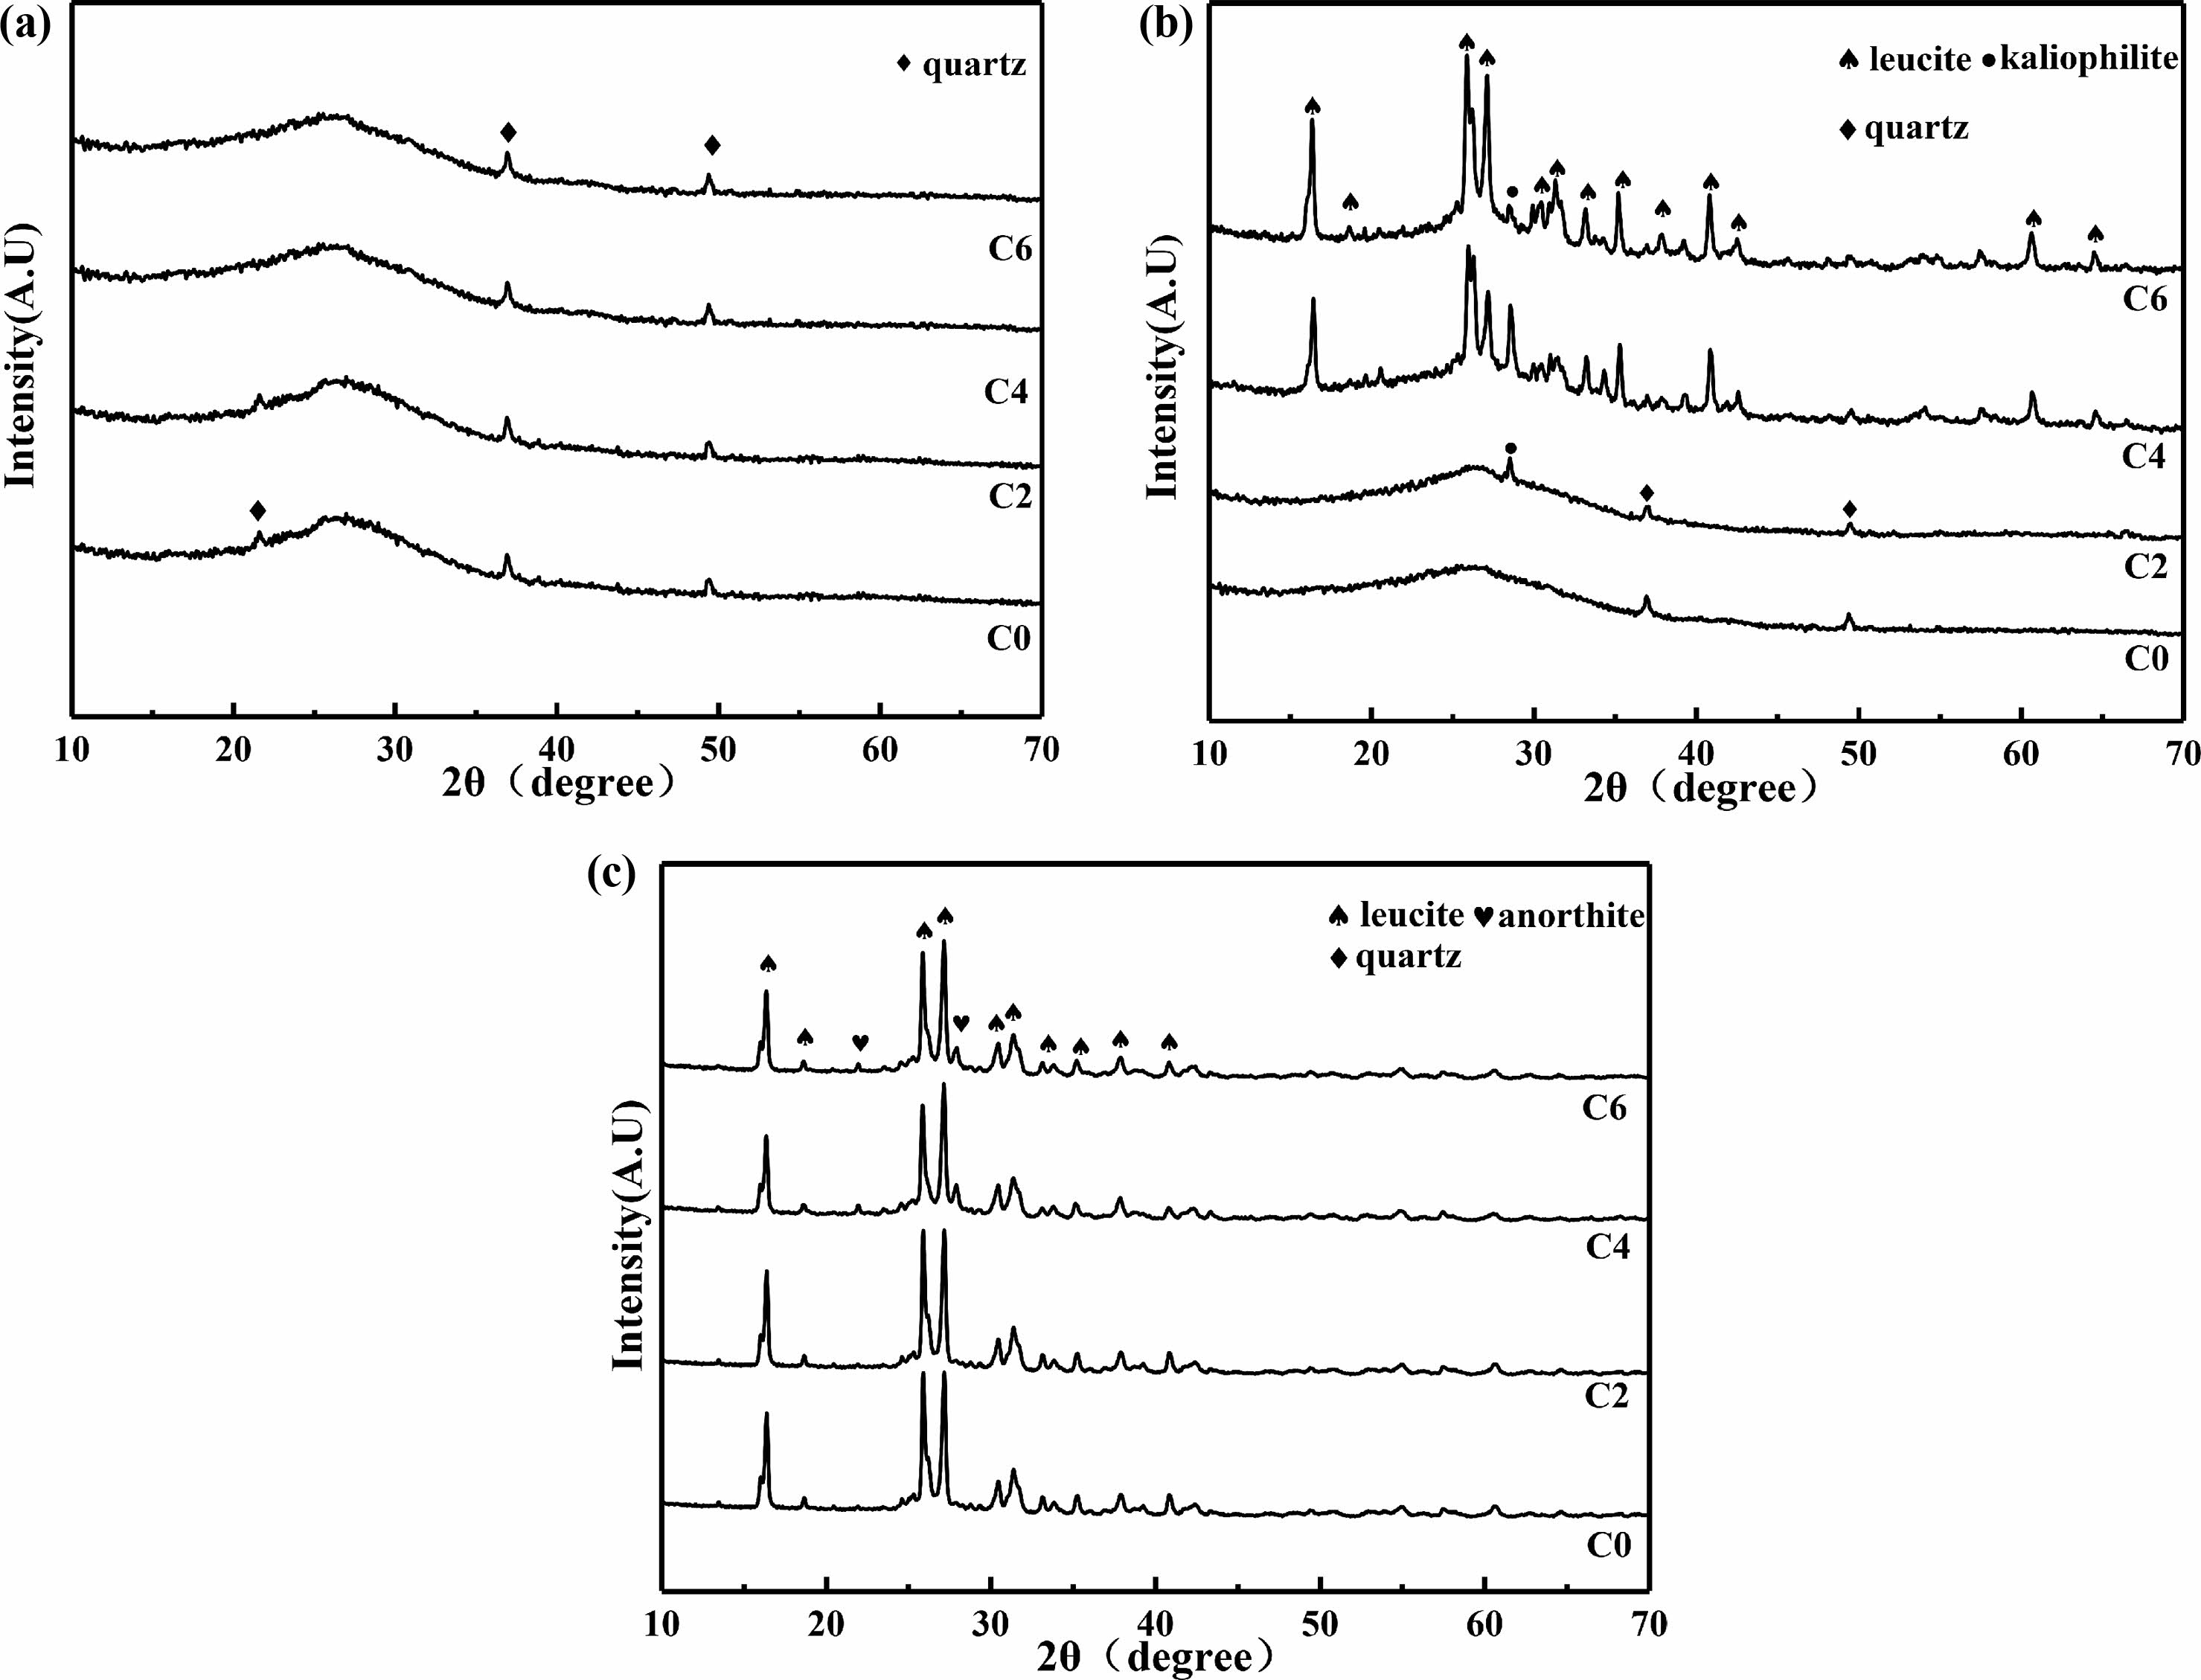
The XRD patterns of ceramics obtained from C0~C6 samples sintered at different temperatures are shown in Fig. 3. It can be seen that, after being sintered at 800 ℃ (Fig. 3a), the addition of calcium oxide does not affect the phase composition. When the samples are sintered at 1000 ℃ (Fig. 3b), the intensity of the diffraction peaks of kaliophilite phase increases first and then decreases, the intensity of the diffraction peaks of leucite phase increases with the content of calcium oxide increases. When the samples are sintered at 1200 ℃ (Fig. 3c), only leucite phase and anorthite phase appear in XRD patterns. This is because during the high-temperature sintering process, the kaliophilite phase reacts with SiO2 to form a stable leucite phase [28, 29], and the reaction equation is shown in Eq. (5) [29]:

The above phenomena indicate that the addition of calcium oxide significantly reduces the precipitation temperature of the leucite phase. The charge of Ca2+in calcium oxide is less than that of Si4+ and Al3+. And the ion radius of Ca2+ is larger than that of Si4+ and Al3+ [30]. This leads to a weak binding force between Ca2+ and O2-, so the addition of calcium oxide can provide “free oxygen”, increase the ratio of O/Si, The irregular network structure inside the geopolymer is destroyed [31]. The viscosity of liquid phase which come from K2O-Al2O3-SiO2 [21, 26] system during sintering process decrease. Ca2+can also play the role of reverse polarization to the Si-O-Si bonds in the network, and weaken the bonding force between the silicon and oxygen tetrahedra in the internal irregular network. It can also reduce the viscosity of liquid phase and increases the mobility of atom, the precipitation of leucite phase is promoted [32].
Microstructure Analysis
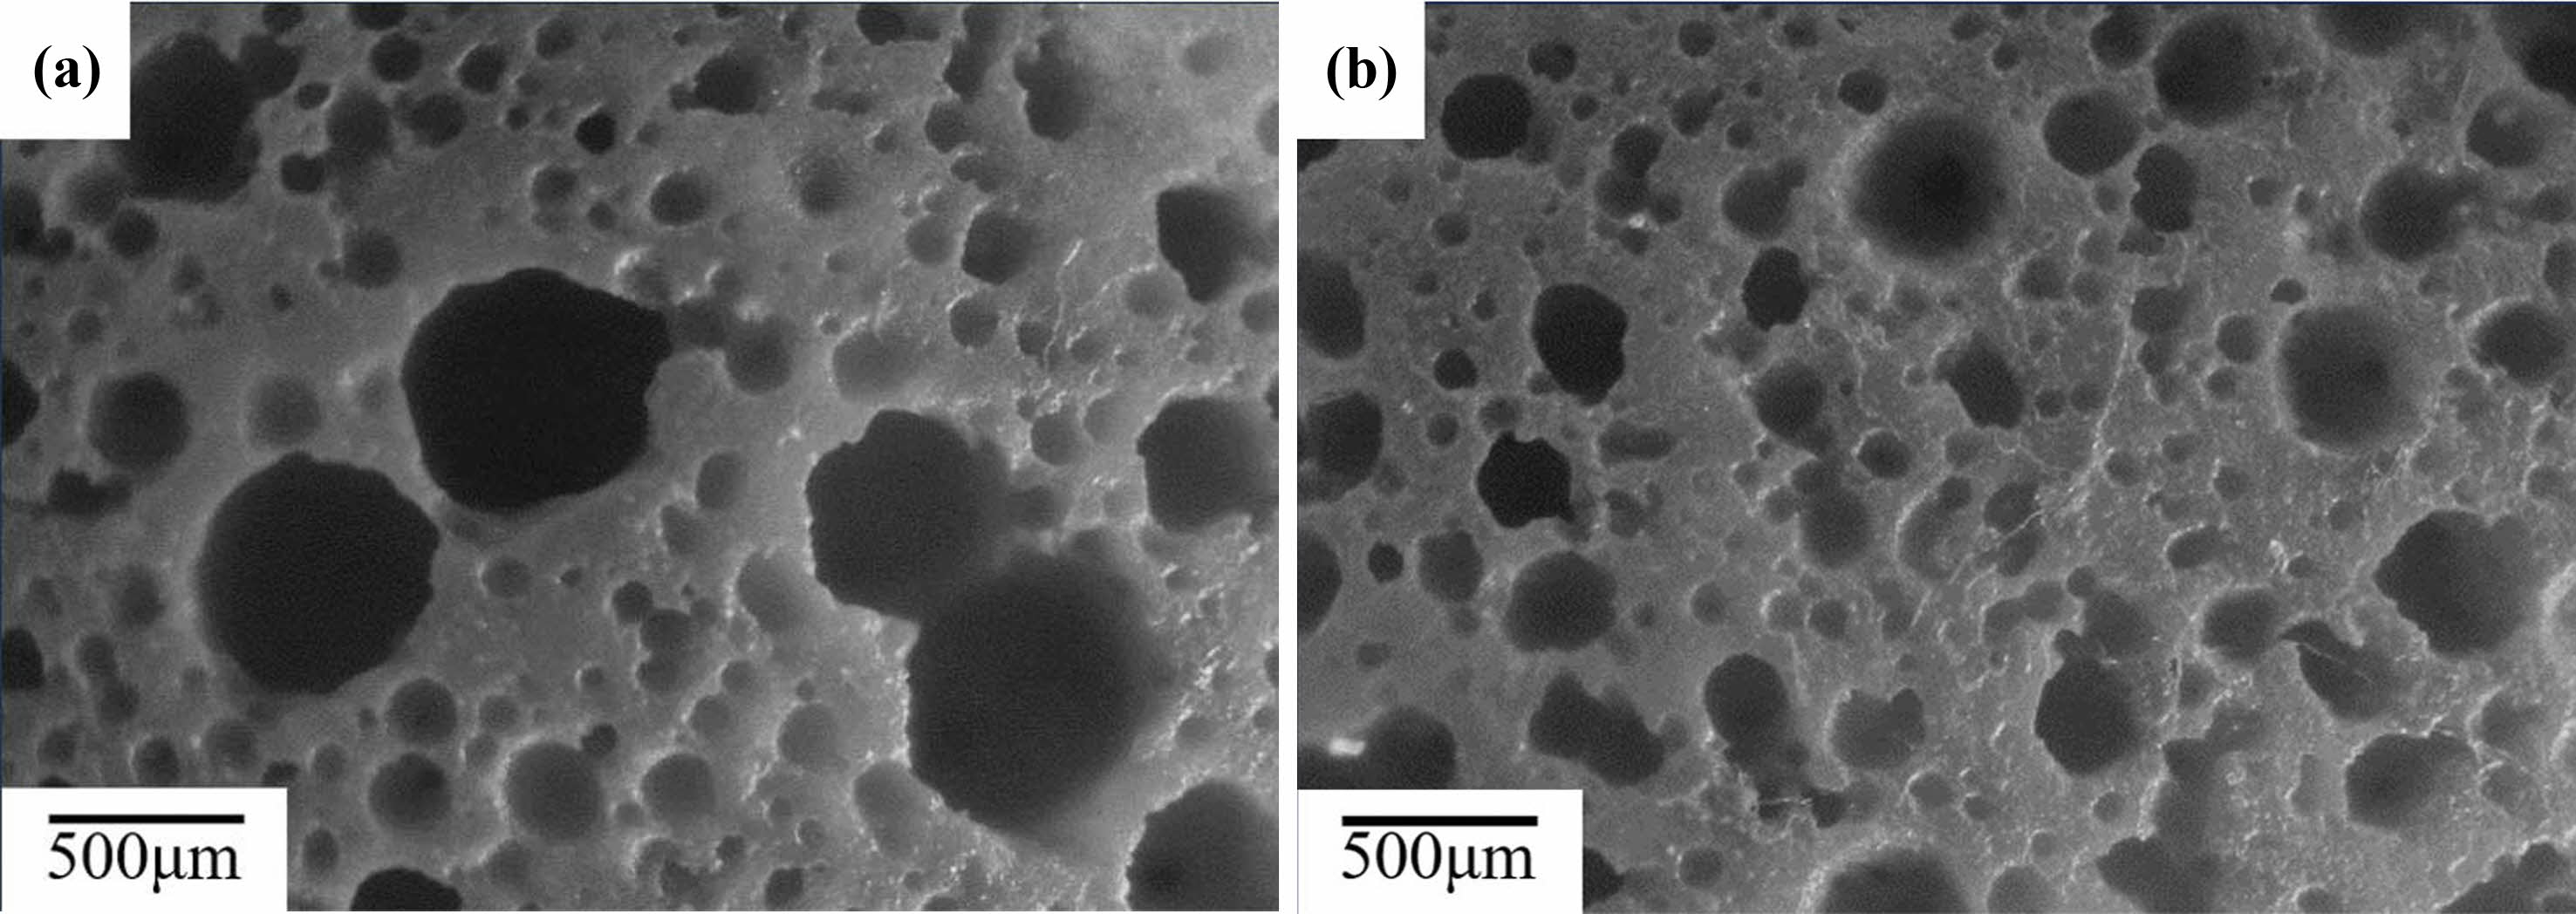
Fig. 4shows the macroscopic images of the C0 samples. In Fig. 4(a),it can be observed that, after being sintered at 800 ℃, there are small pores with pore size less than 100 μm and large pores with pore size 500 μm and more than 500 μm. These small pores are created by mechanical foamin g., while the large pores are created by the merging of small bubbles during the foaming process. After being sintered at 1200 ℃, as shown in Fig. 4(b), the pore size decreases and the proportion of small pores increases, which are caused by the shrinkage of the matrix due to sintering [33].
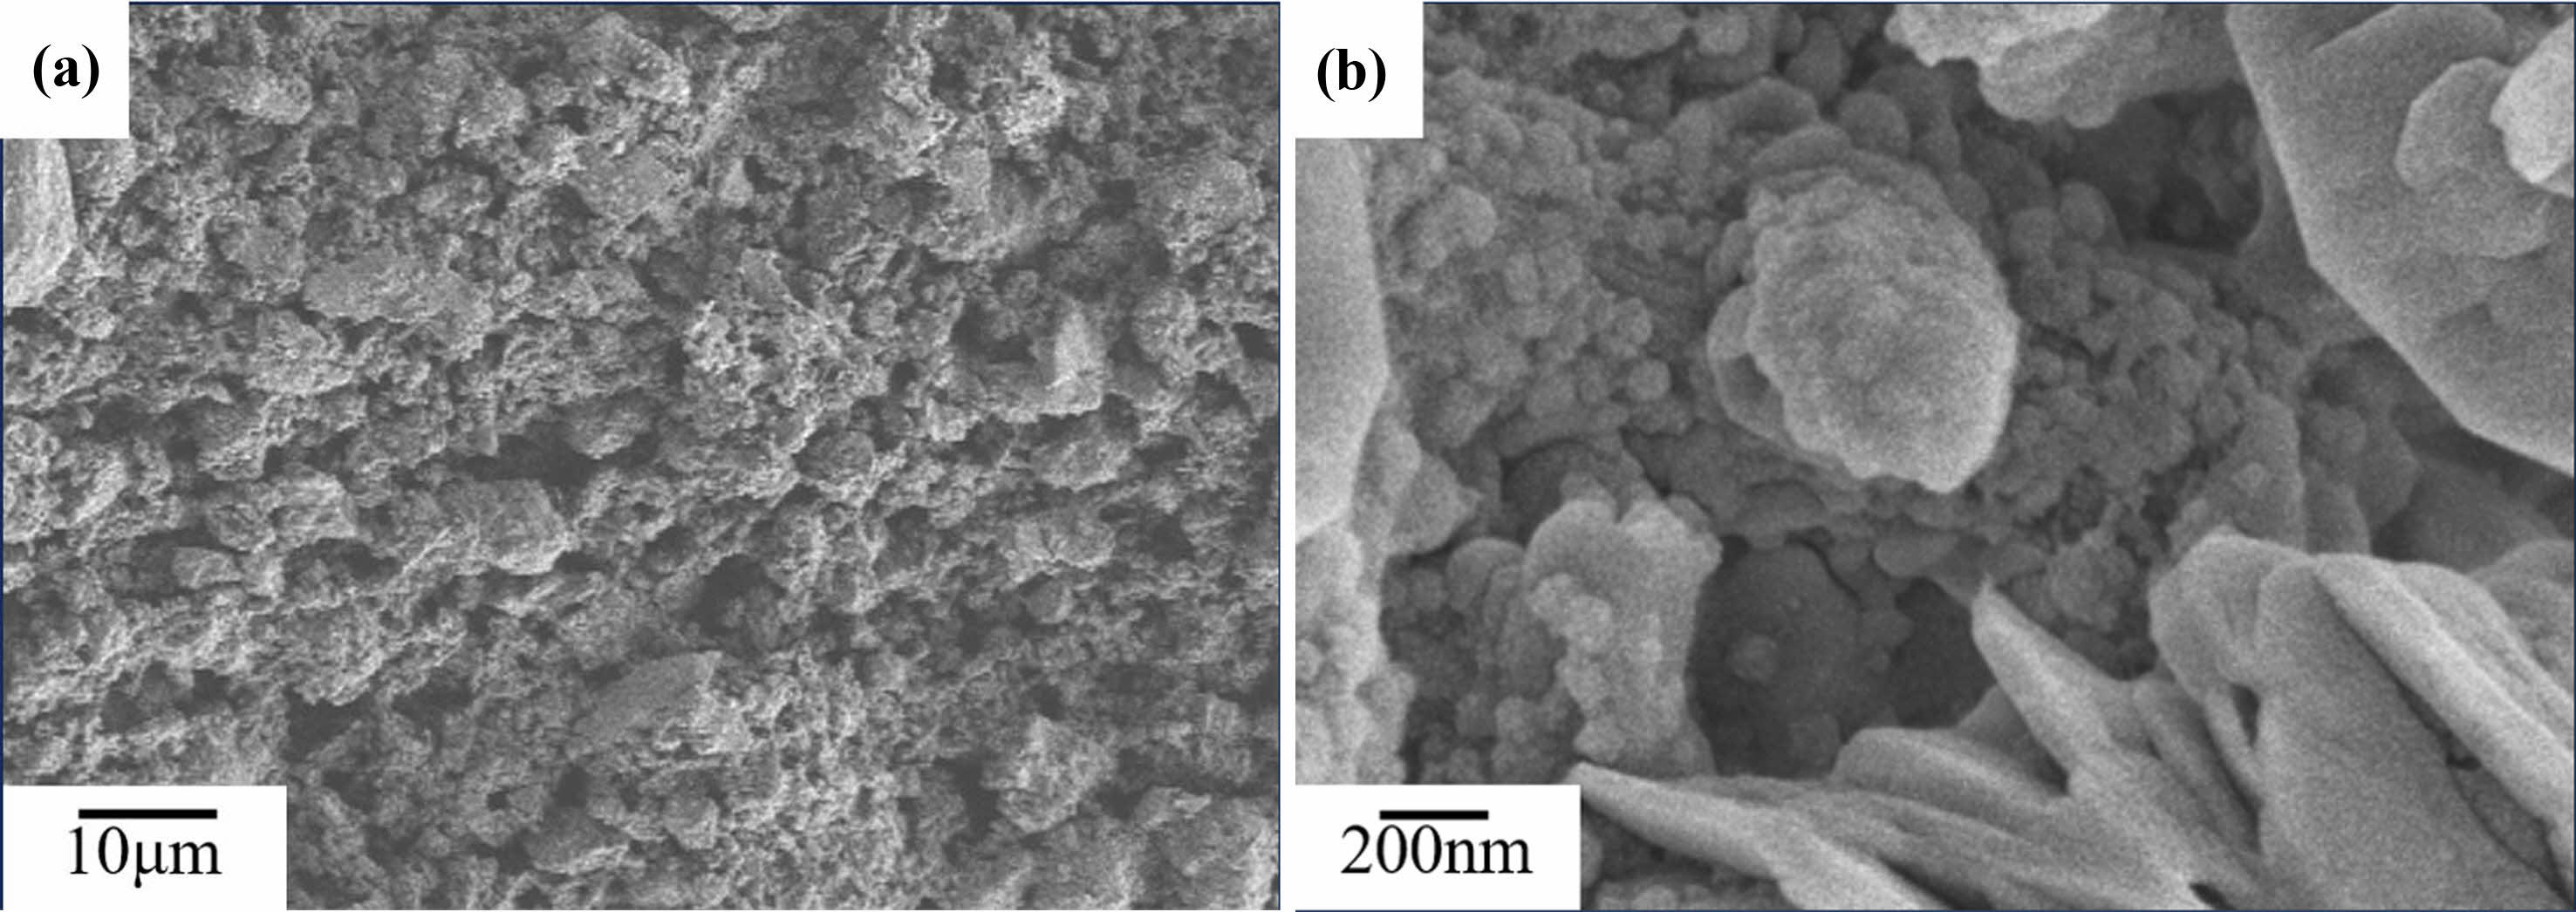
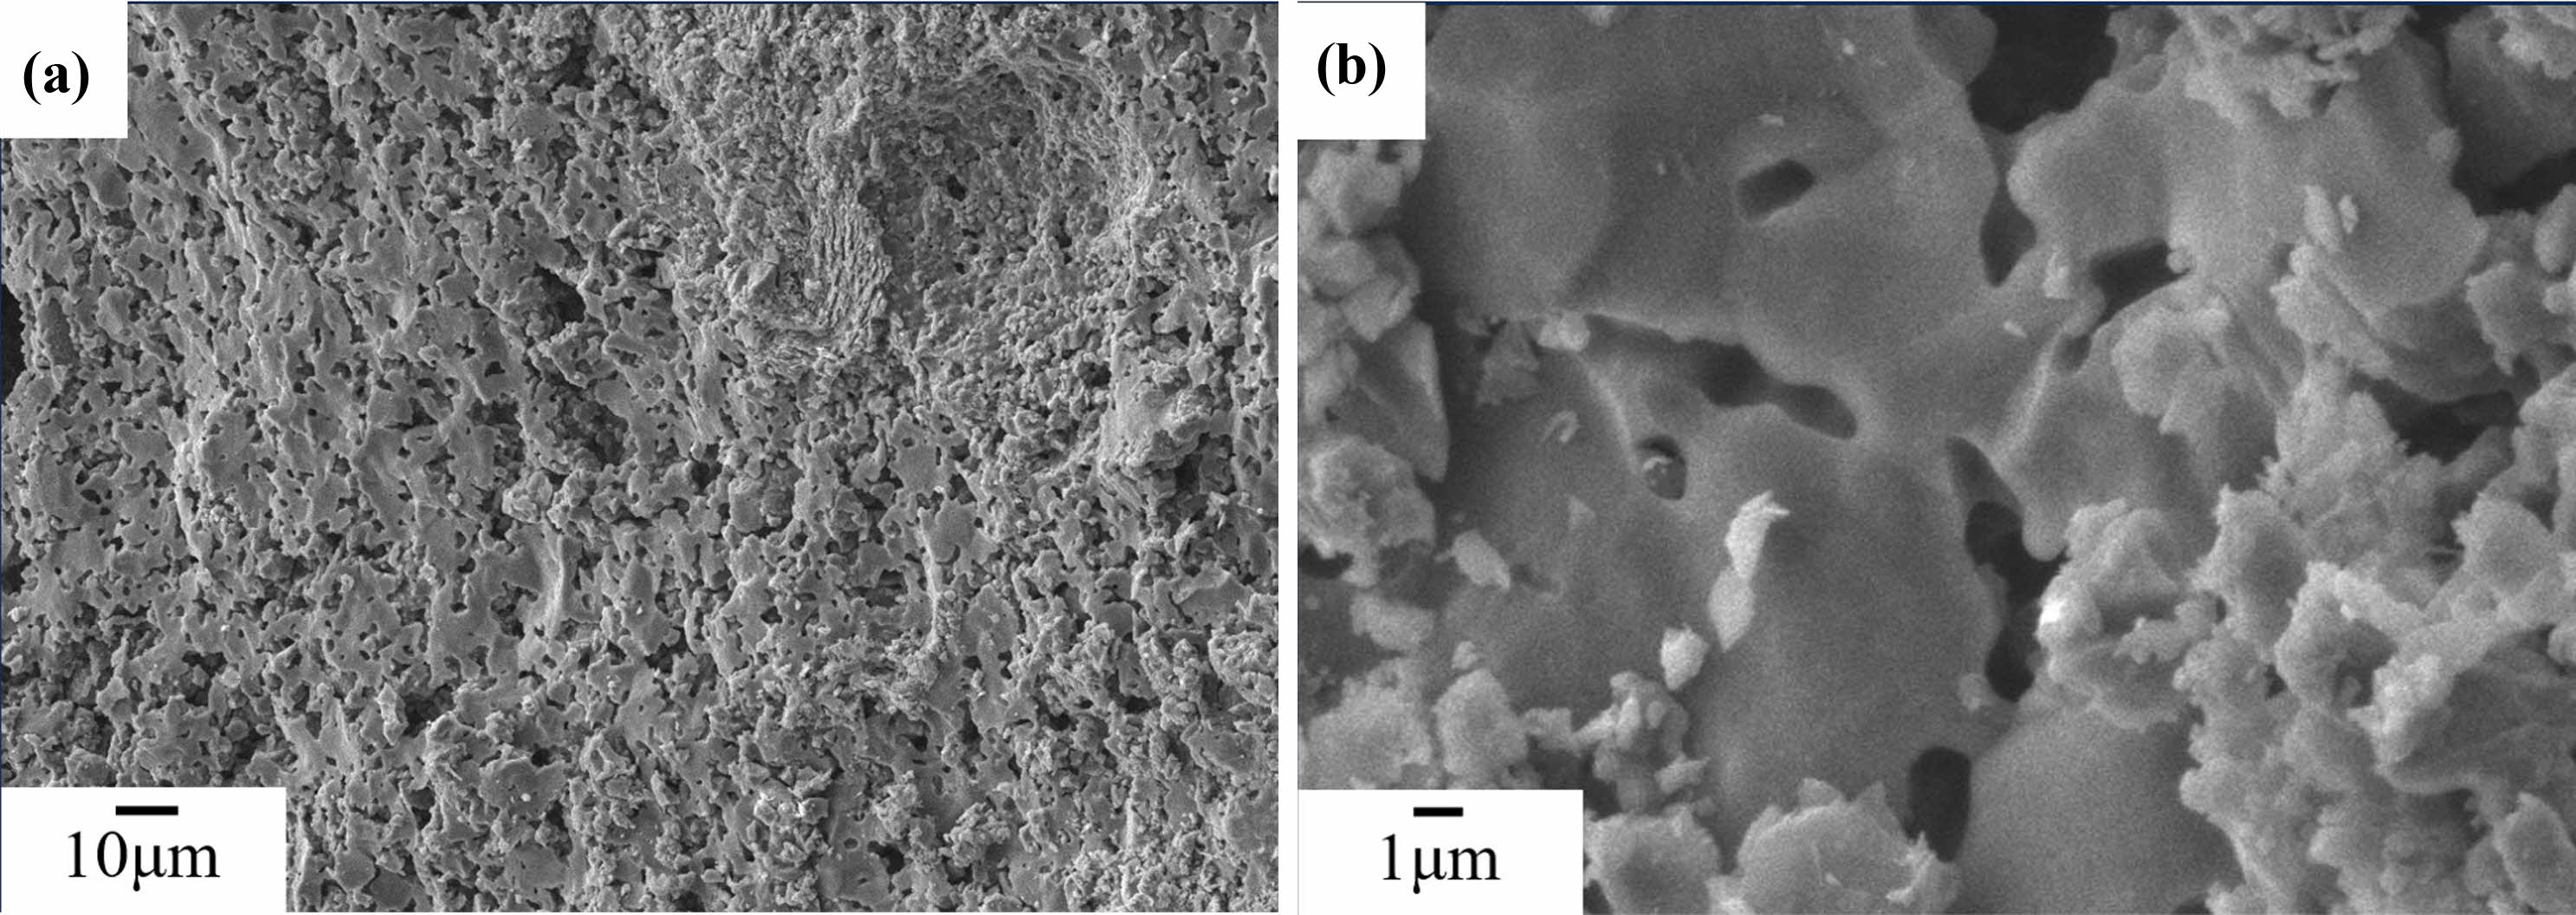
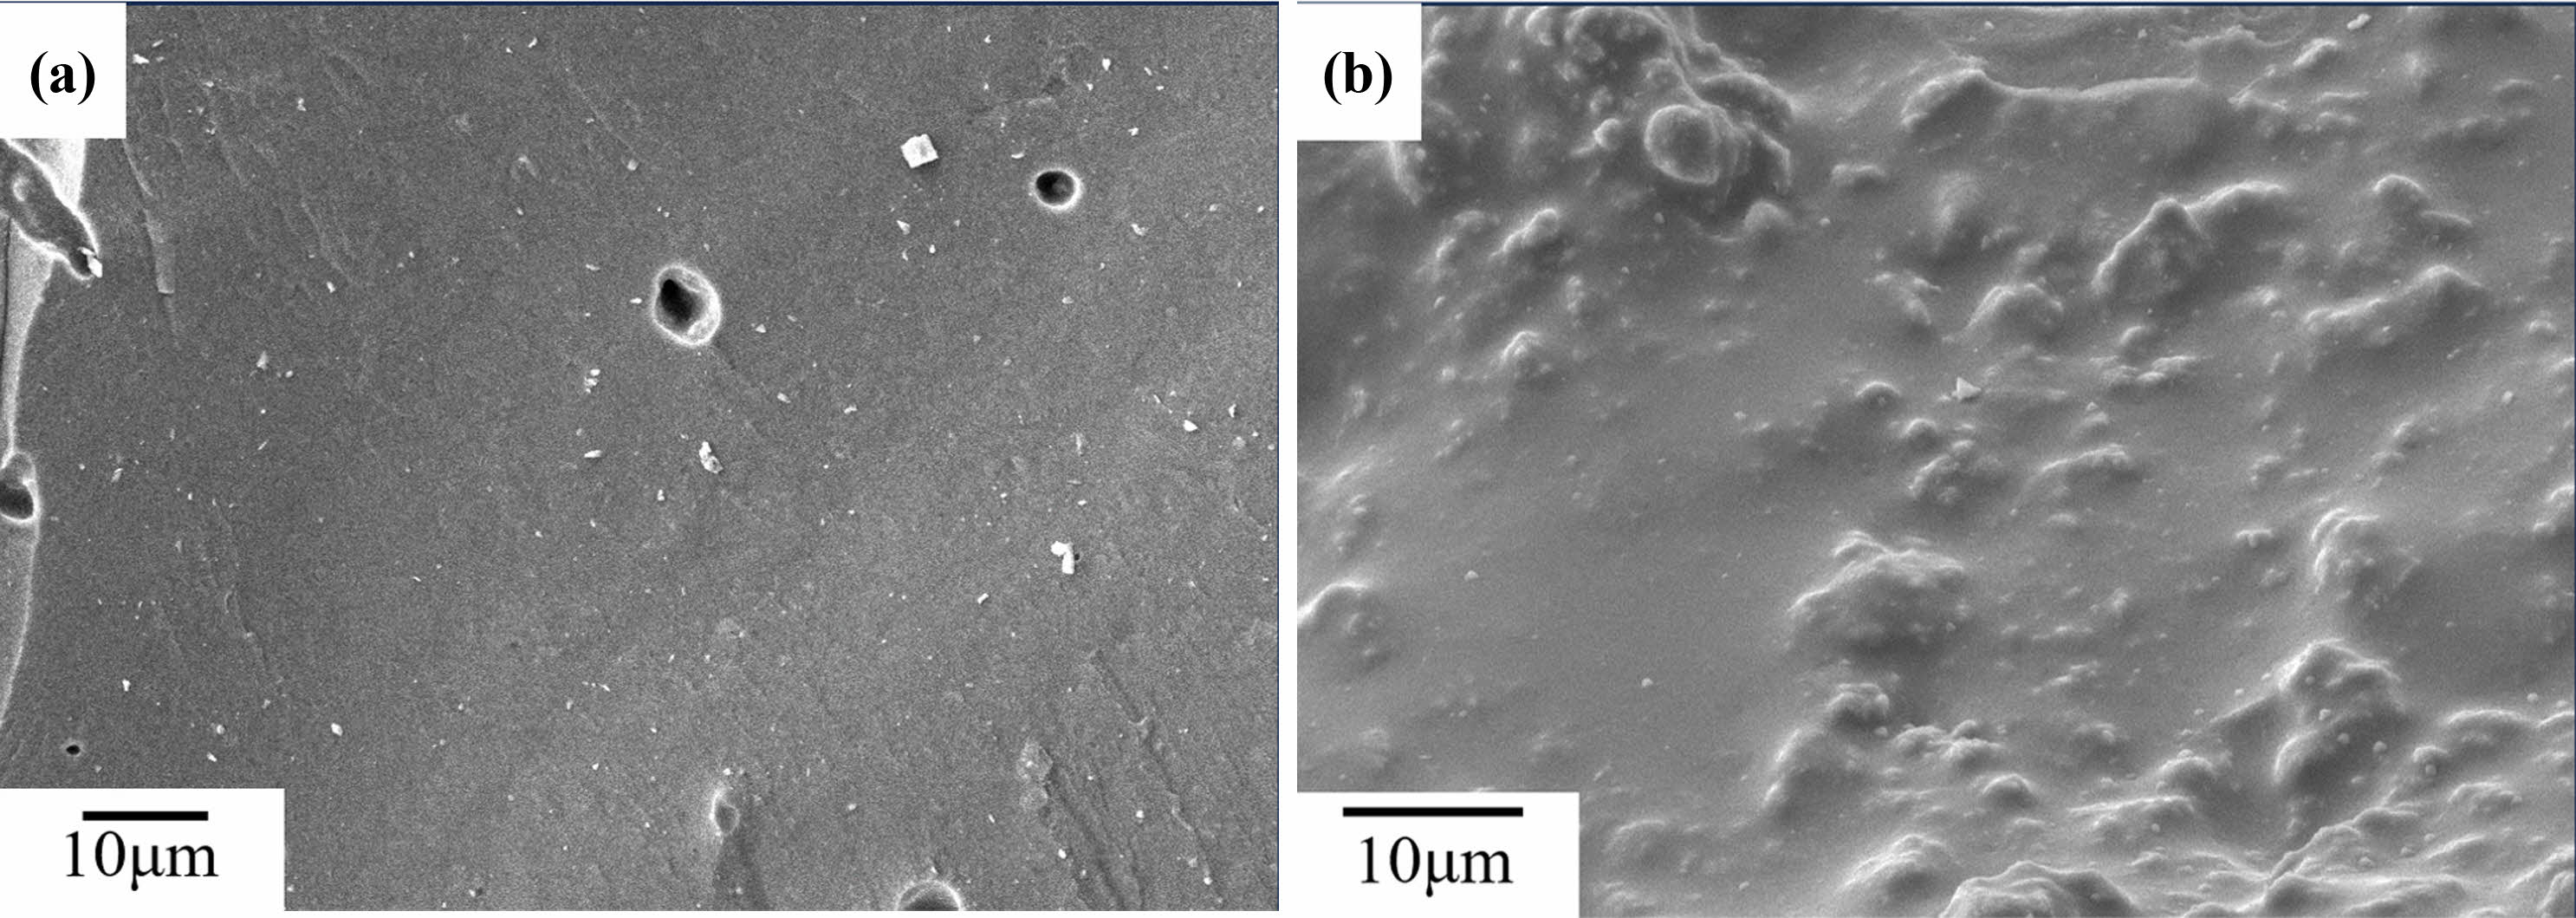
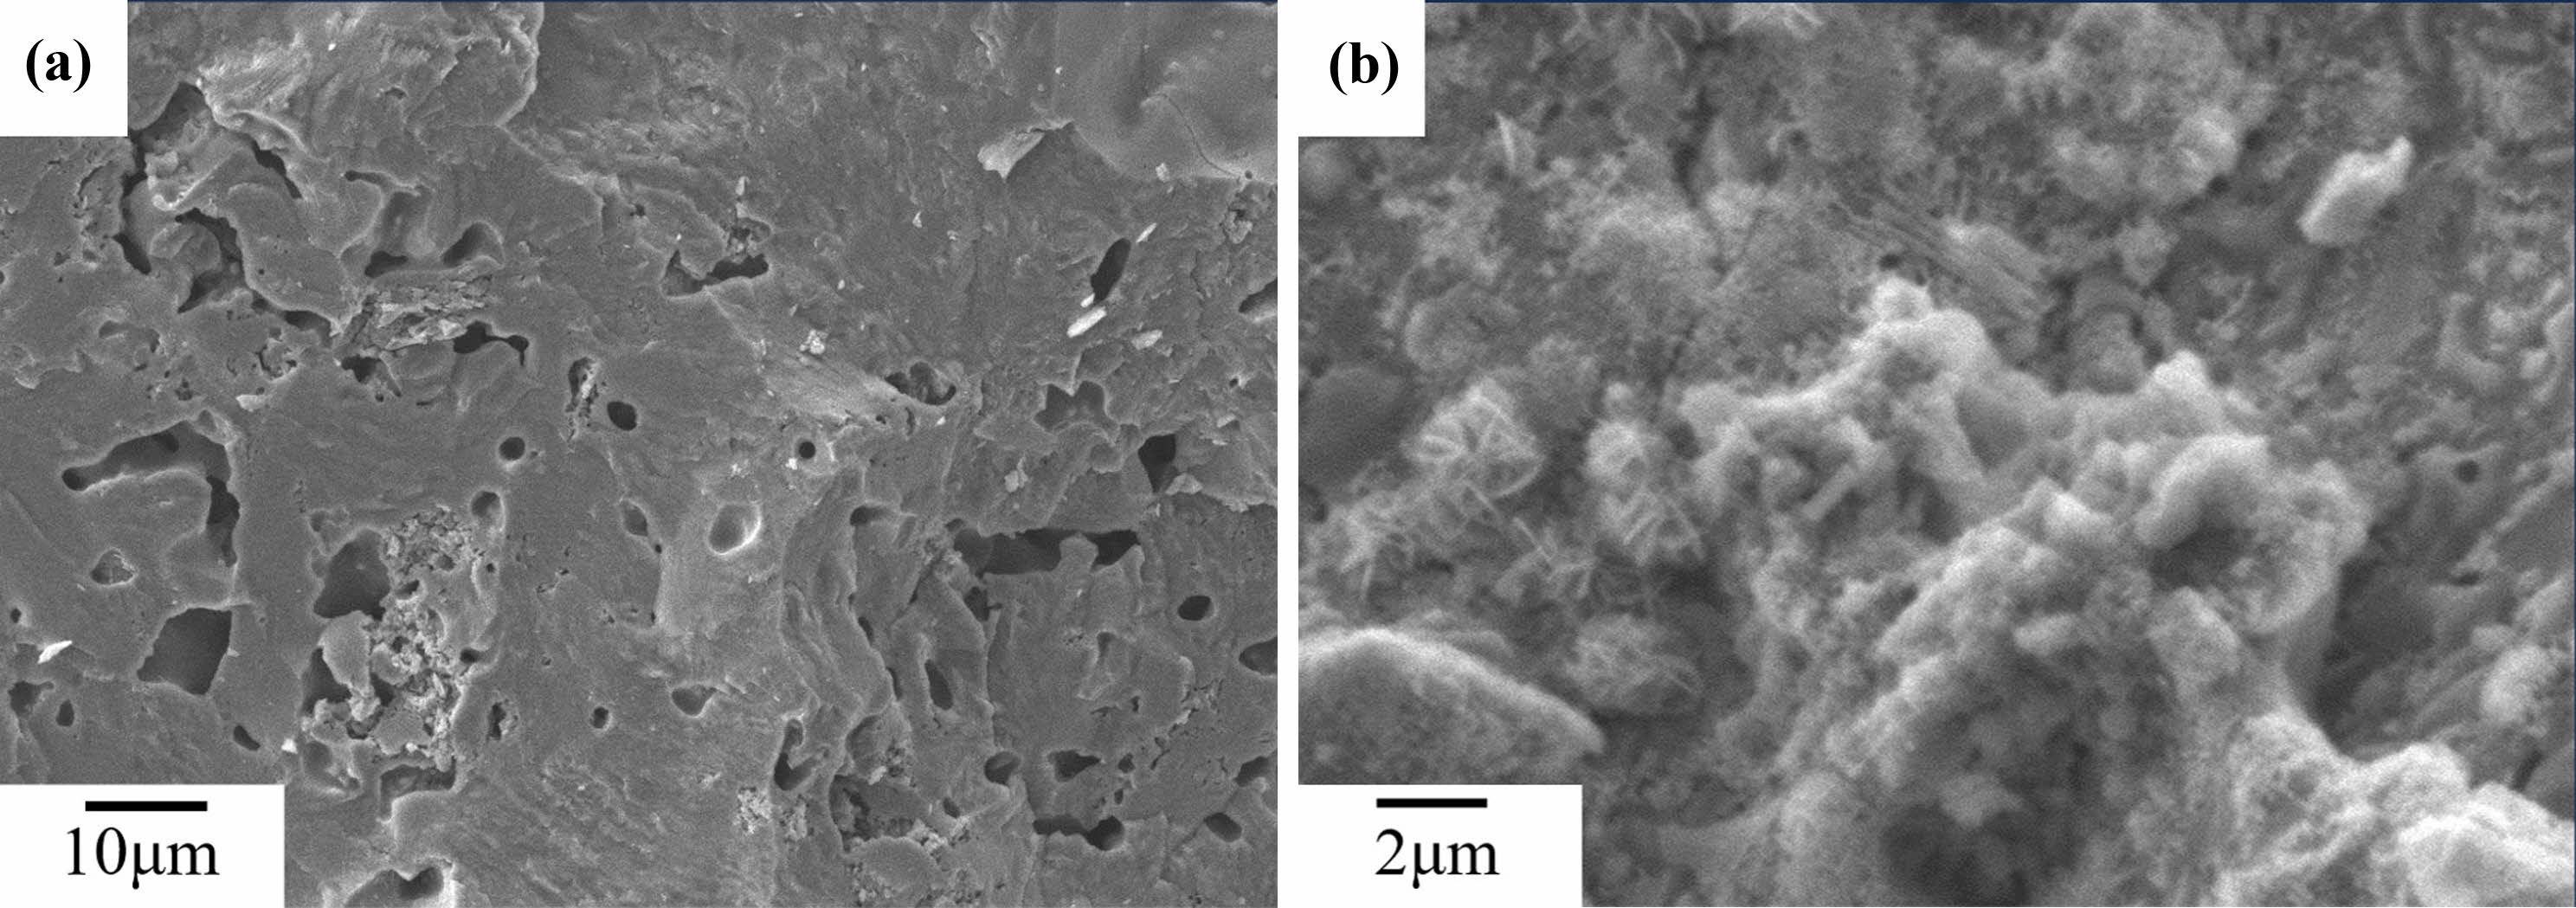
After being sintered at 800 ℃, as shown in Fig. 5(a), fracture surfaces of the C0 samples is rough, with numerous small pores. It can be seen from Fig. 5(b)that, the unreacted metakaolin and small precipitates are distributed on the fracture surface. After being sintered at 1,000 ℃, as shown in Fig. 6(a), fracture surfaces of the C0 samples is still rough, it can be seen from Fig. 6(b) that, the fine precipitates on the fracture surfaces of the C0 sample begin to coarsen and bind with each other. After being sintered at 1200 ℃, as shown in Fig. 7(a), there are no precipitates on the fracture surfaces of C0 sample, and the fracture surfaces become smooth, it can be seen from Fig. 7(b)that, there are fine grains surrounded on the fracture surface of the C0 sample.
Similarly, after being sintered at 1200 ℃, as shown in Fig. 8(a), the fracture surfaces of the C6 sample also became dense, but the degree of densification is lower than that of the C0 sample, leucite grains and needle like anorthite grains [28] were observed in Fig. 8(b).
Volume shrinkage and compressive strength
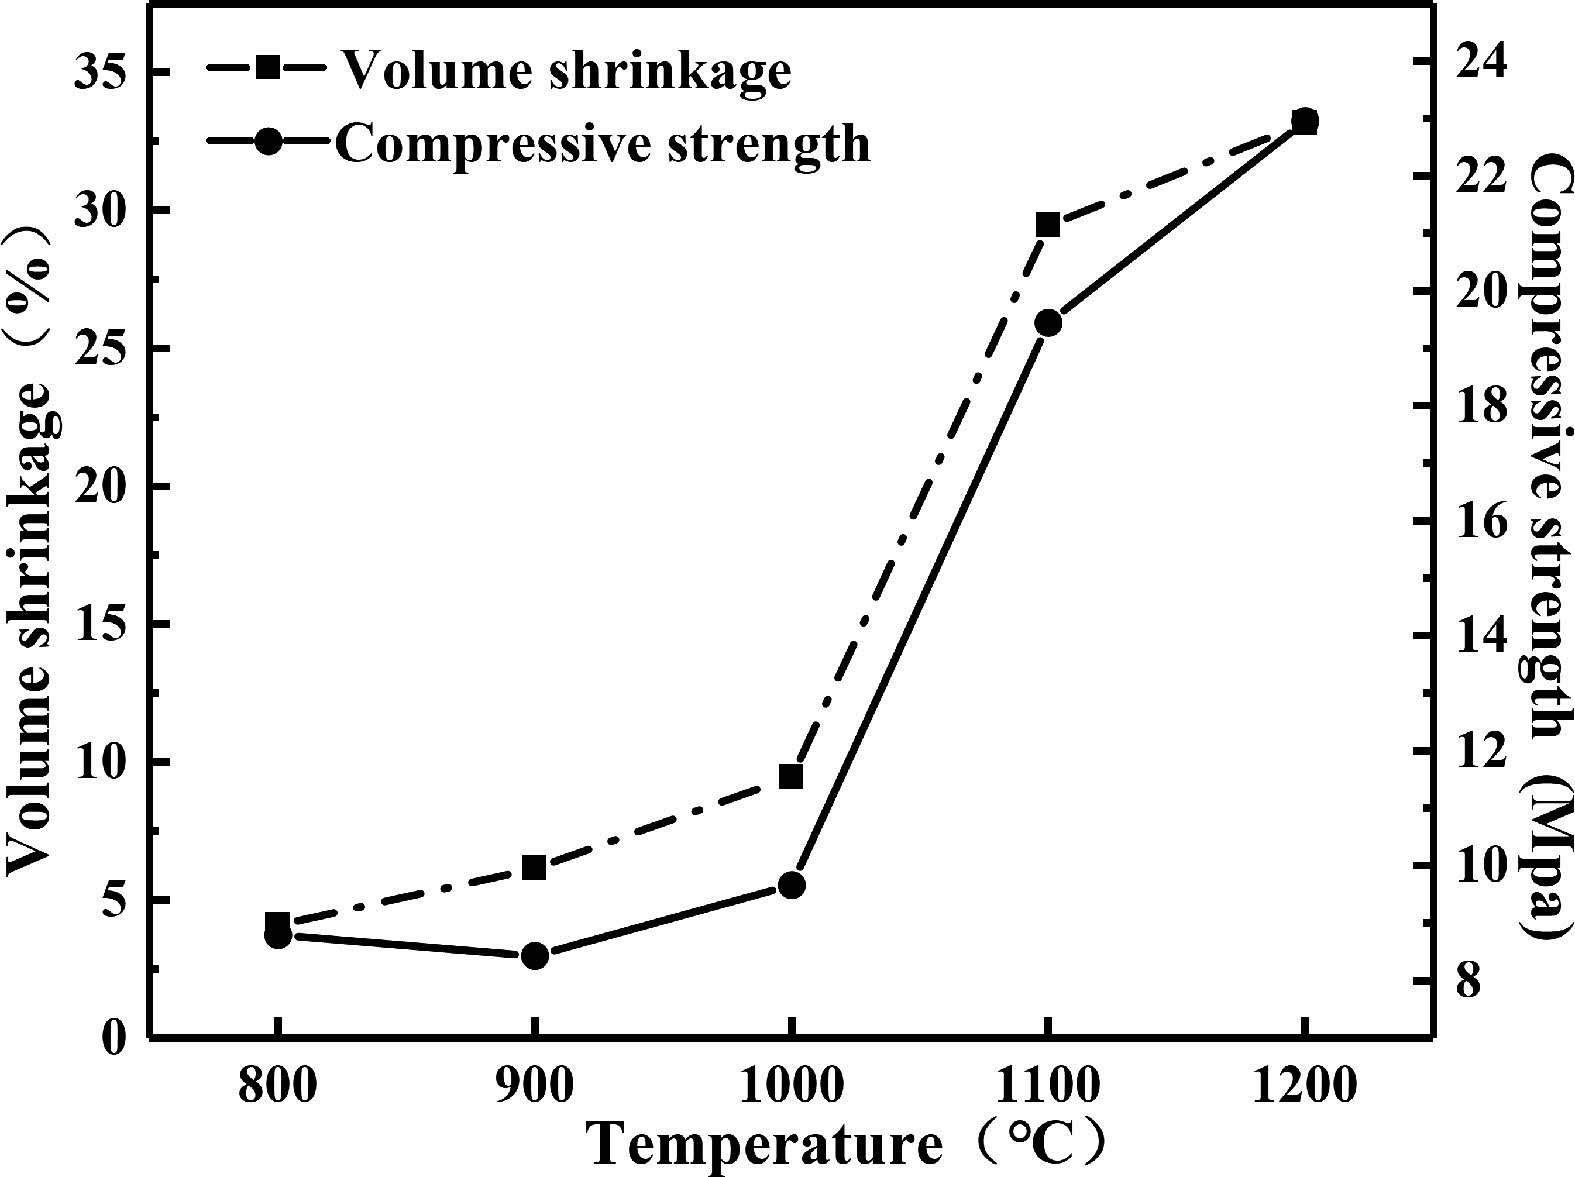
Fig. 9shows the variation curves of the volume shrinkage and compressive strength of the sintered C0 samples. It can be observed that the volume shrinkage and compressive strength of the samples increase with the increase of sintered temperature. The volume shrinkage and compressive strength of C0 samples quickly increase at sintering temperatures ranging from 1000 ℃ to 1100 ℃.
When the sintering temperature was below 1000 ℃, only dehydration and dehydroxylation occurred inside the geopolymer, so the changes in matrix shrinkage and compressive strength were relatively small. When the sintering temperature reached 1000 ℃, the geopolymer began to undergo sintering with structure densification, causing significant shrinkage of the matrix and an increase in compressive strength. Continuing to heat up, a large amount of leucite phases appeared in the sample, and the shrinkage of the matrix and compressive strength continued to increase [35].
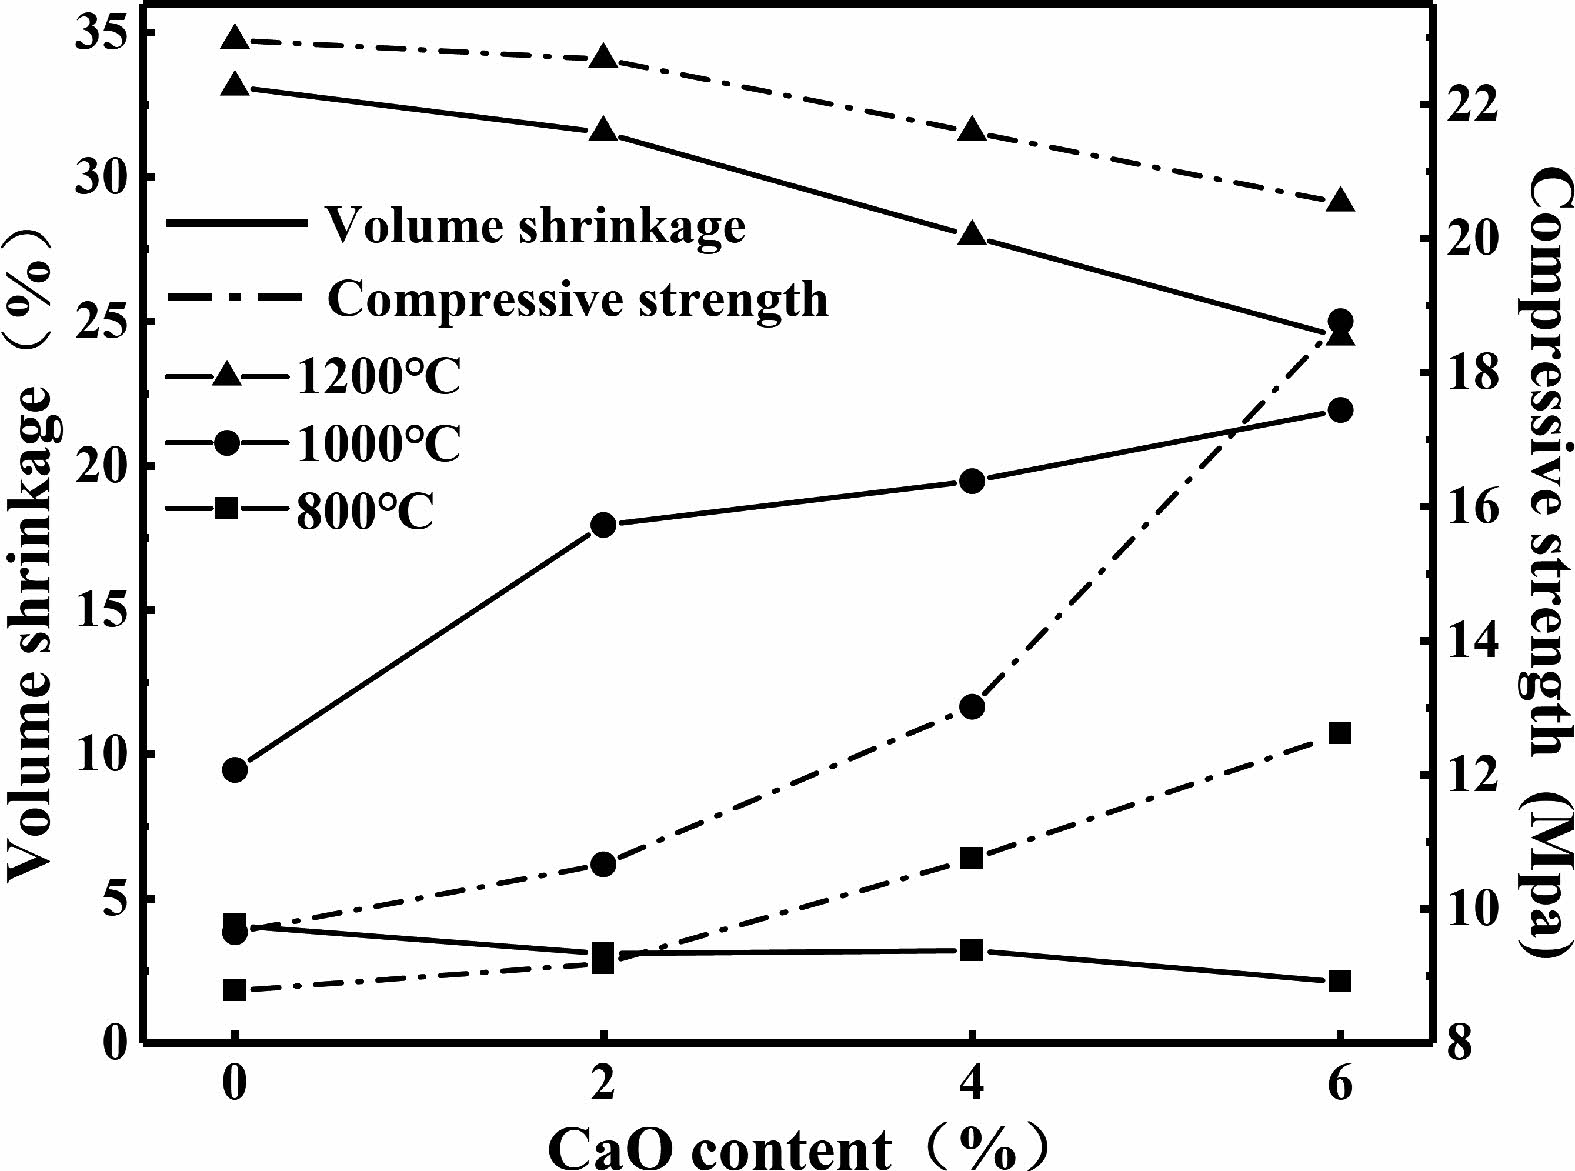
Fig. 10 shows the variation curves of volume shrinkage and compressive strength of C0~C6 samples after being sintered at the temperatures range from 800 ℃ to 1200 ℃. When the sintering temperature is 800 ℃, the volume shrinkage of the sample decreases while the compressive strength increases with the increase of calcium oxide content. After being sintered at 1000 ℃, the volume shrinkage and compressive strength of the samples increase with the increase of calcium oxide content.
When the sintering temperature is 1200 ℃, the volume shrinkage and compressive strength of the samples decreases with the increase of calcium oxide content. The samples containing calcium oxide precipitated needle-like anorthite crystals during the sintering process. Needle-like anorthite crystals could be inserted and filled between the leucite grains, resulting in the "insertion effect" [36].
Porosity and pore size distribution
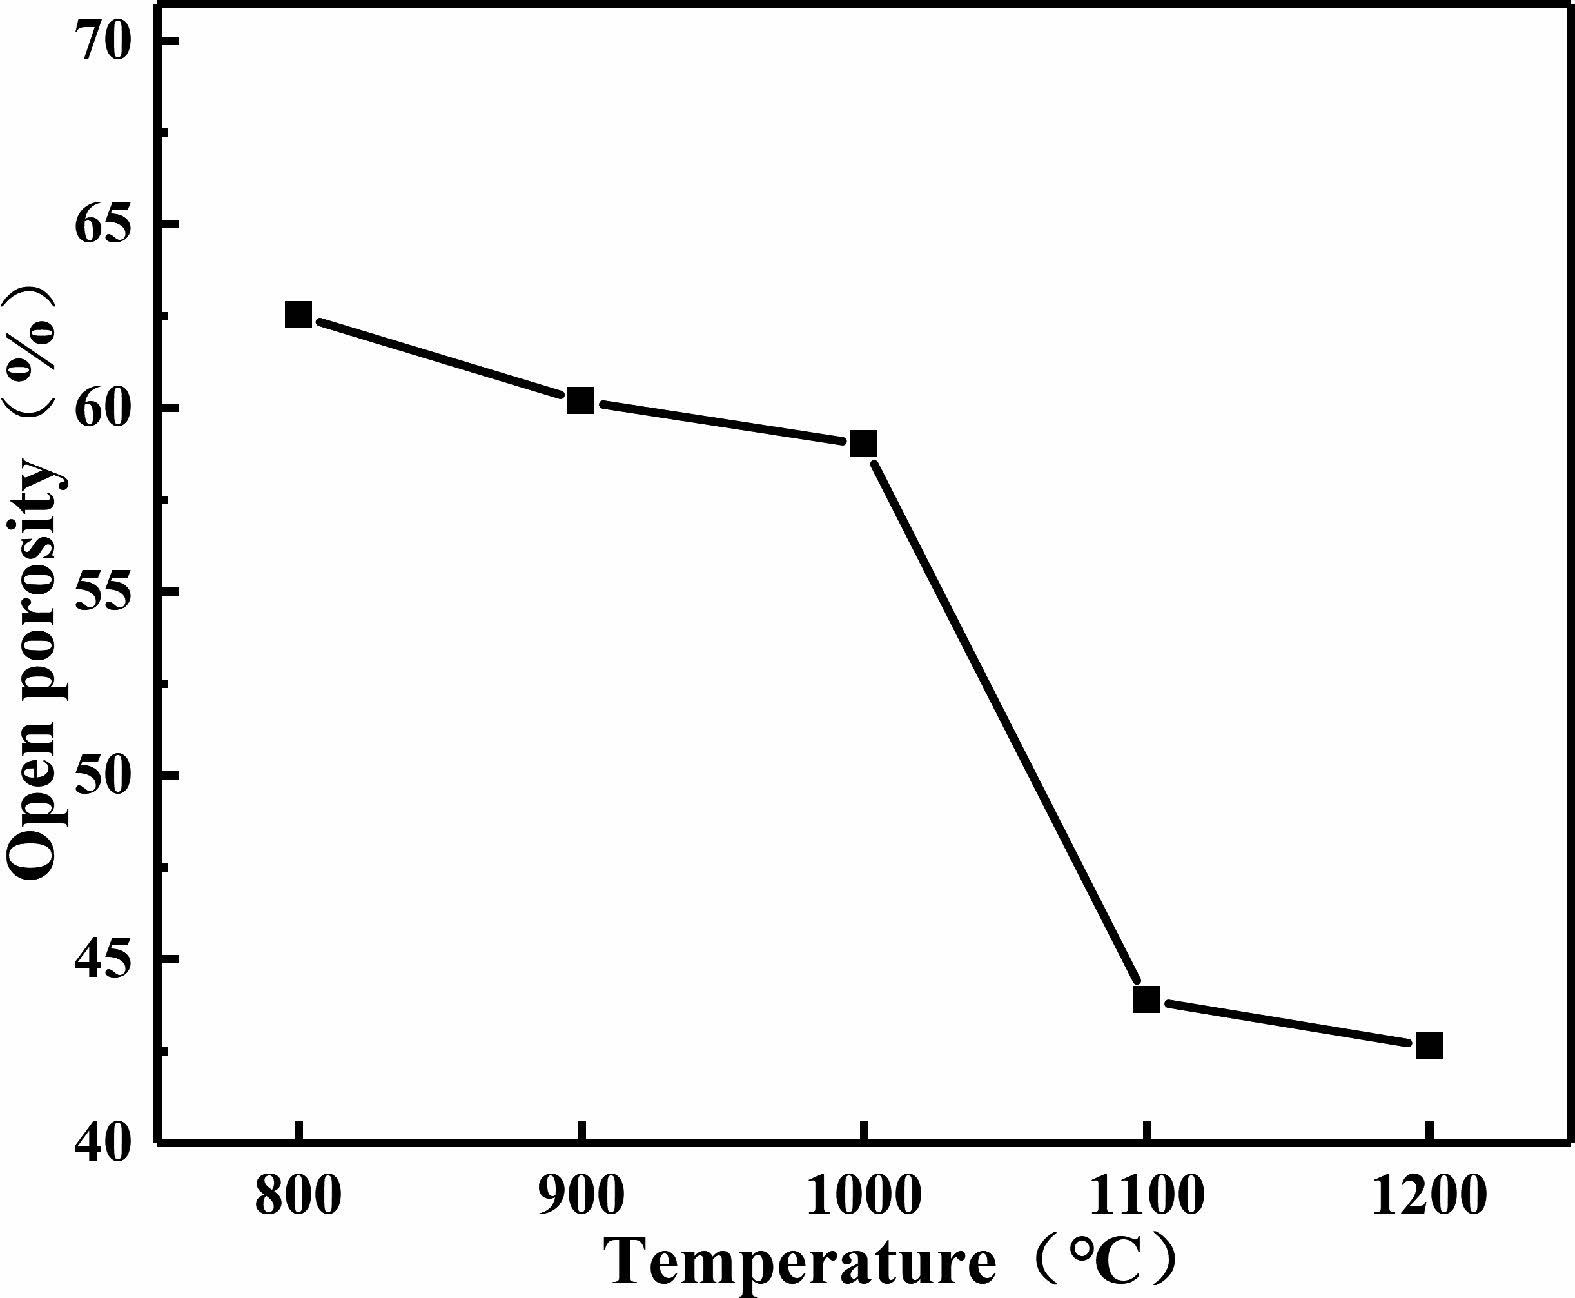
The variation curves of the open porosity of the C0 samples sintered at different temperatures are shown in Fig. 11. It can be observed that, the open porosity of samples decreases gradually with the increase of sintering temperature.
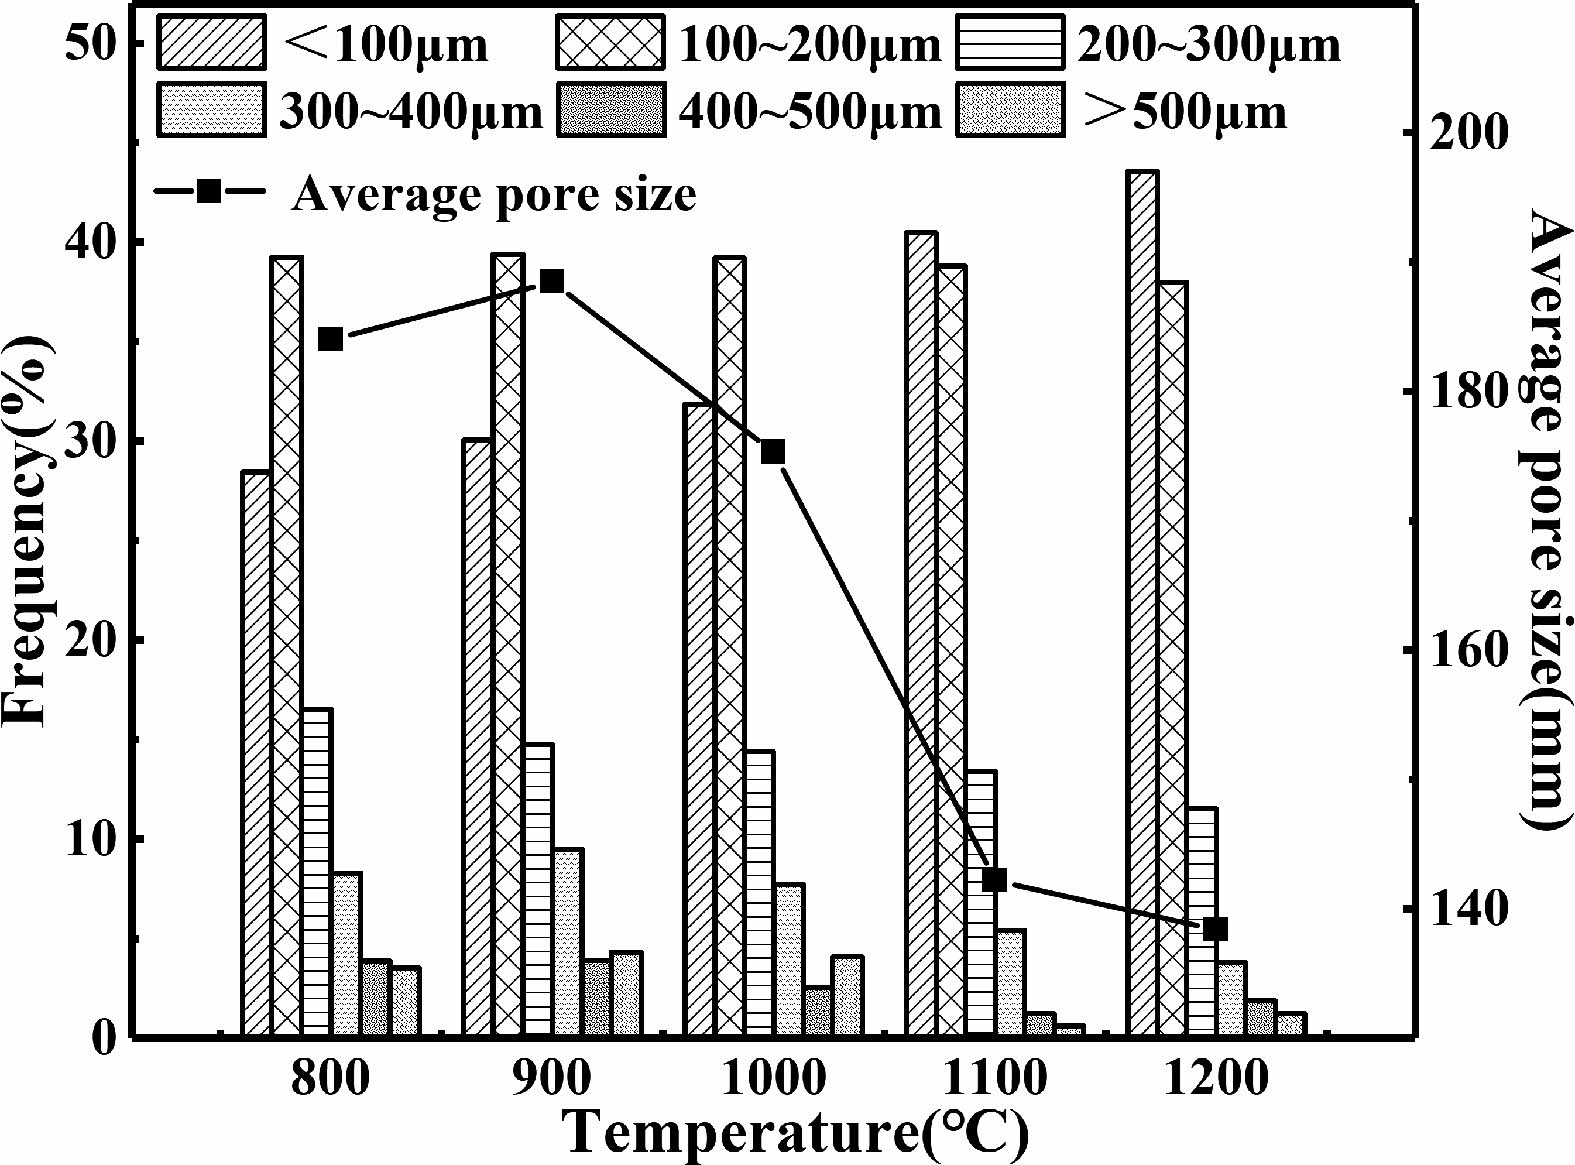
From Fig. 12, it can be observed that as the sintering temperature increases, the proportion of pores with pore sizes less than 100 μm in the sample increases. The proportion of pores with pore sizes ranging from 100 μm to 200 μm remains unchanged nearly. The proportion of pores with other pore sizes in the sample increases. The average pore size of the samples decreases with the increase of sintering temperature.
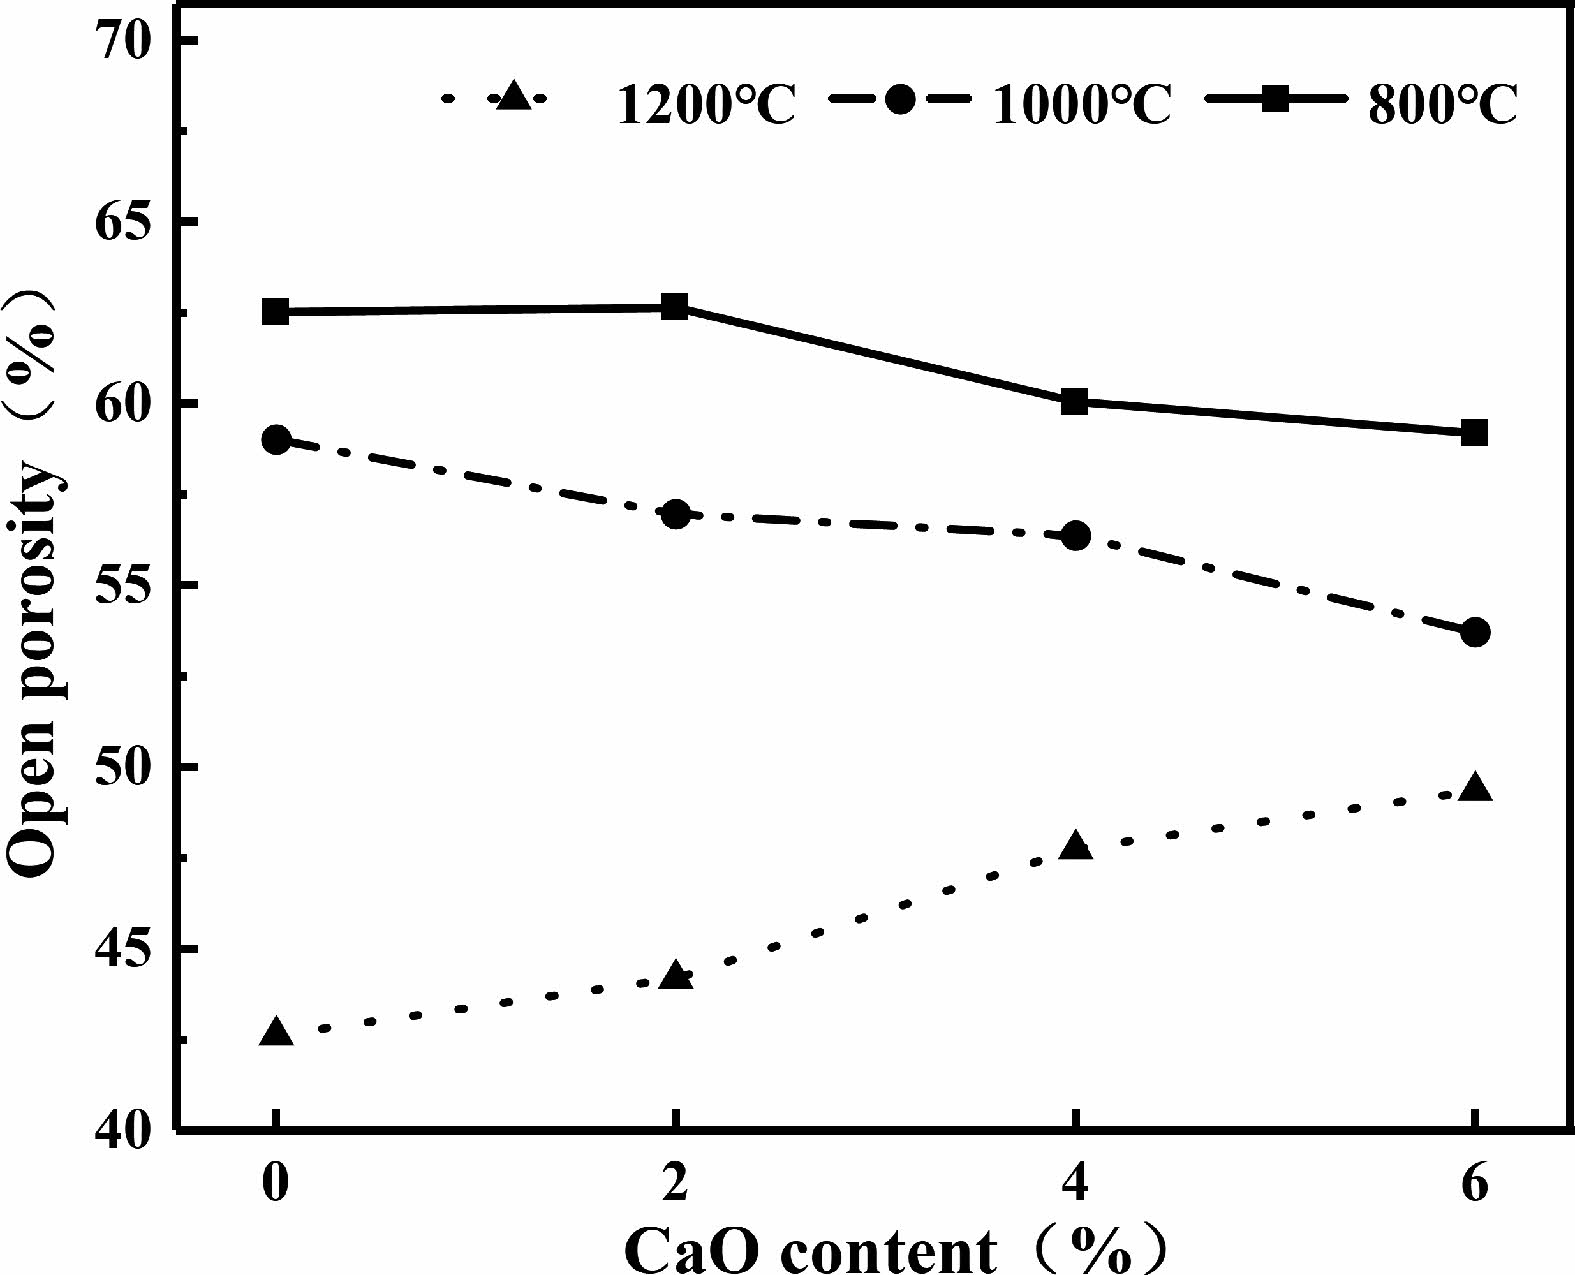
Fig. 13 shows the change curves of open porosity of samples containing calcium oxide after being sintered for 2 hours. When the samples were sintered at 800 ℃ and 1000 ℃, the open porosity of the sample decreases with the increase of calcium oxide content. After sintering at 1200 ℃, the open porosity of the samples increases with the increase of calcium oxide content.
The addition of calcium oxide reduces the connected pores of the green bodies, resulting in a decrease in the open porosity of the green bodies [19]. After sintering at 800 ℃, only small shrinkage of the sample was observed, so the addition of calcium oxide caused a small decrease in the open porosity. When the sintering temperature is 1000 ℃, the addition of calcium oxide promotes the sintering process [32], the shrinkage and density of the matrix increases, and the open porosity decreases. When the sintering temperature is 1200 ℃, the open porosity of the sample increases with the increase of calcium oxide content, as the volume shrinkage decreases with the increase of the calcium oxide content.
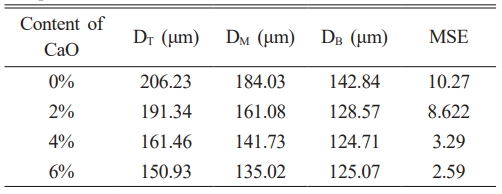
After being sintered at 800 ℃ for 2 hours, the average pore sizes on the cross-section of the C0~C6 samples at both ends and in the middle are calculated and denoted as DT, DM, and DB, respectively. The mean squared error (MSE) [37] was calculated for the frequency of the distribution of the pore sizes at both ends of the sample. The results are shown in Table 1, it can be observed that as the calcium oxide content increases, the difference in average pore size between the three cross-sections gradually decreases. Samples with lower calcium oxide content have higher MSE values, while samples with higher calcium oxide content have lower MSE values. These indicate that, adding calcium oxide can accelerate the solidification and molding of the slurry [38], to improve the uniformity of pore size distribution in the height direction of the samples.
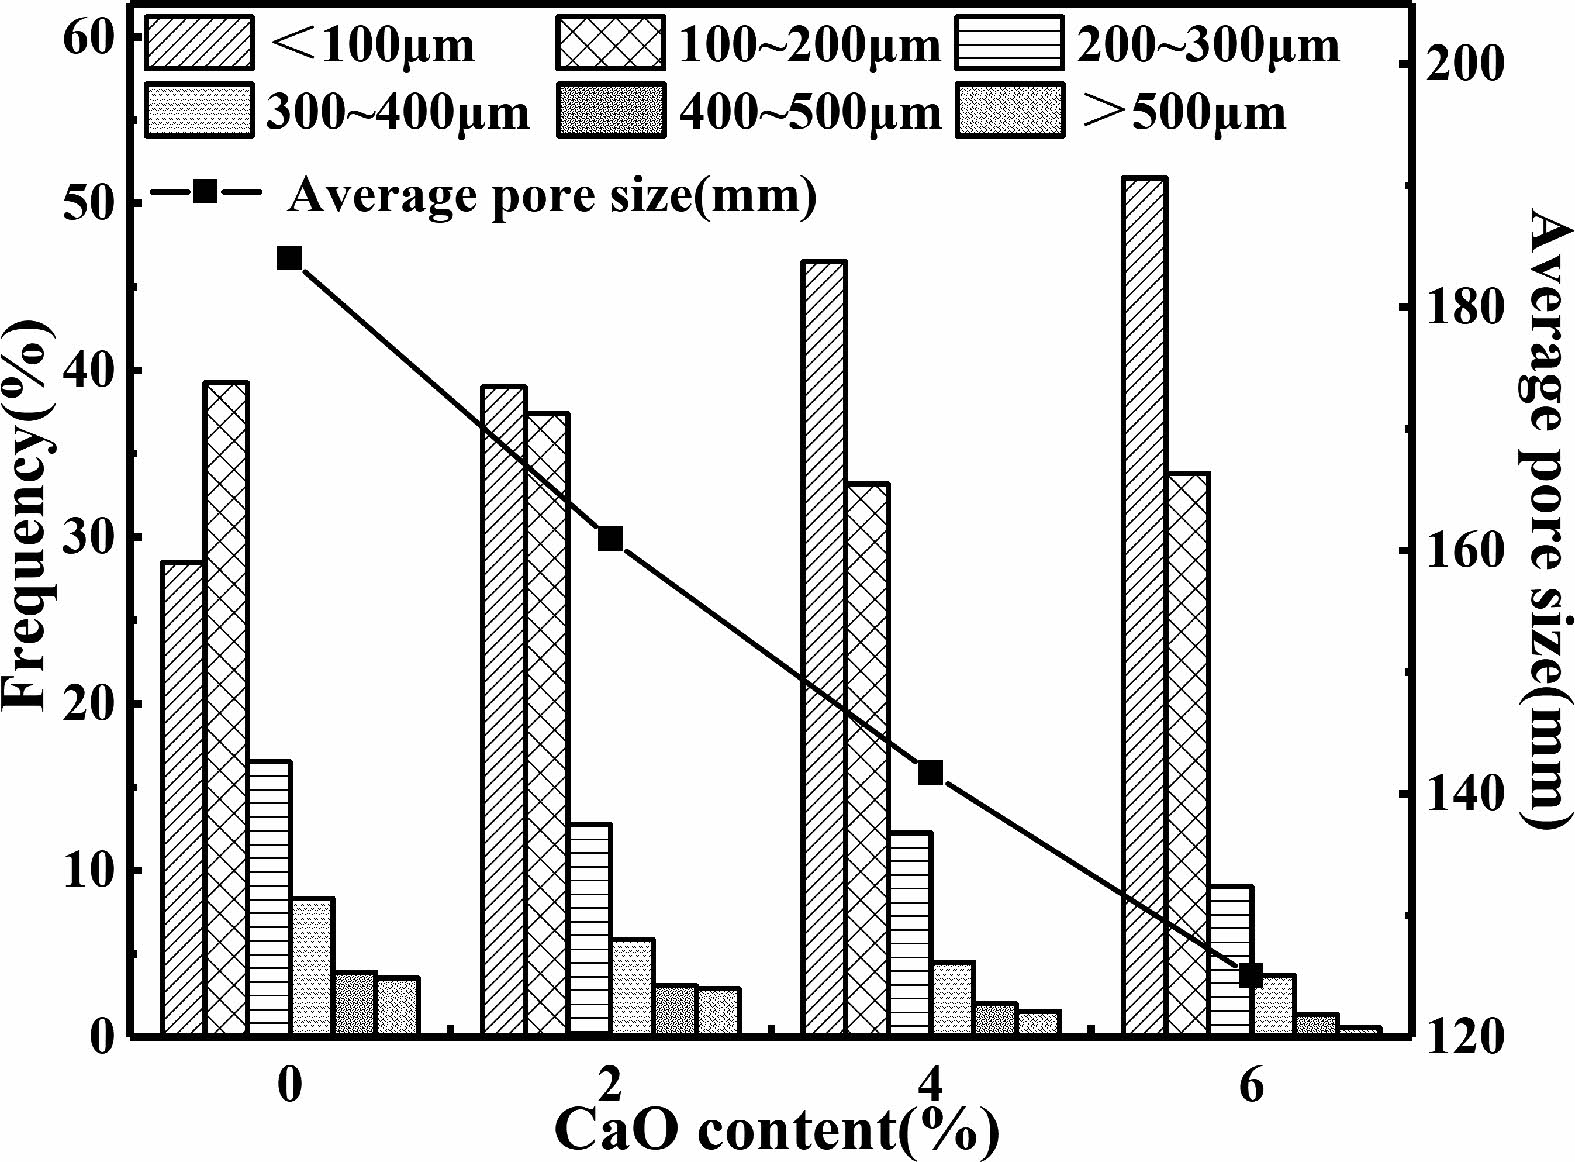
Due to the high bond energies of Si-O bond and Al-O bond, they are 444 kJ mol-1 and 221~280 kJ mol-1, respectively [39]. So Al3+ and Si4+ are released after chemical bond fracture in alkaline environment, and the reaction rate of polycondensation to three-dimensional gel structure through geopolymerization is slow, this creates a merger between bubbles, with smaller bubbles merging into larger bubbles. The larger bubbles in the slurry will withstand greater buoyancy, large bubbles tend to rise to top while small bubbles are at the bottom, resulting in uneven distribution of bubbles in the height direction. The bond energy of the Ca-O bond is 134 kJ mol-1 [39], which is lower than that of Si-O bond and Al-O bond. Ca2+ can be released relatively quickly, then form insoluble C-S-H gel with Si4+ in solution, which can accelerate the curing process of geopolymer [21, 40]. So the solidification time of slurries is greatly shortened. The rigid skeleton in the geopolymer is rapidly formed, and the combination between foam is limited, the stratification of bubbles is effectively avoided, and the pore size distribution is more uniform in the height direction. Meanwhile, the proportion of smaller pores in the sample gradually increases. As shown in Fig. 14, with the increase of calcium oxide content, the proportion of pore sized less than 100 μm increases, while the proportion of pore size in the rest as well as the average pore size are decreased.
Adsorption performance of geopolymer porous ceramics
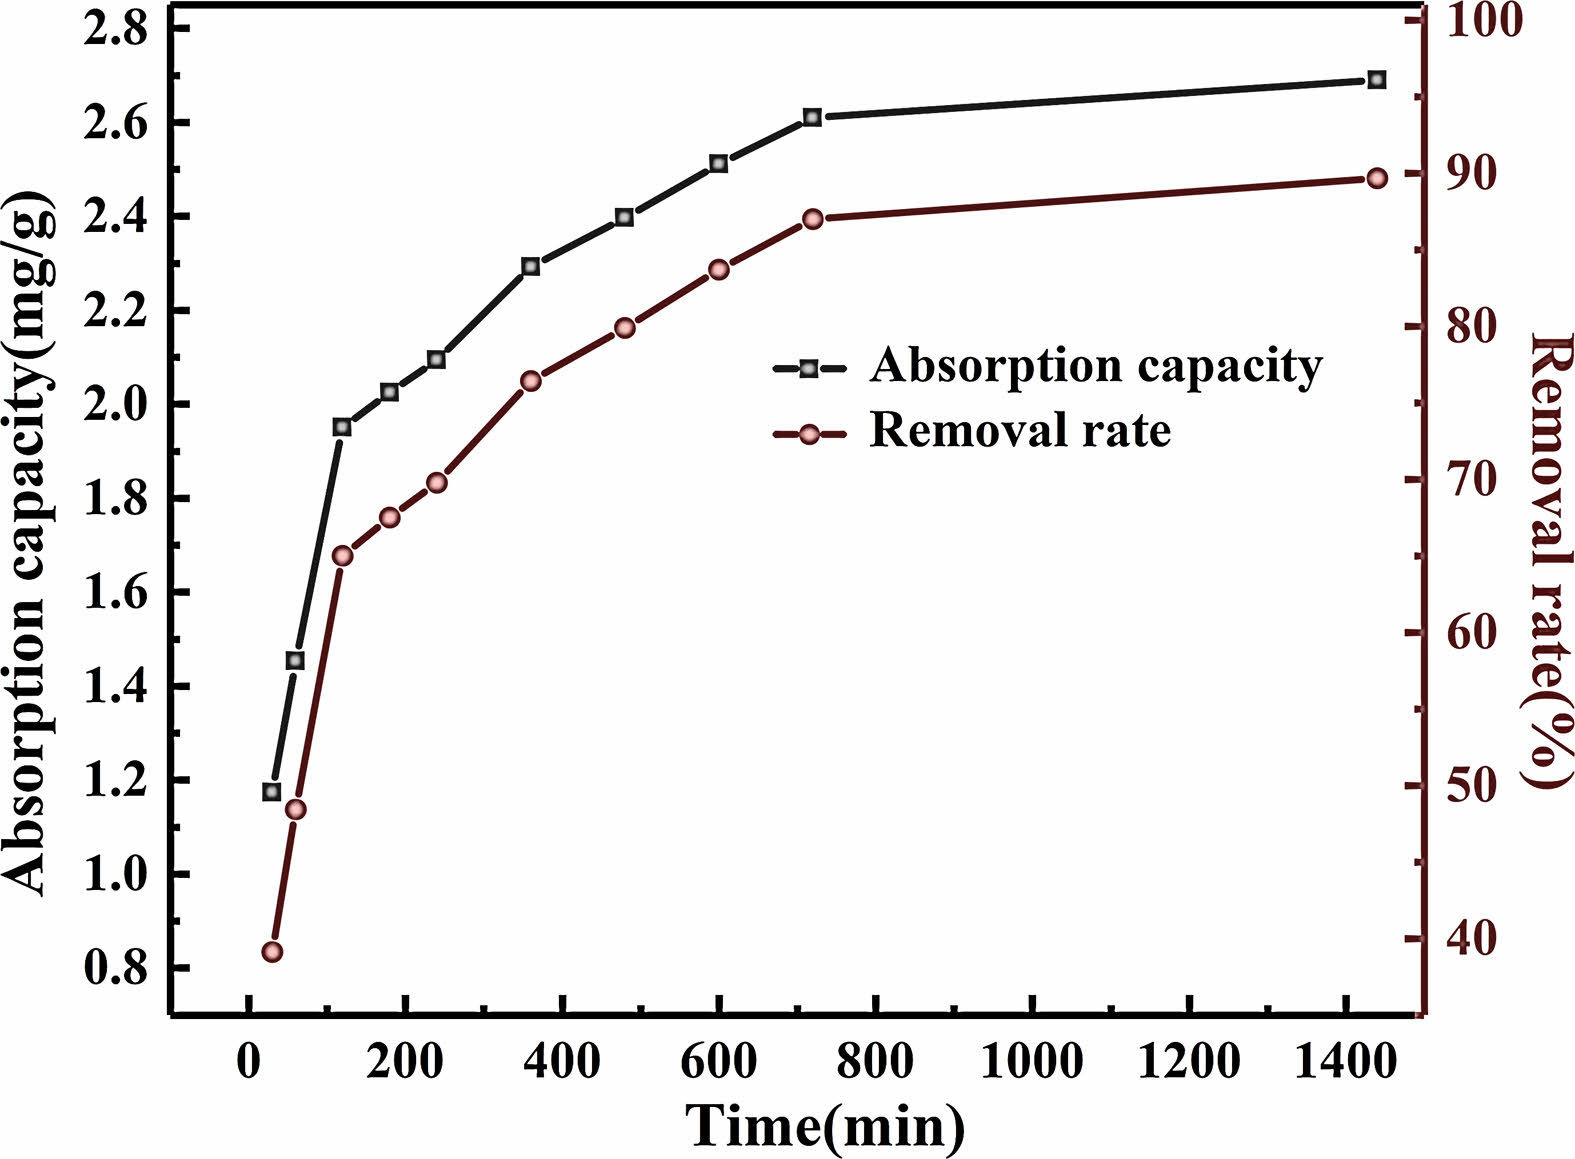
The effect of different time on the adsorption performance of Pb (II) is shown in Fig. 15. As the adsorption time prolongs, the adsorption capacity of geopolymer porous ceramics for Pb (II) continues to increase. During the adsorption time of 0-120 minutes, there is a huge Pb (II) concentration difference between the geopolymer porous ceramics surface and the solution. Under this greater concentration difference, the active sites exposed by geopolymer porous ceramics will quickly be occupied by Pb (II) in the solution, and the adsorption capacity will rapidly increase. As adsorption continues, during the adsorption time of 120~600 minutes, the number of adsorption sites relative to Pb (II) gradually decreases, and the mass transfer motion between the solution and the adsorbent surface begins to weaken [41, 42]. The increase in adsorption capacity begins to slow down. After the adsorption time reaches 600 minutes, the active sites on the adsorbent surface have become saturated [43]. With the extension of adsorption time, the adsorption capacity of geopolymer porous ceramics for Pb (II) remains almost unchanged or only slightly increases.
After 24 hours of adsorption, the removal rate of Pb (II) in the waste liquid reached 89.67%, and the adsorption capacity of porous geopolymer ceramics for Pb (II) reached 2.69 mg/g, confirming the potential application of the geopolymer porous ceramic prepared in this paper in the field of adsorption materials.
|
Fig. 1 XRD patterns of sintered C0 samples at different sintering temperatures. |
|
Fig. 2 XRD patterns of sintered C6 samples at different sintering temperatures. |
|
Fig. 3 XRD patterns of sintered C0~C6 samples (a)sintered at 800 ℃; (b) sintered at 1000 ℃; (c) sintered at 1200 ℃. |
|
Fig. 4 The macroscope images of sintered C0 samples (a)sintered at 800 ℃ (b)sintered at 1200 ℃. |
|
Fig. 5 SEM images of C0 samples sintered at 800 ℃ |
|
Fig. 6 SEM images of C0 samples sintered at 1000 ℃. |
|
Fig. 7 SEM images of C0 samples sintered at 1200 ℃. |
|
Fig. 8 SEM images of C6 samples sintered at 1200 ℃. |
|
Fig. 9 Volume shrinkage and compressive strength of C0 samples. |
|
Fig. 10 Volume shrinkage and compressive strength of C0~C6 samples. |
|
Fig. 11 Porosity of C0 samples sintered at different temperatures. |
|
Fig. 12 Pore proportion and average pore size of C0 samples sintered at different sintering temperatures. |
|
Fig. 13 Porosity of samples sintered with different calcium oxide content. |
|
Fig. 14 Pore proportion and average pore size of samples with different calcium oxide content sintered at 800 ℃. |
|
Fig. 15 Effect of adsorption time on adsorption performance of geopolymer porous ceramics. |
|
Table 1 The average pores size of cross-sections of the sintered samples with different calcium oxide content. |
In this paper, geopolymer porous ceramics with high porosity were prepared by casting process.
(1) For samples without calcium oxide, sintering occurs at high temperatures. After sintering at 1150 ℃, leucite is precipitated. As the sintering temperature increases, the shrinkage rate gradually increases, the porosity gradually decreases, the compressive strength continuously increases, and the proportion of micropores and small pores continuously increases.
(2) Calcium oxide can promote the curing reaction of geopolymer gel slurry, hinder the clustering and merging of bubbles, make the pore size of the sample evenly distributed in the height direction and further refine the pore size. During the sintering process, calcium oxide can reduce the viscosity of the liquid phase which is produced at high temperatures, and promote the precipitation of leucite phase. Leucite phase is precipitated when the sample is sintered at 1000 ℃. When the sintering temperature is 1000 ℃, the shrinkage rate and compressive strength of the sample increase with the increase of calcium oxide addition, while the open porosity decreases accordingly. When the sintering temperature is 1200 ℃, with the increase of the calcium oxide addition, the volume shrinkage and compressive strength of the sample decrease, while the open porosity increases.
(3) The porous ceramics after catalyst loading successfully adsorbed Pb(Ⅱ) in waste liquid, indicating that the porous ceramics prepared in this paper have certain potential in the field of adsorption materials.
This research was supported by the development and application of hygroscopic materials suitable for hot summer and cold winter areas grant funded by Anhui Jianzhu University (No. JY2021-C-125).
- 1. E.C. Hammel, O.L.-R. Ighodaro, and O.I. Okoli, Ceram. int. 40[10] (2014) 15351-15370.
-

- 2. Andre R. Studart, U.T. Gonzenbach, E. Tervoort, and L. J. Gauckler, J. Am. Ceram. Soc. 89[6] (2006) 1771-1789.
-
- 3. T. Zhang, S. Zhu, G. Fei, and Y. Ma, J. Ceram. Process. Res. 23[6] (2022) 845-852.
-
- 4. E.M.M. Ewais, Y.M.Z. Ahmed, and A.M.M. Ameen, J. Ceram. Process. Res. 10[6] (2009) 721-728.
-
- 5. V. Shumilov, A. Kirilin, A. Tokarev, S. Boden, M. Schubert, U. Hampel, L. Hupa, T. Salmi, and D.Y. Murzin, Catal. Today 383 (2022) 64-73.
-
- 6. Z. Shao, Z. Wu, L. Sun, X. Liang, Z. Luo, H. Chen, J. Li, and J. Wang, J. Mater. Sci. Technol. 119 (2022) 190-199.
-
- 7. S. Bhaskar, D.N. Seo, J.G. Park, G.H. Cho, B.H. Kang, T.Y. Lim, and I.J. Kima, J. Ceram. Process. Res. 16[5] (2015) 643-647.
-
- 8. G. Park, N. Sarkar, K.S. Lee, B. Basnet, and I.J. Kim, J. Ceram. Process. Res. 17[12] (2016) 1274-1278.
-
- 9. B. Basnet, W.Y. Jang, J.G. Park, I.S. Han, T.Y. Lim, H.M. Lim, and I.J. Kim, J. Ceram. Process. Res. 18[9] (2017) 634-639.
-
- 10. W. Zhao, S. Bhaskar, J.G. Park, S.Y. Kim, I.S. Han, and I.J. Kim, J. Ceram. Process. Res. 15[6] (2014) 503-507.
-
- 11. J. Davidovits, J. Therm. Anal. Calorim. 35[2] (1989)429-441.
-
- 12. M. Varuthaiya, C. Palanisamy, V. Sivakumar, and G. Pushpanath, J. Ceram. Process. Res. 23[6] (2022) 912-918.
-
- 13. M. Asadi, R. Naghizadeh, A. Nemati, K. Arzani, and R. Nassiri, J. Ceram. Process. Res. 13[4] (2012) 425-428.
-
- 14. C. Bagci, J. Ceram. Process. Res. 24[4] (2023) 700-704.
-
- 15. S. Kim and Y. Kim, J. Ceram. Process. Res. 18[1] (2017) 59-63.
-
- 16. P. He, D. Jia, and S. Wang, J. Eur. Ceram. Soc. 33[4] (2013) 689-698.
-
- 17. N. Xie, J.L. Bell, and W.M. Kriven, J. Am. Ceram. Soc. 93[9] (2010) 2644-2649.
-
- 18. T. Kovářík, T. Křenek, D. Rieger, M. Pola, J. Říha, M. Svoboda, J. Beneš, P. Šutta, P. Bělský, and J. Kadlec, Mater. Lett. 209 (2017) 497-500.
-
- 19. M.S. Cilla, P. Colombo, and M.R. Morelli, Ceram. Int. 40[4] (2014) 5723-5730.
-
- 20. X. Li, S. Deng, and G. Du, J. Taiwan. Inst. Chem. E. 131(2022)104171.
-
- 21. Y. Yang, B. Zhan, and Y. Zhang, J. Hefei. Univ. Technol. 43[8] (2019) 1102-1108.
- 22. J. Temuujin, A. van Riessen, and R. Williams, J. Hazard. Mater. 167[1-3] (2009) 82-88.
-
- 23. J.G. Park, M.J. Suh, and I.J. Kim, J. Ceram. Process. Res. 23[5] (2022) 559-565.
-
- 24. P. He, D. Jia, M. Wang, and Y. Zhou, Ceram. Int. 37[1] (2011) 59-63.
-
- 25. J.L. Bell, P.E. Driemeyer, and W.M. Kriven, J. Am. Ceram Soc. 92[3] (2009) 607-615.
-
- 26. P. Duxson, G.C. Lukey, and J.S.J. van Deventer, J. Non-cryst. Solids 353[22-23] (2007) 2186-2200.
-
- 27. Y. Kobayashi and E. Kato, J. Am. Ceram Soc. 77[3] (1994) 833-834.
-
- 28. X.L. Song and X.H. Huang, in “Fundamentals of inorganic Materials Science” (Chemical Industry Press, 2005) p. 284.
- 29. G. Christopoulou, F. Modarresifar, B.L. Allsopp, A.H. Jones, and P.A. Bingham, J. Am. Ceram Soc. 102[1] (2019) 508-523.
-
- 30. M. Rahm, R. Hoffmann, and N.W. Ashcroft, 23[16] (2016) Chem. Eur. J. 4017-4017.
-
- 31. Y. Zhang, J. Wu, P. Rao, and M. Lv, Mater. Lett. 60[23] (2006) 2819-2823.
-
- 32. F. Güngör, M.T. Day, B. Karasu, B. Altun, and M. Daday, J. August. Ceram. Soc. 59 (2023) 145-152.
-
- 33. S. Samal, N.P. Thanh, B. Marvalova, and I. Petrikova, JOM. 69[12] (2017) 2480-2484.
-
- 34. A. Tunali, E. Ozel, and S. Turan, J. Eur. Ceram. Soc. 35[3] (2015) 1089-1095.
-
- 35. P. Duxson, G.C. Lukey, and J.S.J. van Deventer, J. Non-cryst. Solids 352[52-54] (2006) 5541-5555.
-
- 36. T. Lin, D. Jia, P. He, and M. Ming, Int. J. Thermophys. 30[5] (2009) 1568-1577.
-
- 37. T.O. Hodson, T.M. Over, and S.S. Foks, J. Adv. Model. Earth Syst. 13[12] (2021) 1-10.
-
- 38. X. Chen, J. Zhang, M. Lu, B. Chen, S. Gao, J. Bai, H. Zhang, and Y. Yang, Constr. Build. Mater. 314[Part B] (2022) 125650.
-
- 39. J. Zeng, T. Zhou, and L. Liu, Bull. Chin. Ceram. Soc. 6 (2007) 1064-1067.
-
- 40. X. Yang, S. Wu, S. Xu, B. Chen, D. Chen, F. Wang, J. Jiang, L. Fan, and L. Tu, Constr. Build. Mater. 410 (2017) 134128.
-
- 41. Z. Deng, E.A. Oraby, and J.J. Eksteen, Sep. Purif. Technol. 236 (2020) 116280.
-
- 42. Y. Zhu, X. Yue, and F. Xie, Adsorp. Sci. Technol. 38[7-8] (2020) 254-285.
-
- 43. J. Di, Z. Ruan, S. Zhang, Y. Dong, S. Fu, H. Li, and G. Jiang, Sci. Rep. 12 (2022) 1394.
-
 This Article
-
2024; 25(1): 56-64
Published on Feb 29, 2024
- 10.36410/jcpr.2024.25.1.56
- Received on Oct 12, 2023
- Revised on Jan 18, 2024
- Accepted on Jan 18, 2024
Services
- Abstract
introduction
experimental program
results and discussion
conclusion
- Acknowledgements
- References
- Full Text PDF
Shared
Correspondence to
- Shaofeng Zhu
-
aSchool of Materials Science and Chemical Engineering, Anhui Jianzhu University, Hefei, 230601, China
bAnhui Engineering Research Center for Building Energy Conservation, Hefei, 230022, China
Tel : +86 13965020668 Fax: 0551-63513118 - E-mail: zhusf@ahjzu.edu.cn
Clean-Energy Research Institute(CRI), Hanyang University, 222, Wangsimni-ro, Seongdong-gu, Seoul, 04763, Korea
E-mail: jcpr@hanyang.ac.kr