


- Effects of ZnO and Al2O3 on optical properties of sanitary ware glazes without ZrSiO4
Yeonju Kima, Kangduk Kima,* and Kyu-sung Hanb,**
aDepartment of Advanced Material Engineering, Kyonggi University, Suwon 16227, Korea
bCeramic ware Center, Korea Institute of Ceramic Engineering and Technology, Icheon 17303, KoreaThis article is an open access article distributed under the terms of the Creative Commons Attribution Non-Commercial License (http://creativecommons.org/licenses/by-nc/4.0) which permits unrestricted non-commercial use, distribution, and reproduction in any medium, provided the original work is properly cited.
In this study, to replace zirconia-based white glaze, 3 wt% TiO2 was added to CaO-Al2O3-SiO2-ZnO with a translucent glaze, and ZnO and Al2O3 were added to suppress the yellowing of TiO2. According to the type and amount of additives, the crystal phases (X-ray diffraction, XRD) and microstructures (scanning electron microscopy (SEM) and energy-dispersive X-ray spectroscopy (EDS)) of the glazes were analyzed, and the whiteness, gloss, reflectance, and absorption coefficient were measured. XRD and SEM analyses revealed the presence of plate-like (SiO2) and needle-like (Al1.488Ca0.491Na0.499Si2.506O8) crystal phases that affected the whiteness of the glaze. The gloss of the specimen was significantly reduced (to <40) with the addition of Al2O3. Color analysis results revealed a yellow index (b*) ranging from 2.8% to 4.9% and whiteness ranging from 89% to 93% for all the specimens, which were similar to the values for the zirconia-based white glaze. Reflectance analysis in the visible range (300–800 nm) using Ultraviolet–visible–near-infrared spectrophotometer (UV-ViS-NIR) indicated a decrease in reflectance in the wavelength range of 400-500 nm and an increase in reflectance in the wavelength range of 500-700 nm.
Keywords: Opacity, Glazes, Optical properties, Color analysis, Microstructure.
Glaze, which is used in the ceramic industry, is a glassy film coating used to protect the surfaces of various ceramic products from contamination and chemical corrosion [1, 2]. In particular, in the sanitary ware industry, opaque glazes are primarily used for their sanitary aesthetic effect, providing a satisfactory appearance, and they can be mixed with coloring oxides to achieve a variety of colors [3, 4]. Opaque glazes used in sanitary ware are manufactured by uniformly dispersing fine opacifiers in various mineral raw materials such as clay, feldspar, or quartz or by utilizing high-refractive-index crystalline phase development to achieve diffuse-reflective properties [4-8].
Representative opacifier materials include SnO2, ZrO2, and TiO2. Among these, SnO2 can effectively create opacity through simple technical methods such as addition. However, it more expensive than zircon, making it less suitable for mass production [4, 9]. Zircon (ZrSiO4) and zirconia (ZrO2) can form white opaque crystalline phases with a high refractive index (1.94) and possess excellent mechanical properties and thermal and chemical stability, making them commercially viable opacifiers [5, 10-12]. However, the emission of trace amounts of radioactive substances is a problem, necessitating alternative opacifiers to replace zircons [13, 14]. TiO2 functions as a nucleating agent or opacifier when added to glazes, is relatively cost-effective, and has high utility. However, its opacification performance is lower than that of traditional zircons, and when added to alkaline glazes, it tends to produce ivory- or cream-colored opaque glazes, necessitating additional measures to inhibit yellowing [4, 9].
Research is actively ongoing to improve the properties of ceramic glazes by adding various oxides to suppress the yellowing caused by TiO2. Sijia et al. reported an improvement in whiteness with the addition of CaO to form titanite (CaTiSiO5) crystals in the glaze [15]. Keriman reported the development of both sphere-shaped titanite (CaTiSiO5) and needle-shaped zinc orthotitanate (TiZn2O4) crystal phases by adjusting the contents of TiO2 and ZnO, which resulted in the formation of a white glaze [16]. Wahab et al. reported glass with added ZnO, which increased opacity by breaking Si-O-Si bonds in the glass to form non-bridging oxygen (NBO) sites, while Boudeghdegh et al. reported that ZnO influences the whiteness and mechanical properties depending on the composition [1, 17]. Marcin et al. suggested that high-refractive-index crystal phases, such as spinel, wollastonite, anorthite, and sphene, can be used as opacifiers in glazes. They also reported the production of white glazes with high-refractive-index gahnite (ZnAl2O4) and willemite (Zn2SiO4) crystal phases through the addition of ZnO [10]. Marcin et al. reported the manufacture of white glazes for sanitary wear using needle-shaped anorthite crystal phases [4].
In this study, opaque glazes were produced in a CaO-Al2O3-SiO2-ZnO-based glaze by adding 3 wt% TiO2. ZnO and Al2O3 were added to suppress yellowing, and the crystal-phase formation and microstructural changes were examined with different amounts of the additives. We also investigated the changes in the surface optical properties.
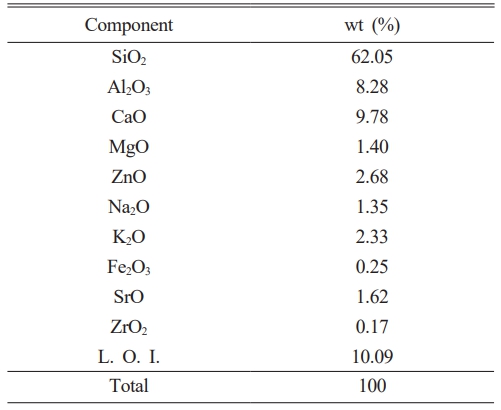
In this study, a sanitary wear glaze with a composition based on CaO-Al2O3-SiO2-ZnO without a ZrO2 opacifier was selected as the starting material, and its chemical composition was analyzed using X-ray fluorescence spectroscopy (ZSX Primus, Rigaku Co., Japan). To control the opacification properties of the glaze, additives were used, including ZrO2 (Kojundo Chemicals, Ltd., Japan; 98%, ~1 µm), ZnO (Kojundo Chemicals, Ltd., Japan; 3 N, ~1 µm), Al2O3 (Kojundo Chemicals, Ltd., Japan; 4 N, ~1 µm), and TiO2 (Kojundo Chemicals, Ltd., Japan; 3 N, ~2 µm) were mixed. The batch composition of the experimental glaze are presented in Table 1. The mixed raw materials were subjected to 24 h of dry milling using a ball mill with zirconia balls (diameters = 5 and 20 mm) for mixing and grinding. To analyze the sample, a slurry was prepared (glaze powder:D.I water, 10:7), after which a glaze with a thickness of 800 μm was coated on an alumina substrate using a doctor blade. Each of the prepared samples was sintered in a SiC box electric furnace (heating rate = 0.32 °C/min, maximum temperature = 1230 °C). The temperature and holding time were identical to the heat-treatment conditions used for sanitary ware manufacturing.
X-ray diffraction (XRD) analysis (MiniFlex Ⅱ, Rigaku Co., Japan) with Cu-Kα radiation was performed to analyze the crystal phase and crystallinity of the glazes with respect to the mixing ratio. After the glaze was etched in a 3 wt% solution of HF for 3 s, the microstructure of the glaze surface was examined using scanning electron microscopy (SEM, Nova Nano SEM450, FEI Company, USA), and a quantitative component analysis of the glaze surface was performed using energy-dispersive X-ray spectroscopy (EDS, APOLLO X, AMETEK Inc., USA). The whiteness and gloss of the glaze surface were analyzed using a spectral colorimeter (NR100 Precision Colorimeter, 3NH Technology Co., China) and a gloss meter (NOVO-gloss, RHOPOINT, UK), to which the KS L 5113 and ASTM C584–81 standards were applied, respectively. The whiteness was analyzed using a D65 illuminant according to Equation (1).

The reflectance of the glaze surface was measured using an UV-ViS- NIR spectrophotometer (Cary 5000, Varian Co., USA), and the analysis was conducted over the wavelength range of 300-800 nm using an integrating sphere. The color of the glaze was predicted using the Kubelka-Munk model, according to the reflectance (R), absorption (K), and scattering (S) of light using Equation (2).

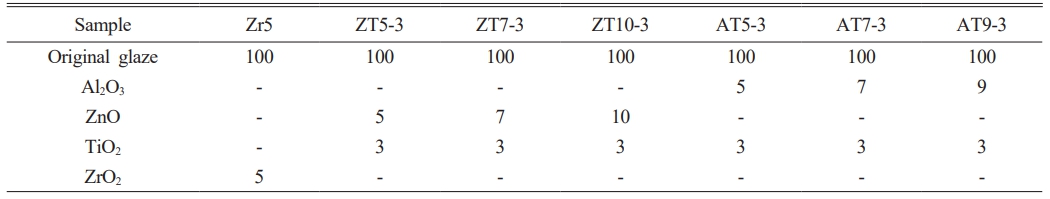
Table 2 presents the chemical composition of the original glaze. In the sanitary ware glaze of this study, SiO2 (62.05 wt%), Al2O3 (8.28 wt%), CaO (9.78 wt%), and ZnO (2.68 wt%) were observed as the main components, and alkali/alkaline earth oxides such as K2O (2.33 wt%), Na2O (1.35 wt%), MgO (1.40 wt%), and SrO (1.62 wt%) were observed in insignificant quantities [10]. To observe changes in color and surface optical properties according to various types of fluxes, we used a starting composition different from that of typical sanitary ware glazes, excluding zirconium minerals. Owing to the use of mineral raw materials, significant loss on ignition(L.O.I) occurred during the heat treatment, which was due to the water of both crystallization and adsorption and the combustion of organic matter [18].
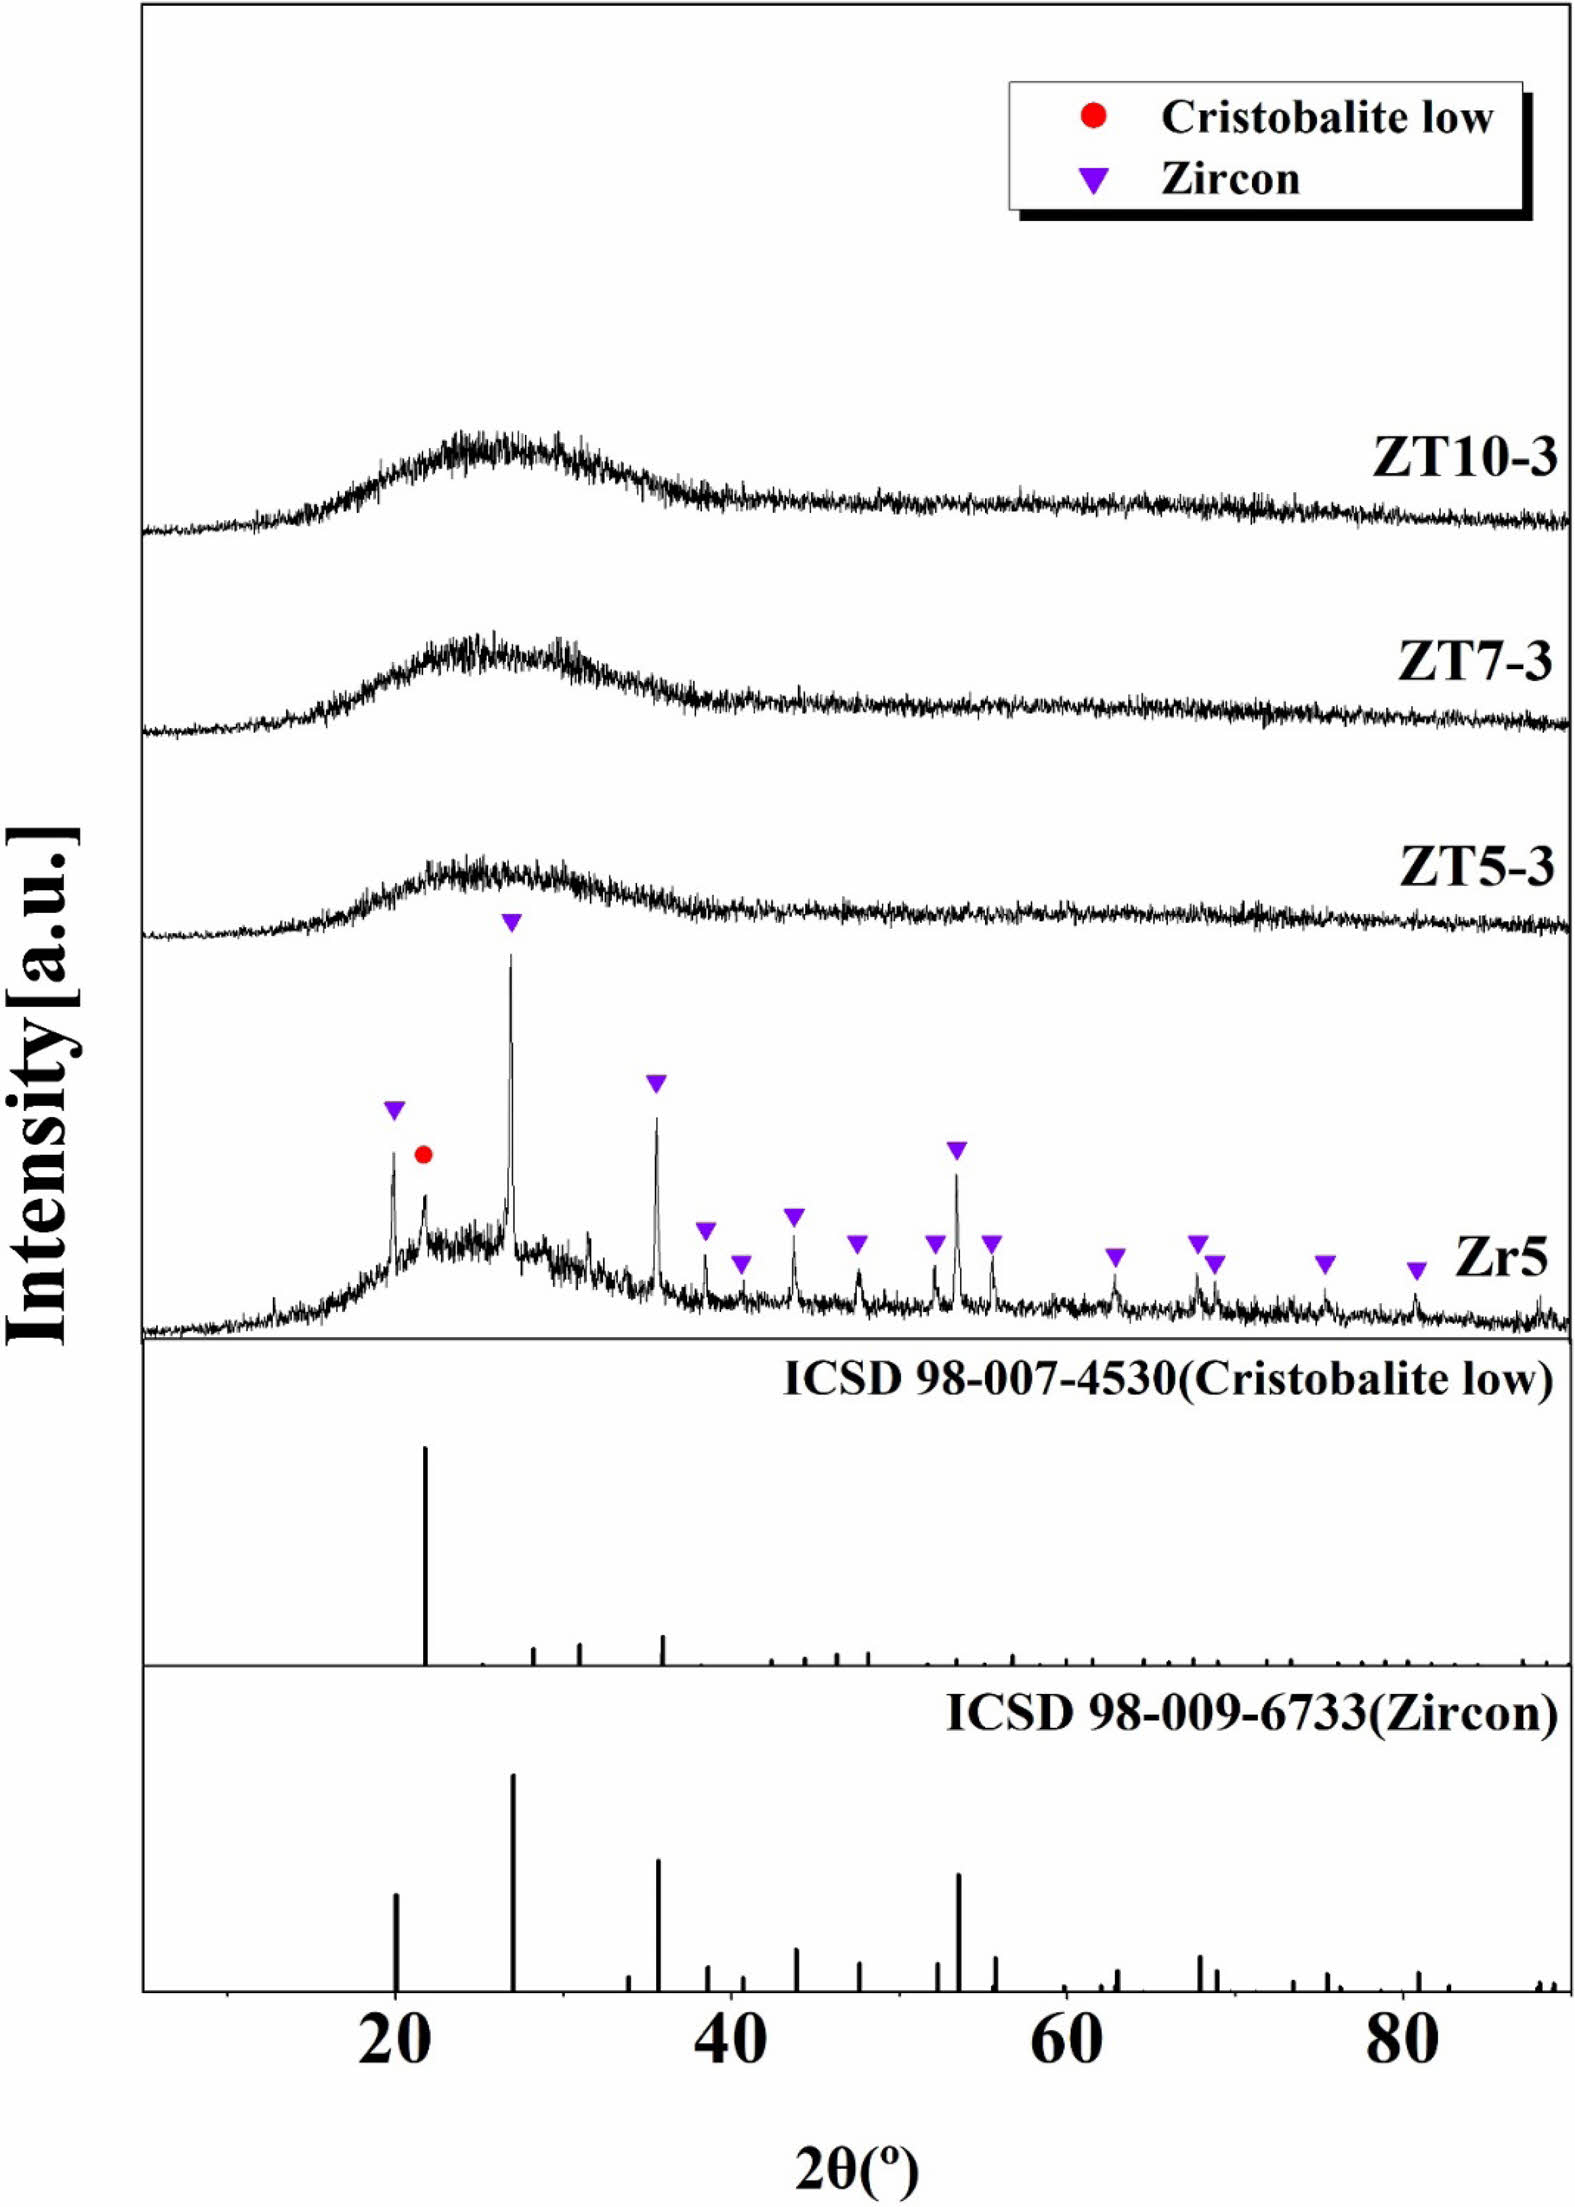
Figure 1 shows the XRD analysis of the crystalline phases of the glaze samples sintered at 1230 °C for different quantities of ZrO2, ZnO, and TiO2. In the Zr5 specimen, which has a composition similar to that of conventional commercial glazes, both zircon (ZrSiO4, ICSD 98-009-6733) and cristobalite low(SiO2, ICSD 98-007-4530) crystalline phases were observed. They are attributed to the added ZrO2 component, with Zr4+ cations disrupting existing Si-O-Si bridging bonds, leading to the formation of a new crystalline zircon phase [19]. In contrast, specimens with added ZnO and TiO2, regardless of the amount, exhibited a typical amorphous peak form. This is attributed to ZnO acting as a flux, reducing the viscosity and surface tension of the glass and interfering with the nucleation-promoting role of TiO2, which resulted in the amorphous form of the glaze [16].
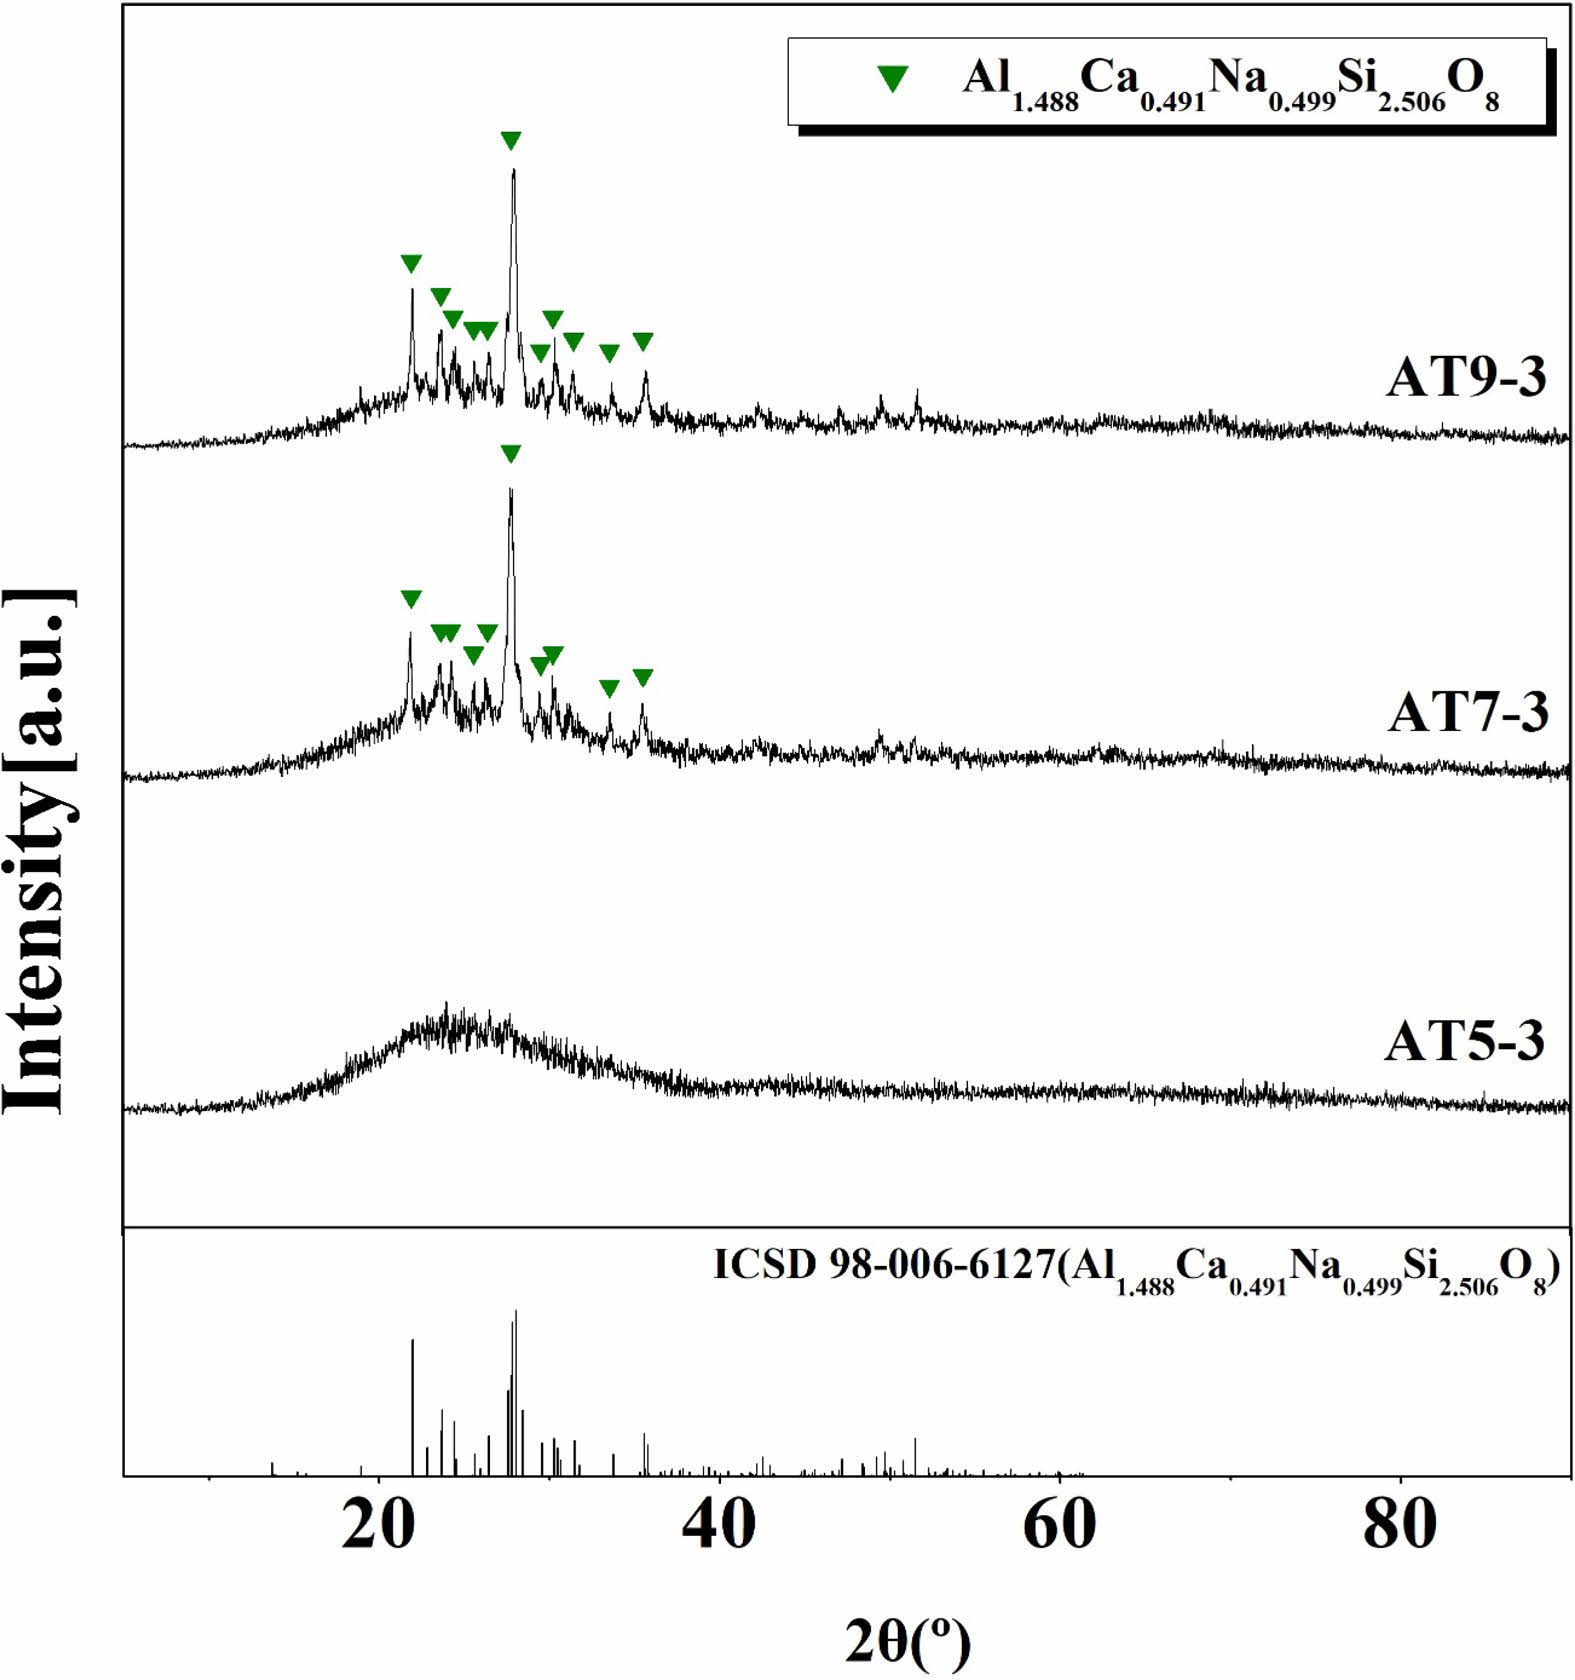
Figure 2 shows the XRD analysis of the crystalline phases of the glaze samples sintered at 1230 °C for different quantities of Al2O3 and TiO2. In the AT5-3 specimen, to which Al2O3 and TiO2 were added at 5 and 3 wt%, respectively, a typical amorphous peak form was observed. When the TiO2 content was fixed at 3 wt% and Al2O3 was added at 7 and 9 wt%, as in the AT7-3 and AT9-3 specimens, the crystalline phase anorthite–sodium (Al1.488Ca0.491Na0.499Si2.506O8) was observed. This is attributed to be the result of a structural phase transition induced by temperature, pressure, and chemical composition, where some of the Ca2+ ions present in the anorthite (CaAl2Si2O8) crystalline phase were substituted with Na+ ions, forming a crystalline phase belonging to the alkali feldspar called Ca-albite ((Na,K)1-xCaxAl3-xSi1+xO8) [20, 21]. Furthermore, it is assumed that the addition of Al2O3 in certain amounts (6-12 mol%) reduces the glaze melt solubility and increases the viscosity, leading to the formation of the anorthite–sodian crystalline phase [22, 23].
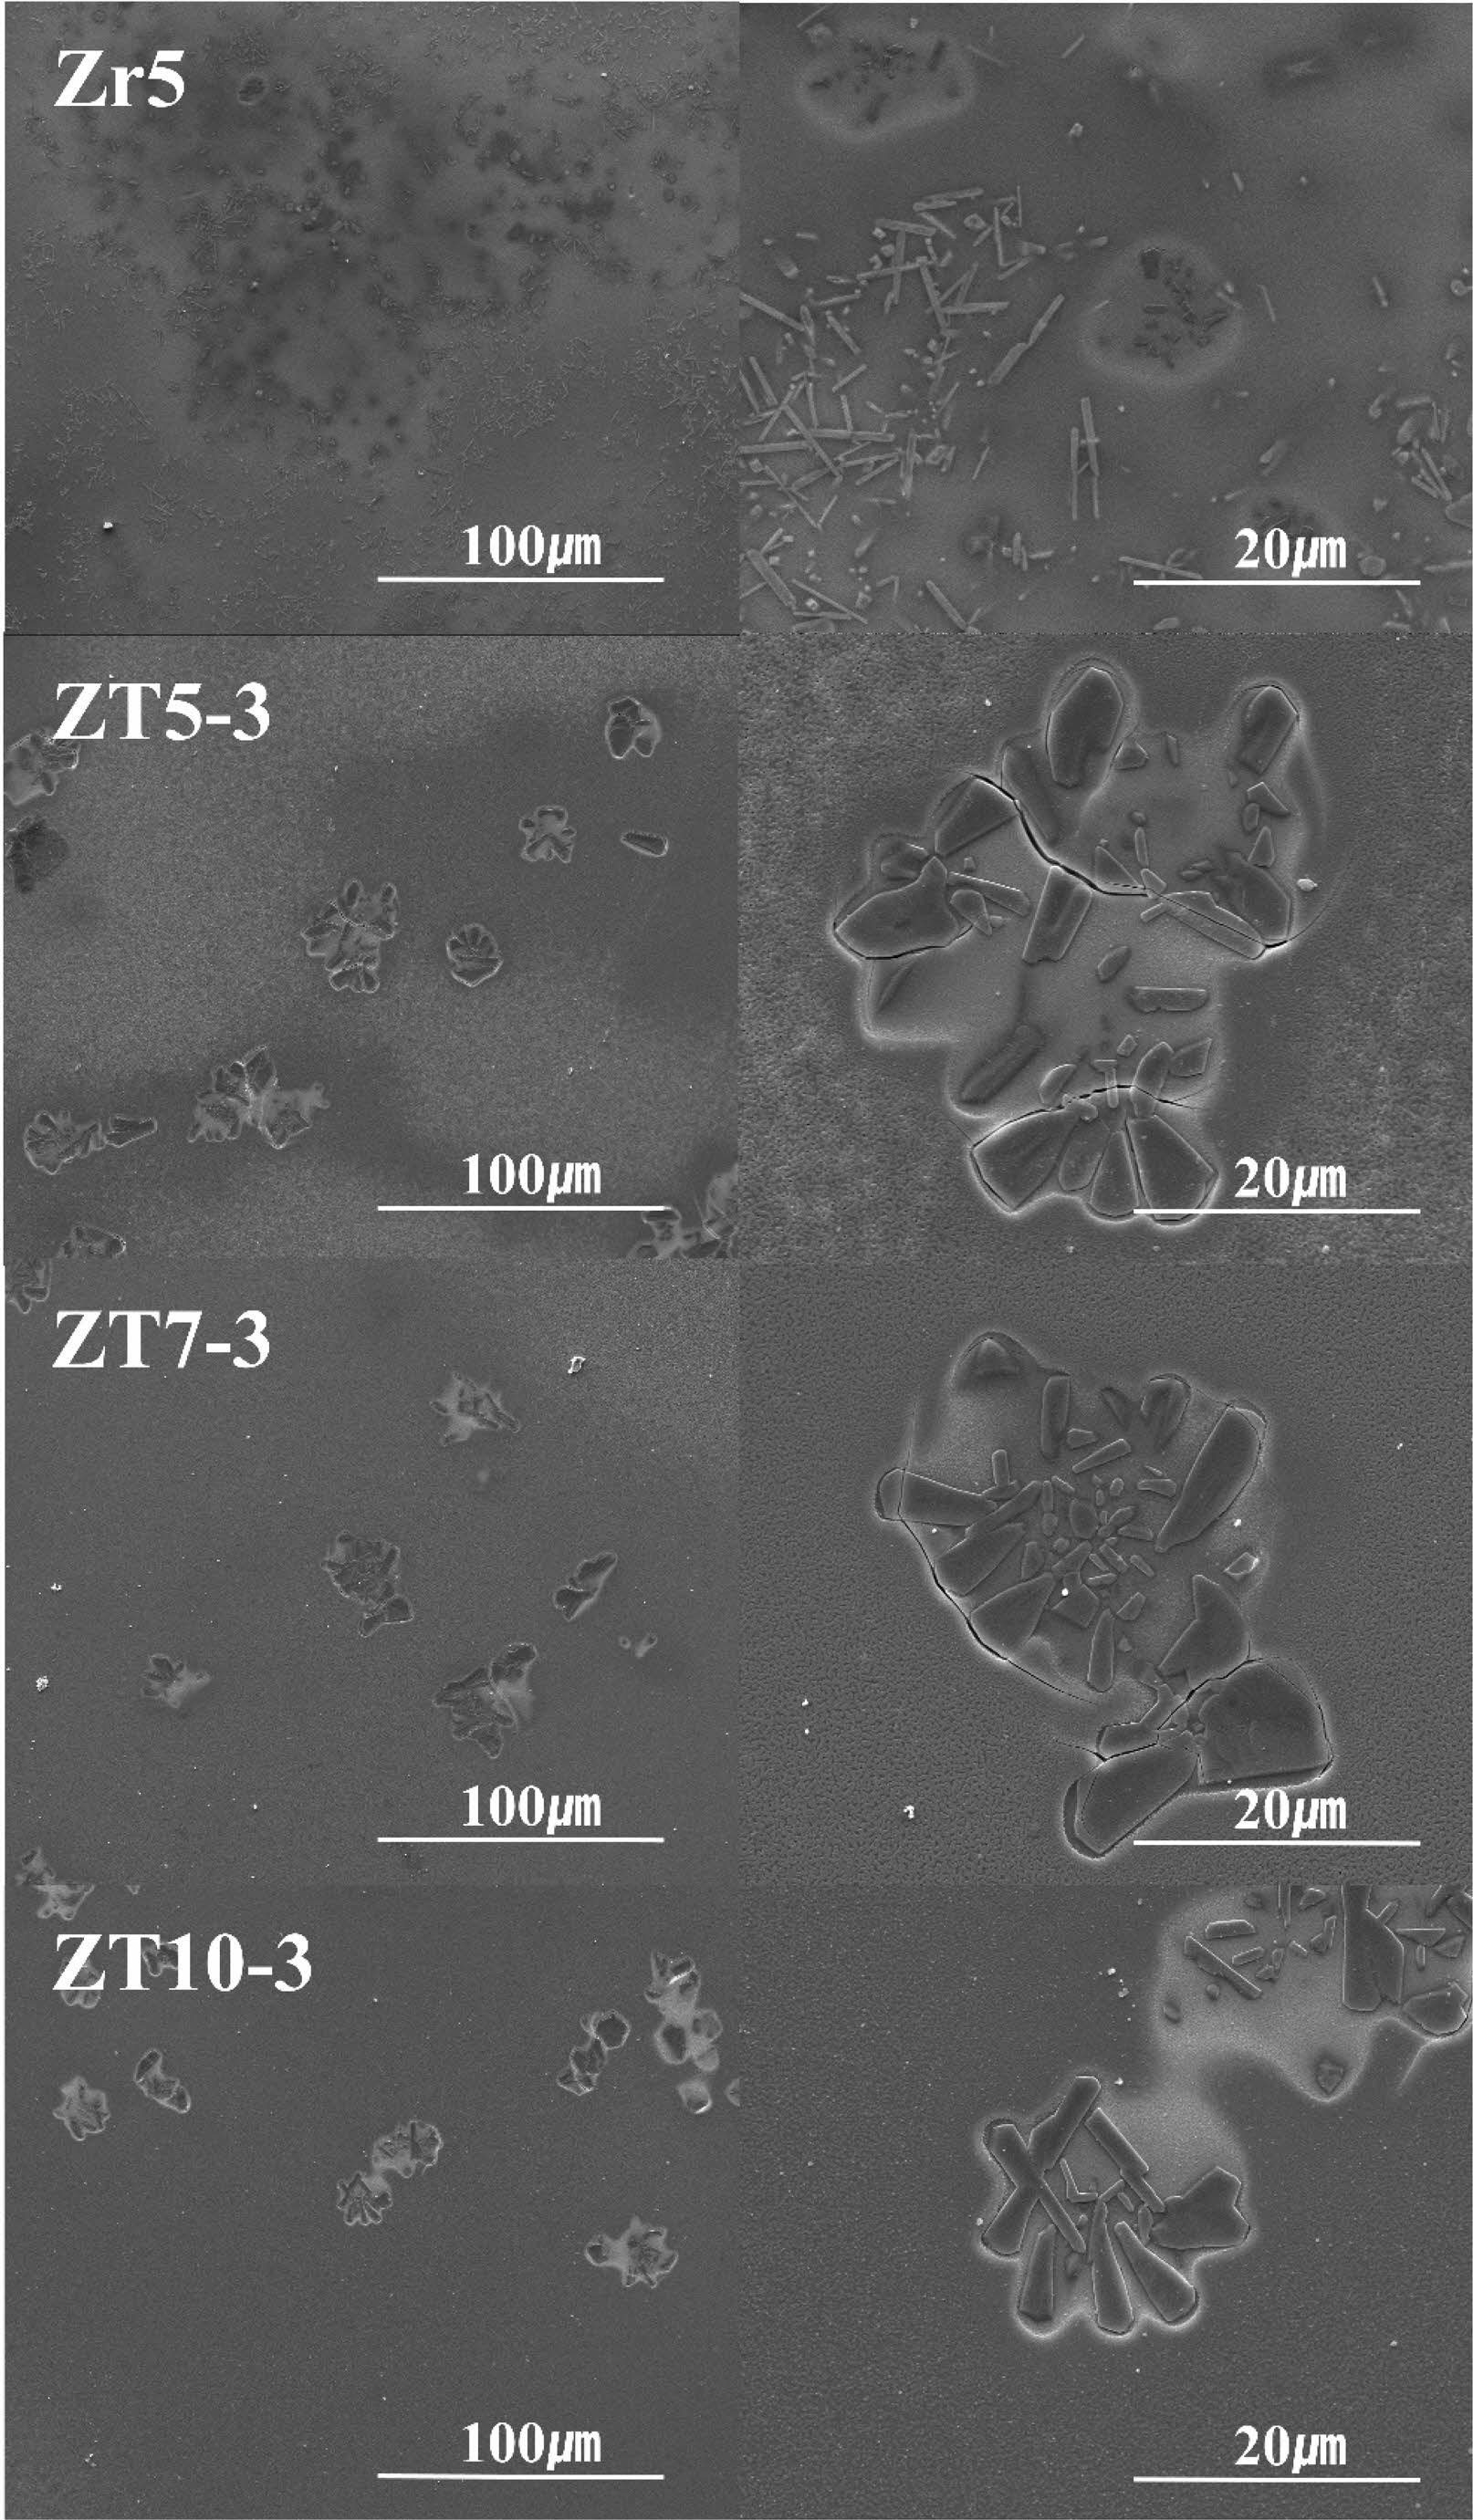
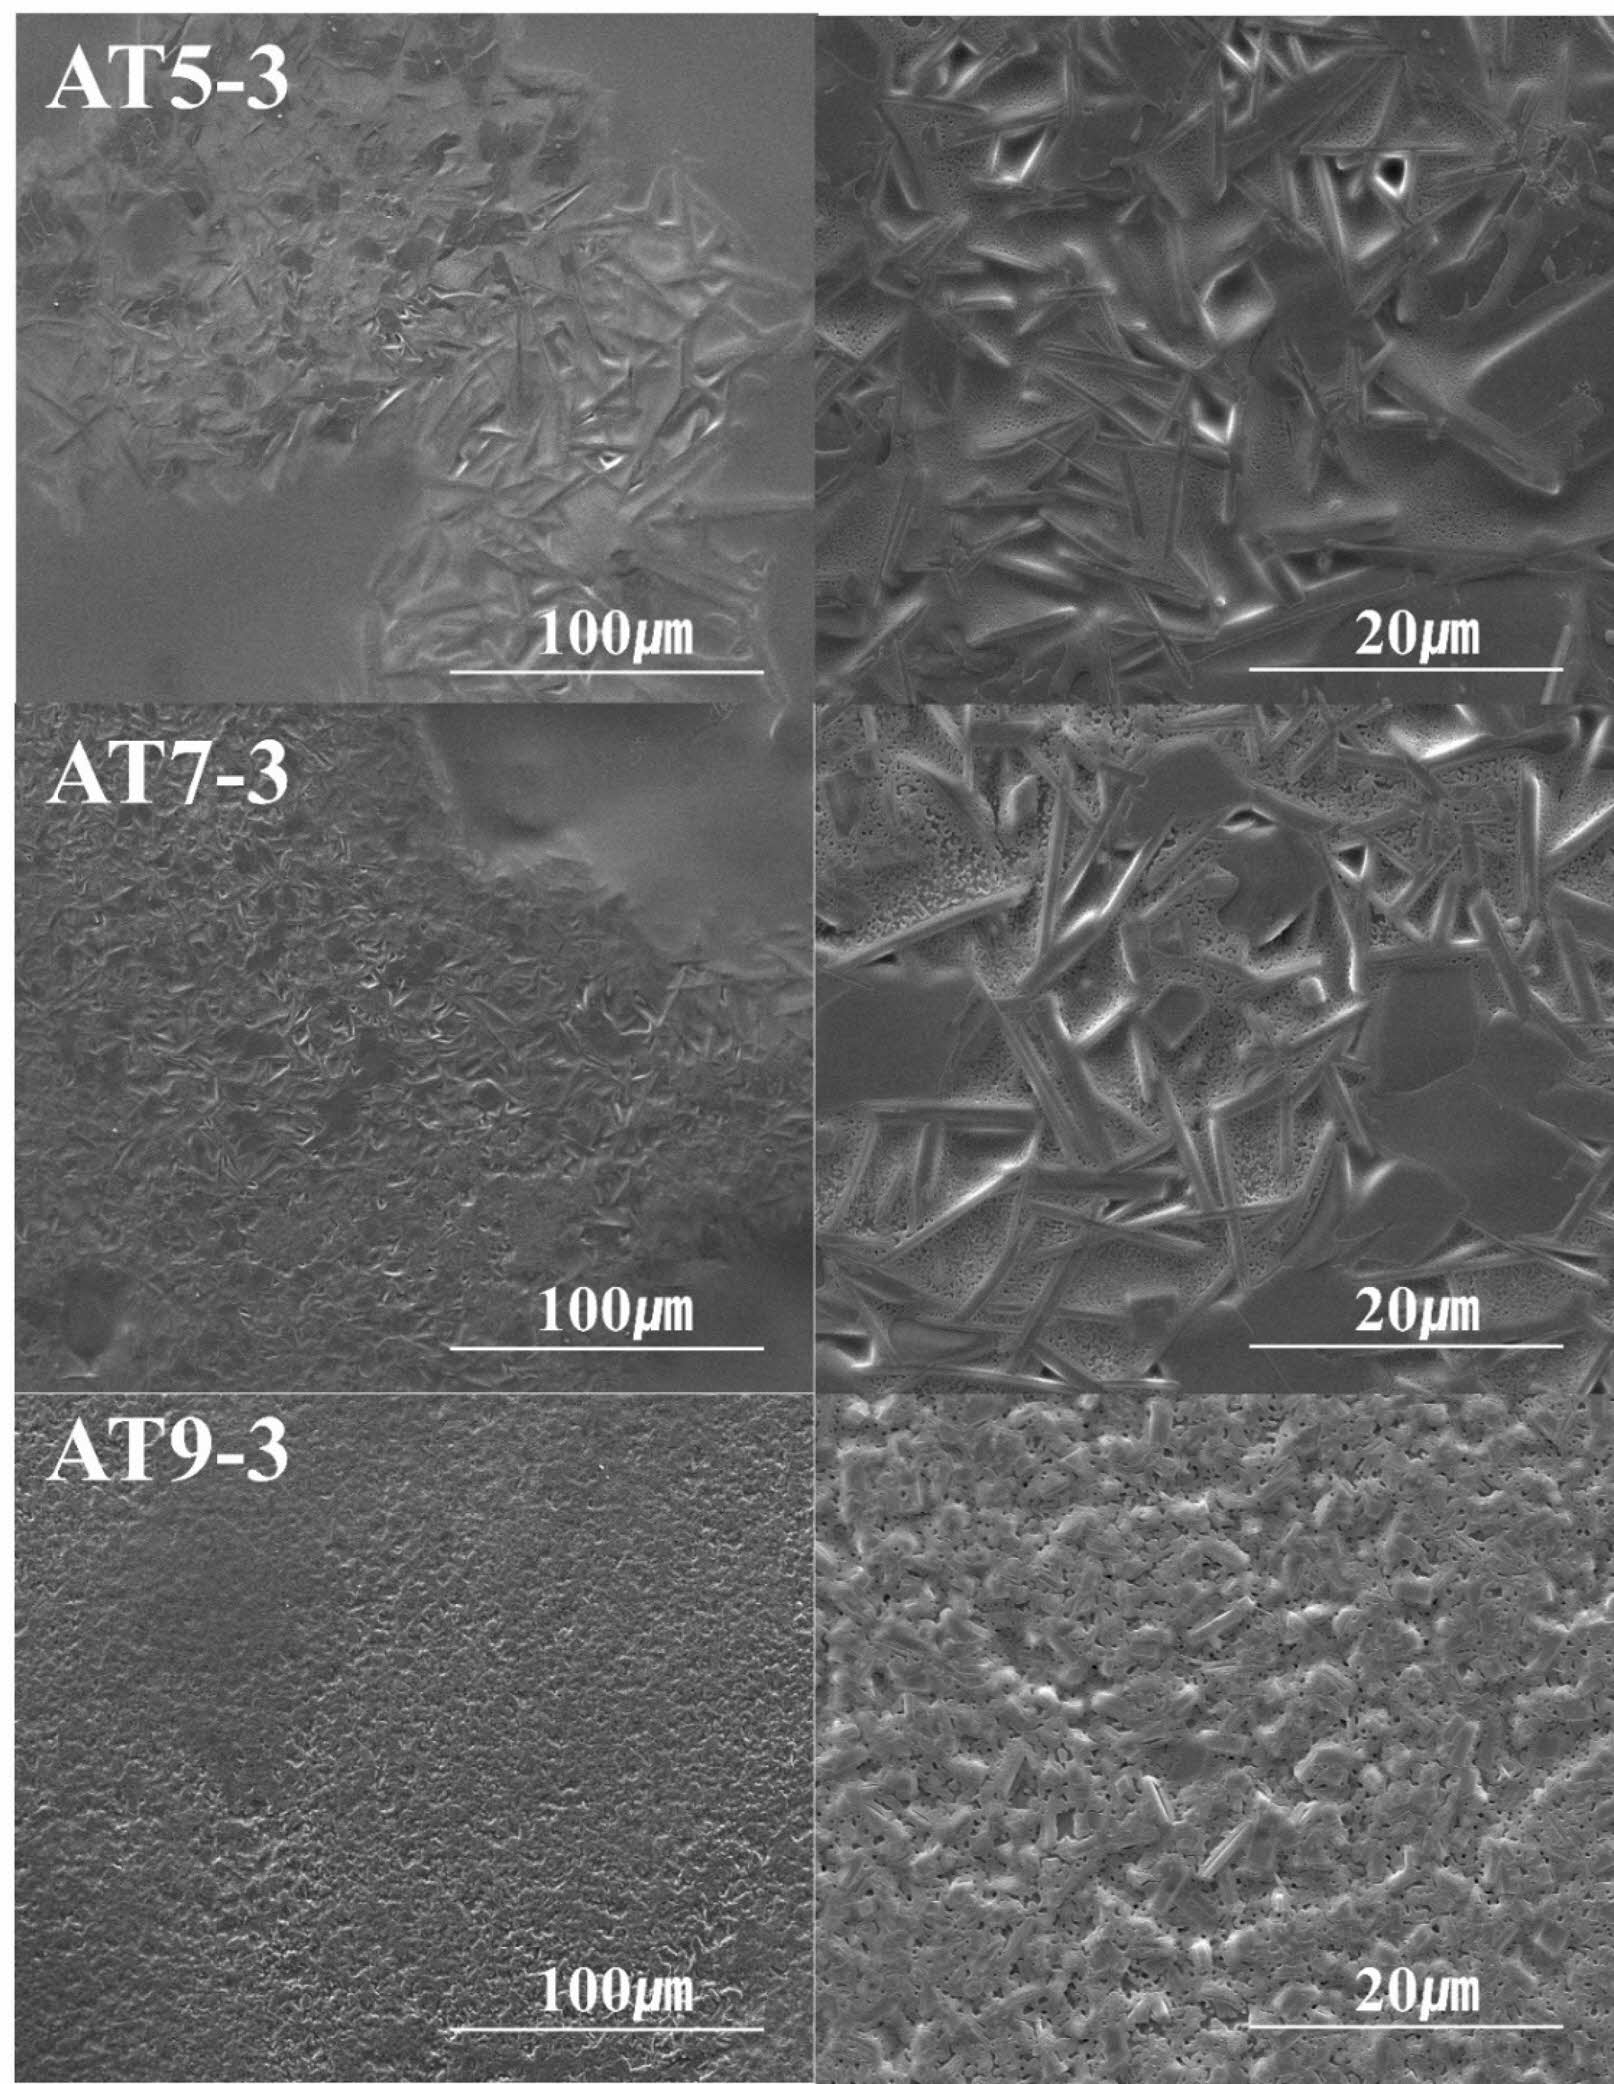
Figure 3 and 4 show SEM images of the microstructure of the glaze sintered at 1230 °C with different quantities and types of additives. In Figure 3, the microstructural results for the Zr5 and ZT specimen groups (ZT5-3, ZT7-3, and ZT9-3) indicate that in all specimens, the crystalline phases within the glass matrix were partially aggregated. In the Zr5 specimen, in addition to plate-like crystalline phases with a size of 1 μm, bed-like crystalline phases with a size of 5 μm were observed, and it was confirmed that these needle-like and plate-like crystalline phases were separated from each other. In the case of the ZT specimen group, although the XRD analysis in Fig. 1 did not show any crystalline peaks, microscopic structural analysis using SEM confirmed the presence of minute crystalline phases. These crystalline phases were distributed over the entire glaze volume, indicating that they were the result of crystalline phases appearing below the XRD detection threshold [24]. High-resolution XRD typically detects crystalline phases at approximately 2 wt%, and analyzing crystalline phases below 2 wt% using XRD is challenging [25]. Fig. 4 shows the microstructural results for the AT specimen groups (AT5-3, AT7-3, and AT9-3). In all the specimens, needle-shaped crystalline phases with sizes ranging from 5 μm to 20 μm were evenly distributed. In the case of AT5-3, despite the amorphous nature of the XRD peaks, minute aggregated crystalline phases were observed in the microstructure. Notably, as the amount of Al2O3 added increased, the size of the observed crystalline phases decreased from 20 μm to a few μm, while their quantity significantly increased. C. Siligardi et al. reported that increasing Al2O3 results in the formation of a significant amount of anorthite and a densification of the microstructure in the glaze. This is believed to be the result of a change in viscosity due to the increased Al2O3 content at the same composition, which promotes crystallization behavior of the glaze [26]. This is attributed to the role of TiO2 as a nucleating agent, which limits the growth space of the nuclei during the crystallization process, leading to a gradual reduction in the crystalline particle size and a significant increase in their quantity, ultimately resulting in a dense distribution [27].
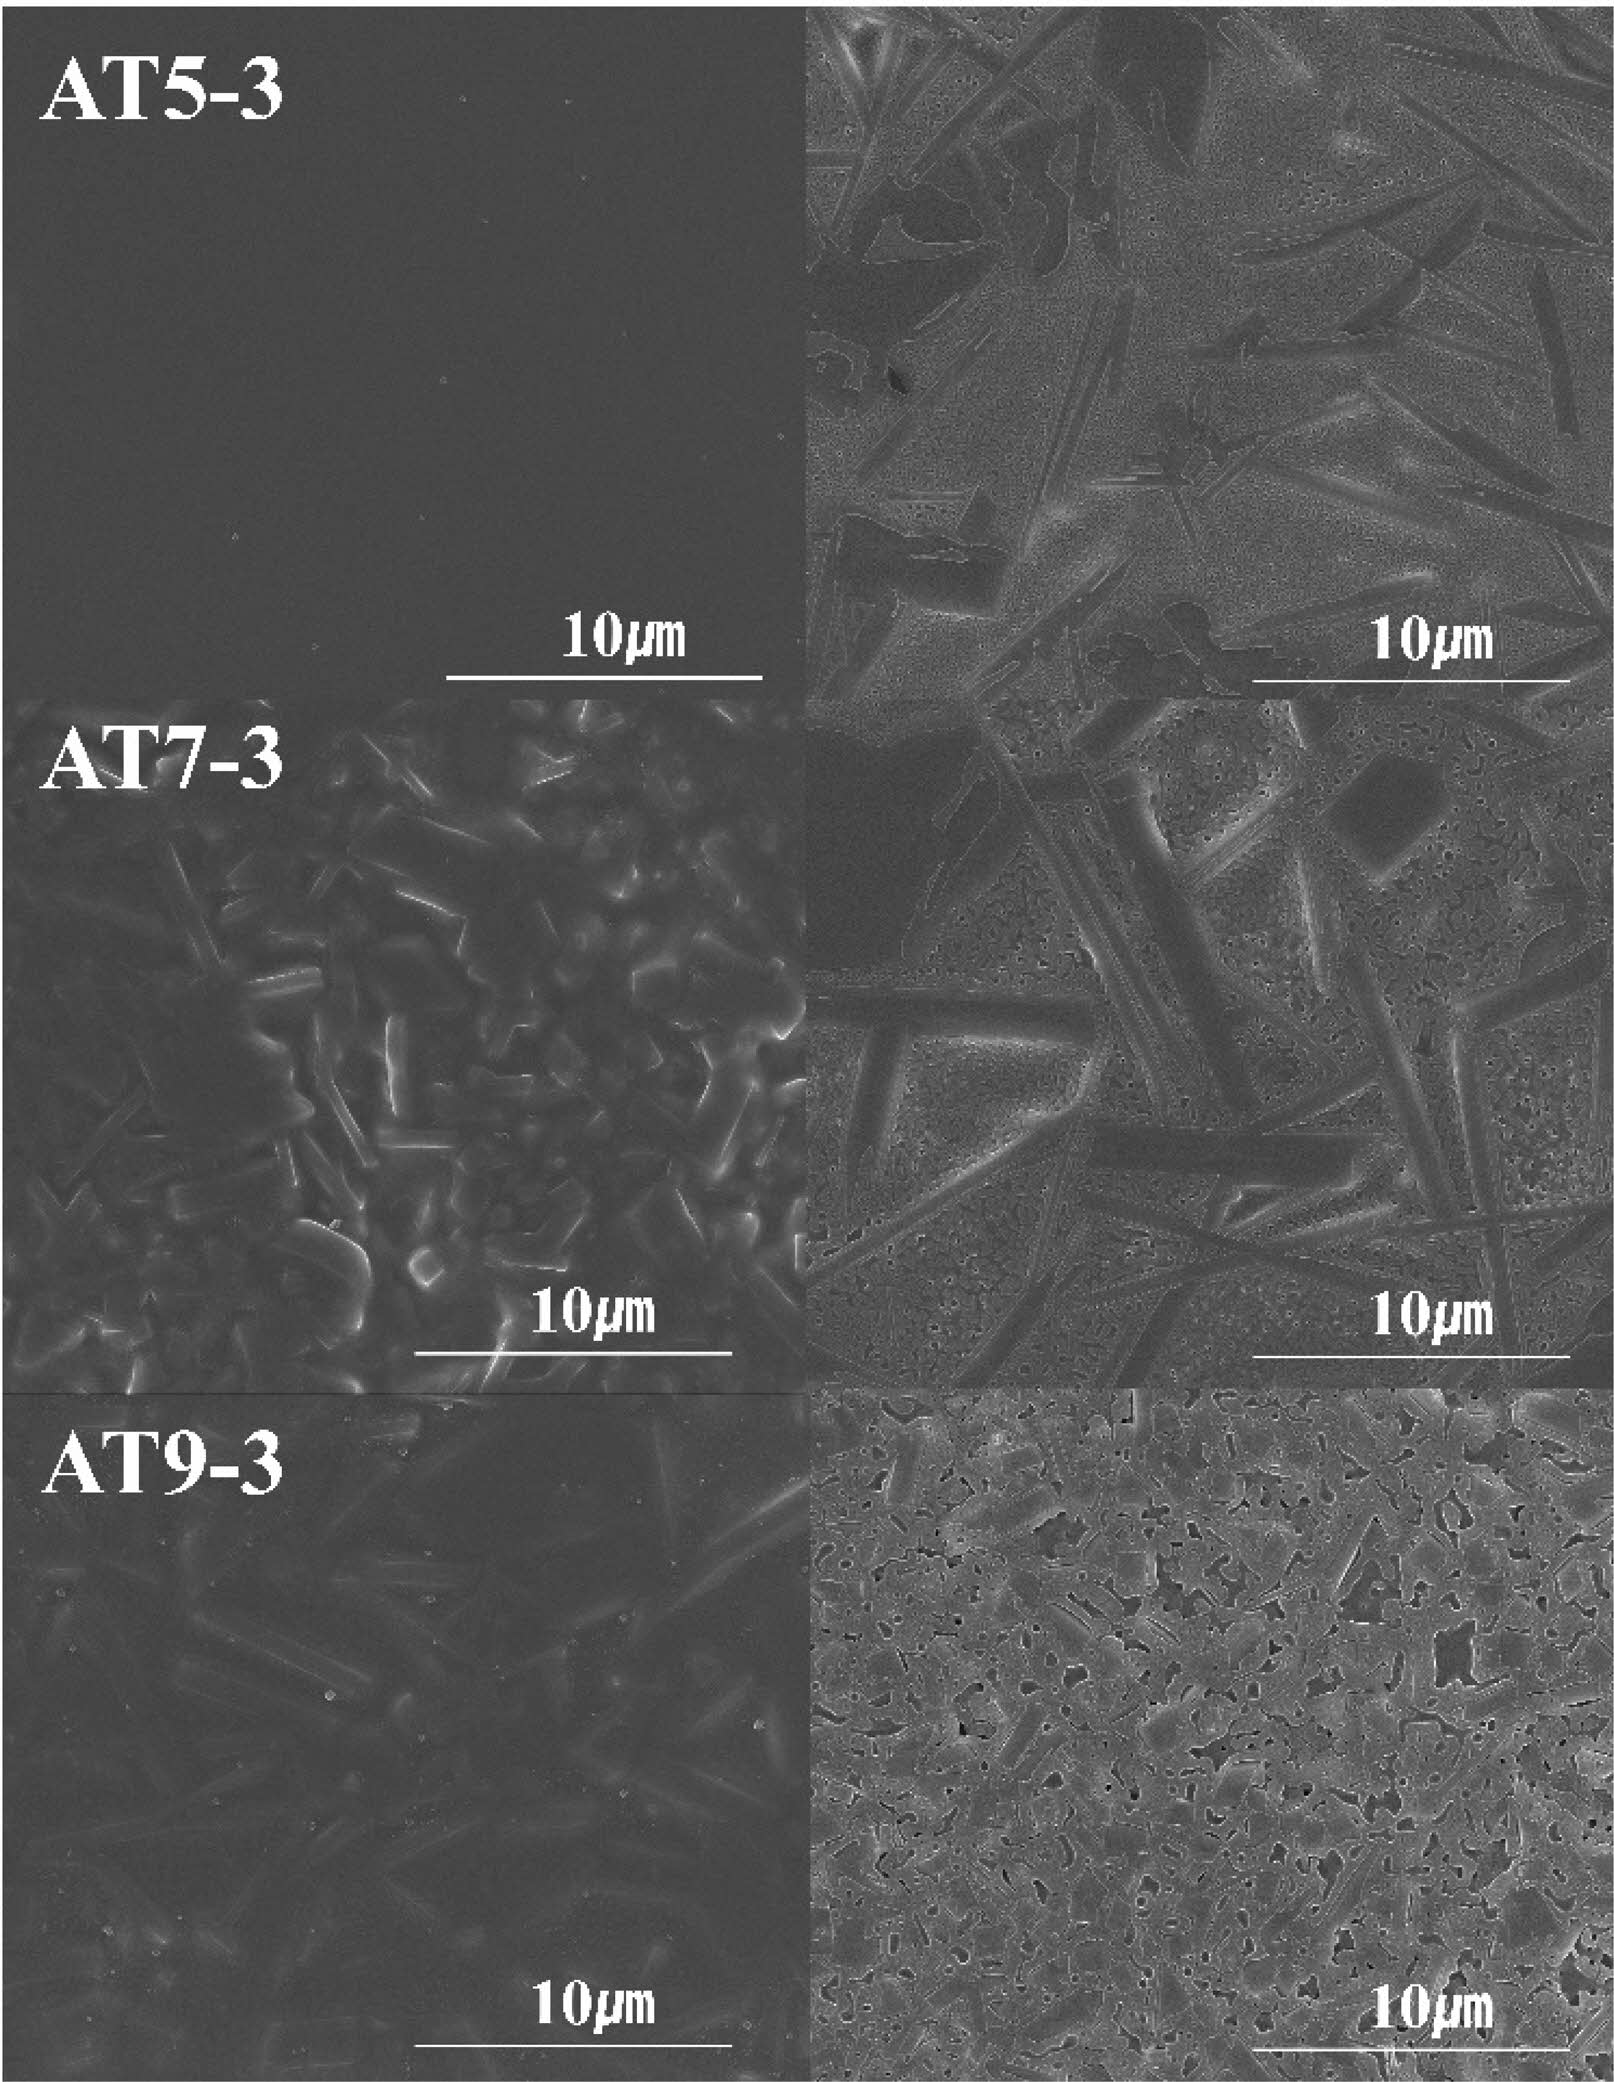
Figure 5 shows SEM images of the microstructure of the AT specimen group (AT5-3, AT7-3, and AT9-3) shown in Figure 4 before and after etching. Before etching, specimen AT5-3 exhibited a typical amorphous microstructure with no visible crystalline phases, whereas specimens AT7-3 and AT9-3 exhibited rod-shaped crystalline phases. In contrast, as shown on the right (specimens after 3 s of etching), crystalline phases were observed in all the specimens. In particular, in the AT5-3 and AT7-3 specimens, a continuous network of separated phases characteristic of spinodal phase separation was observed throughout the microstructure [28]. Al2O3 typically influences the viscosity and phase separation mechanism of glass, and as its content increases, it can alter the nucleation and growth during spinodal decomposition. In this glaze, it was inferred that as the Al2O3 content increased, the extent of spinodal phase separation in the microstructure decreased [29, 30]. In particular, for the AT5-3 specimen with the lowest Al2O3 content, the spinodal phase separation dominated, and a small amount of the crystalline phase was partially formed within the glaze volume, indicating an amorphous peak [25].
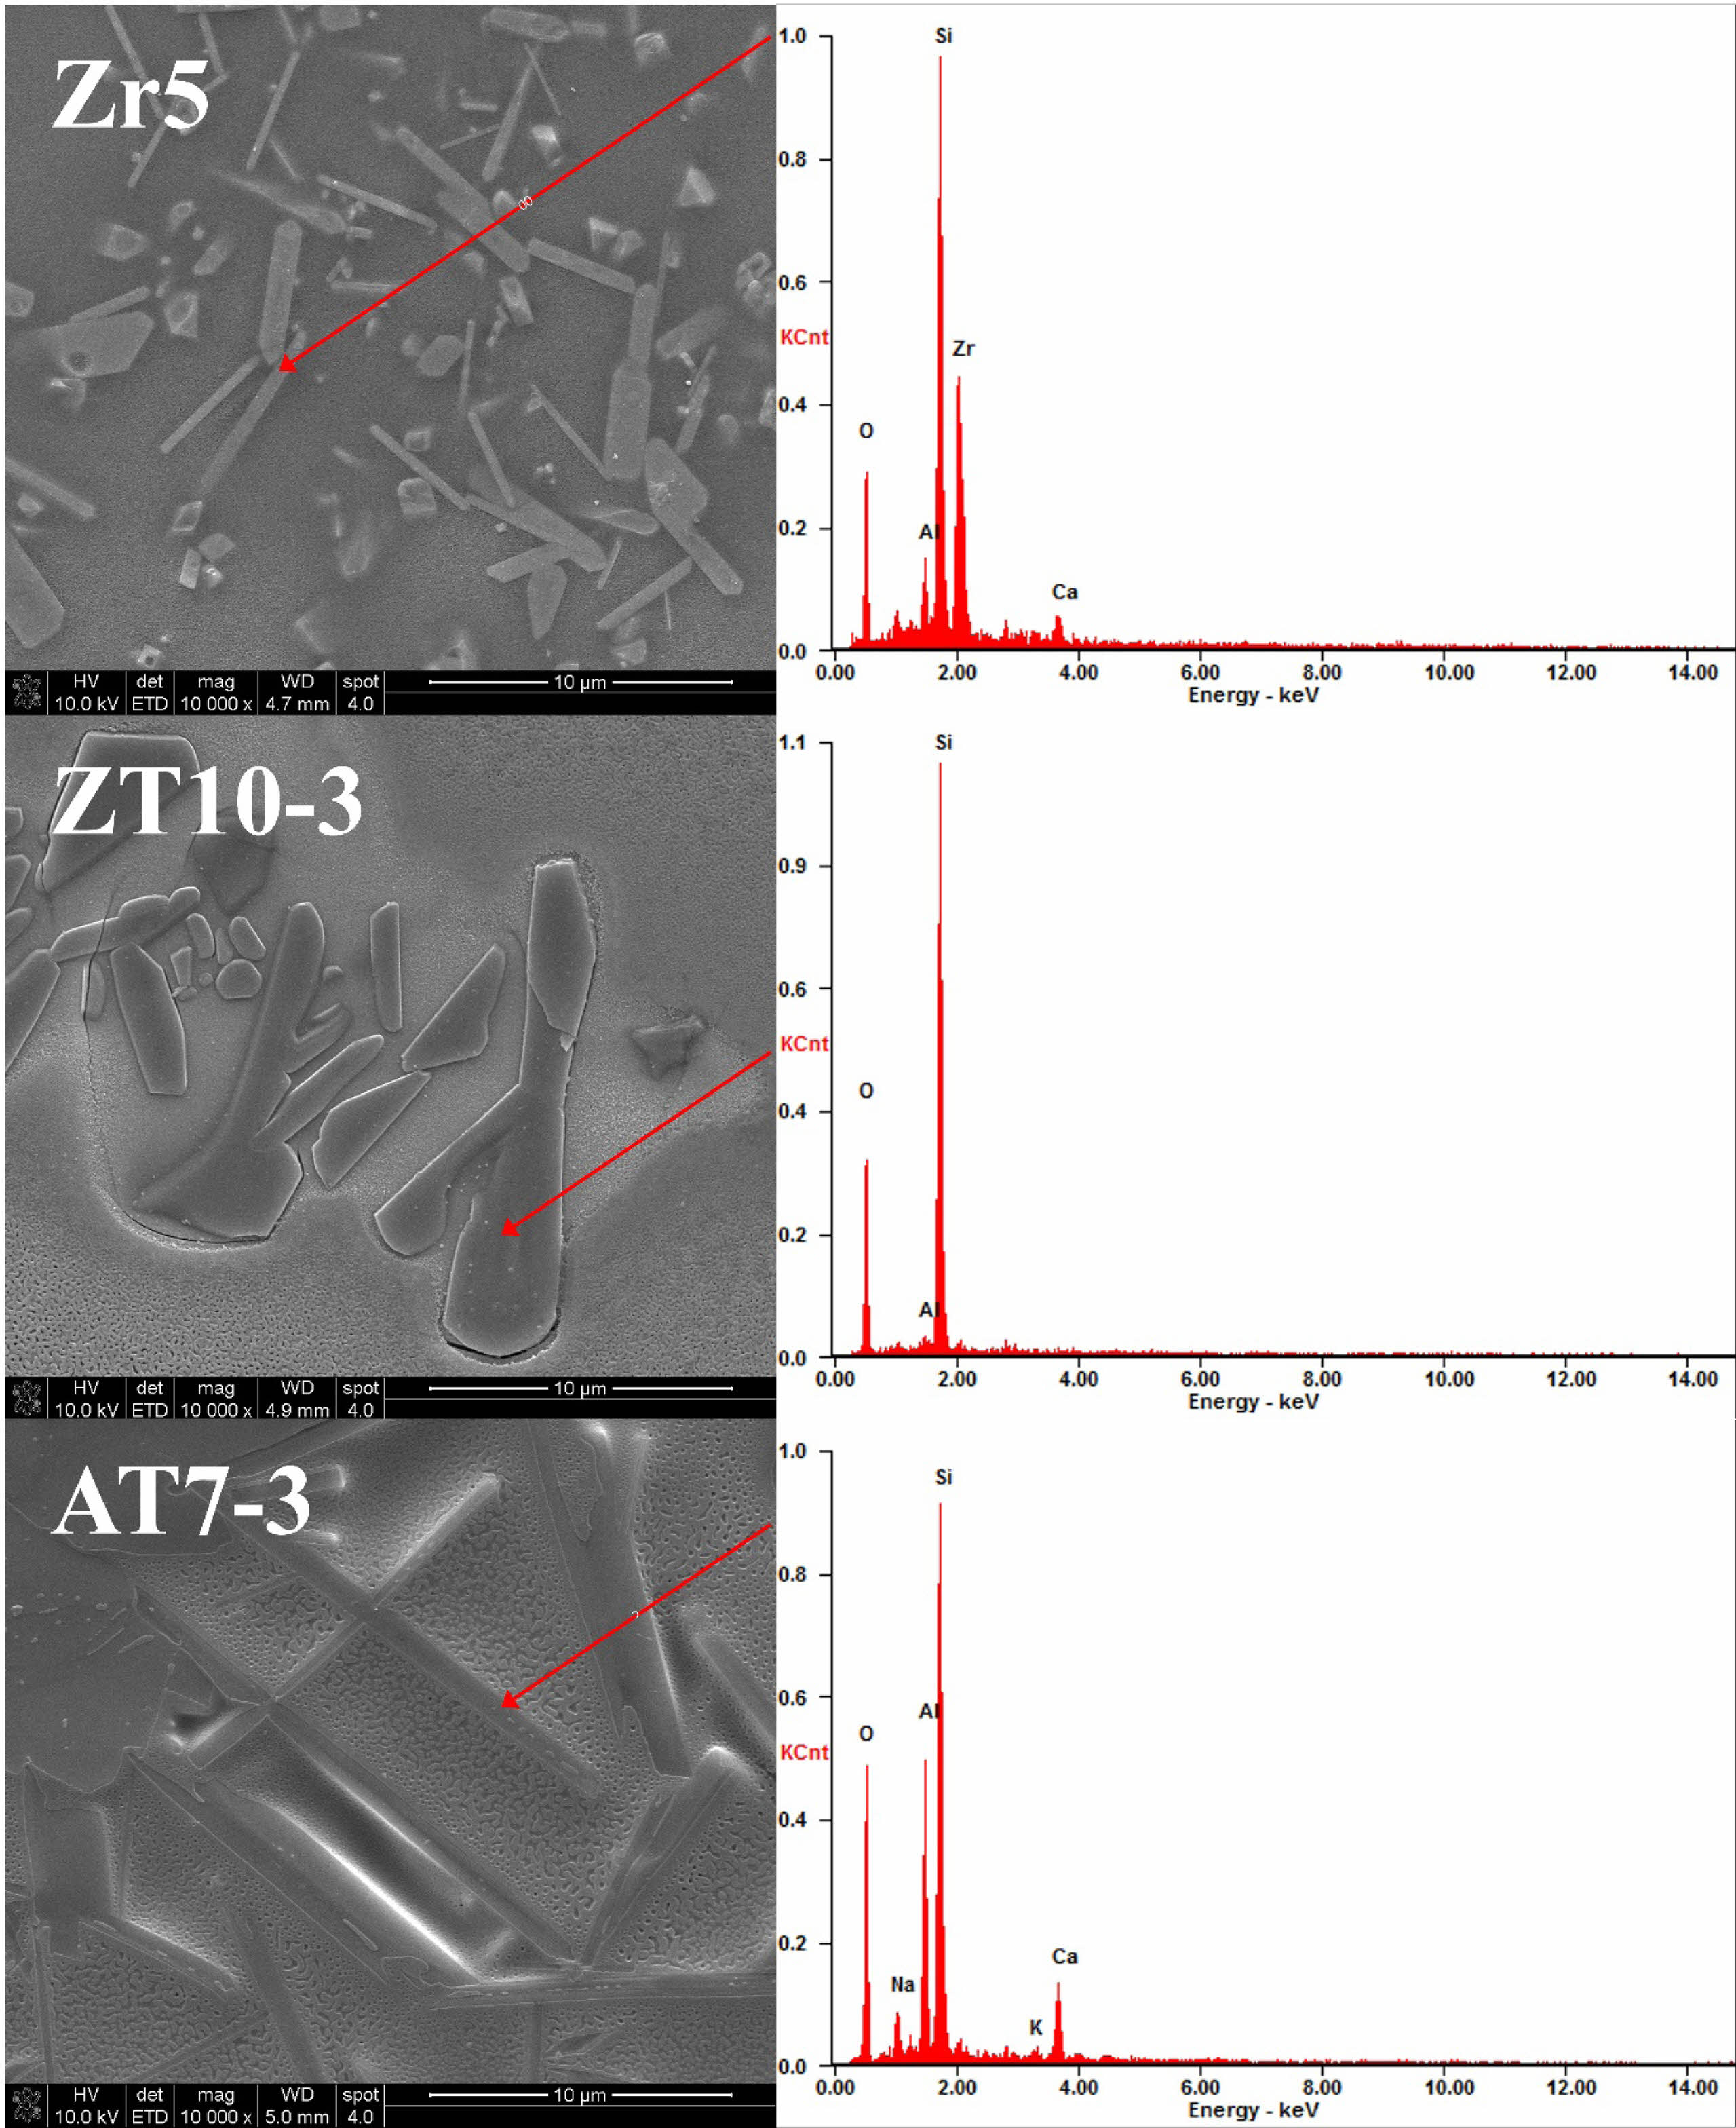
Figure 6 shows the results of the EDS analysis of the different crystalline phases observed in the Zr5, ZT10-3, and AT7-3 specimens, which were identified through microstructural analysis. The bed-like crystalline phase observed in the Zr5 specimen was confirmed to be composed of zircon particles consisting of Zr (14 at%) and Si (32 at%). In contrast, the plate-like crystalline phase observed in the ZT10-3 specimen was primarily composed of Si (49 at%). Typically, TiO2 added to glass compositions based on silica has been reported to slow crystallization and enhance the structure of silica. In the case of the ZT specimen group in this study, which had TiO2 added, a small amount of Si-based crystalline phase was detected [31]. The needle-shaped crystalline phase observed in the AT7-3 specimen was identified as anorthite–sodian, and it was composed of Ca, Al, Si, and Na, which is consistent with the results of the crystalline phase analysis using XRD in Fig. 2. Generally, anorthite(Ca-feldspar) has a tetragonal or lamellar crystal structure, whereas calcium feldspar with a high Na+ ion content exhibits elongated ribbon-shaped crystalline phases. In this study, the observed crystalline phases were believed to have relatively long rectangular shapes, indicating that some Ca+ ions were replaced with Na+ ions [21, 32].
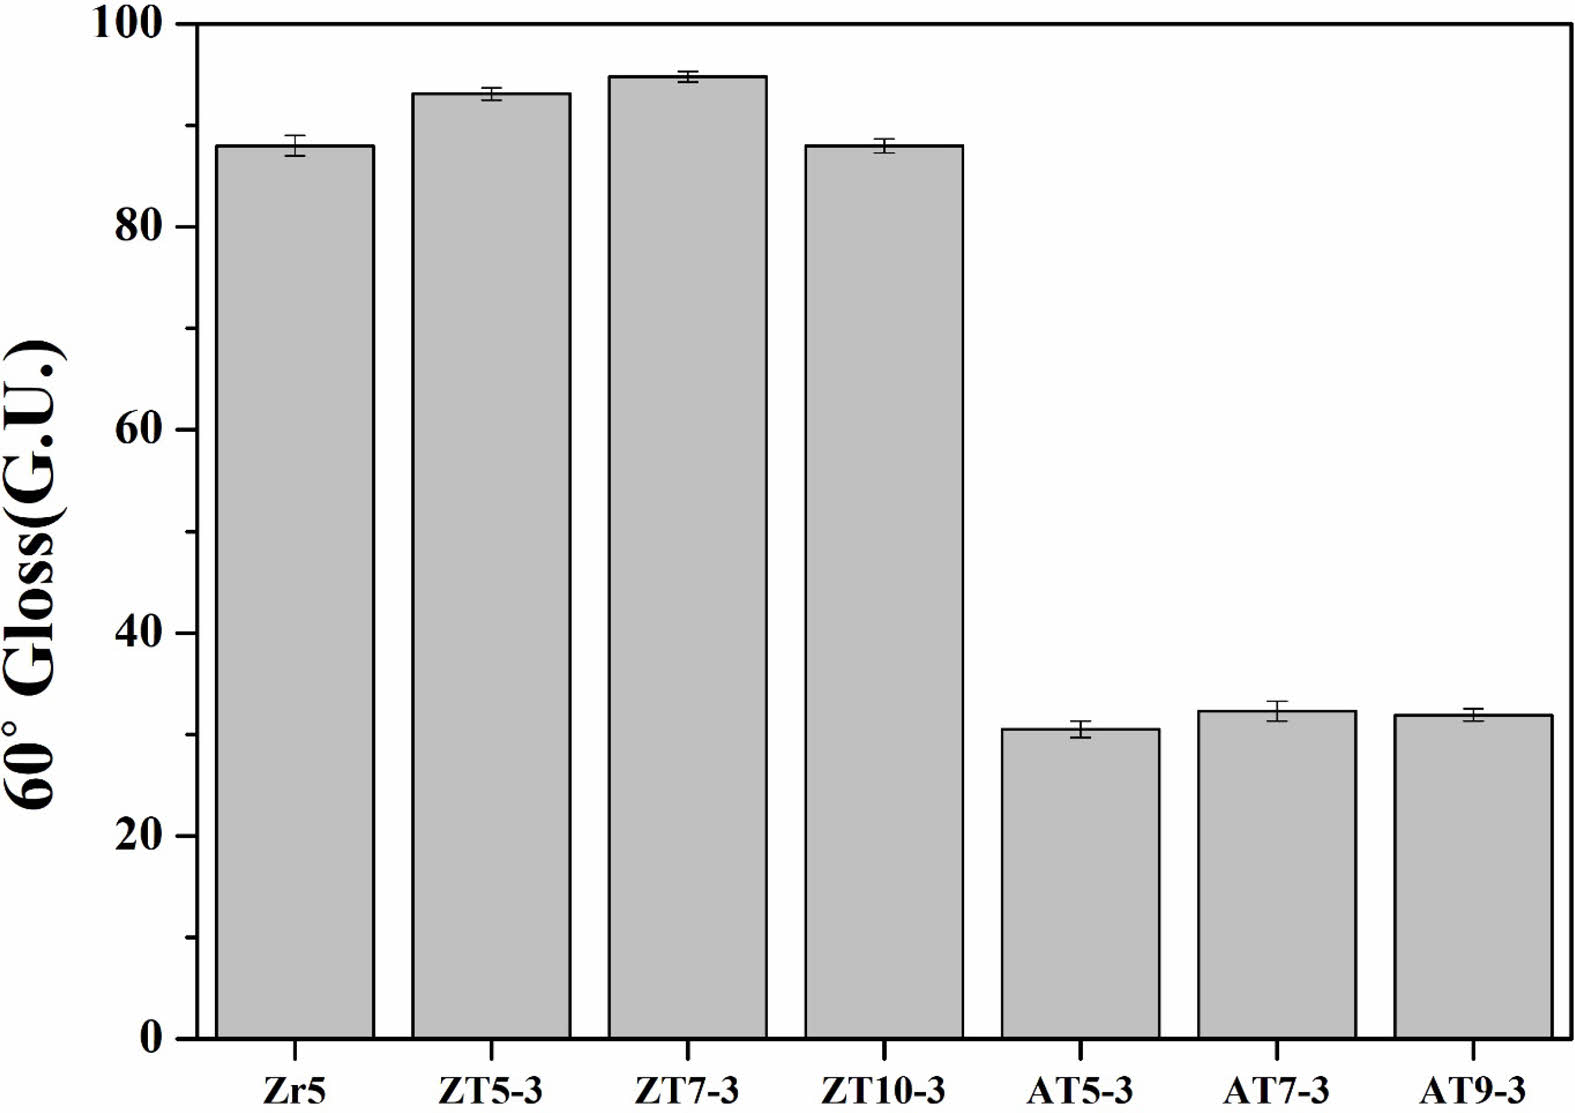
Figure 7 shows the results of analyzing the gloss of the glaze sintered at 1230 ℃ with different quantities and types of additives in accordance with ASTM C584-81. If the 60° measured value was ≥ 70 GU, the glaze was classified as high gloss, and if it was ≤ 10 GU, the glaze was classified as matte [33]. The Zr5 and ZT specimens (ZT5-3, ZT7-3, and ZT10-3) exhibited high gloss of ≥ 80 GU, which was attributed to the increase in the ZnO content, reduced surface tension, minimized defects, and formation of a smooth surface [22, 34]. In contrast, the AT specimens (AT5-3, AT7-3, and AT9-3) exhibited a matte finish of approximately 30 GU. Generally, it is known that needle-like crystal shapes increase surface roughness compared to plate-like crystal shapes, and as surface roughness increases, it scatters light, reducing glossiness. This is believed to be the result of enhanced surface roughness due to the presence of needle-like anorthite crystal shapes, as depicted in Fig. 4, causing a decrease in gloss and resulting in a difference in glossiness compared to the ZT specimen group [35]. Also, the presence of amorphous crystalline phases, which form in crystallized glass or glazes, tends to increase the viscosity of the residual glass, making the glass surface rougher and inducing light scattering, which reduces the gloss of the glaze surface [4, 23, 36]. It was concluded that the presence of anorthite containing Al2O3 reduced the gloss of the glaze surface.
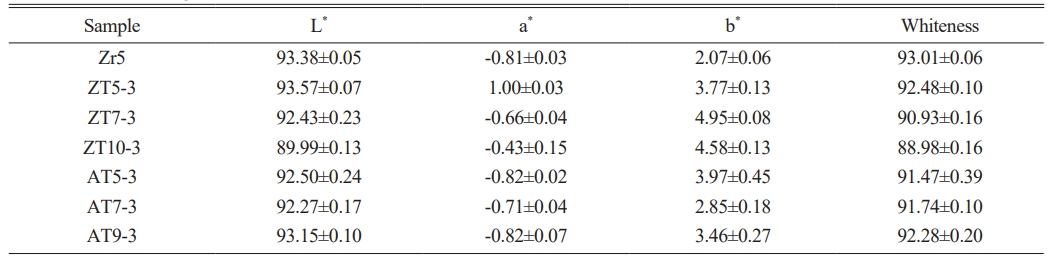
Table 3 presents the results for the whiteness of the glaze sintered at 1230 °C with different quantities and types of additives obtained using the CIE Lab parameters and the KS L 5113 standard. In general, the lightness value (L*) indicates a proportional relationship with whiteness, while the yellowness index (b*) indicates an inversely proportional relationship with whiteness [33, 37]. Generally, the addition of TiO2 results in the formation of opaque glazes that are ivory or cream-colored rather than white. But all the specimens exhibited whiteness values similar to those of the Zr5 specimen, where zircon crystalline phases were observed. This is believed to have resulted from the effect of ZnO, which increases the reflectance of visible light, reducing the absorption of blue light and yellowing, leading to high whiteness values. Additionally, it is attributed to the increased light scattering caused by the high refractive index anorthite formed by the addition of Al2O3 [12, 38]. All the specimens exhibited whiteness values similar to those of the Zr5 specimen (93), where zircon crystalline phases were observed. For the ZT specimen group, L* decreased from 92.48 to 88.98 as the amount of added ZnO increased. For the AT specimen group, a slight increase in L* was observed with the addition of Al2O3. In the case of glass, an increase in NBO within the structure affects the absorbance. Zinc oxide (ZnO), which acts as a flux, induces the formation of NBO by breaking the Si-O-Si network upon addition [17]. Therefore, it can be inferred that as the amount of added ZnO increases, the absorption of light due to NBO increases, reducing the whiteness and L* of the glaze.
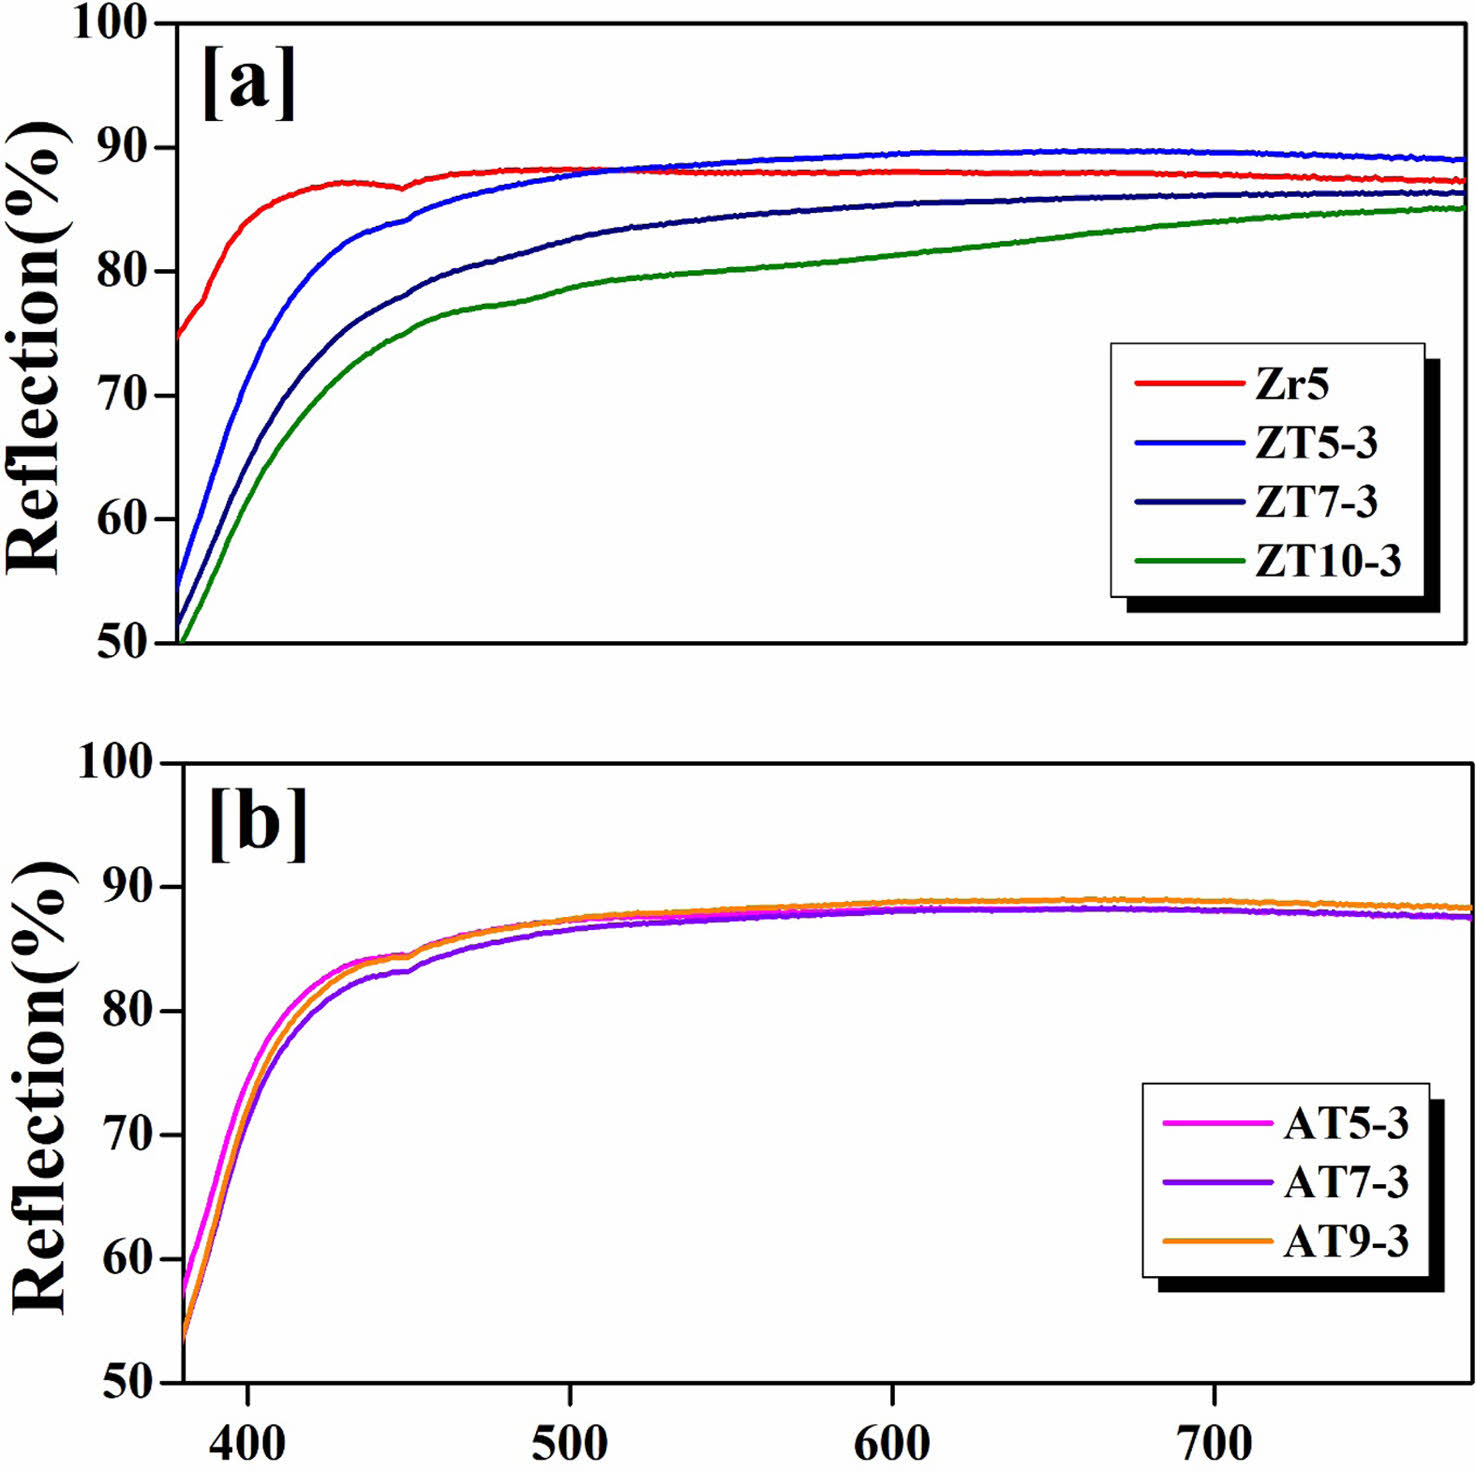
Figure 8 presents the results for the reflectance in the wavelength range of 300-800 nm for specimens sintered at 1230 °C with different quantities and types of additives. The reflectance is directly proportional to L* and exhibits changes in graph shape according to a* and b*, indicating a close correlation between the CIE Lab parameters and reflectance [39, 40]. Bondioli et al. reported that the shape of the reflectance graph changed depending on the color development of the glaze, with yellow glazes exhibiting an increase in the yellow wavelength range (565-600 nm) and blue glazes exhibiting an increase in the blue wavelength range (400-500 nm) [40]. Accordingly, upon observing the graph shapes, it was confirmed that all specimens exhibited a decrease in reflectance in the 400-500 nm wavelength range and an increase in reflectance in the 500-700 nm wavelength range. This is believed to be influenced by the yellow index (b*) of the glazed surface, as indicated by Table 3 [37, 40, 41]. In contrast, the Zr5 specimen exhibited a relatively high reflectance in the 400-500 nm wavelength range compared with the ZT and AT specimens, exhibiting linear reflectance in all wavelength ranges. This is attributed to the added ZrO2 component having a tetragonal crystal structure within the glass, which strengthened the glass network structure by forming Zr-O-Si bridges, increasing the viscosity, reducing the amount of NBO, and resulting in reduced optical absorption [42]. In addition, the Zr5 specimen reflected all wavelengths of light, resulting in the highest whiteness. Compared with the ZT5-3 specimen, which had the highest L* in the 400-500 nm wavelength range, the Zr5 specimen exhibited higher reflectance [41, 43]. Furthermore, for the AT specimen group, no significant differences were observed in the CIE Lab parameters; therefore, the changes in reflectance were not pronounced.
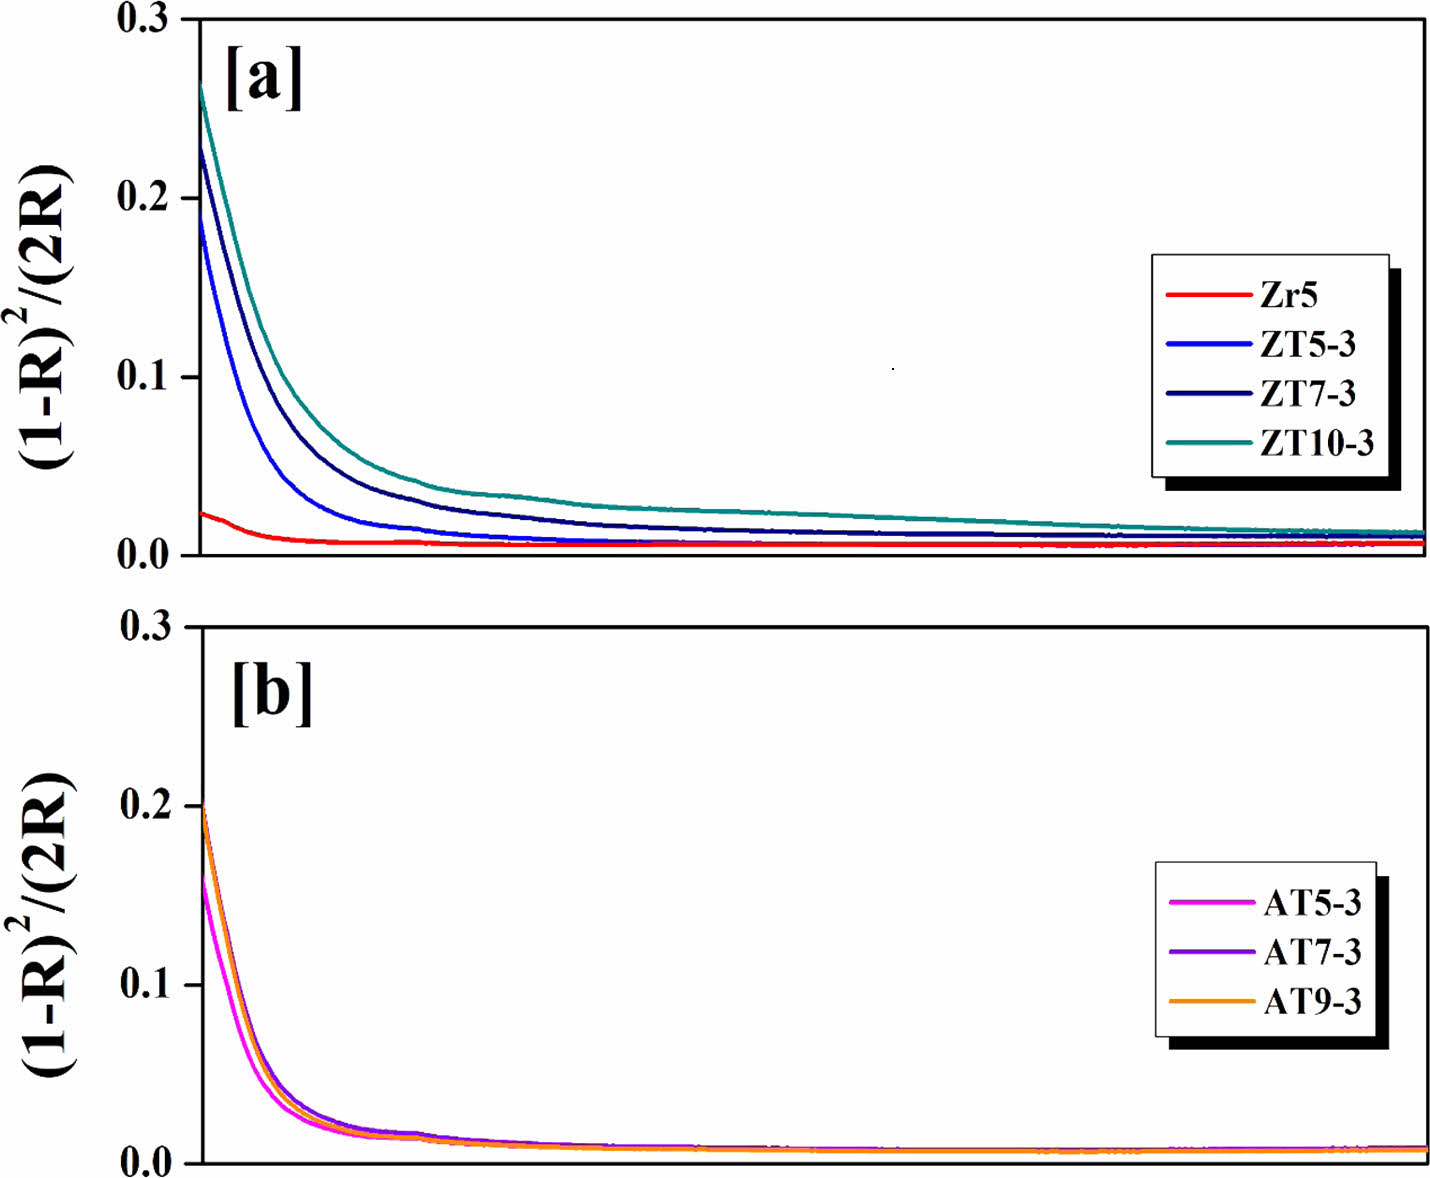
Figure 9 shows the K/S values derived using the Kubelka-Munk model according to the results shown in Fig. 8. The vertical axis represents the (1–R)2/(2R) value denoted as K/S, which is derived from a model that relates the characteristics of the light absorption coefficient (K) and scattering coefficient (S) to reflectance. This model has been applied to predict color changes [44]. With increasing amounts of ZnO and Al2O3 additives, there was a tendency for absorption in the violet–indigo wavelength range (380-420 nm) to increase. This is attributed to increases in the a* and b* values, as shown in Table 3 [45]. Typically, the introduction of ZnO causes the collapse of the [SiO4] structure, shifting the absorption band to longer wavelengths. In this study, as the amount of added ZnO increased, the absorption band shifted from 407 to 420 nm [17]. However, for the AT specimens, there was no significant shift in the absorption band with the increasing Al2O3 content. This is because in contrast to the ZT specimen group, there were no significant differences in the CIE Lab parameters, indicating that the absorption wavelength band did not change.
|
Fig. 1 XRD patterns of glaze with different additives; ZrO2, ZnO and TiO2. |
|
Fig. 2 XRD patterns of glaze with different additives; Al2O3 and TiO2. |
|
Fig. 3 SEM image of the glaze surface with different additives; ZrO2, ZnO and TiO2. |
|
Fig. 4 SEM image of the glaze surface with different additives; Al2O3 and TiO2. |
|
Fig. 5 SEM image of the glaze surface with different additives etched by different time (left : 0s, right : 3s). |
|
Fig. 6 SEM image and EDS spectra of glaze surfaces with different additives. |
|
Fig. 7 Gloss of the glaze surfaces with different additives. |
|
Fig. 8 Reflection of the glaze surfaces with different additives; (a) ZrO2, ZnO and TiO2; (b) Al2O3 and TiO2. |
|
Fig. 9 Absorption edge of the glaze surfaces with different additives; (a) ZrO2, ZnO and TiO2; (b) Al2O3 and TiO2. |
In this study, an opaque glaze was produced in a CaO-Al2O3-SiO2-ZnO system by adding 3 wt% TiO2, and ZnO and Al2O3 were added to inhibit yellowing. In XRD and SEM analyses, specimens with ZnO and TiO2 additives exhibited small amounts of SiO2-related crystalline phases, whereas specimens with Al2O3 and TiO2 additives exhibited anorthite–sodian (Al1.488Ca0.491Na0.499Si2.506O8) crystalline phases. Moreover, increasing the amount of the Al2O3 additive reduced the size of the crystalline phases and increased the number of crystalline phases. Specimens with ZnO and TiO2 additives exhibited gloss values of ≥ 80 GU, which are similar to those of commercial glazes, whereas specimens with Al2O3 and TiO2 additives exhibited a matte appearance with 30 GU because of the needle-like anorthite–sodian crystalline phases. All the specimens exhibited slight yellowing compared to the reflectance in the 400-500 nm wavelength range; however, they exhibited whiteness values of 88.98-92.48, which are similar to those of conventional commercial white glazes, when compared to the reflectance in the 500-700 nm wavelength range. By adding 3 wt% TiO2, ZnO, and Al2O3 to the CaO-Al2O3-SiO2-ZnO glaze, an opaque glaze with a white color was produced that can potentially replace zircon glazes.
The authors declare that they have no known competing financial interests or personal relationships that could have appeared to influence the work reported in this paper.
This work was supported from Ceramic Strategy Technology Development Project (KPP22004-0-02) by Korea Institute of Ceramic Engineering and Technology (KICET).
- 1. K. Boudeghdegh, V. Diella, A. Bernasconi, A. Roula, Y. Amirouche, J. Eur. Ceram. Soc. 35[13] (2015) 3735-3741.
-

- 2. Z. Mahmoudi, H. R. Rezaie, H. Ghassai, J. Ceram. Process. Res. 12[6] (2011) 708-711.
-
- 3. F. Gol, Z.G. Saritas, S. Cıbuk, S. Cibuk, C. Ture, E. Kacar, A. Yilmaz, M. Arslan, F. Sen, Ceram. Int. 48[2] (2022) 2241-2249.
-
- 4. M. Gajek, J. Partyka, A. Rapacz-Kmita, K. Gasek, Ceram. Int. 43[2] (2017) 1703-1709.
-
- 5. Y. Rho, S. Kang, J. Kim, K. Kim, J. Nanosci. Nanotechnol. 20[1] (2020) 557-563.
-
- 6. S. Wang, C. Peng, Z. Huang, J. Zhou, M. Lu, J. Wu, J. Eur. Ceram. Soc. 34[2] (2014) 541-547.
-
- 7. F. Karimi, S. Baghshahi, M. Nouri Khezrabad, N. Riahi-Noori, J. Ceram. Process. Res. 20[4] (2019) 357-362.
-
- 8. S.Y. Reyes-Lopez, J. Serrato-Rodriguez, J. Ceram. Process. Res. 16[1] (2015) 162-168.
-
- 9. R. Li, M. Lv, J. Cai, K. Guan, F. He, W. Li, C. Peng, P. Rao, J. Wu, J. Eur. Ceram. Soc. 38[16] (2018) 5632-5636.
-
- 10. M. Gajek, J. Paryka, M. Lesniak, A. Rapacz-Kmita, L. Wojcik, Ceram. Int. 44[13] (2018) 15845-15850.
-
- 11. G. Topates, B. Tarhan, M. Tarhan, Ceram. Int. 43[15] (2017) 12333-12337.
-
- 12. M. Tarhan, J. Therm. Anal. Calorim. 138[1] (2019) 929-936.
-
- 13. Muzakky, H. Poernomo, A. Taftazani, K. Rozana, J. Indian Chem. Soc. 99[3] (2022) 100371.
-
- 14. M. Abo-Elmagd, J. Radiat. Res. Appl. Sci. 7[4] (2014) 390-398.
-
- 15. S. Sun, H. Ding, W. Ao, Y. Liu, L. Chang, J. Zhang, J. Eur. Ceram. Soc. 40[15] (2020) 6171-6180.
-
- 16. K. Pekkan, Ceram. Int. 41[6] (2015) 7881-7889.
-
- 17. S. Aisyah, K. Amin, S. Hj, M. Hafiz, M. Mustafa, A. Zakah, R. Emilia, M. Zulhasif, N. Effendy, J. Mater. Res. Technol. 9[5] (2020) 11013-11021.
-
- 18. J. Reinosa, F. Rubio-Marcos, E. Solera, A. Bengochea, F. Fernandez, Ceram. Int. 36[6] (2010) 1845-1850.
-
- 19. K. Pasiut, J. Partyka, M. Lesniak, P. Jelen, Z. Olejniczak, Open Ceram. 8 (2021) 100188.
-
- 20. F. Camara, J.C. Doukhan, E.K.H. Salje, Phase Transitions. 71[3] (2000) 227-242.
-
- 21. X. Cheng, S. Ke, Q. Wang, H. Wang, A. Shui, P. Liu, Ceram. Int. 38[6] (2012) 4901-4908.
-
- 22. R.A. Eppler, M. Obstler, “Understanding Glazes” (Wiley-American ceramic society, 2005) p. 15-28.
- 23. S. Wang, X. Li, C. Wang, M. Bai, X. Zhou, X. Zhang, Y. Wang, J. Eur. Ceram. Soc. 42[3] (2022) 1132-1140.
-
- 24. J. Partyka, M. Sitarz, M. Lesniak, K. Gasek, P. Jelen, Spectrochim. Acta, Part A. 134[5] (2015) 621-630.
-
- 25. S. Lucas, E. Champion, D. Bregiroux, D. Bernache-Assollant, F. Audubert, J. Solid State Chem. 177[4-5] (2004) 1302-1311.
-
- 26. C. Siligardi, P. Miselli, L. Lusvarghi, M. Reginelli, Ceram. Int. 37[6] (2011) 1851-1858.
-
- 27. F. Lai, M. Leng, J. Li, Q. Liu, Crystals. 10[9] (2020) 794.
-
- 28. R. Bong-ki, “Introduction to Glass Engineering” (Pusan national university, 2017) p. 281-298.
- 29. W.F. DU, K. Kuraoka, T. Akai, T. Yazawa, J. Mater. Sci. 35 (2000) 4865-4871.
-
- 30. M. Hassan Imanieh, B. Eftekhari Yekta, V. Marghussian, S. Shakhesi, I.R. Martin, Solid State Sci. 17 (2013) 76-82.
-
- 31. L. Nguyen, A. Maitre, M. Lejeune, C. Dossou-Yovo, R. Noguera, R. Podor, Ceram. Int. 39[6] (2013) 6087-6098.
-
- 32. K. Pasiut, J. Partyka, M. M. Bucko, M. Grandys, L. Kurpaska, W. Piekarczyk, J. Alloys Compd. 815[30] (2020) 152411.
-
- 33. R.A. Platova, Yu. T. Platov, Glass Ceram. 74[3-4] (2017) 91-94.
-
- 34. B. Yekta, P. Alizadeh, L. Rezazadeh, J. Eur. Ceram. Soc. 26[16] (2006) 3809-3812.
-
- 35. M. Sheikhattar, H. Attar, S. Sharafi, W. M. Carty, Mater. Charact. 118 (2016) 570-574.
-
- 36. Z. Bayer Ozturk, B. Yildiz, A. Kara, J. Therm. Anal. Calorim. 142 (2020) 1215-1221.
-
- 37. J. Cai, M. Lu, K. Guan, W. Li, F. He, P. Chen, C. Pang, P. Rao, J. Wu, J. Am. Ceram. Soc. 101[4] (2018) 1754-1764.
-
- 38. L. Jinzhen, C. Geling, H. Shaowen, L. Pinghua, Cem. Concr. Res. 143 (2021) 106372.
-
- 39. M. Kaliraja, R. Ranjeeth, R. Vinothan, S. Manisha, N. R. Srinivasan, Ceram. Int. 42[16] (2016) 18724-18731.
-
- 40. F. Bondioli, T. Manfredini, M. Romagnoli, J. Eur. Ceram. Soc. 26[3] (2006) 311-316.
-
- 41. S. Teixeira, A. M. Bernardin, Dyes Pigm. 80[3] (2009) 292-296.
-
- 42. H.A. Abo-Mosallam, D. Kim, H. Kim, H. Lee, Ceram. Int. 42[4] (2016) 5107-5112.
-
- 43. D. Guo, Q. Yang, P. Chen, Y. Chu, Y. Zhang, P. Rao, Dyes Pigm. 153 (2018) 74-83.
-
- 44. L.M. Schabbach, F. Bondioli, M.C. Fredel, Dyes Pigm. 99[3] (2013) 1029-1035.
-
- 45. L. Mantovani, M. Tribaudino, M. Dondi, C. Zanelli, Dyes Pigm. 120 (2015) 118-125.
-
 This Article
-
2023; 24(6): 1001-1009
Published on Dec 31, 2023
- 10.36410/jcpr.2023.24.6.1001
- Received on Sep 21, 2023
- Revised on Nov 12, 2023
- Accepted on Nov 13, 2023
Services
- Abstract
introduction
experimental procedure
results and discussion
conclusion
- Declaration of Interest
- Acknowledgements
- References
- Full Text PDF
Shared
Correspondence to
- Kangduk Kim a, Kyu-sung Han b
-
aDepartment of Advanced Material Engineering, Kyonggi University, Suwon 16227, Korea
bCeramic ware Center, Korea Institute of Ceramic Engineering and Technology, Icheon 17303, Korea
Tel: +82-10-6206-6290
Tel: +82-31-645-1404 - E-mail: solidwaste@kyonggi.ac.kr, kh389@kicet.re.kr
Clean-Energy Research Institute(CRI), Hanyang University, 222, Wangsimni-ro, Seongdong-gu, Seoul, 04763, Korea
E-mail: jcpr@hanyang.ac.kr