- The influence of process parameters on the optical properties of seashell-added ceramic glazes, evaluated using a factorial design
Ceren Peksen*
Department of Ceramic and Glass, Ondokuz Mayıs University, Samsun 55100, Turkey
This article is an open access article distributed under the terms of the Creative Commons Attribution Non-Commercial License (http://creativecommons.org/licenses/by-nc/4.0) which permits unrestricted non-commercial use, distribution, and reproduction in any medium, provided the original work is properly cited.
The present study aims to evaluate the impact of process factors on the optical characteristics of seashell-added glazes using a 23 factorial design. Seashells collected from the Black Sea beaches of Samsun, Turkey, were calcined for 1 hour at 700 °C. XRD and XRF analysis were used to perform chemical characterization of seashell powder. Seashell powders were added to commercial transparent glaze compositions dipped onto the surface of sintered ceramic bodies such as white and porcelain mud. The glazed ceramic bodies were sintered for 8 hours at 1000 °C and 1100 °C. The spectrophotometer determined the coloring parameters and gloss values of seashell-added glazes. The effect of utilizing the seashell powder on the color parameters of glazes was investigated using the experiment’s factorial design. The process factors were firing temperature, ceramic body, and seashell powder addition ratio. The study proved that the firing temperature significantly affects the optical properties of glazed samples in a 23 level factorial design. The substrate and additive ratio are the main factors for gloss value, whereas firing temperature is the main controlling factor for values L*, a*, and b*. By analyzing the impact of the variables and evaluating the color properties of ceramic glazes, the statistical approach of the factorial design was utilized to minimize testing efforts and optimize experimental data.
Keywords: Factorial design, Ceramic, Seashell, Optical properties, Glaze.
Ceramic glazes are thin vitreous coatings that envelop the ceramic body, used in ceramic art and industry to impart water resistance, cleanability, chemical and mechanical resistance, and aesthetic qualities to the final product. These properties often vary depending on the chemical composition of the glaze, the firing parameters, and the ceramic body to which it is applied [1-4]. Glazes consist of oxides; oxides are composed of pure substances and oxidizing elements. Silicon dioxide is the glass former of a glaze composition, while alkali and alkaline earth oxides function as fluxes, opacifiers, or dyes. Calcium oxide, an inexpensive raw material widely used in glaze compositions, acts as a flux during the firing process and reduces the viscosity of the glaze, giving the glaze hardness and durability [5-7].
Seashells are natural products used in materials science, construction, and architecture because of their structural properties [8-10]. The shells are easily accessible on the beaches. Seashells are composed of calcium carbonate, providing strength, hardness, and toughness to the shell structures sandwiched between biopolymers. Because of the calcium carbonate included in the composition of these natural products, it is utilized as a strengthening raw material in the field of ceramics. Due to the calcite phase it contains, it has found an area of use as a raw material in ceramic glaze compositions [11-13].
In order to obtain as much data as possible with a small number of tests, make the complex relationships between the outputs understandable, and optimize the processes, statistical experimental design methods have been applied in many different disciplines for many years [14, 15]. Ceramic production is a process that involves an immense number of variables, such as raw material selection, process equipment, firing temperatures, etc. These variables affect the quality and technical performance of products, some of which can be controlled and others beyond the manufacturer’s control [16, 17]. The effect of factors on product performance can be effectively defined using statistical experimental design techniques. The statistical design of experiments is a method that allows the rapid, economical, and inaccurate development of processes and products based on many characteristics. Design of experiments are predetermined tests in which variables are arranged in accordance with a specific method. A well-designed experiment achieves meaningful results at a minimal cost. A poorly designed experiment wastes valuable time and resources. Experimental design is the most economical and accurate way to perform process optimization [18-20].
Factorial experiment design results in synchronous modification of the levels of two or more factors, such as temperature, pressure, time, mixing rate, process variables, and raw material changes and quantities, while maintaining the level of other factors to determine the response effect of change at each factor’s level. As a result, the main effects of factors can be determined, and the interactions between factors can be detected [19, 21]. Factorial design is commonly used in the fields of engineering specifically to investigate the combined effects of parameters in addition to their main effects. The objective of experimental design is to discover the critical variables that affect the final product, their impact on variability, and the corresponding settings. The variables that we observe how the product affects certain aspects are called factors, and the properties we measure are called responses. Factors can be quantitative or qualitative and have a location value [19, 22, 23].
In this study, the effect of process parameters; additive ratio, ceramic body (substrate), and firing temperature on optical properties of glazed ceramics was investigated. The experiments were designed as 23 multifactor experimental designs, and the impact of the main factors and their interactions was determined as a result of the analysis.
The seashells, collected from the Black Sea Region of Turkey, were washed and heat-treated at 700 °C for 1 hour to remove organic components. After heat treatment, the seashells were crushed and ring milled for 60 seconds, then sieved under 63 μm. In order to obtain glazes, seashell powders were added to the commercial transparent glaze at a ratio of 10% and 30% in weight.
Glaze compositions were applied to fired bodies by dipping technique after ball‐milling for 30 minutes in alumina media with water. To prepare fried bodies (with a diameter of 5 cm), two different plastic slurries (white and porcelain mud) were hand-pressed and dried at room temperature. Dried ceramic bodies have been heated at 900 °C for 7 hours in an electric furnace under atmospheric conditions. The qualitative phase analysis of sintered bodies was carried out using an X-Ray Diffractometer (XRD, Miniflex 600, Rigaku) between 20° and 70° diffraction angles with a scan speed of 2º/min and a step size of 0.02 under 30 kV and 15 mA.
The sintering of glazed bodies was performed at two different temperatures (1000 °C and 1100 °C) at the heating rate of 10 °C/min., with a holding time of 60 minutes at the peak temperature. The optical parameters of the glazed bodies were determined using a spectrophotometer (CM-5, Konica Minolta) between wavelength range of 360 nm-740 nm.
Factorial design is employed to reduce the total number of experiments to achieve the best overall system optimization. In this study, the 2P factorial design method was used for two levels. The number of experiments (N) required for understanding all the effects is given by the equation N=2P=23=8, where the number of variables p=3.
The variables used for the factorial design method were selected as firing temperature, substrate, and additive ratio. These variables and their interactions and the maximum/minimum levels defined for factorial design are given in Tables 1 and 2. These levels are expressed in coded form as +1 for maximum and -1 for minimum. The results were analyzed with the Minitab 16 Software to determine the main effects and interactions between variables.
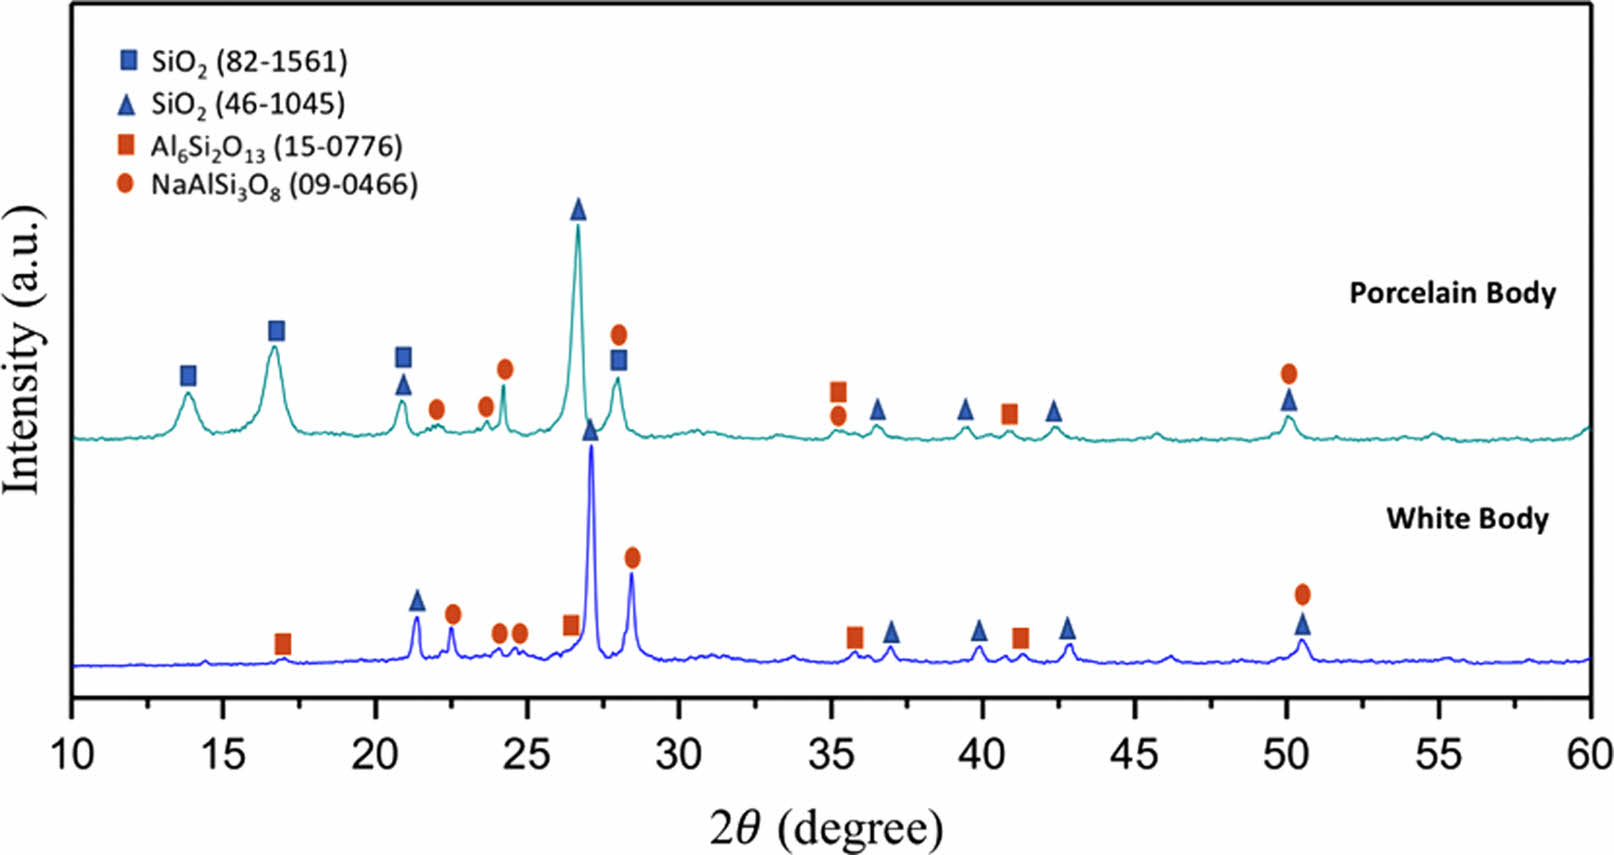
XRD patterns of sintered bodies are given in Fig. 1. Both white mud and porcelain mud included quartz (SiO2; ICDD: 46-1045/ICDD: 82-1561), albite (NaAlSi3O8; ICDD:09-0466), and mullite (Al6Si2O13; ICDD: 15-0776) crystalline phases. According to XRD patterns, all sintered bodies mainly contained quartz, whereas aluminum silicate phases such as mullite and albite were presented as minor crystalline phases.
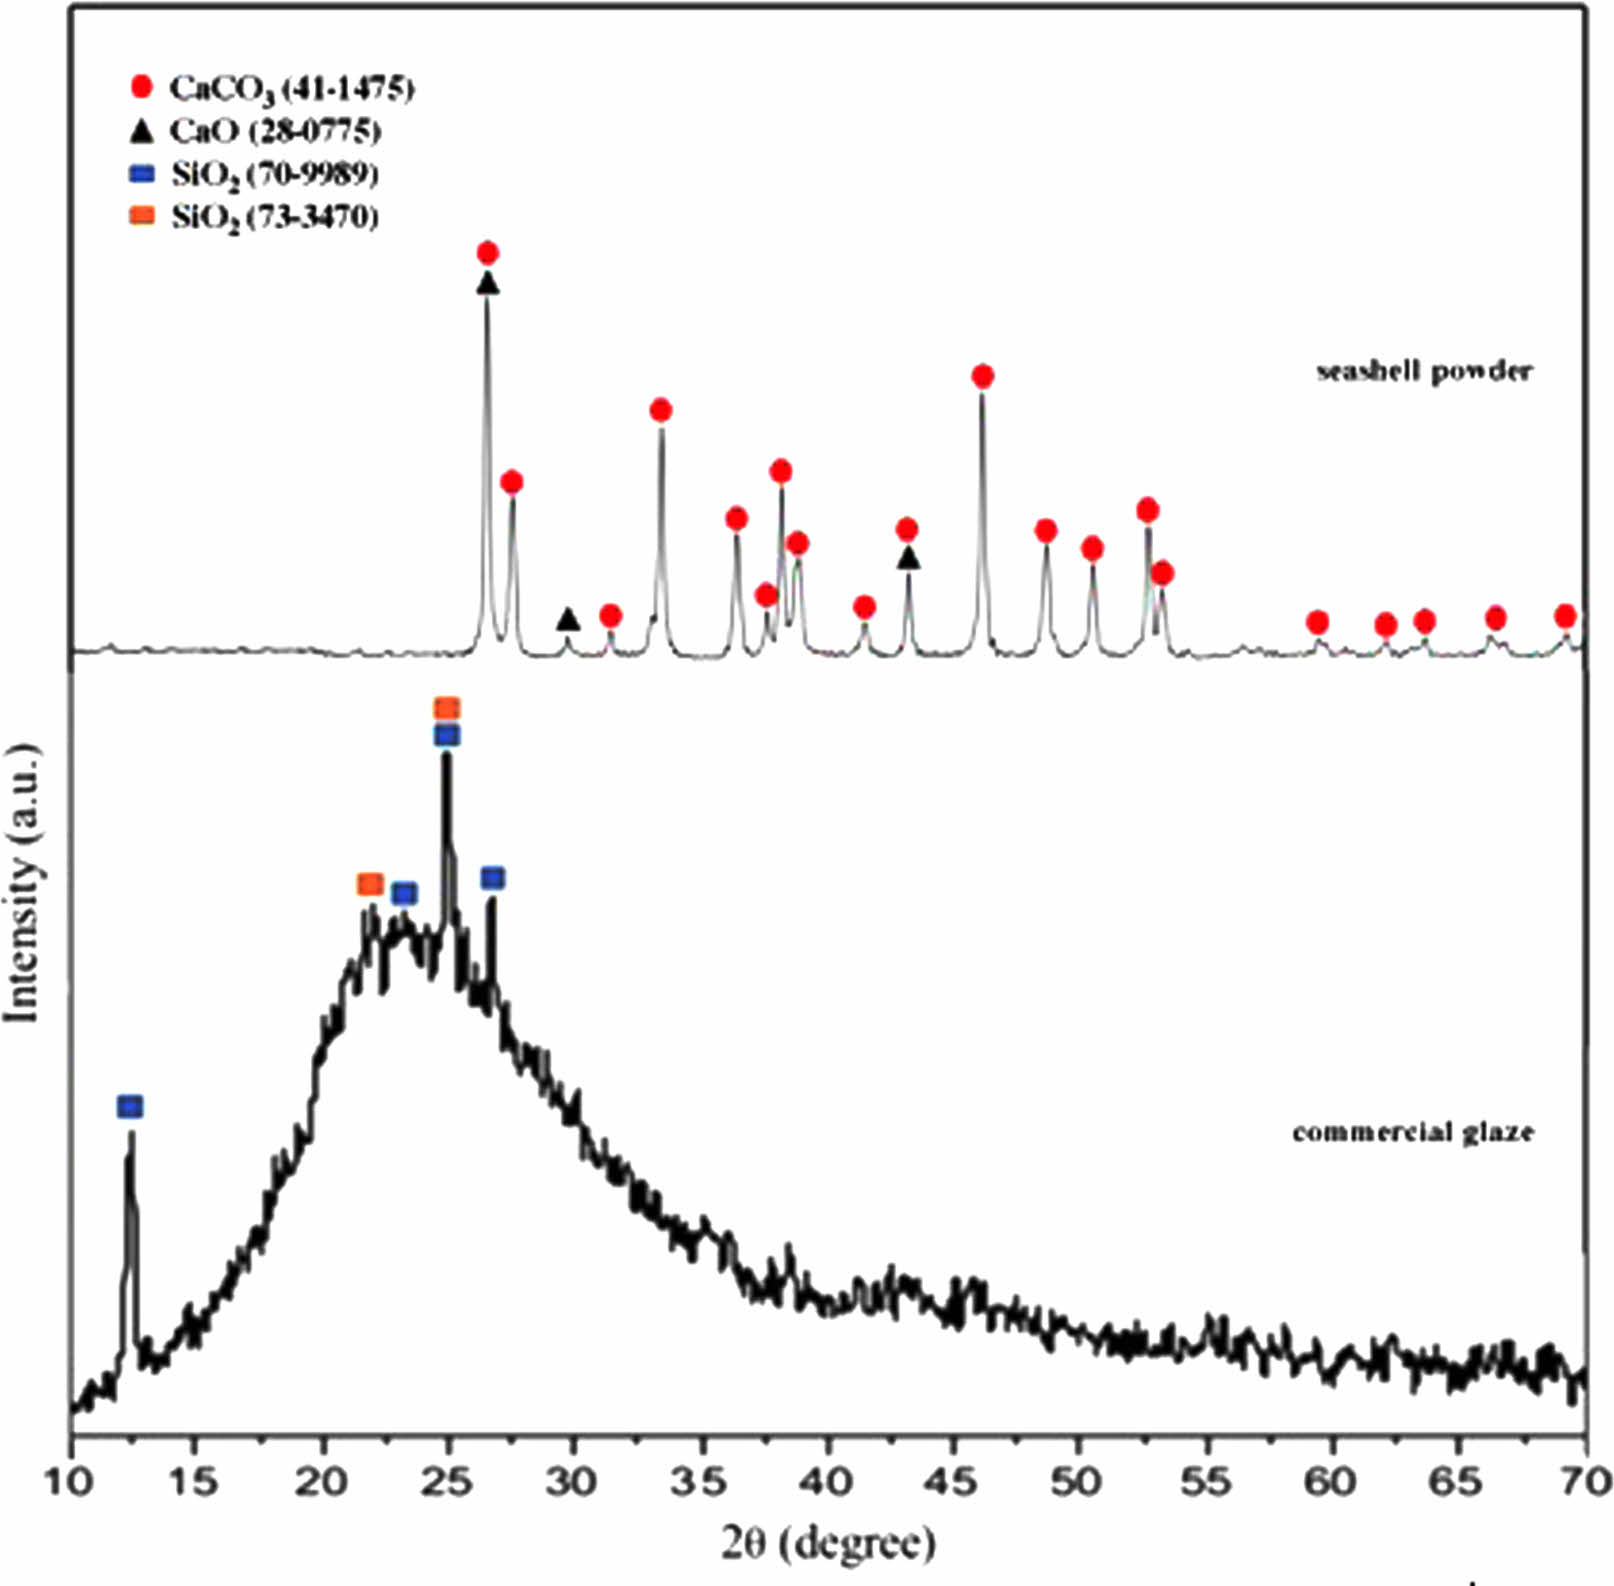
Chemical composition and the qualitative phase analysis results of calcined seashell powders and commercial transparent glaze (Glaze 0497 Transparent, Carl Jager) were reported in prior studies [12, 24]. In still, the XRD patterns of calcined seashell powder and commercial transparent glaze are given together in Fig. 2. Seashell powder comprised mainly aragonite (CaCO3; ICDD 41-1475) and calcium oxide (CaO; ICDD 28-0775), and the commercial glaze mainly contains (SiO2; ICDD 70-9989 and ICDD 73-3470) crystalline phase according to XRD results. Seashell powder is composed CaO (56.22 wt.%), although commercial transparent glaze mainly includes SiO2 (69.0937 wt.%), Al2O3 (12.7568 wt.%), CaO (8.7214 wt.%), Na2O (2.1234 wt.%), MgO (1.1253 wt.%), and K2O (1.0998 wt.%) as reported in past studies with XRF results [12, 24]. Loss on ignition (1000 °C) is 1.1580 wt.% for glaze and 42.69 wt.% for seashell powder.
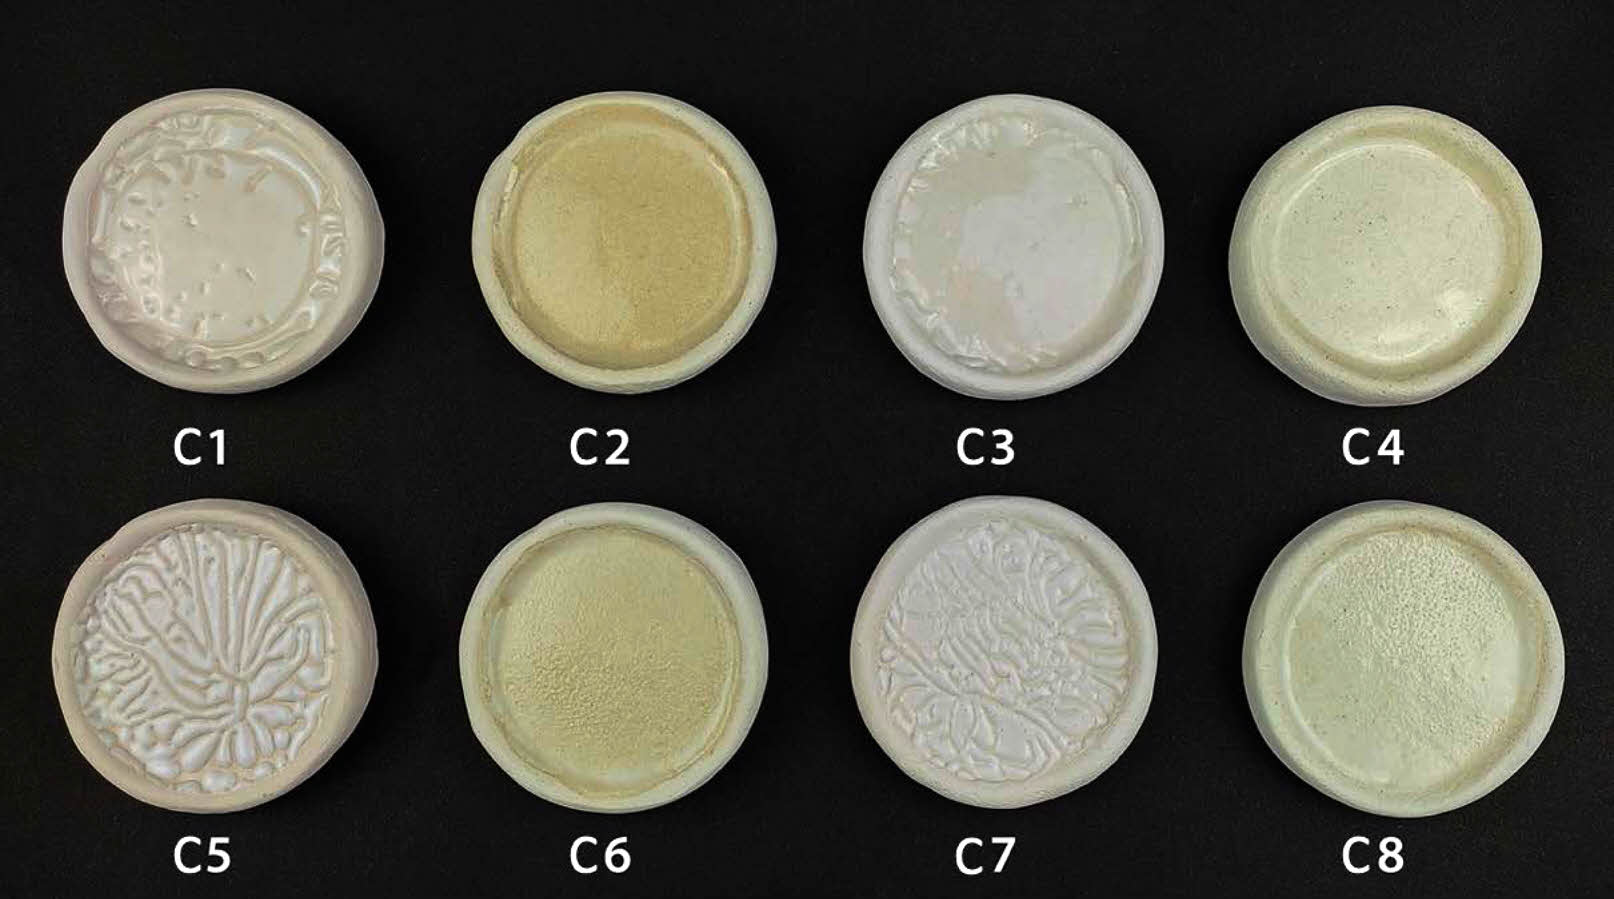
Digital images of transparent ceramic glazes containing seashell powder in varying proportions by weight and fired at different temperatures are shown in Fig. 3. The color of glazed bodies changes from white to yellowish-white. All glazes applied on bodies provided non-homogenous opacity, whereas the glaze bodies’ dispersal was homogenous at a firing temperature of 1100 °C. It is well known that a smooth surface with a high proportion of light reflecting off it at the same angle to the surface as the incident beam will have a high gloss value. On the other hand, on a matte (opaque) surface, part of the light is reflected at angles different than the incident angle (diffuse reflection). As a result of the increased refractive index of the glaze caused by surface roughness, crystals, or phase separation, lower gloss values are obtained [25, 26]. It has been observed that the glaze does not spread homogeneously on the ceramic surfaces fired at 1000 °C. The accumulation of glaze on the ceramic surface is described in the literature as a crawling defect, which is widely used for aesthetic purposes. The crawling glaze gathers and creates specks because it cannot completely wet the ceramic body’s surface. The reasons for the crawling defect are glaze surface tension, the strength of the bond between the glaze and the ceramic body, and the rapid shrinkage of the glaze [27, 28]. CaO tends to solidify the glaze below 1100 °C while impeding fusion; it also interacts with aluminum oxide and silica to form anorthite crystals cooling. Although CaO is an alkaline oxide, it is not used as a flux; instead, at temperatures over 1100 °C, CaO becomes a flux. For these reasons, crawling error also occurs in cases where the firing temperature is low in glazes containing CaO [29-31]. Also, the decrease in glaze viscosity is connected to the more homogenous dispersion of the glaze on the surface as the firing temperature rises.
Surface errors and crystal phases prevent the homogeneous spread of the glaze on the surface of the structure, and the opacity of the glaze increases [32]. In addition, it has been observed that pinhole defects occur in 30 wt.% seashell additive glazes that have been fired at 1100 °C. The high percentage of calcite in the seashell powder develops a thermal decomposition at temperatures over 650 °C. The formation of pinholes has been associated with CO2 gas bubbles that appear by thermal decomposition [33]. The surface defects were rectified as a consequence of uniformly covering the surface at 1100 °C with 10 wt.% seashell addition glaze studies.
The color and gloss values of glazed bodiesare given in Table 3, where L* indicates whiteness, a* redness-greenness, and b* yellowness-blueness. The highest gloss (60°) value (42.9) belongs to the C2 sample, glazed on a white ceramic body and fired at 1100 °C with 10 wt.% seashell addition. The gloss (60°) was measured low in samples C1 (23.9), C3 (8.2), C5 (3.3), and C7 (1.6), which had crawling defects on their surfaces. Furthermore, as the amount of seashell addition rises, the CaO mattness in it increases, and low gloss values were obtained in 30 wt.% additive samples. When the glaze samples’ whiteness (L*) values were examined, they varied between 80.94 and 87.82 and were very close to each other. The natural white color of the ceramic bodies may have contributed to the increase in the L* value. A higher L* value in samples with a low firing temperature has been associated with an increase in temperature and a change in the substrate’s fired body color. The a* values of all glazed surfaces were found close to each other. High b* values were measured in C2 (13.89), C4 (9.72), C6 (12.14) and C8 (9.28) samples fired at 1100 °C. The yellow color, which causes a high b* value in glazes, has been associated with the fact that seashell has a high loss on ignition, as well as the carbonate, phosphate, and sulfate it contains, which come out during firing and accumulate in the furnace atmosphere, adhering to the surface with increasing temperature [34, 35].
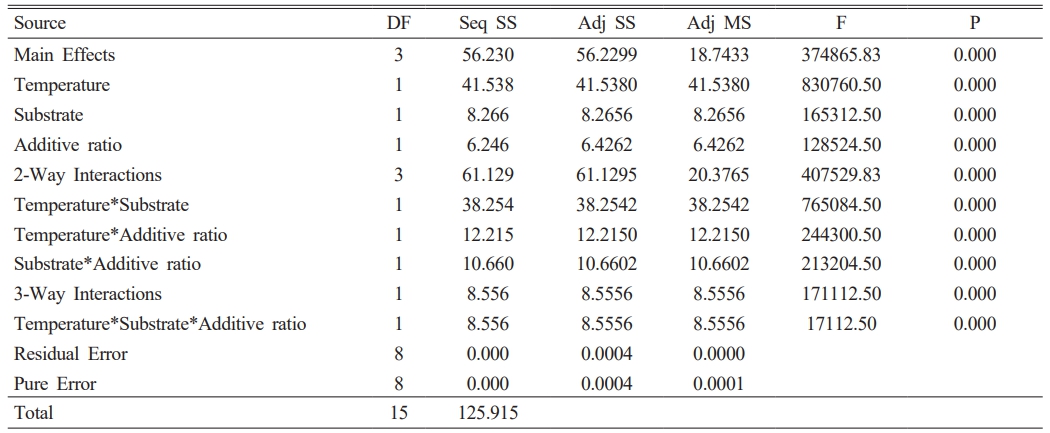
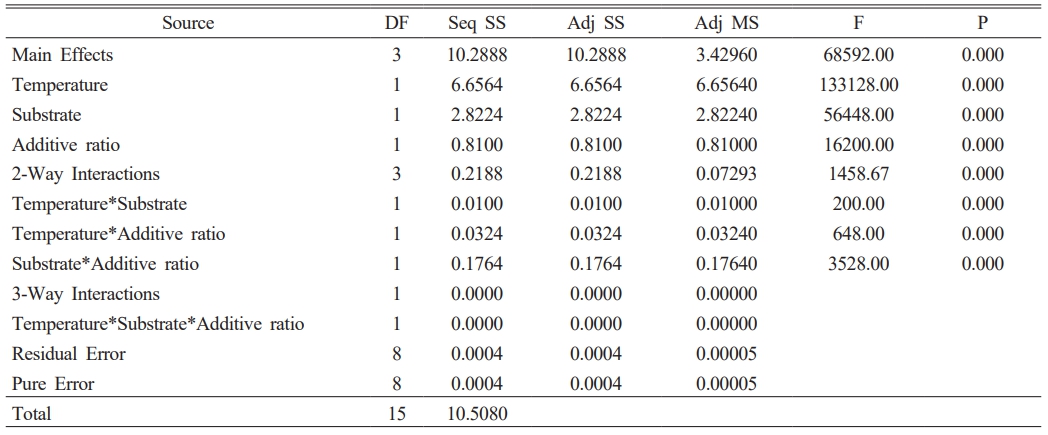
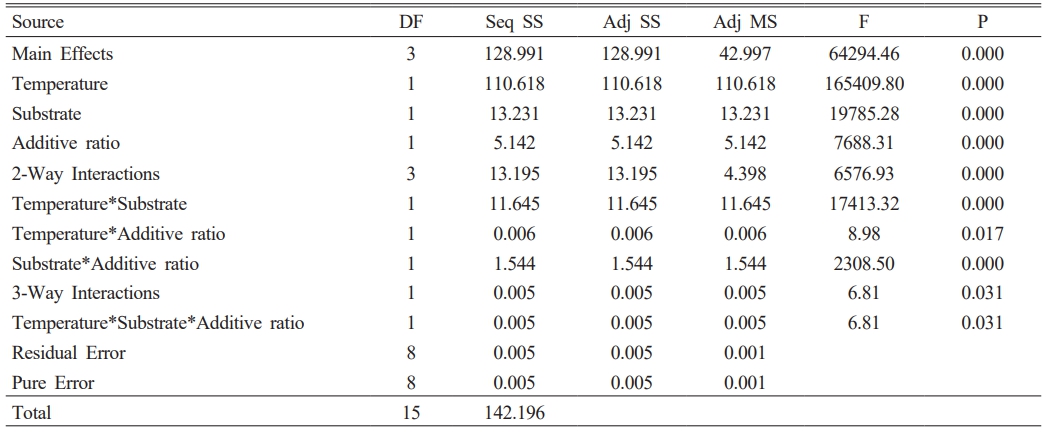
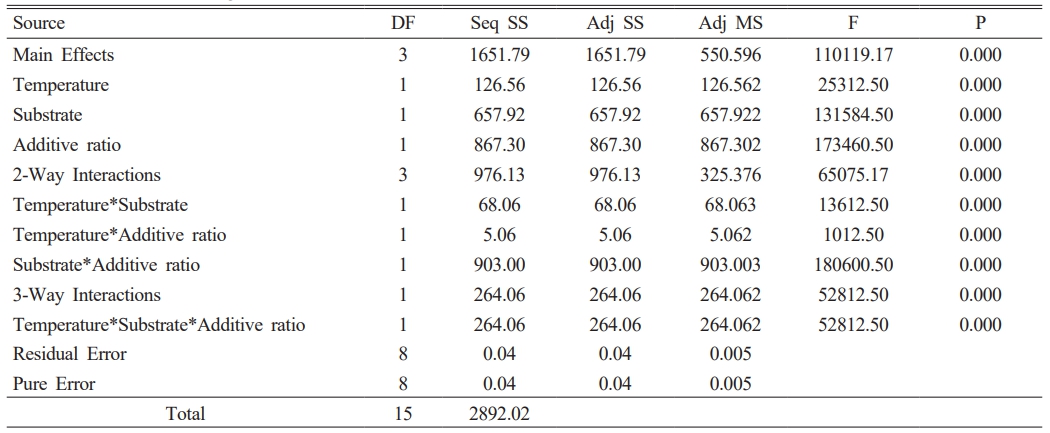
A 23 full factorial design was used to evaluate the importance and interactions of the temperature, additive ratio, and substrate. The response variables in this study are the optical properties of glazed samples. Minitab 16 statistical software was used for the data analysis. In the first stage, the zero hypothesis, which assumes that the main effects and interactions are equal to zero, was tested using the F test. The ANOVA tables (Table 4-7) include the effective main factors and their interactions according to effective factors. DF: means degrees of freedom, Seq SS: means the sum of squares, MS means square, and F distribution is used to determine the differences between factors’ variances. The most significant F value is the most influential factor in the model. P values indicate the ratio of the unadmitted region (P values lower than the admitted α are effective). α = 0.05 value is used (with a 99% confidence interval) [36, 37].
The p values in Table 4, Table 5, and Table 7 show that all effects and interactions are equal to zero at a 5% significance level. In Table 6, the temperature and substrate interaction and the p values less than 0.05 in the triplet interaction show that not all effects and interactions are equal to zero at a 5% significance level.
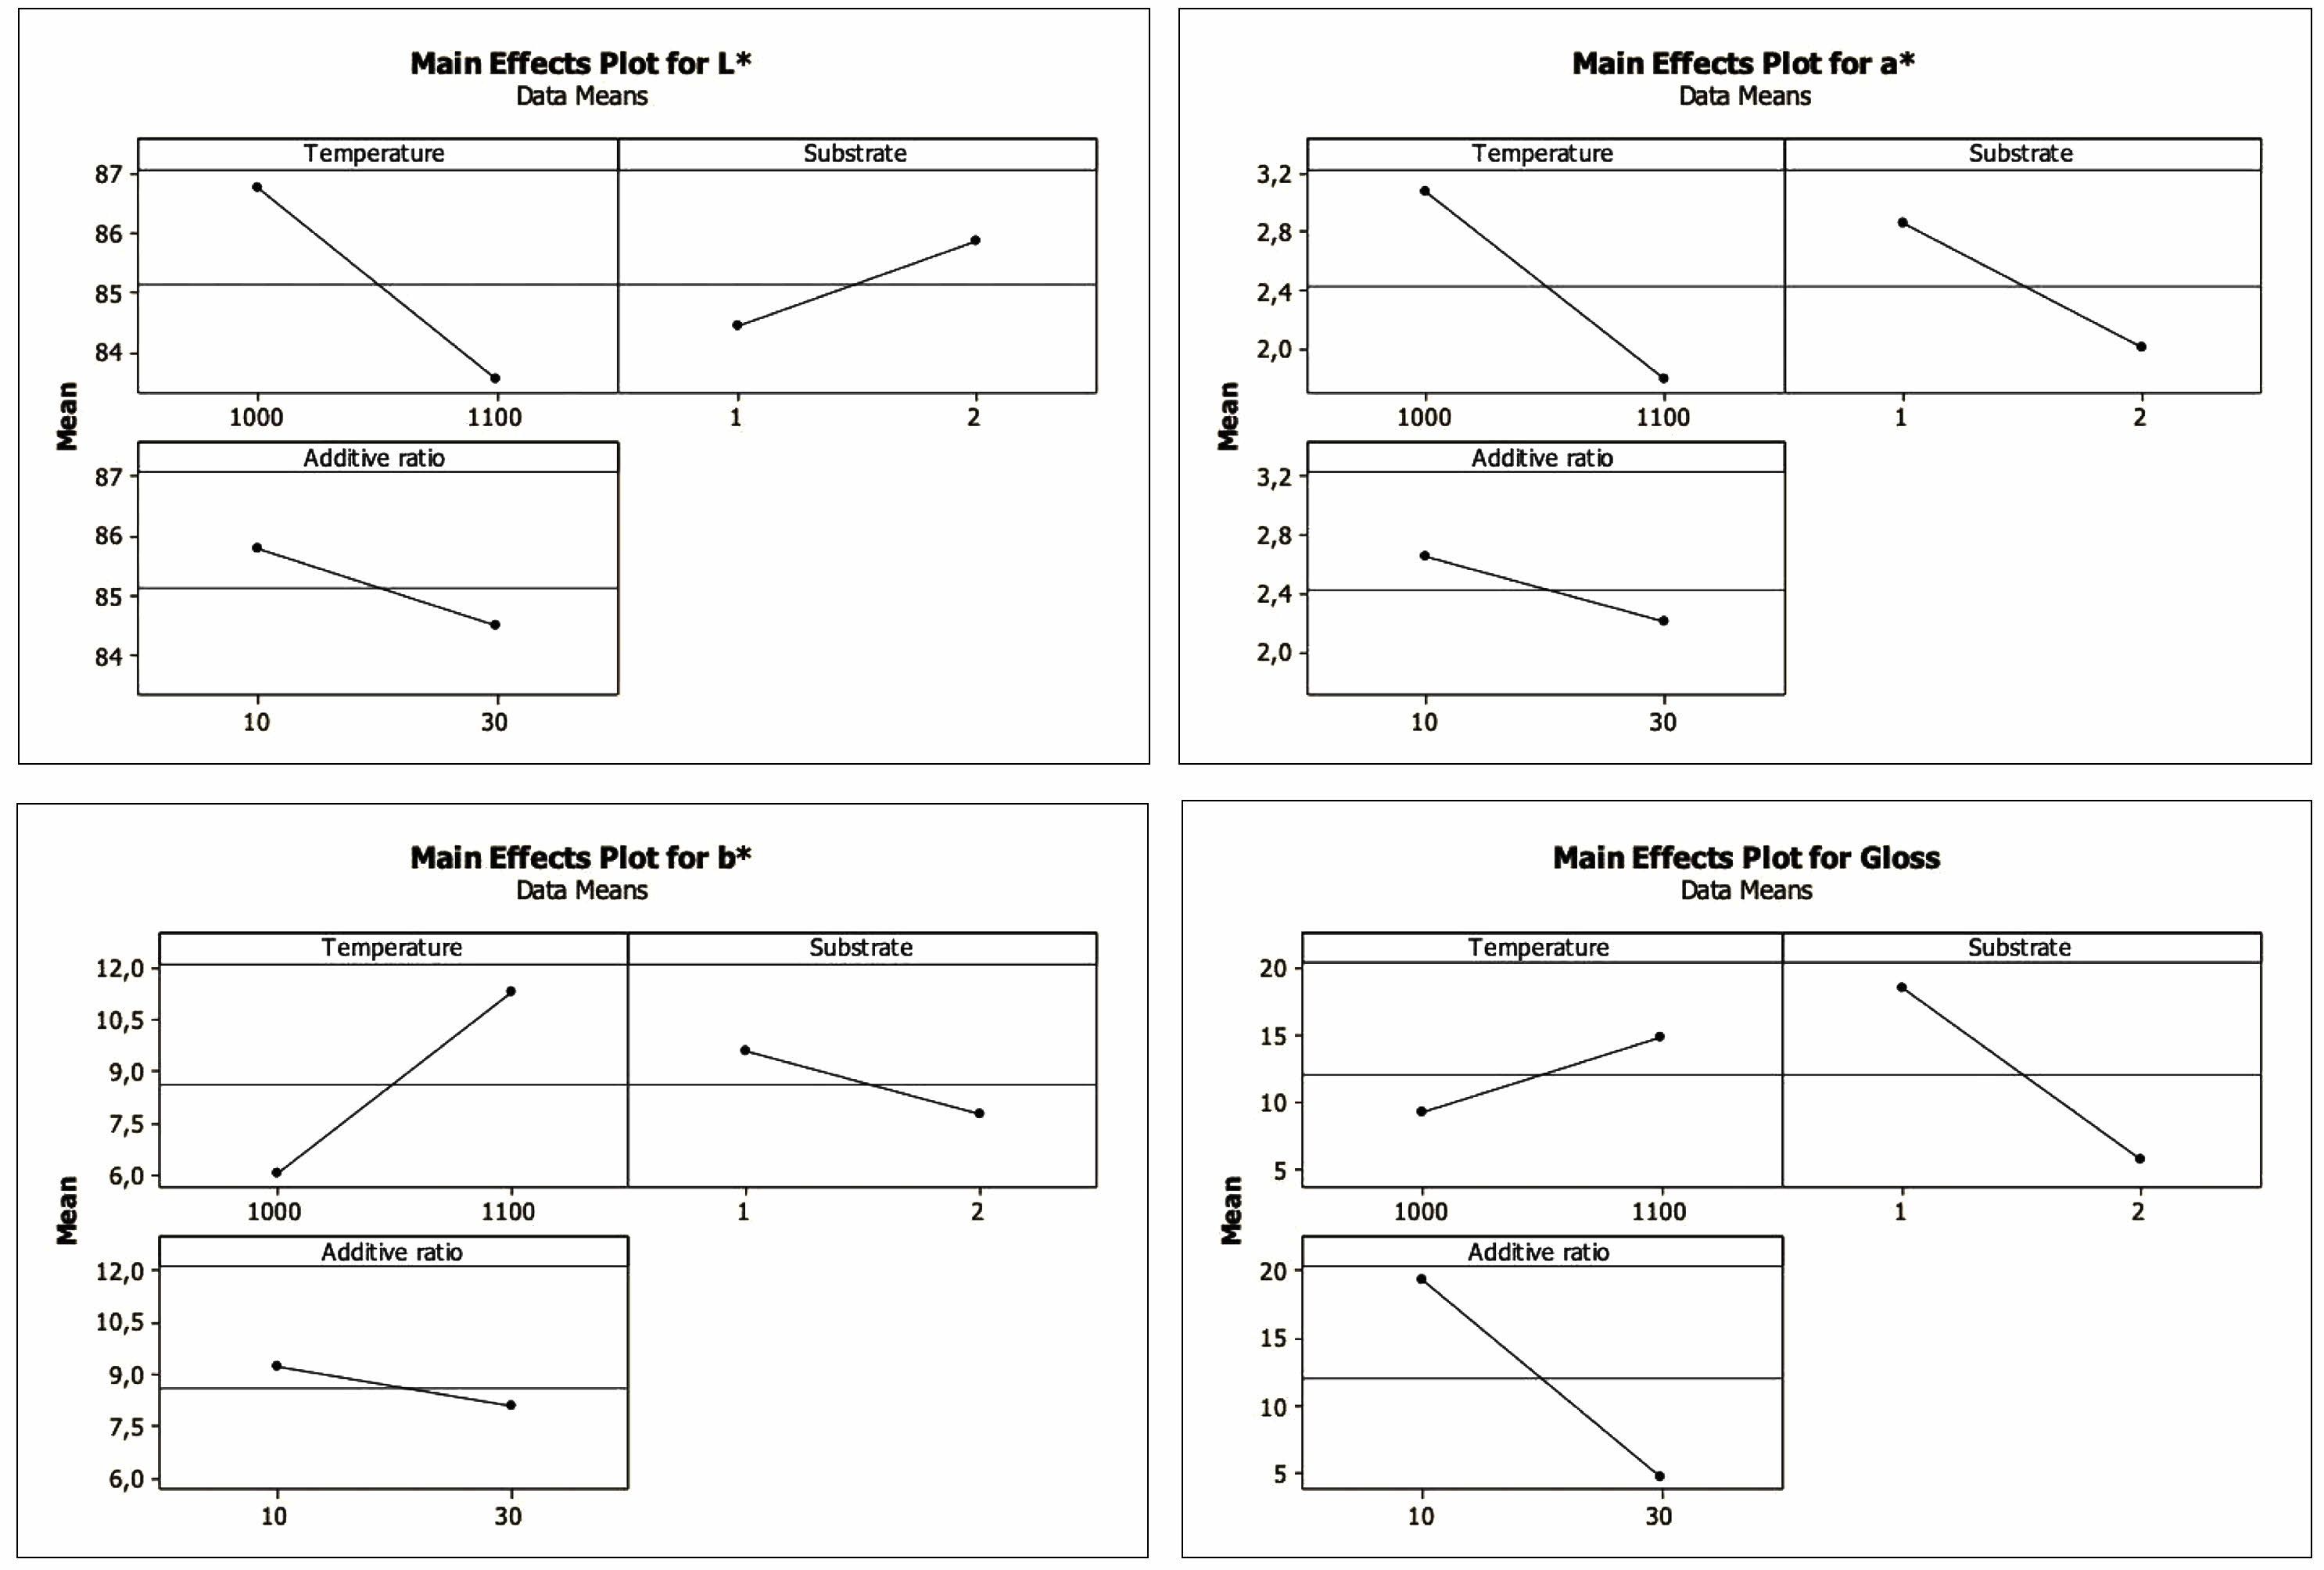
Figure 4 shows the main effect graphs of the factors. The main effect of a factor is the difference between the average response variables calculated when the factor is at a high level and a low level. In the main effect graph, the more significant the difference that level changes of a factor will make on the response variable, the steeper the line joining the levels [38]. In this respect, it is clearly understood that the temperature factor for L*, a*, and b* is proportionally more effective than the other factors. For gloss, the effect of the substrate and additive ratio factors is more effective than the temperature factor.
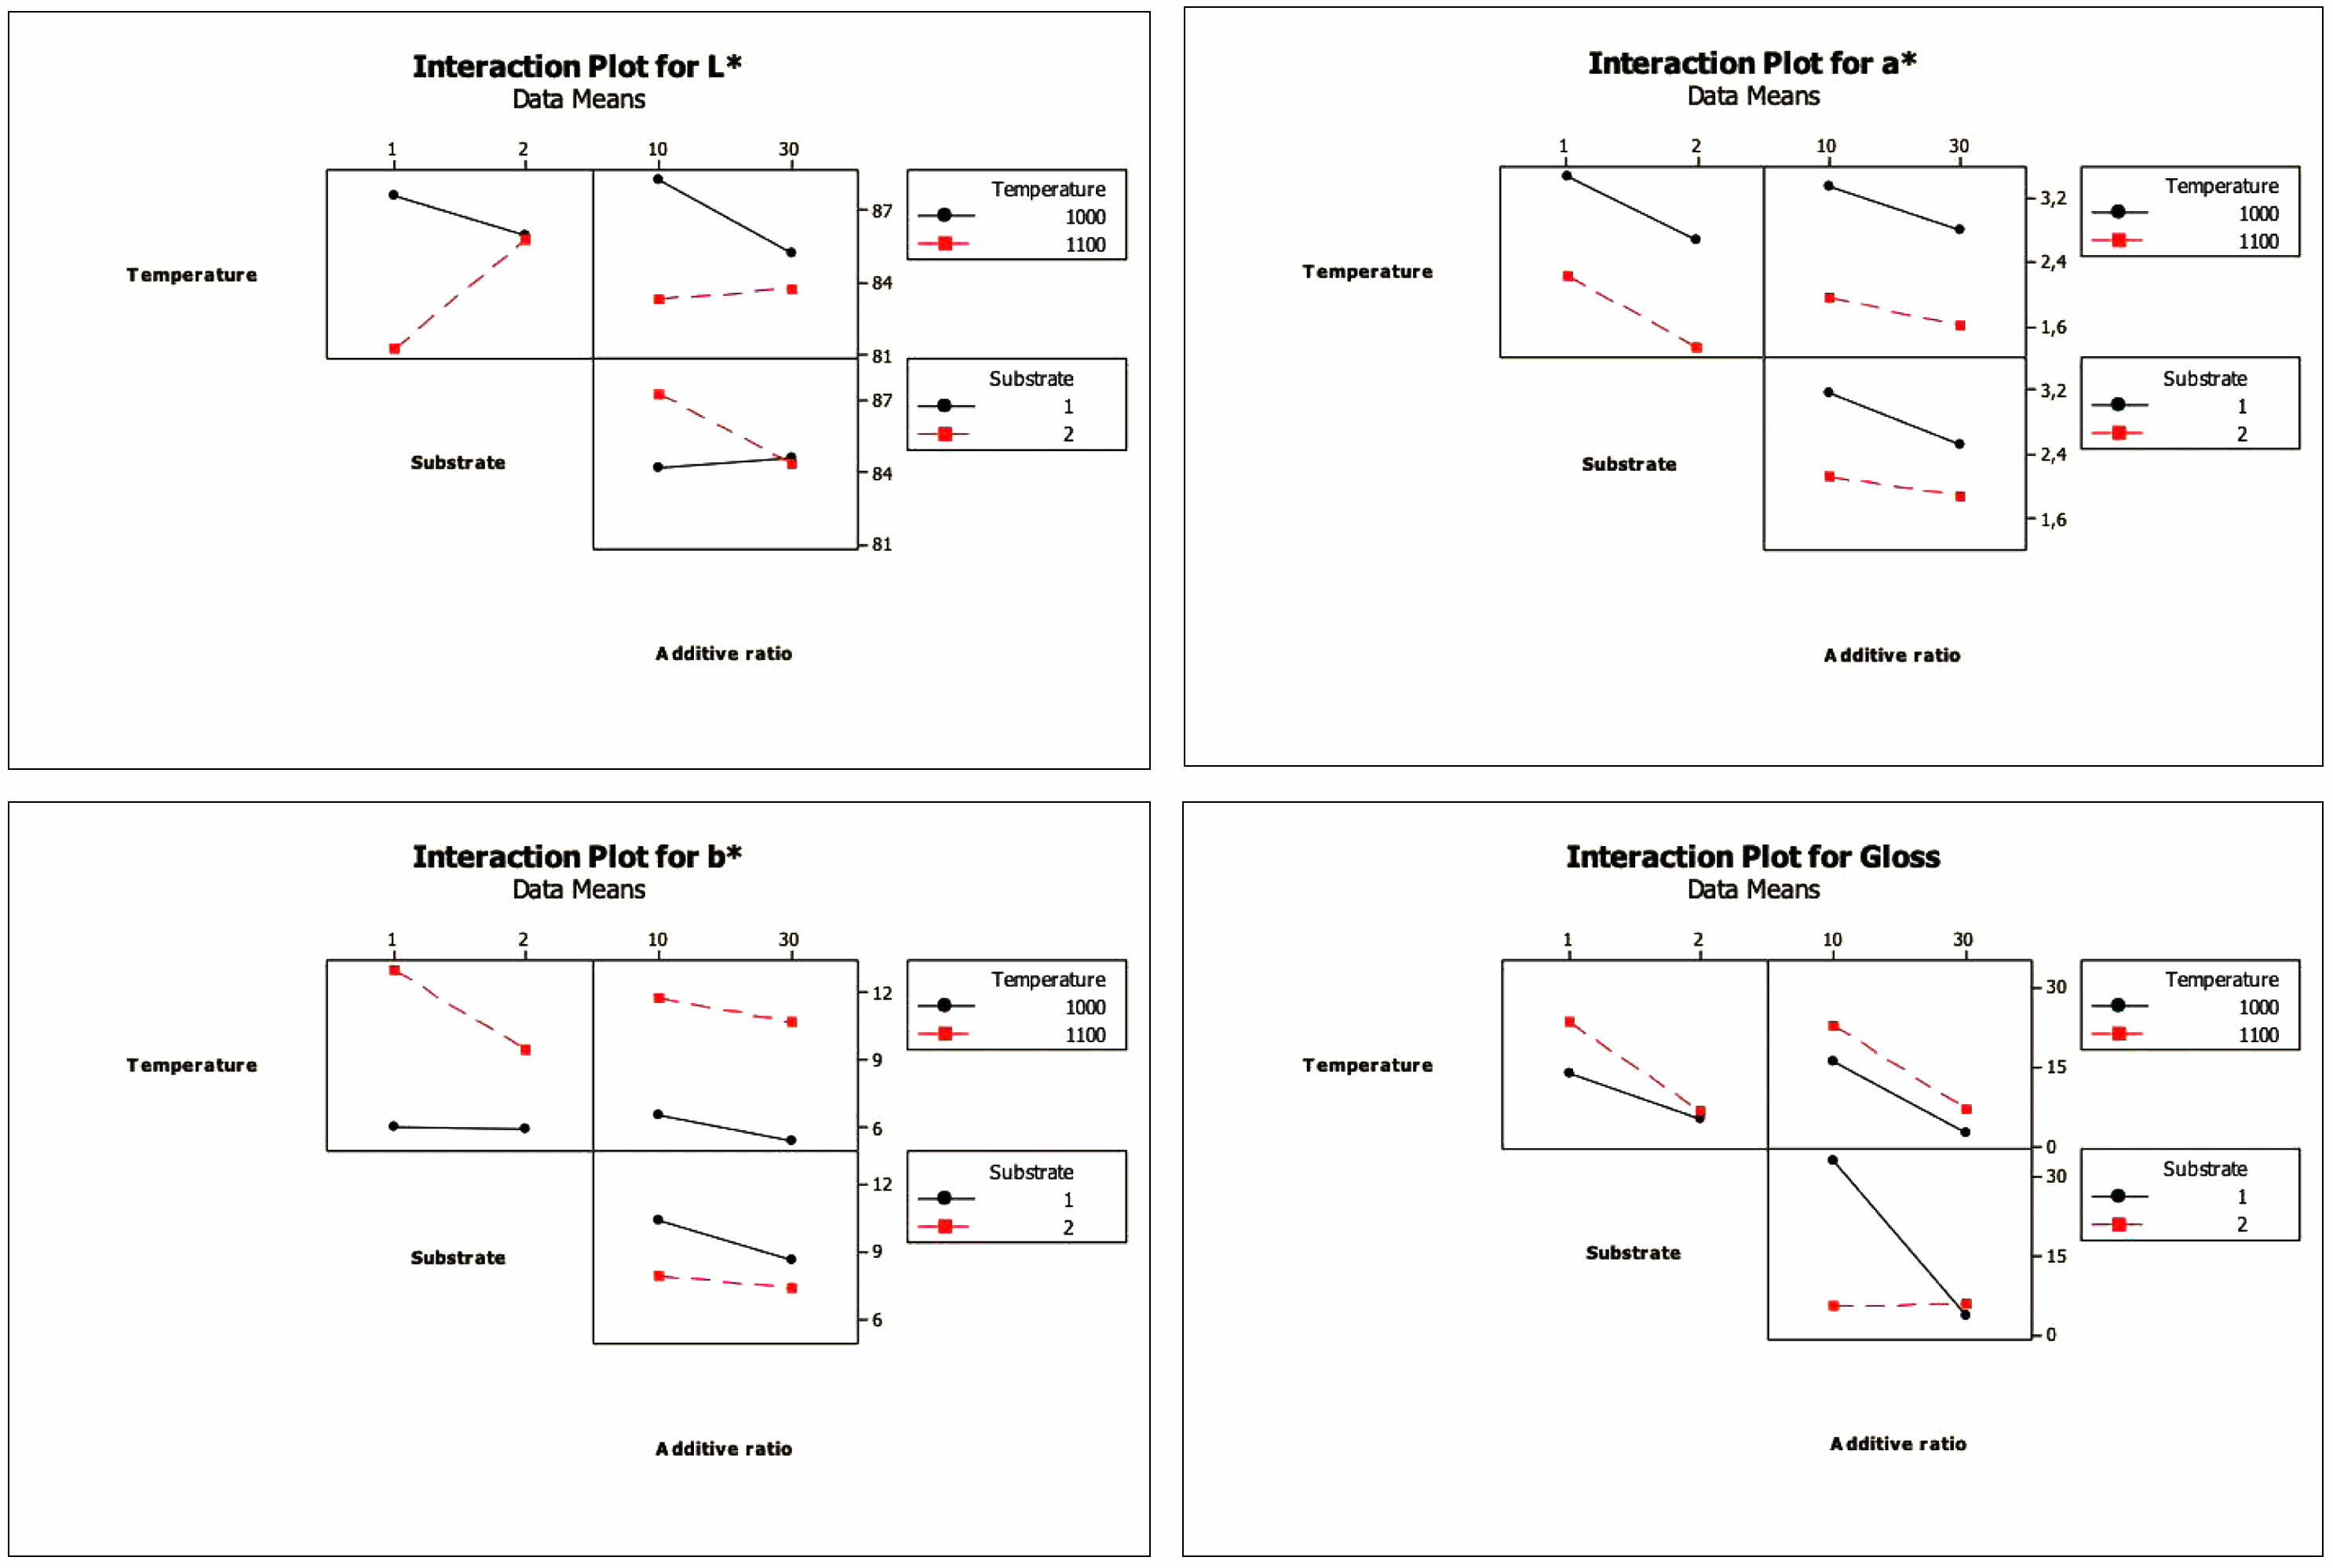
Interaction is the effect of one factor on performance criteria that depends on another factor [20, 39]. Interaction plots of the factors are given in Fig. 5. When binary interaction charts are examined, it is clear that there is a high degree of effect of temperature*addtive ratio and temperature*substrate interaction over the L* value, that a* and b* additive ratio interaction can occur for values, and that the effect of the temperature*additive ratio interaction for the gloss value is not observed. At the same time, the result of statistical analysis is highly effective for the temperature*substrate and substrate*additive ratio interactions.
In the normal probability graph, which shows the relative size and statistical importance of major effects and interactions, the value located farthest from the reference line is the most influential factor in the process [40]. As can be seen from Fig. 6, the most effective factor for L*, a*, and b* is temperature. A normal probability marking chart for L* and a* also shows that the temperature factor at the farthest distance from the reference line and receiving a negative value is the most influential factor on the process and that the 1000 °C-realized sintering will increase the value of L* and a*. For the b* value, it is seen that there is a temperature factor that receives a positive value, and sintering at 1100 °C will increase this value. However, the most effective parameter for the gloss value is the substrate*additive ratio interaction.
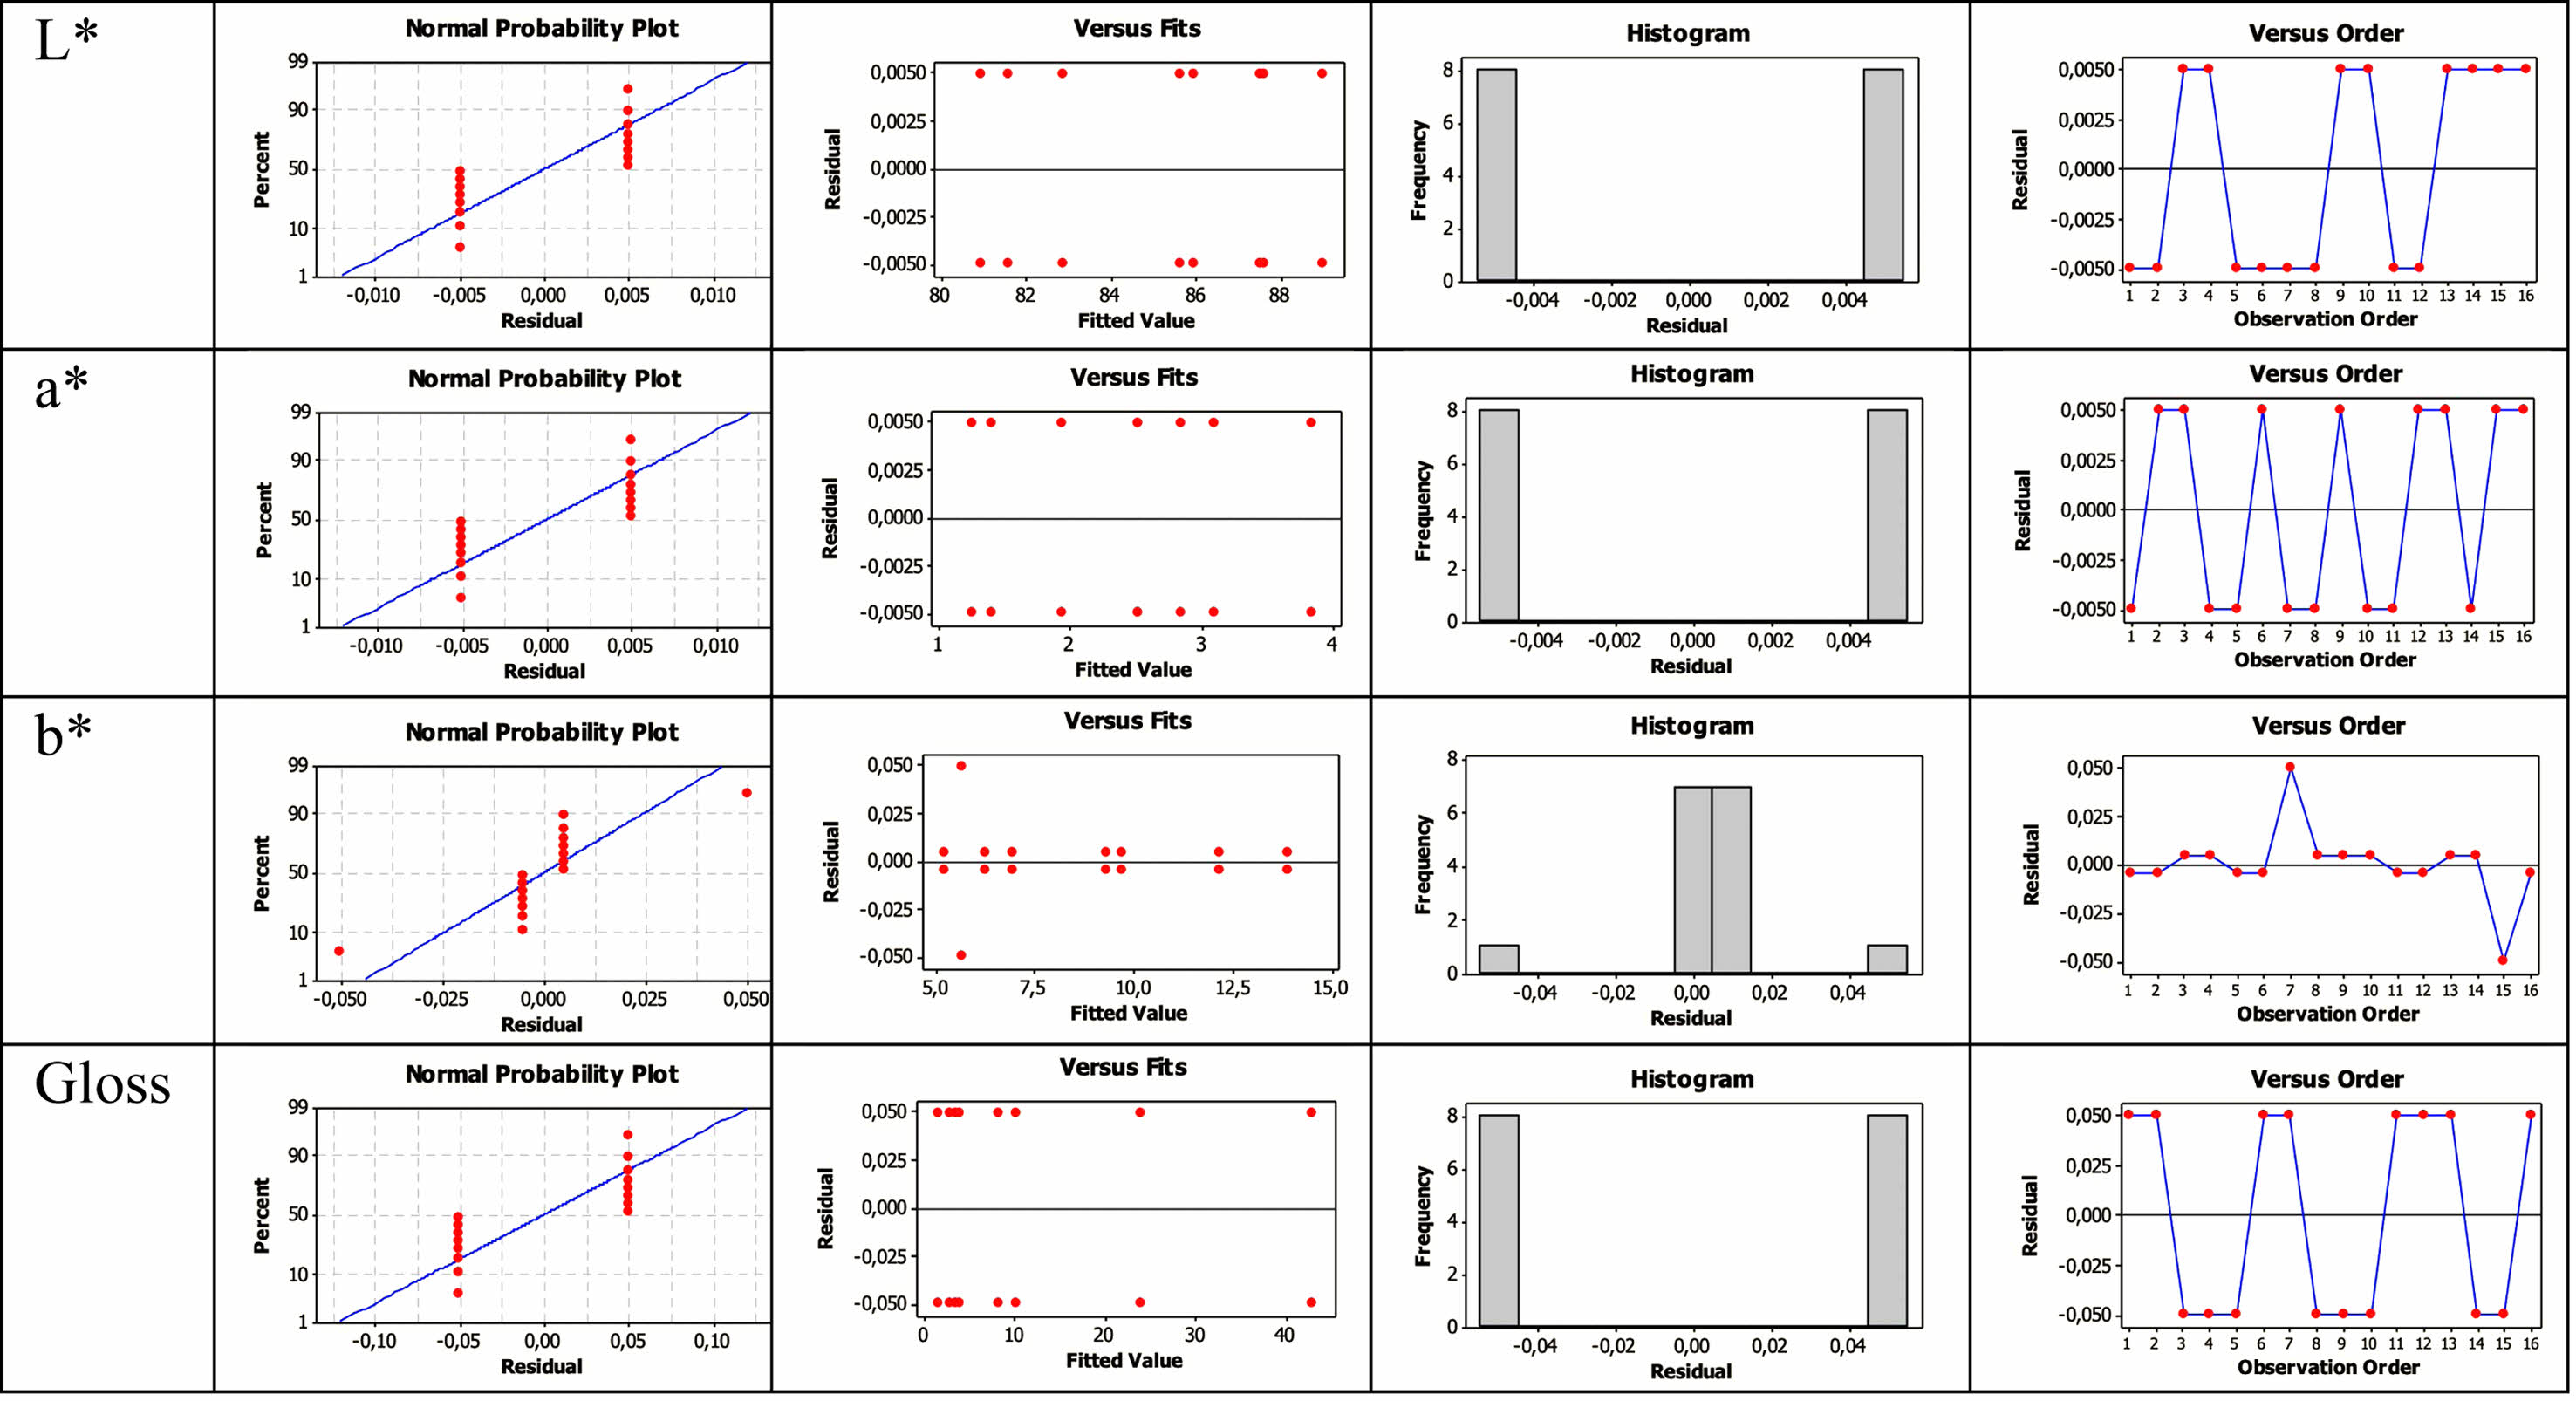
Experimental design is based on the assumption that residues are dispersed independently and typically [41]. In order to show the validity of this assumption, the residual plots given in Fig. 7 were used. Here it is understood that the residues (a) are typically distributed, b) the averages of the residues are zero, that the data has no end value and no distortion, c) that the values are now randomly distributed, and d) that the variance is constant, and that there is no systematic effect on the data due to the time or data collection order.
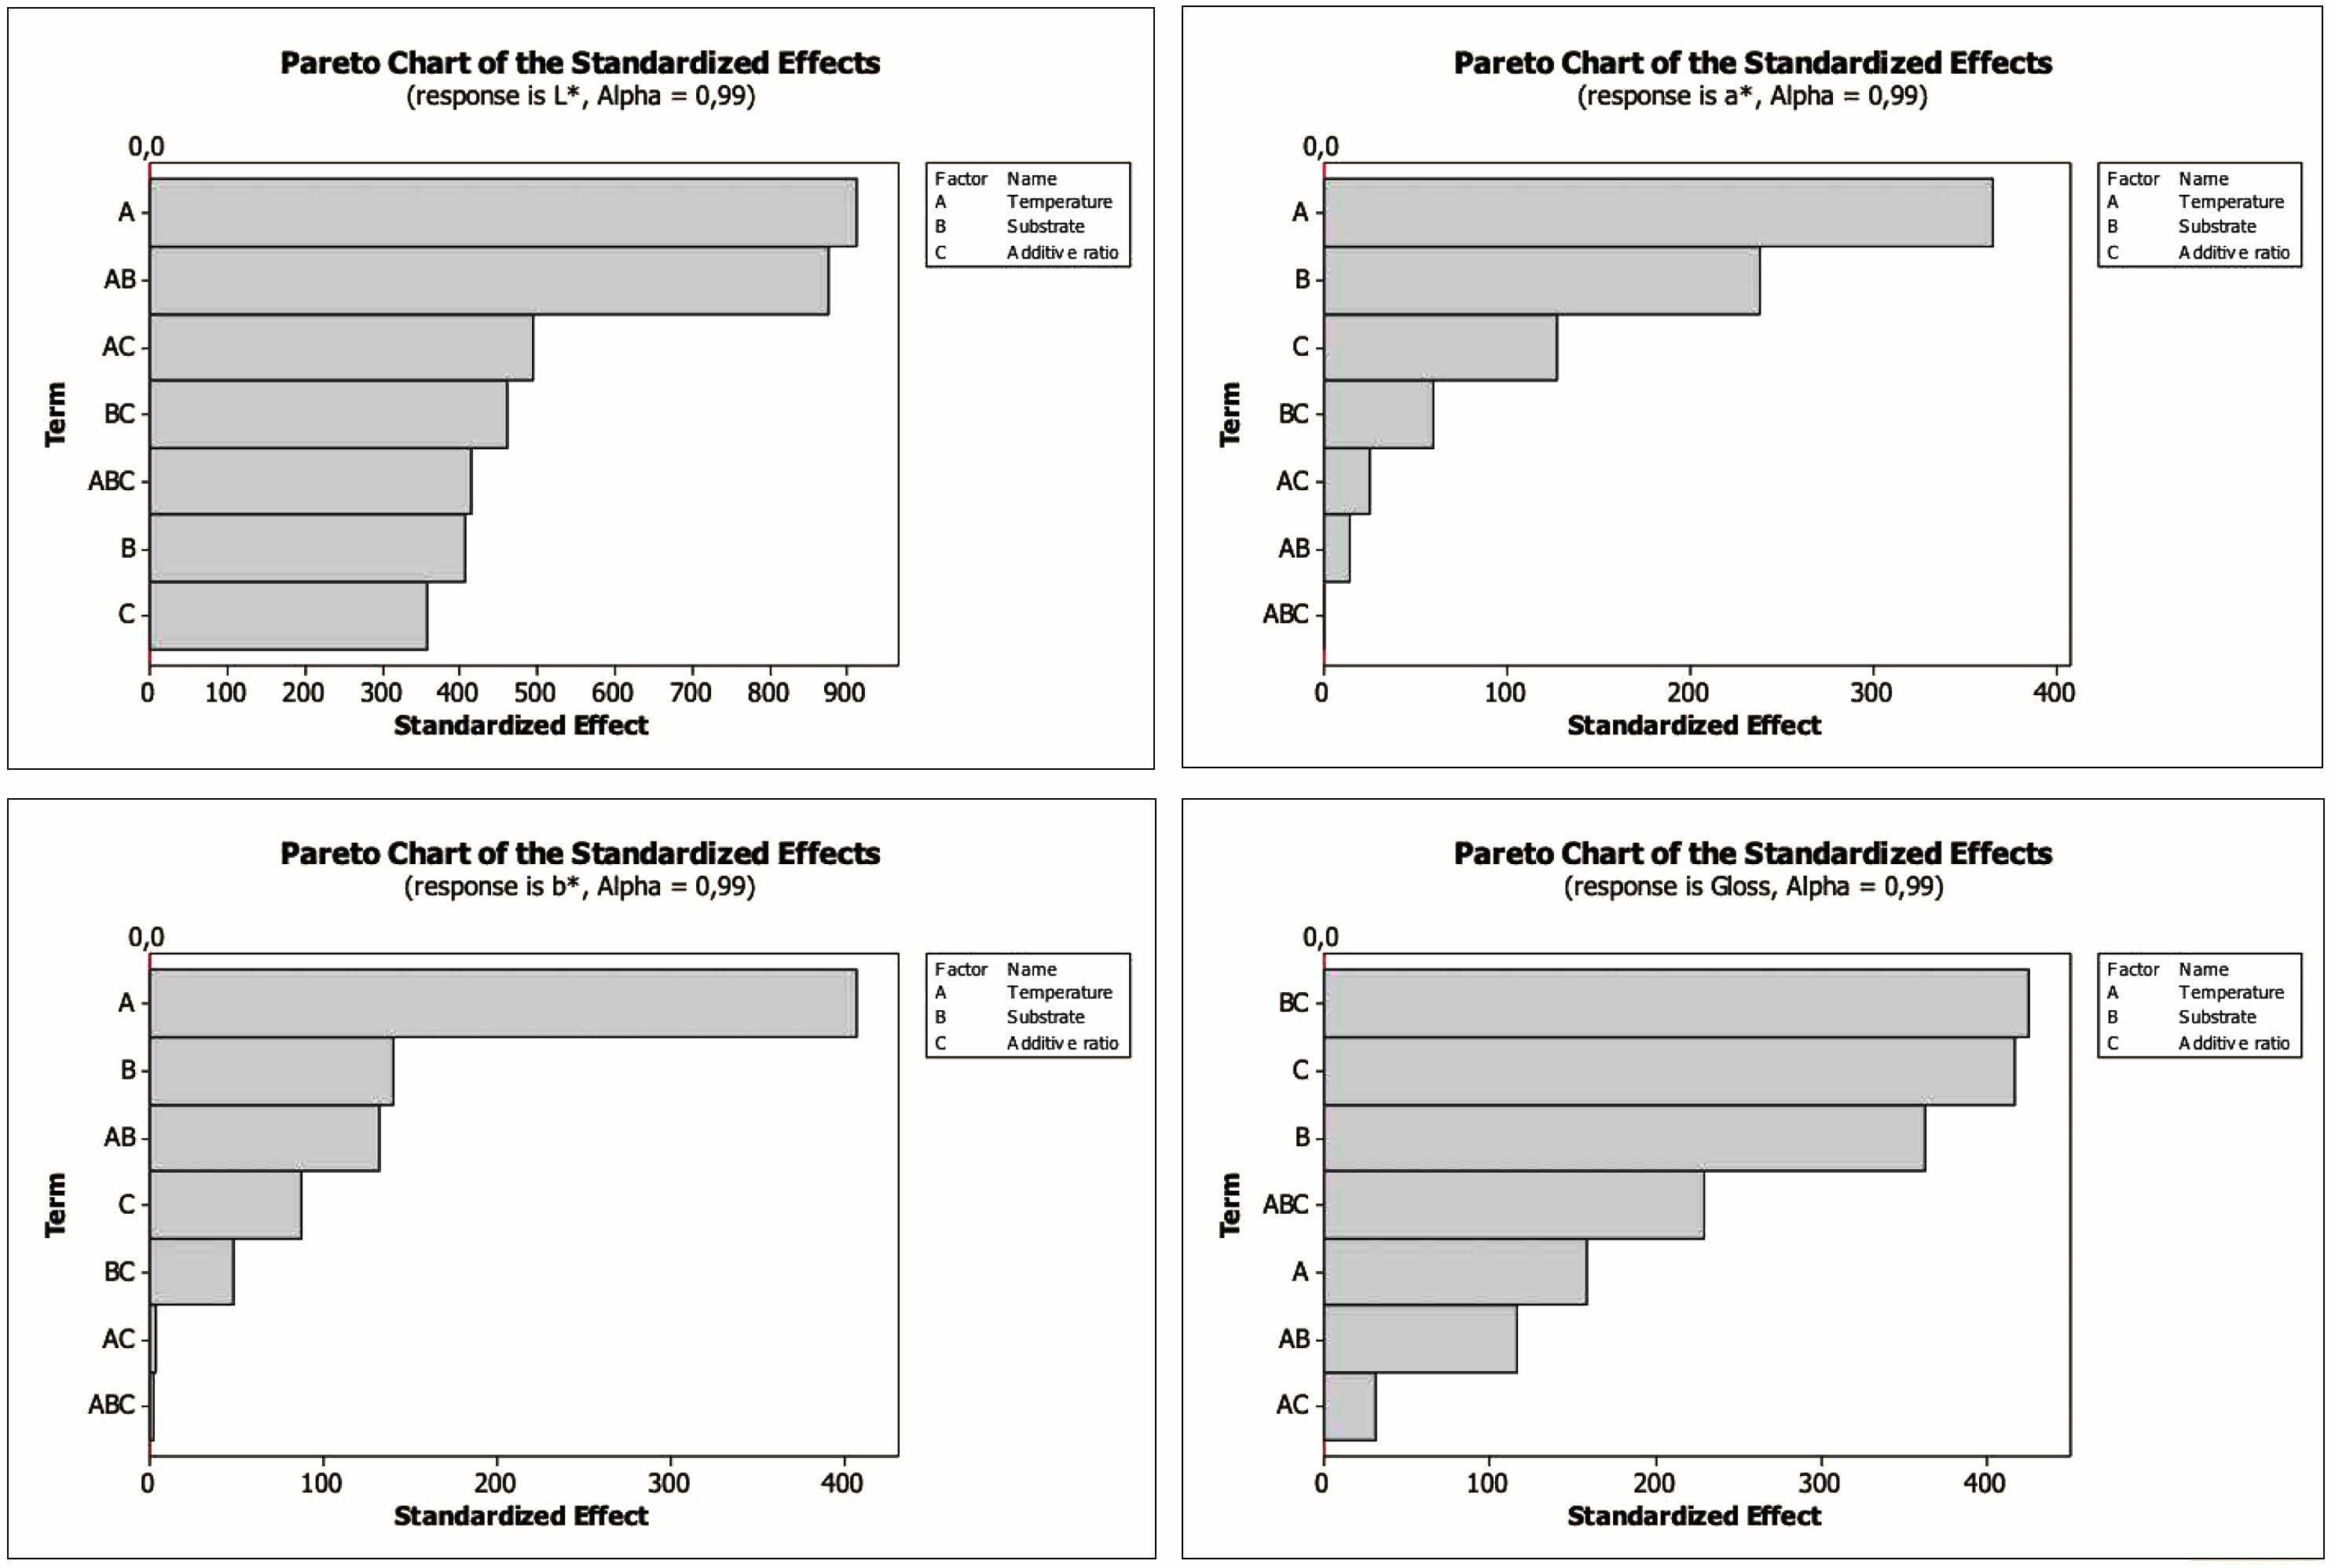
The Pareto Chart shows the importance of the factors alone and their interactions and is seen in Fig. 8. The t value is 2.3. As can be seen from the Pareto charts, the most influential factor for L*, a*, and b* is temperature, while the most effective factor for gloss value is substrate and additive ratio.
|
Fig. 1 XRD graph of sintered ceramic bodies. |
|
Fig. 2 XRD graph of seashell powder and commercial transparent glaze. |
|
Fig. 3 Digital images of glazed bodies |
|
Fig. 4 Main effects plots for L*, a*, b* and gloss values |
|
Fig. 5 Interaction plots for L*, a*, b* and gloss values |

|
Fig. 6 Normal plots of standardized effects for L*, a*, b* and gloss values |
|
Fig. 7 Residual plots for L*, a*, b* and gloss values. |
|
Fig. 8 Pareto chart of the standardized effects for L*, a*, b* and gloss values. |
In this study, transparent glazes with different ratios of seashell addition were applied to ceramic bodies prepared from white mud and porcelain mud to evaluate the effect of process parameters on optical properties via full factorial design. The glazed bodies were fired at 1000 °C and 1100 °C, then color and brightness measurements were performed. Minitab 16 statistical software was used for data analysis, and the results were evaluated. The glazed bodies prepared with seashell addition showed a narrow range of colors from white to yellowish white and surface roughness. Seashell additions in the proportions of 10 wt.% to 30 wt.% in transparent glaze result in environmentally friendly and low-cost glaze production. In manufacturing crawling glaze, which is highly preferred, especially for aesthetic purposes, seashell powder can be used as an alternative to CaO in low temperatures.
Experimental design with a full factorial design is an effective tool to evaluate the effects of temperature, additive ratio, and substrate parameters on the optical properties of glazed ceramic bodies. The study demonstrated that the firing temperature significantly affects the optical properties of glazed samples in a 23 level factorial design. Especially for values L*, a*, and b*, the temperature is the main controlling factor, and for brightness value, ceramic substrate and addition ratio of seashell powder are the main factors. The weights of interactions between the factors were less significant and varied for properties. It can be concluded from the present study the statistical methodology can provide significant time savings by identifying relevant factors and their levels. It is apparent that the factorial design of experiments is a highly helpful way to determine the major variables and levels affecting production while using less material, labor, and time.
- 1. R. Casasola, J. Ma Rincón, and M. Romero, J. Mater Sci. 47 (2012) 553-582.
-

- 2. M. Burleson, in “The Ceramic Glaze Handbook: Materials, Techniques, Formulas” (Lark Books, 2003).
- 3. J. Eom, S. Kang, K. Kim, and J. Kim, J. Ceram. Process. Res. 22[5] (2021) 568-575.
-

- 4. H. Lu, M. He, Y. Liu, J. Guo, L. Zhang, D. Chen, H. Wang, H. Xu, and R. Zhang, J. Ceram. Process. Res. 12[5] (2011) 588-591.
-

- 5. J.R. Taylor and A.C. Bull, in “Ceramics Glaze Technology” (Pergamon Press, 1986).
- 6. T. Pradell and J. Molera, Archaeol. Anthropol. Sci. 12 [189] (2020) 1-28.
-

- 7. Z. Sang, F. Wang, X. Yuan, S. Shen, J. Wang, and X. Wei, J. Ceram. Process. Res. 23[6] (2022) 758-765.
-

- 8. M. Ravi, B. Murugesan, A. Jeyakumar, and K. Raparthi, Adv. Mater. Sci. 21[3] (2021) 43-62.
-

- 9. U.G. Eziefula, J.C. Ezeh, and B.I. Eziefula, Constr. Build. Mater. 192 (2018) 287-300.
-

- 10. B. Safi, M. Saidi, A. Daoui, A. Bellal, A. Mechekak, and K. Toumi, Constr. Build. Mater. 78 (2015) 430-438.
-

- 11. M. Olivia, A. A. Mifshella, and L. Darmayanti, Procedia Eng. 125 (2015) 760-764.
-

- 12. C. Peksen, L. Koroglu, and H. Kartal, Int. J. Appl. Ceram. Technol. 17[4] (2020) 1940-1947.
-

- 13. S.P. Malu and B. Ajibade, Glob. J. Pure Appl. 13[3] (2007) 379-382.
-

- 14. I.A. Rauf, J. Phys. Chem. Biophys. 5[5] (2015) 1-2.
-

- 15. R. Mead, in “The Design of Experiments: Statistical Principles for Practical Applications” (Cambridge University Press, 1994).
- 16. D.W. Richerson, in “The Magic of Ceramics”, (John Wiley and Sons Inc., 2000).
- 17. Z. B. Ozturk and N. Ay, J. Ceram. Process. Res. 13[5] (2012) 635-640.
-

- 18. L.N. Frigon and D. Mathews, in “Practical Guide to Experimental Design” (John Wiley&Sons Inc., 1997).
- 19. M.I. Rodrigues and F.A. Iemma, in “Experimental Design and Process Optimization” (CRC Press, 2015).
- 20. F. Geyikci, Prog. Org. Coat. 98 (2016) 28-34.
- 21. A.L.B. Dotta, C. A. Costa, and M.C.M. Farias, Tribol. Int. 114 (2017) 208-220.
-

- 22. B. Somasundaram, K.T. Anand, D. Kirubakaran, P. Ganeshan, S. Kannan, A.H. Seikh, and A. Ghosh, J. Ceram. Process. Res. 24[4] (2023) 626-633.
-

- 23. J. Antony, Int. J. Oper. Prod. Manag. 21[5/6] (2001) 812-822.
-

- 24. L. Koroglu, C. Peksen, M. Ince, and E. Ayas, J. Aust. Ceram. Soc. 59 (2023) 1263-1269.
-

- 25. R.A. Platova and Y.T. Platov, Glass Ceram. 74 (2017) 91-94.
-

- 26. A. Tunali, J. Ceram. Process. Res. 15[4] (2014) 225-230.
-

- 27. R.A. Eppler and D.R. Eppler, in “Glazes and Glass Coatings” (The American Ceramic Society, 2000)
- 28. M.J. Ribeiro and D. Tulyaganov, in “Traditional Ceramics Manufacturing. In: F. Baino, M. Tomalino and D. Tulyaganov (eds) Ceramics, Glass and Glass-Ceramics” (Springer, 2021).
-

- 29. F. Hamer and J. Hamer, in “The Potter’s Dictionary of Materials and Techniques” (University of Pennsylvania Press, 2004).
- 30. J. Lee, H. Choi, and S. Lee, J. Ceram. Process. Res. 13[5] (2012) 646-650.
-

- 31. R. Casasola, J.M. Rincon, and M. Romero, J. Mater. Sci. 47 (2012) 553-582.
-

- 32. A.R. Jamaludin, S.R. Kasim, and Z.A. Ahmad, Sci. of Sinter. 42[3] (2010) 345-355.
-

- 33. A. Escardino, J. Garcia-Ten, and C. Feliu, J. Eur. Ceram. Soc. 28[16] (2008) 3011-3020.
-

- 34. L. Duan, W. Zhou, H. Li, X. Chen, and C. Zhao, Korean J. Chem. Eng. 28[9] (2011) 1952-1955.
-

- 35. M. Jiang, H. Liu, X. Fan, and Z. Wang, Pol. J. Environ. Stud. 28[3] (2019) 1719-1725.
-

- 36. Y.F. Gomes, P.N. Medeiros, M.R.D. Bornio, I.M.G. Santos, C.A. Paskocimas, R.M. Nascimento, and F.V. Motta, Ceram. Int. 41 (2015) 699-706.
-

- 37. S. Vinothkumar and P. Senthilkumar, J. Ceram. Process. Res. 23[4] (2022) 546-552.
-

- 38. M.A. Baih, N. Saffaj, A. Bakka, R. Mamouni, N. El Baraka, H. Zidouh, and N. El Qacimi, AMST 25[3] (2021) 1-15.
-

- 39. S.L. Correia, D. Hotza, and A.M. Segadaes, Ceram. Int. 30[6] (2004) 917-922.
-

- 40. S. Kumar, M. Bablu, S. Janghela, M.K. Mısra, R. Mıshra, A. Ranjan, and N.E. Prasad, Bull. Mater. Sci. 4[17] (2018) 1-13.
-

- 41. P.T. Teo, S.K. Zakaria, N.M. Sharif, A.A. Seman, M.A.A. Taib, J.J. Mohamed, M. Yusoff, A.H. Yusoff, M. Mohamad, A. Ali, and M.N. Masri, Crystals 11[4] (2021) 1-26.
-

 This Article
-
2023; 24(6): 968-976
Published on Dec 31, 2023
- 10.36410/jcpr.2023.24.6.968
- Received on Aug 16, 2023
- Revised on Oct 10, 2023
- Accepted on Oct 28, 2023
 Services
Shared
 Correspondence to
- Ceren Peksen
-
Department of Ceramic and Glass, Ondokuz Mayıs University, Samsun 55100, Turkey
Tel : +90 362 312 1919 Fax: +90 362 445 2770 - E-mail: cpeksen@omu.edu.tr


 Copyright 2019 International Orgranization for Ceramic Processing. All rights reserved.