


- Investigation of the structural and optical properties of sol gel processed Ho-doped BaTiO3 ceramics
Adil Moutaouaffiqa, Ali Didi Seddika, Abdelilah Rjeba, Mohammed Naciri Bennanib, Mohamed Najia and Salaheddine Sayouria,*
aLPAIS, Faculty of Sciences-DM, University of Sidi Mohamed Ben Abdellah, B.P. 1796 Fez-Atlas, Morocco
bLCBAE, Chemistry Department, Moulay Ismail University, B.P. 11201 Zitoune, Meknes 50000, MoroccoThis article is an open access article distributed under the terms of the Creative Commons Attribution Non-Commercial License (http://creativecommons.org/licenses/by-nc/4.0) which permits unrestricted non-commercial use, distribution, and reproduction in any medium, provided the original work is properly cited.
The pure BaTiO3 and Ho doped BaTiO3 (Ba1-xHoxTiO3 with x = 0, 0.25, 0.50, 0.75, 1, 1.5 and 2%), powders were prepared through the sol-gel process and structurally characterized by Thermogravimetric analysis (TGA), Differential thermal analysis (DTA), X-Ray diffraction (XRD), Fourier Transform Infrared (FT-IR) and Raman spectroscopy. The optical properties have been investigated using Ultraviolet-Visible (UV-Vis) transmittance-reflectance spectroscopy. X-ray diffraction (XRD). The results revealed that the prepared powders, calcined at 1000 °C for 4 hours, crystallized in the pure perovskite structure without the presence of secondary phases and showed a slight transition from the quadratic phase (pure BT) to the pseudo-cubic phase for the doped samples. From these results, we can also notice that Ho may occupy both Ba and Ti crystallographic sites. Raman and Fourier Transform Infrared (FT-IR) results are in accordance with those obtained from XRD characterizations. The values of the bandgap energies for the doped samples are lower than that of the pure BaTiO3 (3.26 eV), thus confirming energy softening effect of Ho
Keywords: Sol-gel, Ba1-xHoxTiO3 ceramics, Structural analysis, Gap energy
Perovskites (ABO3) are among the most fascinating categories of oxide materials. This is owing to their distinct and numerous significant characteristics, which include a high dielectric constant, the capacity to exhibit ferroelectric activity under their Curie temperature, inherent polarization, and non-linear optical coefficients [1, 2]. In the ABO3 structure, the cations in the A and B-site adopt a total valence of +6 with 12 and 6-fold coordinated geometry, respectively. The flexibility of this structure allows it to host a variety of iso- and aliovalent cations, thus opening a wide horizon for applications. Among these materials is the Barium Titanate, BaTiO3 (BT), which presents high dielectric properties that can be systematically tailored by chemical substitution of Barium and/or Titanium. The current market share of capacitor business based on this powder represents 80-90% [3]. For example, BaTiO3 doped with the rare earths Ho3+, Y3+ or Er3+ is used as a dielectric material in ceramic capacitors [4, 5]. Most ceramic capacitors have a multi-layered structure which is known as a multi-layer ceramic chip capacitor (MLCC) [6]. Common electronic devices contain large numbers of MLCCs: a cell phone 250, a laptop 400 and an automobile with over 1,000 [7]. Studies have demonstrated that the electrical characteristics of BaTiO3 sublattices are influenced by the position of rare earth ions within them [8]. Tsur and Randall [9] found that when elements with ionic radius values between 0.87 Å and 0.94 Å (such as Er, Y, Ho, Dy, Gd) are used as substitutes, the compounds display amphoteric traits. This means that these elements can occupy either of the (A, B) cation lattice sites in the BaTiO3 structure, with their specific location being dependent on factors like the quantity of dopants, the Ba/Ti ratio, and solubility. For Ho3+ ions, the ionic radius of Ho3+ is about 0.90 Å, they could replace Ba2+ (1.35 Å) or Ti4+ (0.64 Å) ions. When Ho3+ ions are substituted into the Ba sites, the charge imbalance is compensated by Ba2+ vacancies, while when Ho3+ ions are substituted into Ti sites, charge compensation is provided by oxygen vacancies. In terms of the structure, Lu et al. [10] showed that Ho-doped BaTiO3 crystallized in a tetragonal structure, while Vega et al. [11] reported that this compound may adopt a cubic perovskite structure. Moreover, it has been found that doping with Holmium (Ho) leads to the creation of defects in the BaTiO3 structure, manifesting as a pyrochlore-like secondary phase, Ho2Ti2O7. This occurs in samples where the concentration of Holmium (x(Ho)) exceeds 3%, according to the research conducted by Jeong et al. [12]. Additionally, Marjanović et al. [13] demonstrated that this effect is also observed when the concentration of Ho is 0.5% or more. These established findings prompted us to restrict the Ho concentration, denoted as x, within the range of 0 to 2%. Moreover, the occupation of both cationic sites in BaTiO3 by Ho resulted ina lowering of the Curie temperature (TC) [14], and the decrease of the Curie constant with increase of Ho- concentration [12]. Despite these reported results, there is still a lack of our understanding on the: (i) effect of Holmium on the physical-chemical properties of BaTiO3, (ii) effect of occupation (of Ba or Ti sites) on the optical properties .
In this study, we report the effect of the Ho doping in BaTiO3 at the Ba site on the structural and optical properties of BaTiO3 ceramics obtained with the sol-gel method and compare our results with those found in the literature. In particular, we found that the samples exhibited a pure perovskite structure and a shift from quadratic to pseudo-cubic phase in the doped samples. It can be noticed that, at room temperature (RT), BaTiO3 adopts the tetragonal structure and is in its ferroelectric phase (Polarized state). With increasing temperature and around Tc = 130 °C (Curie temperature) the permittivity of the material reaches its maximum value and the phase begins to transform from ferroelectric to paraelectric phase. The latter is reached above Tc (Depolarized state) and the structure becomes cubic. The doping influences both the sturctural and dielectric properties of the material. In particular, due to the difference between ionic radii of Ba and Ti ions compared to that of Ho, the calculated values of the parameter quadracity (c/a), at room temperature , show a decrease with increase in Ho concentration without equaling 1. Indeed, at RT (< Tc), the material is in its ferroelectric state (non centro symmetric structure) and the corresponding structure is pseudo cubic (quadratic)(c/a is near 1). Moreover, under doping the physical properties of the materials are affected. It is obeserved from dielectric measurements a shift of Tc, a variation of the value of the permittivity around Tc, and the calculated parameters such as the piezoelectric coefficient and electromechanical coupling vary.
In particular, the shift of Tc to lower values , near RT, is suitable for applications of the materials at low temperatures and high values of the permittivity are favorable for the use of these materials for enrgy storage [15, 16]. A high piezoelectric coefficient and permittivity make the materials to have potential applications in multilayer piezoelectric devices [17].
UV-Vis spectroscopy demonstrated reduced bandgap energies in doped samples, confirming the energy-softening effect of Ho.We can also notice that In addition to the known applications of rare earth (La, Er, Ho, Sn, …)-doped BaTiO3 [3-7], attempts are still underway to improve the optical properties of this material for possible technological applications [18].
Synthesis
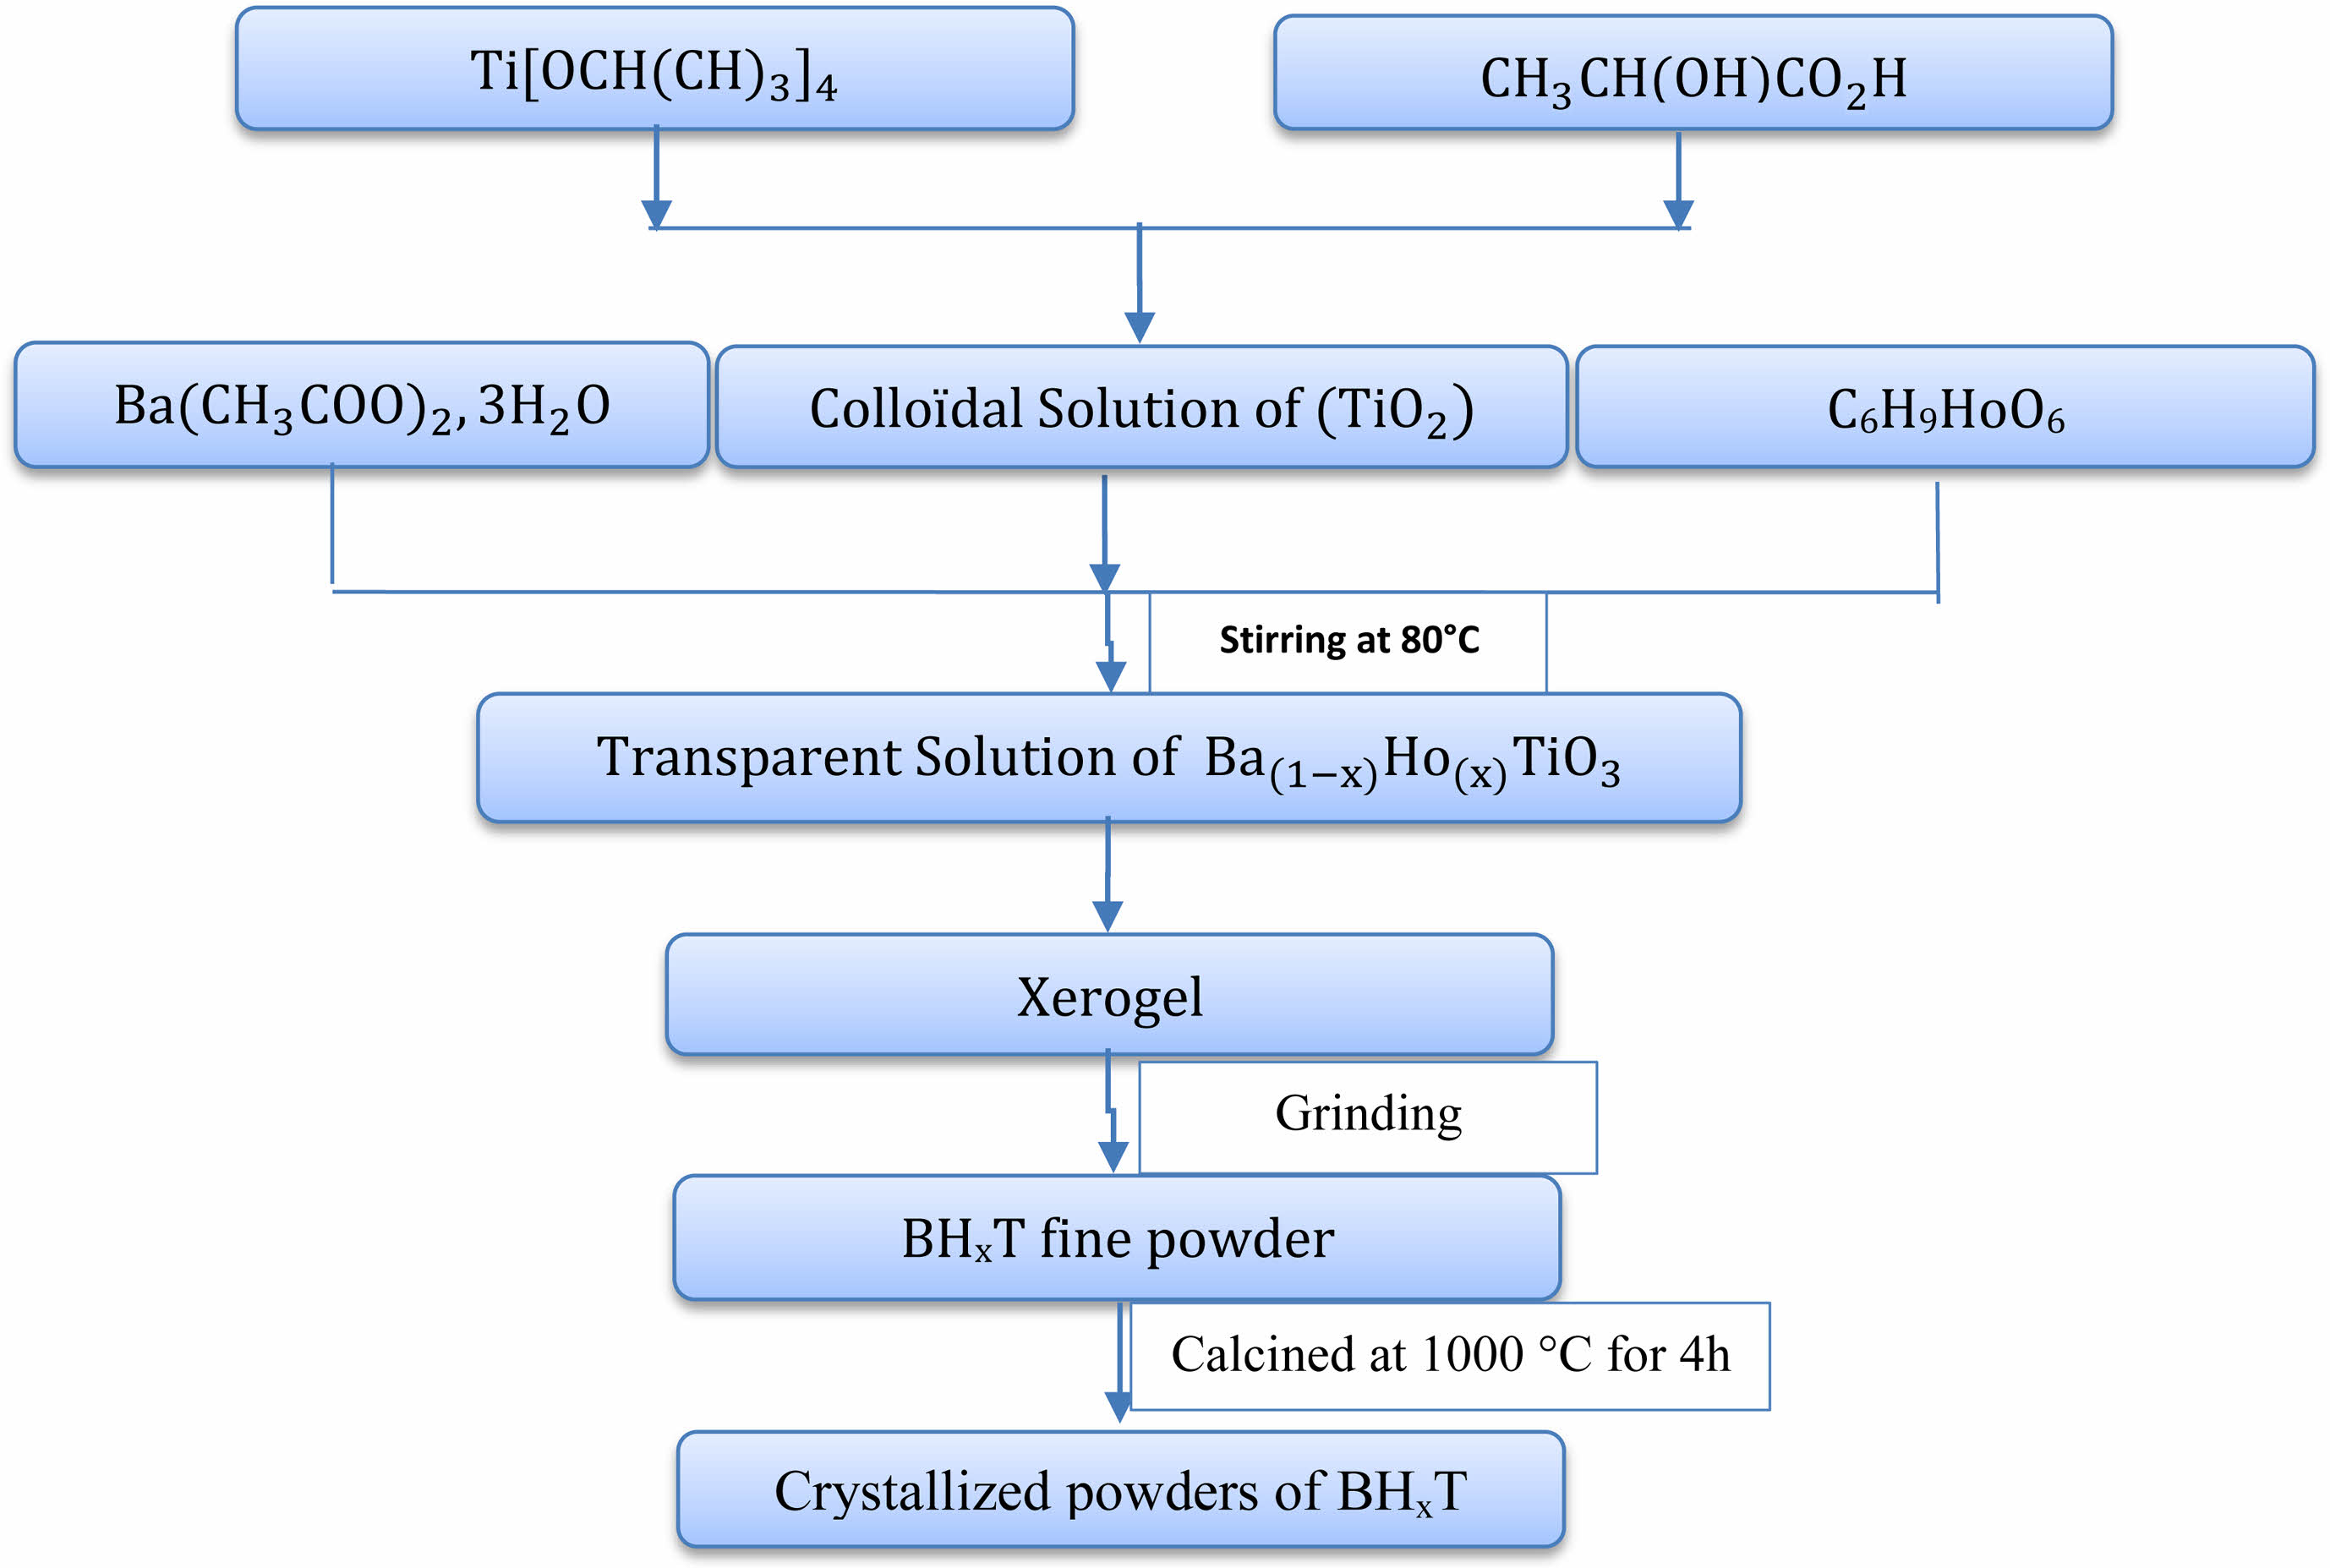
We produced Holmium-doped Barium Titanate powders, corresponding tothe chemical formula Ba1-xHoxTiO3 (BHxT) with x values ranging from 0 to 2%, through the sol-gel technique. Precursors for this process included Barium acetate trihydrate (Ba(CH3CO2)2∙3H2O), Holmium acetate (C6H9HoO6), and Titanium isopropoxide Ti[OCH(CH3)2]4. Lactic acid (CH3CH(OH)COOH) was used as a peptizing agent while acetic acid and distilled water served as solvents. The initial stage involved creating a TiO2 colloidal solution. This was done by adding Titanium isopropoxide to a lactic acid and H2O mixture while maintaining continuous stirring at 70 °C. A white precipitate formed after 72 hours, which then converted into a uniform, clear solution. In the subsequent stage, the colloidal solution was mixed with Holmium and Barium acetates in stoichiometric quantities. The resulting clear sol transformed into a translucent gel upon stirring at 80 °C. This gel was then dried at 80 °C and ground to produce fine powders. The resulting nanopowders underwent calcination in open air at a temperature of 1000 °C for 4 hours inside a programmable oven. A detailed illustration of the entire synthesis procedure is given in Fig. 1.
Characterization techniques
The structure of the BHxT samples was determined by X-ray diffraction (XRD) usingan X-PERT PRO diffractometer with Cu-k (alpha) radiation. Raman and Fourier transform infrared (FT-IR) spectroscopies were measured for all samples in backscattering and transmission geometries, respectively. Differential Thermal Analysis (DTA) and Thermogravimetric Analysis (TGA) were applied to the BH1T sample, which was selected as a representative sample from the BHxT series. Ultraviolet-visible (UV-vis) reflectance spectroscopy (Lambda 25 Perkin-Elmer) was used to investigate the optical properties of the synthesized BHxT samples.
|
Fig. 1 Flowchart of the sol-gel preparation of BHxT ceramicsamples. |
Thermal analysis
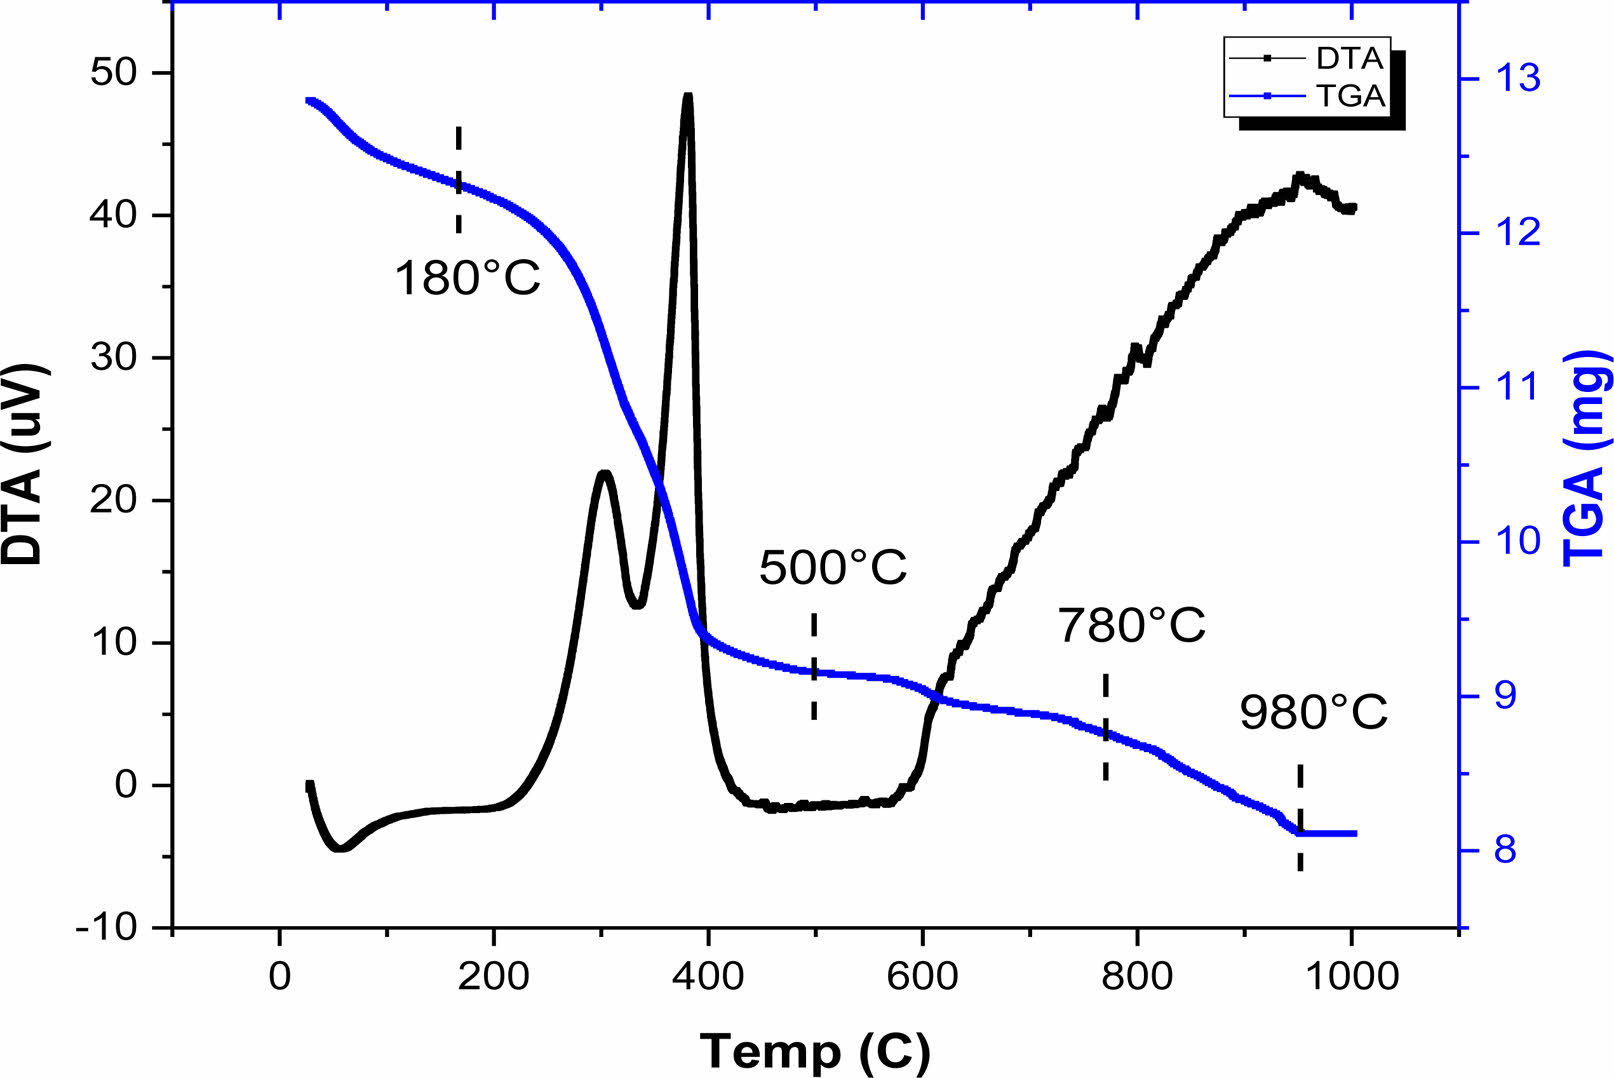
The thermal stability of the BH1T precursor-gel was examined using thermogravimetry (TG) and differential thermal analysis (DT), as illustrated in Fig. 2. The thermogravimetric assessment was carried out in an air atmosphere, with a heating rate of 5 °C per minute, and temperatures between 30 and 1000 °C. The TGA diagram (Fig. 2) suggests that the sample’s decomposition of the sample occurs across four distinct stages, over temperature intervals of 30-180 °C, 180-500 °C, 500-780 °C, and 780-980 °C. In the initial stage, we observed a mass reduction of 4.87%.This mass loss was accompanied by a small endothermic peak in the DTA curve around 56.56 °C and has been attributed to the elimination of water and excess lactic acid [19]. During the second phase, the TGA graph showed a substantial mass reduction of approximately 24%, which took place between 180 and 500 °C. This reduction can be attributed to the decomposition of acetate and isopropoxide groups associated with Titanium, along with the pyrolysis of the remaining organic compounds, leading to the elimination of CO2 and any residual H2O [20]. This mass loss was accompanied by two exothermics peaks on the DTA curve around 304 and 381 °C, respectively. In this temperature range, the gel is converted into a polymeras a result of the rearrangements of chemical bonds [21]. The third step occurs between 500 and 780 °C with a mass loss of 3%, which corresponds to the decomposition of small quantities of barium carbonate BaCO3, formed by the decomposition of barium acetate [19]. Before 600 °C, the decomposition of the metallic organic framework has started and amorphous TiO2 and BaOare produced from the metallic organic pyrolysis. A last part of mass loss ranging between (780-980 °C) was detected with a mass loss of 5%, accompanied by an exothermic peak in the DTA curve due to organic polymer degradation and the production of inorganic compounds (the formation of BHxT) [20]. The results indicate that the onset of crystallization occurs at 980 °C, which is relatively low compared to other studies using different synthesis techniques. This low temperature is attributed to the sol-gel preparation method [22] as compared to the conventional ceramic method [23, 24].
X-ray Diffraction study
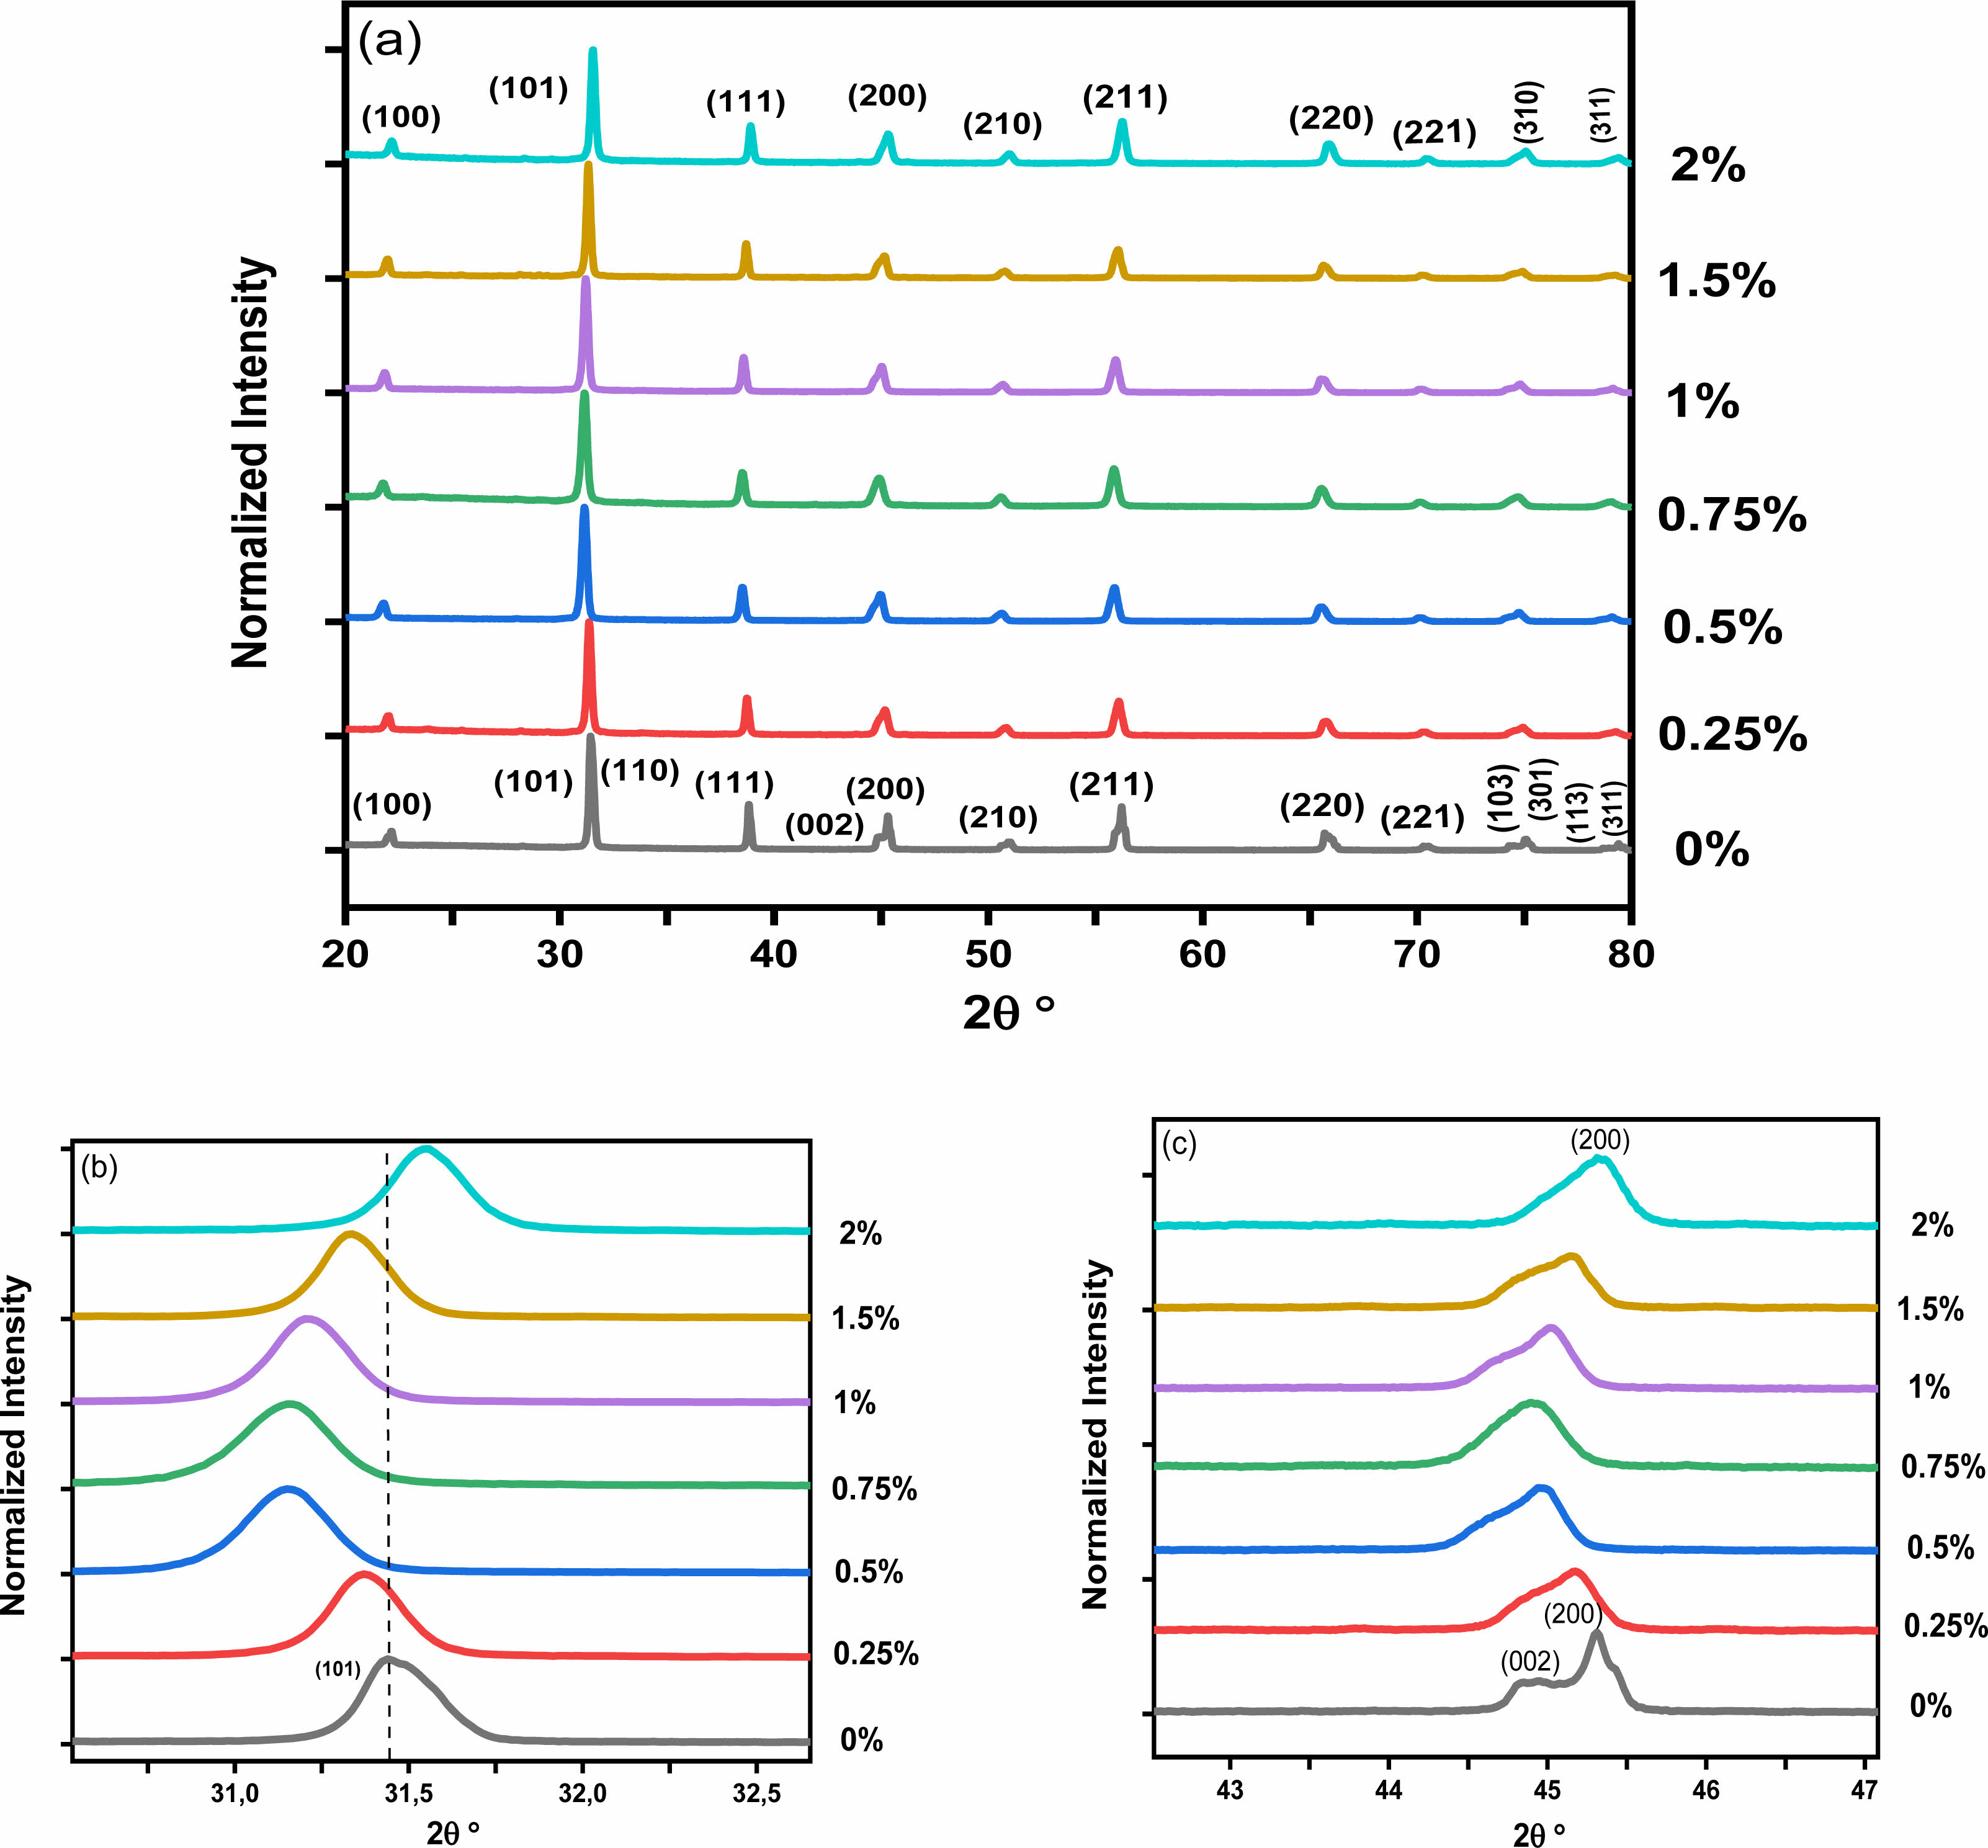
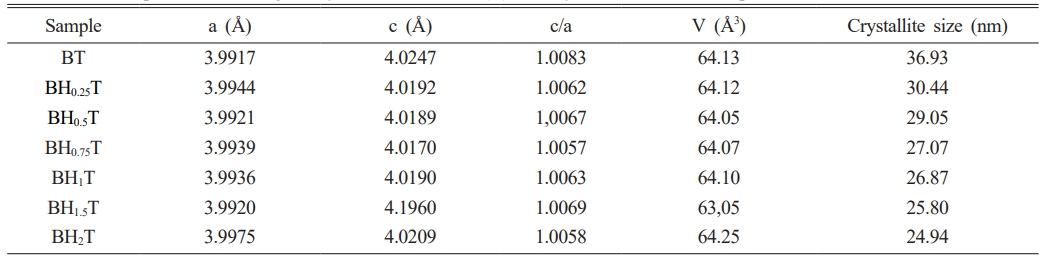
Fig. 3a presents the XRD spectra of the BHxT powder samples (x = 0, 0.25, 0.50, 0.75,1, 1.5 and 2%), calcined at 1000 °C for 4 hours. All these powders adopt the perovskite type structure without the presence of secondary phases, thus confirming the results observed by the thermal analysis (TGA-DTA). A zoom on the peak (101) (Fig. 3b) shows a displacement of its position towards lower 2θ angles for small concentrations x of Ho (x = 1.5), followed by a shift towards higher angles for x = 2%, which highlights the incorporation and effect of Ho on the change in the structure of BT. Moreover, the presence of the peaks (200) and (002) (Fig. 3c) for the pure sample (x = 0) are signature of the quadratic BT-phase [25]. Thus, the increase in holmium content causes a merging of both peaks, which therefore shows a subtleshift from the quadratic phase (pure BT) to the pseudo-cubic phase for the doped samples. These findings are consistent with those reported by Marjanovic et al. [13], where the BHxT samples (x = 0.01, 0.1, 0.5%) were prepared using the solid-state reaction method and sintered at 1380 °C for a duration of 4 hours. In a similar study, Chang et al. [26] concluded that the overall structure of the tetragonal lattice was unaffected by Ho doping up to x = 1.2%, and the diffraction peaks shifted slightly to lower values of 2θ as the holmium concentration increased. Secu et al. [18] observed that the composition Ba0.97Ho0.03TiO3, crystallized in the tetragonal BaTiO3 lattice, with the presence of traces of the second Ti-rich Ho2Ti2O7 phase. In fact, it is commonly recognized that when Ba is replaced by holmium, there is a consequent decrease in the unit cell volume. Conversely, when Titanium is substituted with Holmium, there is an increase in the unit cell volume. This is due to the ionic radius of Ho3+ (0.90 Å), which is smaller than that of Ba2+ (1.35 Å), larger than that of Ti4+ (0.64 Å). Table 1 shows the lattice parameters (a and c) along with the c/a ratio and unit cell volume of Ba1-xHoxTiO3 (x = 0, 0.25, 0.50, 0.75,1, 1.5 and 2%) calcined at 1000 °C-4 h.
The unit cell volume contracts with increasing Holmium concentrations up to 1.5%, then expands for the sample (BHxT, x = 2%). When Ho3+ cations occupy the Ti4+ sites (in an octahedral environnement), oxygen vacancies are generated to compensate for the charge imbalance, which is expected to result in the expansion of the cell volume due to an increase in cell parameters (a andc). Furthermore, if these oxygen vacancies primarily align along the c-axis, this leads to a significant reduction in the c lattice parameter, which could explain the changes in the lattice parameters and cell volume in relation to the Ho(x) content. Contrastingly, due to the differences in ionic radii between Ba2+ and Ho3+, the replacement of Ba sites with Ho3+ ions introduce compression of the unit cell. In addition, the behavior of in the quadracity, c/a, reveals that as the Holmium content increases, the tetragonality of the phase diminishes, signifying a shift from the quadratic phase to the pseudo-cubic phase.The size of the crystallites (D) in our BHxT samples was determined from the X-ray diffraction patterns, specifically the (101) peak, with the help of the Debye-Scherrer equation [27]: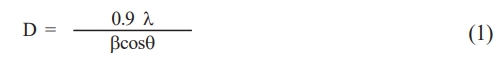
Where D represents the crystallite size, λ is the X-ray wavelength (1.5406 Å), θ is the diffraction angle and β is the Full Width at Half Maximum (FWHM) of the peak (101). The estimated values for the samples are given in Table 1. The latter shows that when the Holmuim concentration increases the crystallite size decreases.
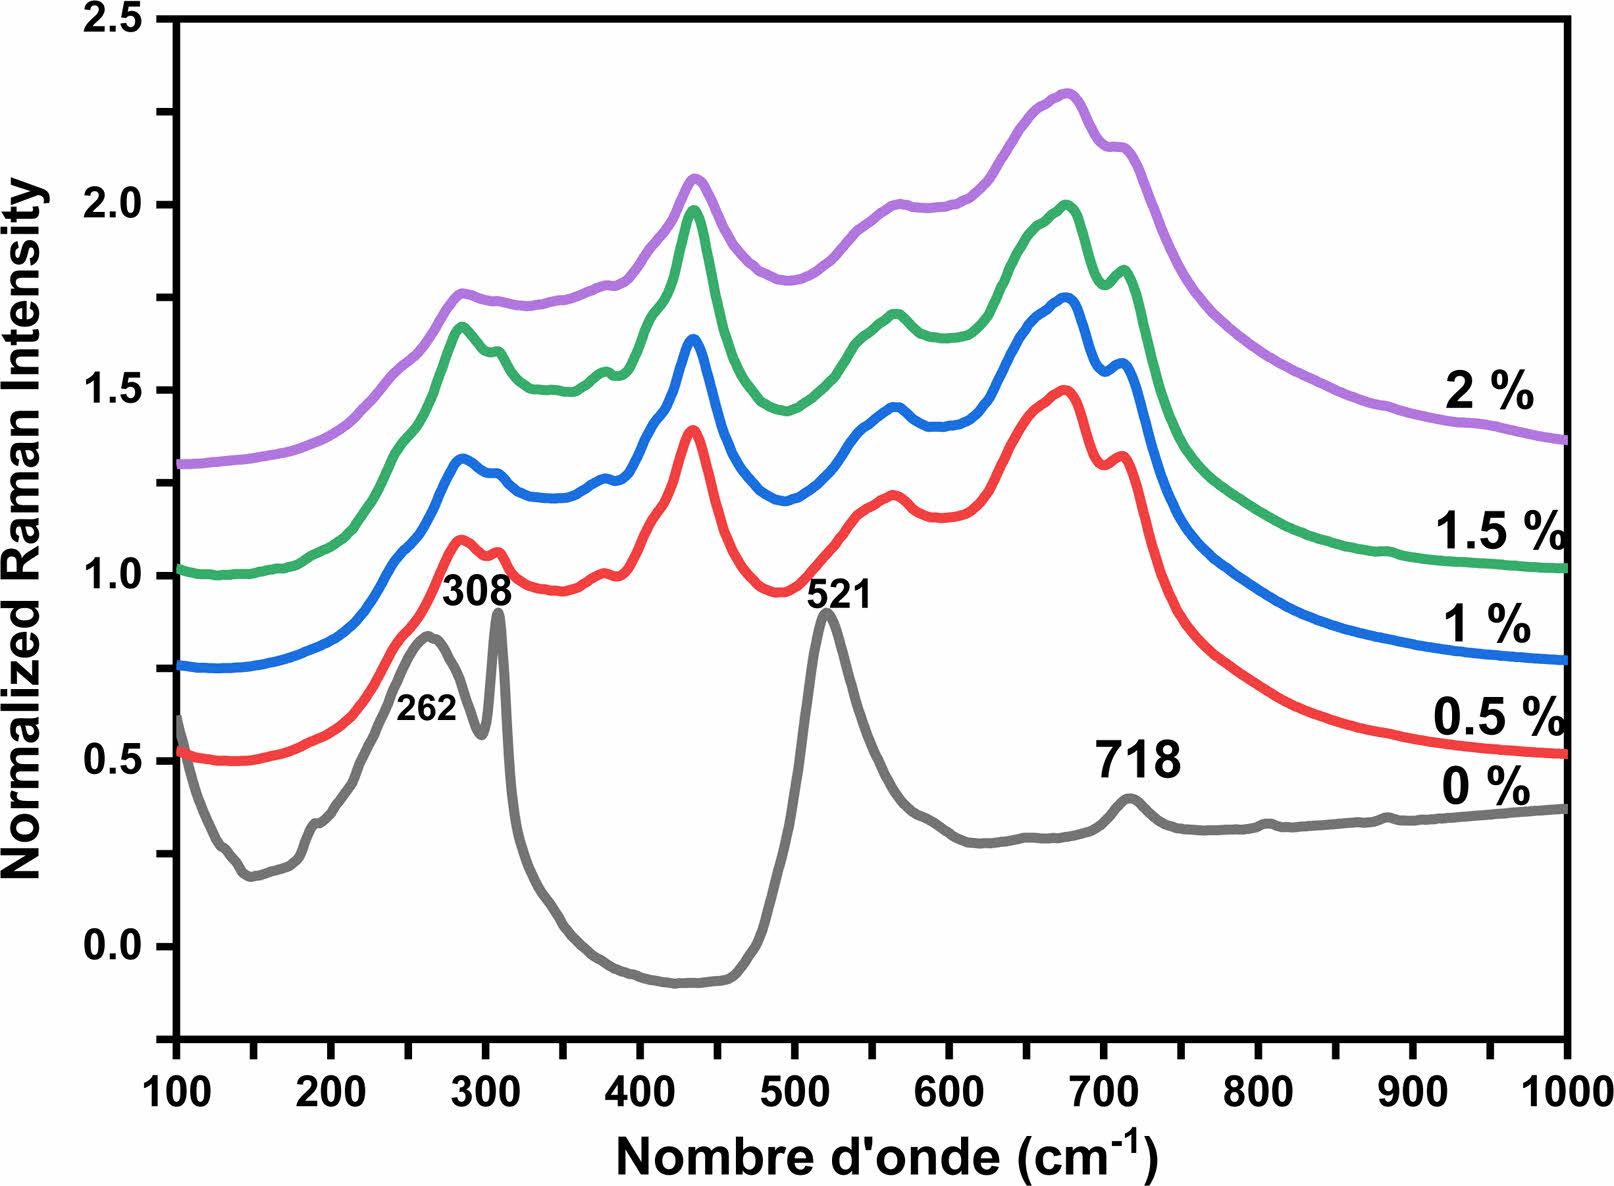
Raman spectroscopy was employed to investigate the structural phase in the Holmium-doped BaTiO3 samples. Fig. 4 illustrates the development of the Raman spectra at room temperature for the Ba1-xHoxTiO3 samples, plotted against the Holmium content within the frequency range of 100-1000 cm-1. The Raman active modes of the tetragonal BT crystal are attributed respectively to: [A1 (TO1)] mode at 189 cm-1, [A1 (TO2)] mode at 262 cm-1, a narrow peak at 308 cm-1 affected to B1 and E(TO3+LO2) modes, and a wide and asymmetrical band at 521 cm-1 attributed to A1(TO3) and E(TO4) modes. Another wide band (weak intensity) at 718 cm-1 associated with A1(LO3) and E(LO4) modes [28].
The intensity of the peak around 308 cm-1 decreases when the temperature increases (Fig. 4); this peak is expected to disappear when the phase undergoesa transition to the cubic system [29, 30]. Indeed, many researchers agree on the fact that the presence of the E(TO3) mode around 308 cm-1 which is related to the inactive mode of the cubic phase, is a signature of the tetragonal phase of the BT lattice [30, 31]. Also, the modes observed on our Raman spectra confirm that the pure BT sample presents the quadratic phase. These results agree with the XRD data (Fig. 3) on the presence of the quadratic phase of BT.
As the Ho concentration increases, the two peaks at 262 and 308 cm-1 in BT tend to merge into a single broad band at 285 cm-1 in BHxT. On the other hand, we notice a reduction in the intensity of the E(TO3+LO2)/B1 mode and the broadening of the E(LO4)/A1(LO3) band. These are the consequence of the presence of different types of cations and anions, namely Ba2+, Ho3+ , Ti4+, O2-, and confirm the disordered behavior of the phase, which indicates that the phase is pseudo-cubic. The results found are compatible with those reported by Garcia, et al. [32] and with the work reported on barium titanate ceramics doped with Sr [33].
The A1(TO2) mode, which describes the symmetric O-Ti-O vibrations, is distinguished by a resonance that fluctuates with the strong replacement of Ho at the perovskite structure B site. At 674 cm-1 , the A1(LO2)/E(LO3) modes reflect a high concentration of polar octahedra [TiO6] undergoing quadratic distortion. We observe a noticeable decrease in the A1(TO3) mode frequency from 521 cm-1 for non-doped BT (x = 0) down to 433 cm-1 for doped variations. This frequency for the A1 (TO3) mode is lower than that found in pure BT. It is well established that the A1 (TO3), A1 (LO3), and E (LO) modes are associated with the vibrations of the Ba-O band phonons. Given the ionic radii values of Ba2+ (1.35 Å), Ho3+ (0.90 Å), and Ti4+ (0.64 Å), replacing Ba2+ with Ho3+ results in a reduction of the cell volume, which subsequently shortens the Ba-O bond length and increases the force constant. In contrast, substitution at the Ti4+ sites leads to the opposite behavior. We thus deduce that the substitution of B sites with Ho is persistent across all samples, which aligns with the XRD analysis.
FT-IR analysis
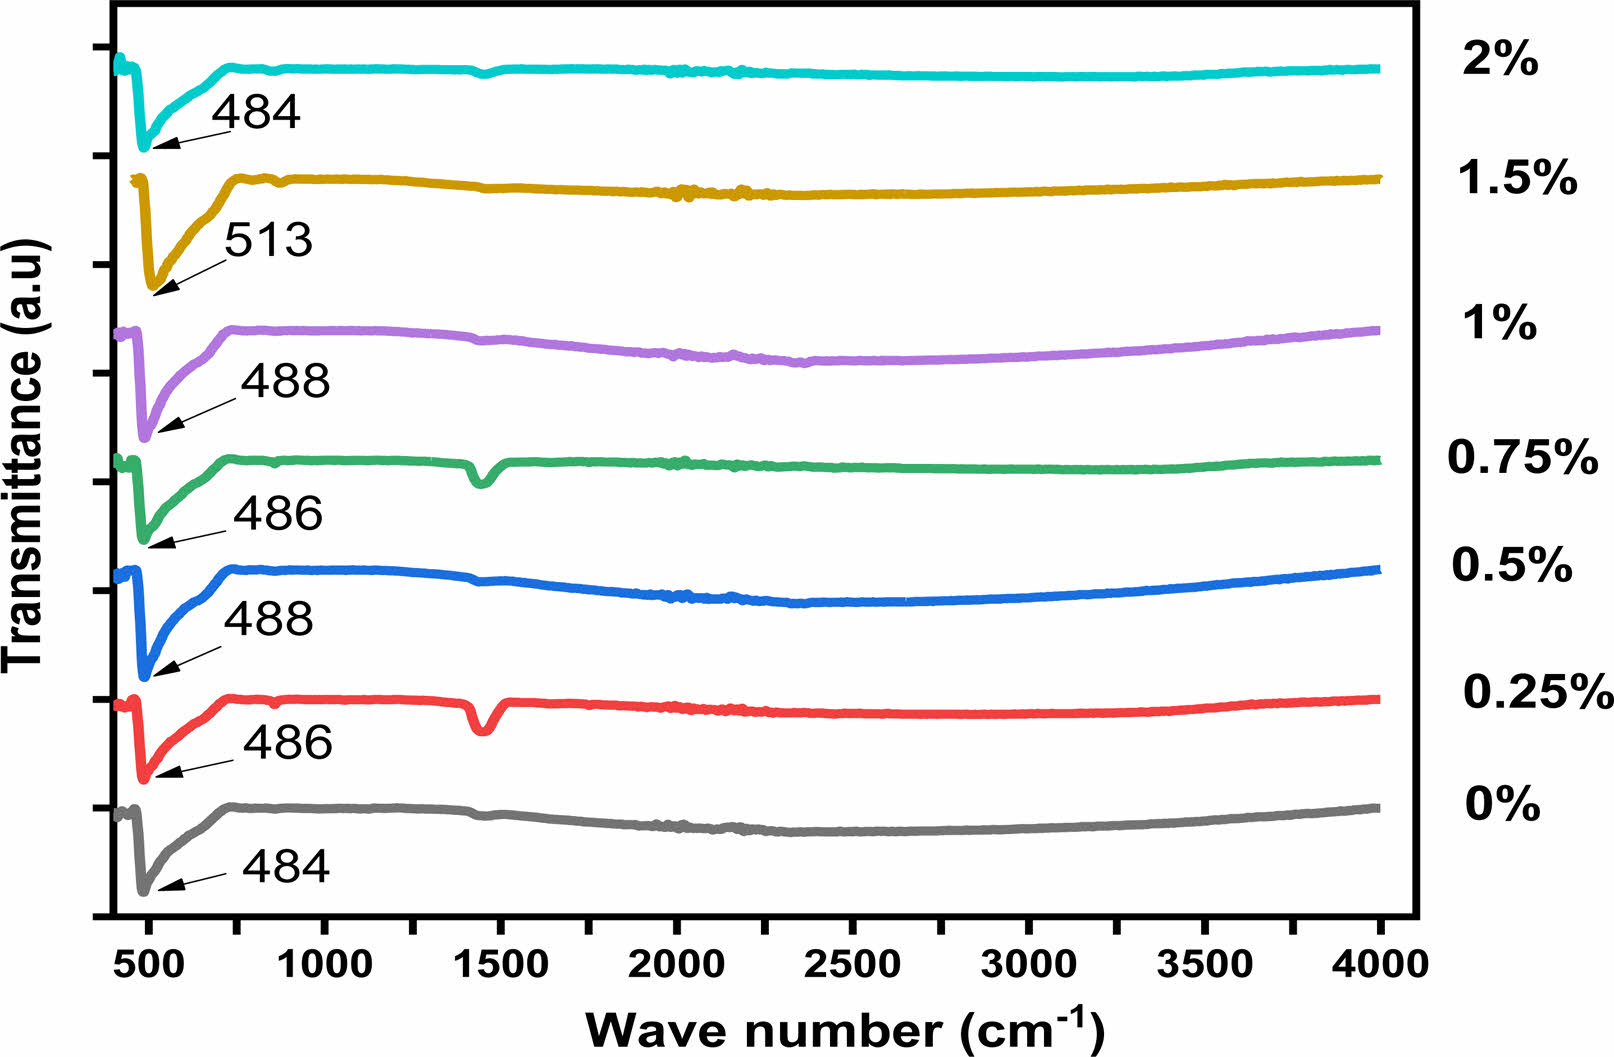
Fig. 5 shows the FTIR spectra of the Ba1-xHoxTiO3 powder samples for different concentrations in Ho. The IR spectra of BHxT powders can be split into two regions of absorption bands. The first, in the frequency range from 460 cm−1 to 730 cm−1, is marked by a wide band of vibrations, corresponding to vibrations of the TiO6 octahedra [34]. All samples show a Raman fingerprint of Ti-O bonds, which is a molecular signature of BaTiO3. The absorption peaks for the same mode of the compositions x = 0, 0.25, 0.50, 0.75,1, 1.5 and 2% were obtained at 484, 486, 488, 486, 488, 513 and 485 cm-1, respectively. The incorporation of holmium into the BaTiO3 crystal shifted the characteristic Ti–O peak to high energyvalues. Due to the small ionic radius of Ho3+ compared to Ba2+, the incorporation of Ho3+ at the A site in the crystal structure of BaTiO3 caused the crystal size to shrink. This affected the bond length between Ti4+ ions and O2- ions, leading to enhanced bond strength [35,36]. Additionally, the bands observed in the range of 1430 cm-1 to 1550 cm-1 might be due to symmetric and anti-symmetric vibrations (extensions of carboxyl groups attached to barium and/or titanium (COO−)) [37, 38]. The findings from the infrared spectra agree well with the revelations from the XRD analysis.
UV-Vis analysis
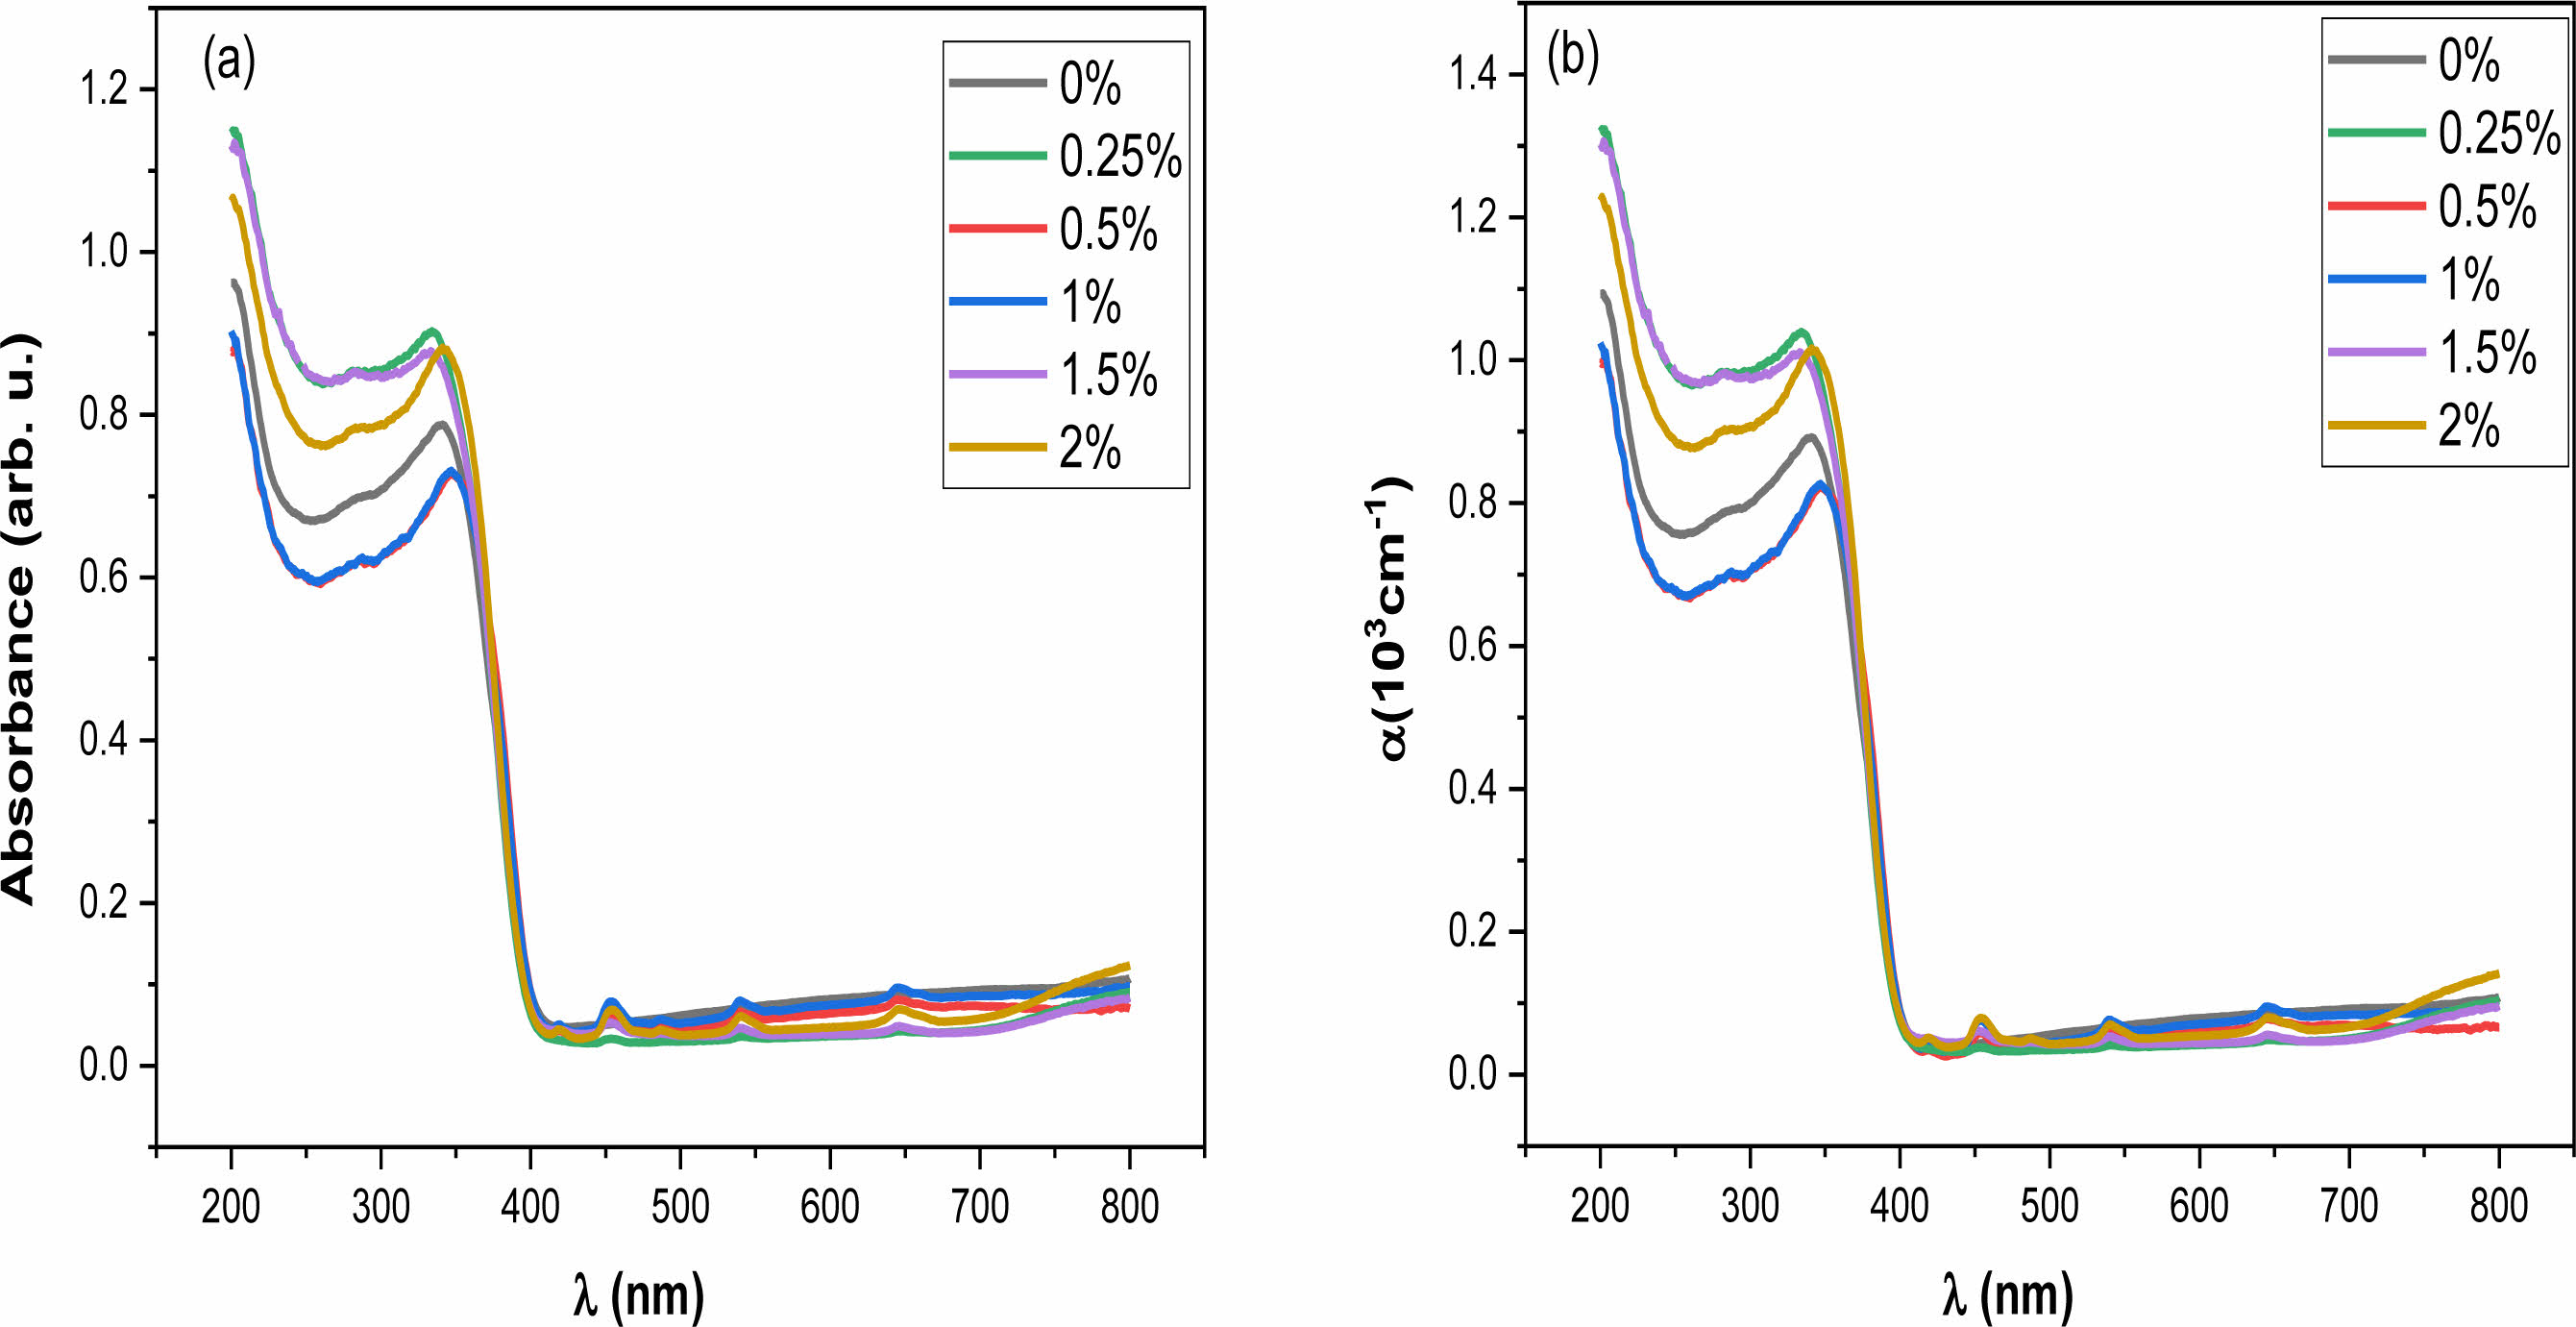
The absorption spectra of Ba1-xHoxTiO3 ceramics were determined using UV-vis spectroscopy (Fig. 6(a)). These spectra show an increase in the absorbance of all the samples from 250 to 400 nm which indicates that BHxT is an absorber in the ultraviolet range.
The absorption seems to decrease when the wavelength increases which results from low photon energy unable to eject electrons from the valence (VB) to the conduction band (CB). In the wavelength range of 260 to 410 nm, the absorbance increases sharply corresponding to the electron transfer from O-2p to Ti-3d orbitals [39].
The absorption coefficient (α) was calculated from the absorbance according to the following equation [40]:
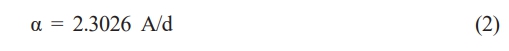
Where d = 2 mm the sample thickness. Fig. 6(b) shows the variation of α(λ) for different Ho contents. This parameter increases when λ decreases, this may be related to the existence of donor levels placed in the intermediate forbidden energy levels close to the conduction band, resulting in a displacement of the absorption edge towards low energies.
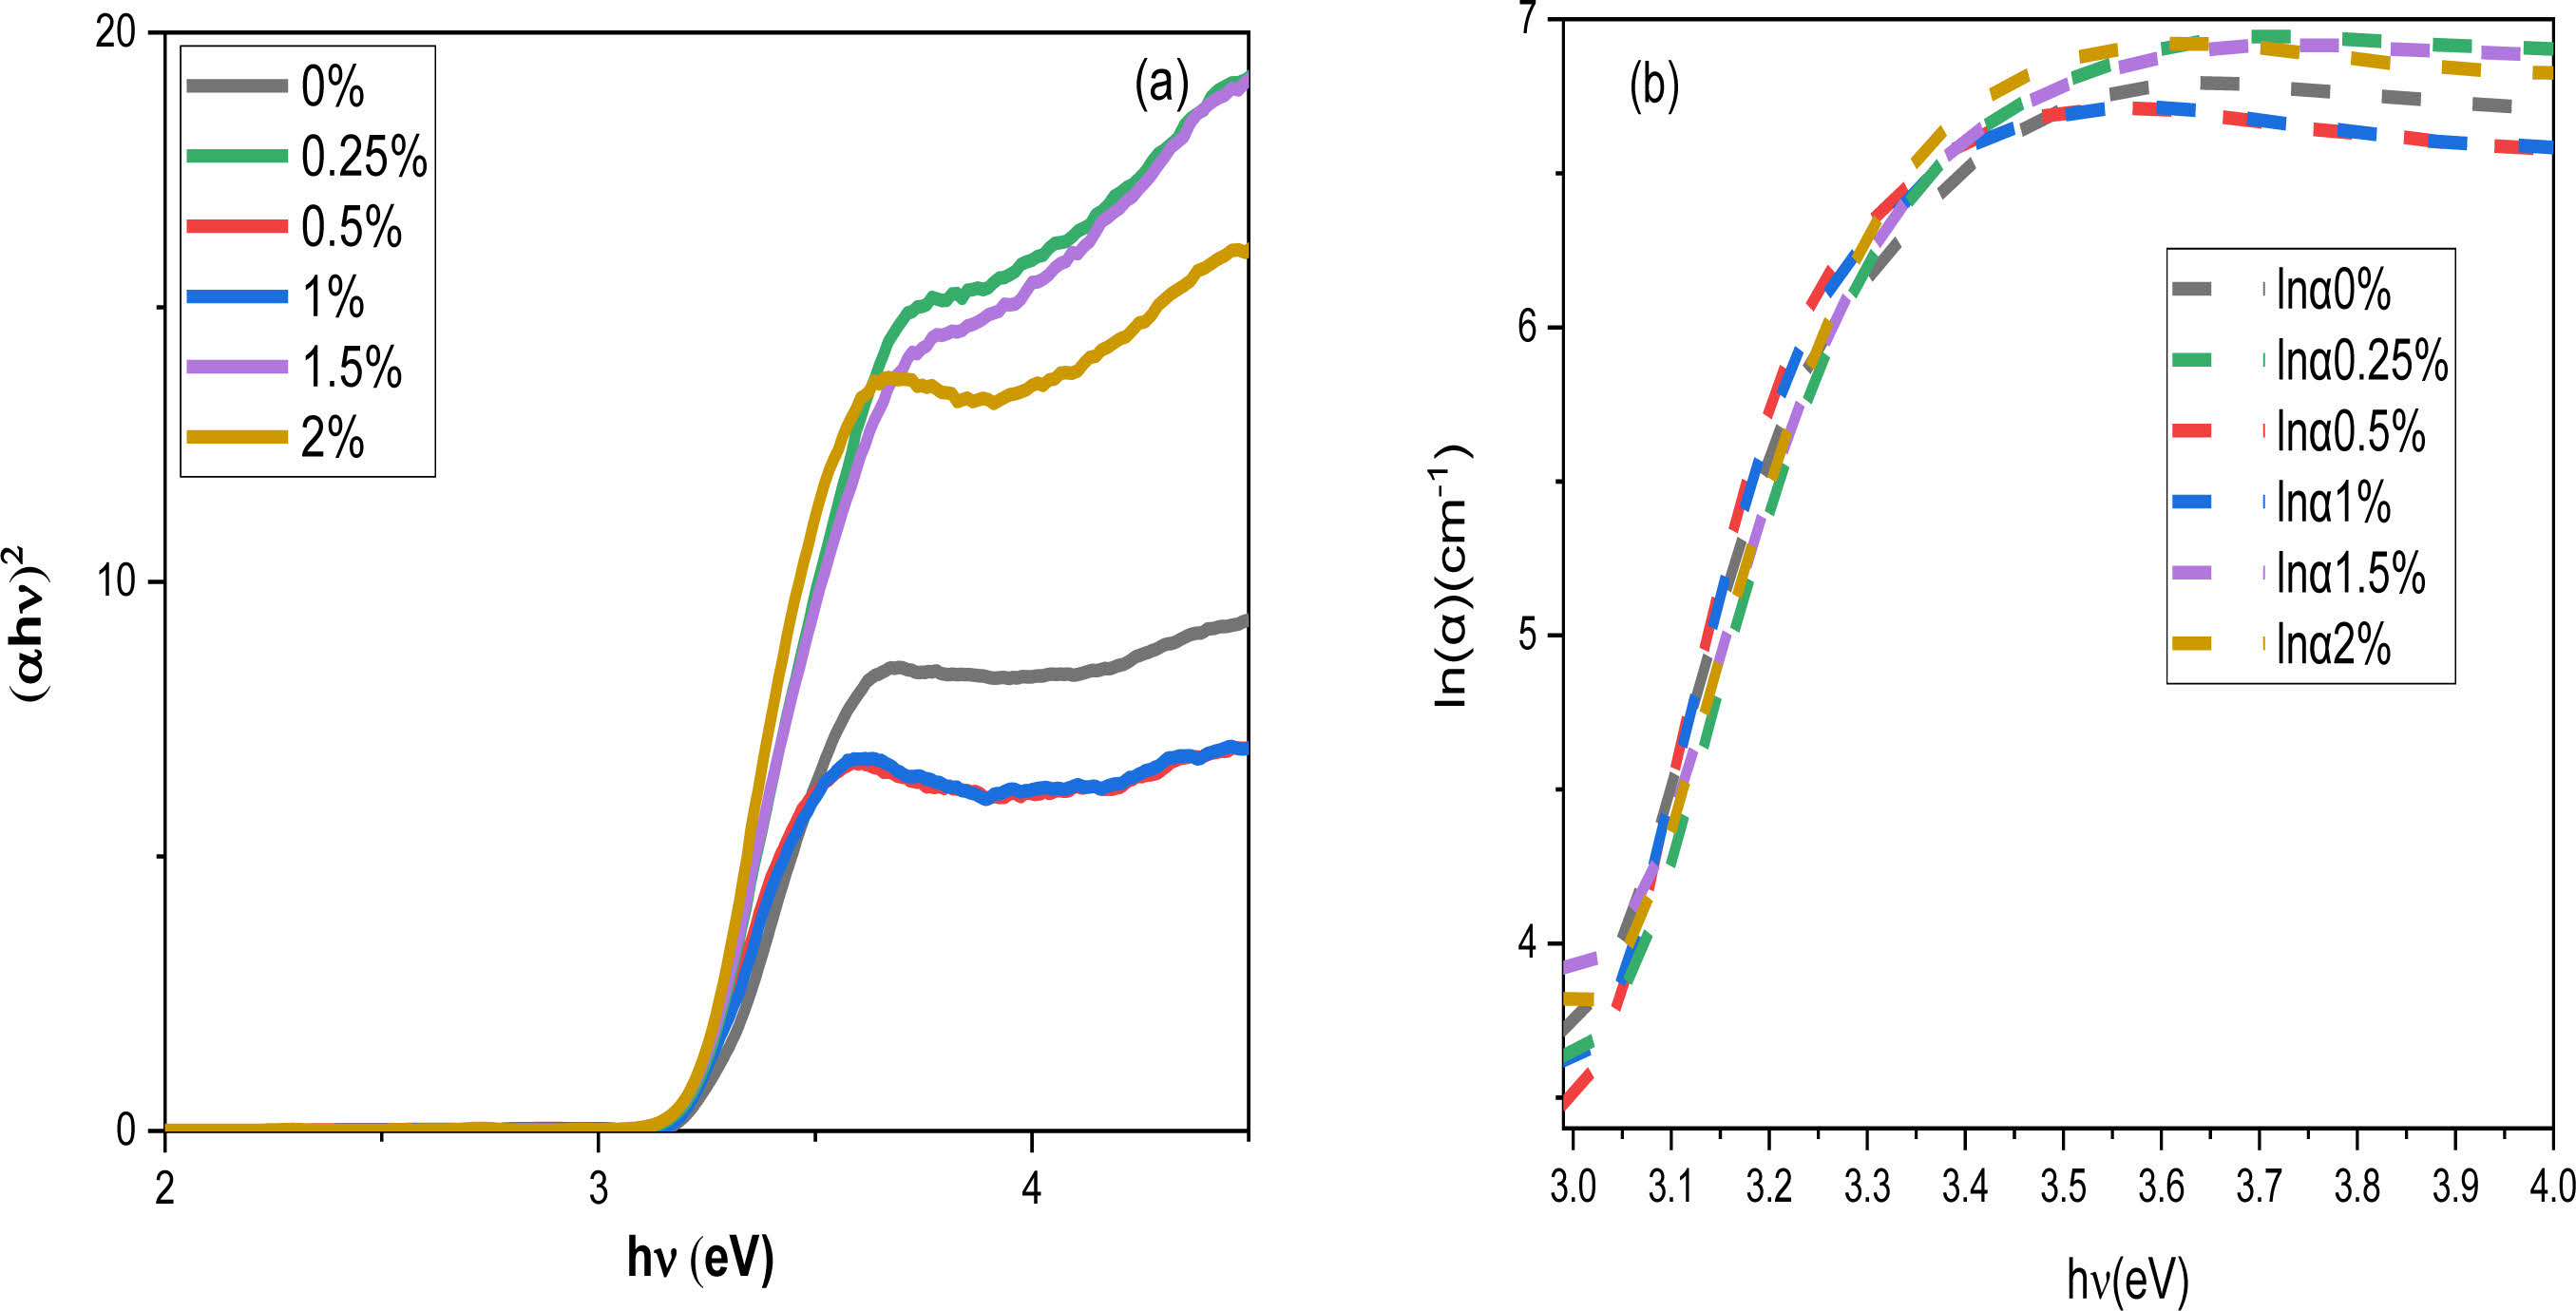
The energy of the optical bandgap (Eg) was estimated by the equation proposed by Wood and Tauc [41]:

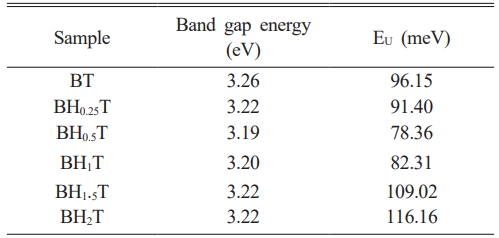
Where α, h, ν, Eg are the absorbance, the Planck constant, the frequency and the band gap energy, respectively. The exponent n is a constant related to the type of the electronic transitions (here this constant is taken as n = 2, assuming that the transition is direct [42]). The energy values Eg are calculated by extrapolating the linear part of the curve (Fig. 7(a)) and are found to be 3.26, 3.22, 3.19, 3.20, 3.22, 3.22eV for x = 0, 0.25, 0.50, 0.75,1, 1.5 and 2%, respectively (Table 2). The energy values of the bandgap for the doped samples are lower than those of the pure BaTiO3 value (3.26 eV).
The Eg values obtained for Ho-doped BaTiO3samples can be attributed to the structural disorder in the lattice as a consequence of cation vacancies in A and B sites, oxygen defects and distortions in the (TiO6) octahedron [43]. Such defects form localized bandgap states resulting in a narrowing of the forbidden band.
In this regard we can recall that the mechanism for band gap narrowing is due to the shifting of the valence band (VB) maximum and conduction band (CB) minimum of the materials. This experimentally observed narrowing occurs with increase in the dopant (impurity) concentration. This bandgap narrowing effect is ascribed to the emerging of the impurity band formed by the overlaped impurity states (creation of intermediate levels between the VB and CB).
Besides, the doping can change the nature of the optical properties of materials in the visible regime from opaque to transparent [44], and, as example, narrow gap semiconductors are the most important materials for the preparation of advanced modern infrared systems.The Urbach energy EU determines the band tail width of localized states into the gap and can be calculated using this formula [45]:
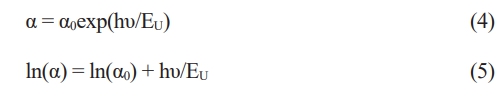
Whereα0 and (hν) correspond to a constant and the incident photon energy, respectively. Fig. 7 presents the evolution of ln(α) as a function of (hν) for all Ho-doped samples. The EU energy is obtained from the linear reciprocal slopes of the curves. Table 2 shows the obtained values. The Urbach energy decreases with increasing Ho content in BaTiO3 up to x = 0.5 and then increases. This increase suggests that Ho doping enhances structural disorder. Eg and EU behavior as a function of Ho has similarly been found in Yttrium-doped BaTiO3 materials [46].
The doping of BaTiO3 with rare earth ions (and in general with chemical elements) generates structural disorder (modification of the internal strain and internal electrical field, occurrence of vacancies, defects, etc.) and as a consequence the electric properties can be altered. We have performed dielectric measurements on our samples (article in preparation) and the results show an enhanced piezoelectric coefficient as revealed by other studies [47].
which makes these ceramics suitable for potential applications in multilayer piezoelectric devices). Moreover, the incorporation of Ho prevents the grain growth, improves the electromechanical properties and increases the temperature region where the tetragonal phase is stable.
However, other published studies showed that Ho may have the inverse effect [48].
|
Fig. 2 TGA and DTA curves of BH1T precursor gel. |
|
Fig. 3 (a) XRD patterns of Ho-doped BaTiO3 samples calcined at 1000 °C for 4 h, (b) displacement of the peaks(101), (c) and zoom on the peak (200). |
|
Fig. 4 Raman spectra of Ba1-xHoxTiO3 calcined at 1000 °C for 4 h. |
|
Fig. 5 FTIR spectra for BHxT powders calcined at 1000 °C for 4 h in air. |
|
Fig. 6 Variation (a) Absorbance and (b) absorption coefficient (α) with wavelength (λ) for the Ba1-xHoxTiO3 (x = 0, 0.25, 0.5, 1, 1.5 and 2%) samples. |
|
Fig. 7 Variation of (a) (αhυ) 2 and (b) ln(α) with the photon energy (hυ) for the Ba1-xHoxTiO3 (x = 0, 0.25, 0.5, 1, 1.5 and 2%) samples. |
|
Table 1 Lattice parameters, tetragonality, unit cell volume (V) and crystallite size of Ho-doped BaTiO3. |
Ba1-xHoxTiO3 ceramics (x = 0, 0.25, 0.50, 0.75,1, 1.5 and 2%) were successfully prepared using the sol-gel process, and their structural and optical properties investigated. The structural analysis (DRX, Raman and FTIR) revealed that all powders crystallized in a pure perovskite structure, with no secondary phases present, and a transition from the quadratic phase (pure BT) to the pseudo-cubic phase was observed under doping. From the same analysis, it was also observed that the Ho3+ ion can replace both Ti4+ and Ba2+ ones.This result was confirmed by Raman and Fourier transform infrared (FT-IR) analyses. For optical measurements, the values of the bandgap energies for the doped ceramics are lower than those of the value in the pure case, and it was shown that Ho doping increases the structural disorder within the BT lattice, giving rise in particular to a narrowing of the forbidden gap.
- 1. M.B. Smith, K. Page, T. Siegrist, P.L. Redmond, E.C. Walter, R. Seshadri, L.E. Brus, and M.L. Steigerwald, J. Am. Chem. Soc. 130[22] (2008) 6955-6963.
-

- 2. Z. Chao, W. Chun-Lei, L. Ji-Chao, and Y. Kun, J. Chin. Phys. 16[25] (2007)1422-1428.
-
- 3. B.I. Lee, P. Badheka, D.H. Yoon, V. Magadala, and M. Wang, J. Ceram. Proc. Res. 5[2] (2004) 127-132.
- 4. S. Sato, Y. Nakano, A. Sato and T. Nomura, J. Eur. Ceram. 19[6-7] (1999) 1061-1065.
-
- 5. W.H. Lee, W.A. Groen, H. Schreinemacher, and D. Hennings, J. Electroceram. 5 (2000) 31-36.
-
- 6. D. Yoon, J. Ceram. Proc. Res. 7[4] (2006) 343-354.
- 7. D.H. Yoon and B.I. Lee, J. Ceram. Proc. Res. 3[2] (2002) 41-47.
- 8. L.A. Xue, Y. Chen, and R.J. Brook, J. Mater. Sci. Lett. 7 (1988) 1163-1165.
-
- 9. Y. Tsur, A. Hitomi, I. Scrymgeour, and C.A. Randall, Jpn. J. Appl. Phys. 40[1R] (2001) 255-258.
-
- 10. D.Y. Lu, X.L. Gao, and S. Wang, J. Results Phys. 12 (2019) 585-591.
-
- 11. M. Vega, I.R. Martin, and J. Llanos, J. Alloys Compd. 806 (2019) 1146-1152.
-
- 12. J. Jeong, E.J. Lee, and Y.H. Han, Jpn J Appl Phys. 44[6R] (2005) 4047.
-
- 13. M. Marjanović, D. Dimitrijević, V. Paunović, and Z. Prijić, SJEE. 11[1] (2014) 35-46.
-
- 14. Y. Liu and A.R. West, J. Eur. Ceram. Soc. 29[15] (2009) 3249-3257.
-
- 15. A. Jain, Y.G. Wang, and L.N. Shi, J. Alloys Compd. (2022) 167066.
-
- 16. L. Chen, F. Li, B. Gao, C. Zhou, J. Wu, S. Deng, H. Liu, H. Qi, and J. Chen, J. Chem. Eng. 452 (2023) 139222.
-
- 17. H. Yuan, L. Li, H. Hong, Z. Ying, X. Zheng, L. Zhang, F. Wen, Z. Xuc, W. Wu, and G. Wang, J. Ceram. Int. 47[22] (2021) 31349-31356.
-
- 18. M. Secu, M. Cernea, C.E. Secu, and B.S. Vasile, J. Nanopart. Res. 13 (2011) 3123-3128.
-
- 19. C.A. Stanciu, M. Cernea, E.C. Secu, G. Aldica, P. Ganea, and R. Trusca, J. Alloys Compd. 706 (2017) 538-545.
-
- 20. A. Salhi, S.E. Sayouri, B. Jaber, and L.H. Omari, J. Appl. Phys. A. 124 (2018) 1-9.
-
- 21. A. Mahmood, A. Naeem, Y. Iqbal, T. Mahmood, and A. Ullah, J. Mater. Sci.: Mater. Electron. 26 (2015) 5635-5644.
-
- 22. D.Y. Lu and D. X. Guan, J. Sci. Rep. 7[1] (2017) 6125.
- 23. A. Al-Shahrani, and S. Abboudy, J. Phys. Chem. Solids. 61[6] (2000) 955-959.
-
- 24. J. Xue, J. Wang, and D. Wan, J. Am. Ceram. Soc. 83 (2000) 232-234.
-
- 25. A. Moutaouaffiq, M. Belhajji, A. Rjeb, S. Sayouri, D.S. Houssaini, and T.D. Lamcharfi, J. Ceram. Process. Res. 23[5] (2022) 570-582.
-
- 26. F. Chang, T. Li, Y. Ge, Z. Chen, Z. Liu, and X. Jing, J. Mater. Sci. 42 (2007) 7109-7115.
-
- 27. U. Holzwarth and N. Gibson, J . Nat. Nanotechnol. 6[9](2011) 534-534.
-
- 28. A. Salhi, S. Sayouri, L. Hajji, and T. Lamcharfi, J. Ceram. Process. Res. 17[12] (2016) 1236-1242.
-
- 29. A. Scalabrin, A.S. Chaves, D.S. Shim, and S.P.S. Porto, J. Phys Status Solidi B. 79[2] (1977) 731-742.
-
- 30. T. Al-Naboulsia, M. Boulos, C. Tenailleau, P. Dufour, M. Zakhour, and S. Guillemet-Fritsch, J. Ceram. Process. Res. 17[8] (2016) 870-875.
-
- 31. F. Krimech, S. Sayouri, and T. Lamcharfi, J. Ceram. Process. Res. 18[7] (2017) 536-542.
-
- 32. F.G. Garcia, C.R. Foschini, J.A. Varela, E. Longo, F. Moura, and A.Z. Simões, J. Process. Appl. Ceram. 5 (2011) 205-213.
-
- 33. A.Ghandouri, S. Sayouri, T. Lamcharfi, and L. Hajji, J. Ceram. Process. Res. 19[2] (2018) 154-170.
-
- 34. R. Bahloul, S. Sayouri, K. Limame, M.M. Yahyaoui, B. Jaber, and L. Laanab, J. Ceram. Process. Res. 18[2] (2017) 329-335.
-
- 35. M. Ganguly, S.K. Rout, C.W. Ahn, I.W. Kim, and M. Kar, J. Ceram. Int. 39[8] (2013) 9511-9524.
-
- 36. W. Wang, L. Cao, W. Liu, G. Su, and W. Zhang, J. Ceram. Int. 39[6] (2013) 7127-7134.
-
- 37. S. Kudłacik-Kramarczyk, A. Drabczyk, M. Głąb, P. Dulian, R. Bogucki, K. Miernikand, and B. Tyliszczak, J. Mater. 13[15] (2020) 3275.
-
- 38. E. Sanchez, T. Lopez, R. Gomea, A. Morales, and O. Novaro, J. Solid State Chem. 122 (1996) 309-314.
-
- 39. J.G. Cherian, T. Birol, N.C. Harms, B. Gao, S.-W. Cheong, D. Vanderbilt, and J.L. Musfeldt, J. Appl. Phys. Lett. 108[26] (2016) 262901.
-
- 40. M. Shkir, A. Khan, A.A. Ansari, A.M. El-Toni, I.S. Yahia, M. Ajmal Khan, H. Algarni, and S. AlFaify, Vacuum. 173 (2020) 109122.
-
- 41. D.L. Wood and J. Tauc, J. Phys.Rev. B. 5[8] (1972) 3144.
-
- 42. E.A. Davis and N.F. Mott, J. Philos. Mag. 22[179] (1970) 0903-0922.
-
- 43. F. Es-saddik, K. Limame, S. Sayouri, and T. Lamcharfi, J. Mater. Sci.: Mater. Electron. 30 (2018) 1821-1831.
-
- 44. J. Carreaud, J.R. Duclere, Y. Launay, N. Tessier-Doyen, D.S. Smith, M. Allix, V. Coudercc, G. Delaizir, and S. Chenu, J. Eur. Ceram. 43[11] (2023) 4976-4984.
-
- 45. F. Urbach, Phys. Rev. 92[5] (1953) 1324.
-
- 46. A. Nfissi, Y. Ababou, M. Belhajji, S. Sayouri, L. Hajji, and M.N. Bennani, J. Opt. Mater. 122 (2021) 111708.
-
- 47. Y. Pan, X. Bai, J. Feng, L. Huang, G. Li, and Y. Chen, J. Alloys Compd. 918 (2022) 165582.
-
- 48. A. Khandelwal, R. Gupta, R. Laishram, and K.C. Singh, J. Ceram. Int. 45[8] (2019) 10371-10379.
-
 This Article
-
2023; 24(6): 954-962
Published on Dec 31, 2023
- 10.36410/jcpr.2023.24.6.954
- Received on Aug 17, 2023
- Revised on Oct 14, 2023
- Accepted on Oct 15, 2023
Services
Shared
Correspondence to
- Salaheddine Sayour
-
LPAIS, Faculty of Sciences-DM, University of Sidi Mohamed Ben Abdellah, B.P. 1796 Fez-Atlas, Morocco
Tel : +212 6 73 78 52 88 Fax: +212 5 35 73 33 49 - E-mail: ssayouri@gmail.com
Clean-Energy Research Institute(CRI), Hanyang University, 222, Wangsimni-ro, Seongdong-gu, Seoul, 04763, Korea
E-mail: jcpr@hanyang.ac.kr