


- Analysis of the surface characteristics of SiO2-Al2O3-CaO-ZnO-Na2O-based glass at heat-treatment temperature using Raman spectroscopy
Dongchan Kim and Seunggu Kang*
Department of Advanced Material Engineering, Kyonggi University, Suwon, Korea
This article is an open access article distributed under the terms of the Creative Commons Attribution Non-Commercial License (http://creativecommons.org/licenses/by-nc/4.0) which permits unrestricted non-commercial use, distribution, and reproduction in any medium, provided the original work is properly cited.
In this study, the change in surface properties based on the heat-treatment temperature of SiO2-Al2O3-CaO-ZnO-Na2O system glass was analyzed using Raman spectroscopy. Viscosity prediction for each temperature was also conducted through the Vogel–Fulcher–Tammann model using differential thermal analysis and the temperatures (Tg, TS, T1/2) representing the thermal properties observed under hot-stage microscopy. The surface roughness, hardness, and glossiness of the glass were analyzed according to the heat-treatment temperature. Raman spectra measured at 800-1300 cm-1 were deconvolved to observe the area and peak position changes of Qn (n = 1-4) units in terms of melt viscosity and polymerization, and the study confirmed that the polymerization degree of the heat treated glass was the lowest at 1120 °C. Results showed that the average roughness of the glass heat-treated at 1120 ℃ for 90 min was the lowest (53.07 nm), and the hardness was the highest at 6.73 GPa
Keywords: Glaze, Sintering temperature, Raman spectroscopy, Surface roughness, Micro-Vickers hardness.
Glass is used as a surface-coating agent for ceramic substrates and is composed of various types of oxides while exhibiting various characteristics depending on the molar ratio of the oxides [1-5]. Glass has the unique advantage of being able to improve the physical and chemical properties (mechanical strength, chemical resistance, surface roughness, etc.) of the product surface at a relatively low cost [6-10].
In the case of glass, the melt viscosity changes according to changes in the heat-treatment temperature. Predicting the heat-treatment temperature that exhibits the optimal physical properties based on the composition of the glass is a major factor in designing the glass manufacturing process or choosing the application field [11-13]. If heat treatment is performed under conditions of high melt viscosity, gas or water vapor generated inside the glass cannot escape smoothly, and this can lead to the formation of pores on the glass surface. This inability of gas or water vapor to escape is the main cause of the deterioration of physical properties such as the gloss and mechanical strength of the glass surface [14, 15]. In the case of silicate glass, changes in viscosity depend on how well the silica tetrahedrons that form the glass network adhere to one another, as this affects the internal structure and physical properties of the glass [16-18]. Analytical methods for predicting the viscosity of glass based on temperature have been studied using various models, with the most common being the Vogel–Fulcher–Tammann (VFT) model [19-21]. To derive the VFT model, it can be calculated using the following equation after the specific temperatures (glass-transition, softening, and half-sphere) of the glass have been identified through thermophysical property analysis [22, 23].
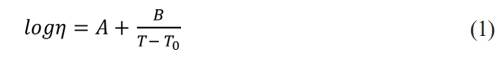
Constants A, B, and T0 used in (1) can be obtained using the following Eqs. (2)-(4), respectively, where T1, T2, and T3 denote the glass-transition (log η1 = 12), softening (log η2 = 9.25), and half-sphere (log η3 = 3.5) temperatures, respectively [24].
Wang et al. [25] doped soda-lime silicate-based glass using various rare earth oxides and analyzed the changes in Raman spectra observed in the range of 950-1200 cm-1. Accordingly, the authors predicted the degree of polymerization and viscosity of the glass network by quantifying the non-bridging oxygen fraction. They determined that the use of rare earth elements led to a decrease in viscosity and melting temperature in the studied composition. Cheng et al. [26] analyzed the melt viscosity of glass according to changes in the Al/Si ratio using Raman spectroscopy. When deconvolution of the wide Raman spectra was observed at 800 to 1300 cm-1, it could be expressed as Qn (n = 0-4) units related to the Si-O bending structure, and the Al/Si ratio increased. The authors reported that not only the viscosity of the melt increased during melting but also correlated with the changes in the Q2 and Q4 units analyzed in the Raman spectra.
In this study, changes in the physical properties of a glass surface based on variations in sintering temperature were observed during heat treatment in the commercial heat-treatment temperature range of 1040-1200 ℃ for SiO2-Al2O3-CaO-ZnO-Na2O system glass used as a glaze on the surface of a clay substrate. In addition, using the data of the Qn unit related to the Si-O band structure derived from the Raman spectra analysis, this study predicted the change in melt viscosity and identified the correlation between the surface physical properties.
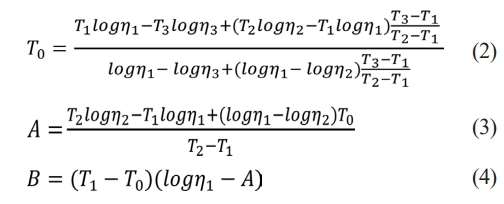
This study used SiO2-Al2O3-CaO-ZnO-Na2O system glass from the “H” company in Korea, with its chemical composition presented in Table 1. Following crushing and sieving (< 325 mesh), the raw material was coated on a ceramic substrate with a thickness of 200 mm using a doctor blade. The specimen was prepared by drying at 100 ℃ for 4 h, heating at 3 ℃/min, and holding at 1040, 1080, 1120, and 1200 ℃ for 90 min, respectively.
The particle size of the raw glass powder was determined using a particle size analyzer (Mastersizer 3000, Marvern Panalytical, UK). X-ray diffraction (XRD; MiniFlex Ⅱ, Rigaku Co., Japan) was used to analyze the crystal phase of the heat-treated specimens, and thermogravimetry/differential thermal analysis (TG/DTA) was conducted using DTA (STA 409 PC-QMS 403C, Netzsch, Germany) to analyze the thermal properties. The microstructures of the heat-treated specimens were observed using field-emission scanning electron microscopy (FE-SEM; Nova NanoSEM200, FEI, USA) and optical microscopy (LV150N, Nikon, Japan). The observed pore size and distribution were analyzed using the “Image J” program. The surface roughness and hardness of the heat-treated specimens were measured using a surface-roughness measuring instrument (DektakXT, Bruker Co., USA) and a micro-Vickers hardness tester (HM-124, Mitutoyo, Japan), respectively. Hardness analysis was performed at 4.9 N/10 s. The surface gloss of the heat-treated specimens was measured using a gloss meter (Novo-Gloss Trio, Rhopoint Instrument, UK) at reflection angles of 20°, 60°, and 85° according to the ISO-2813:2014 standard. Using optical dilatometry (Misura 3.32, Expert systems solution, Italy) and hot-stage microscopy (HSM; Misura 3.32, Expert systems solution, Italy), we observed an increase in temperature of 3 ℃/min in a temperature range of room temperature RT-1300 ℃. Changes in glass thermal behavior were observed. Raman spectroscopy (LabRAM Soleil, HORIBA, Japan) was used to analyze the structural changes in the glass surface according to the heat-treatment temperature at an excitation wavelength of 532 nm.
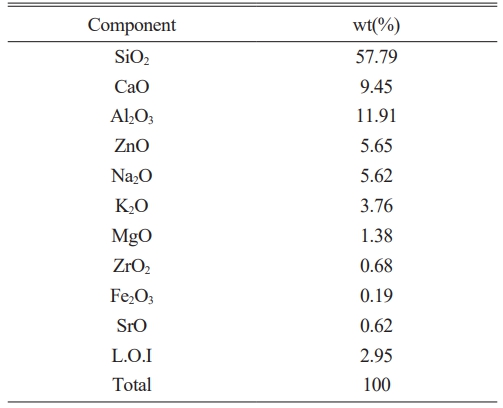
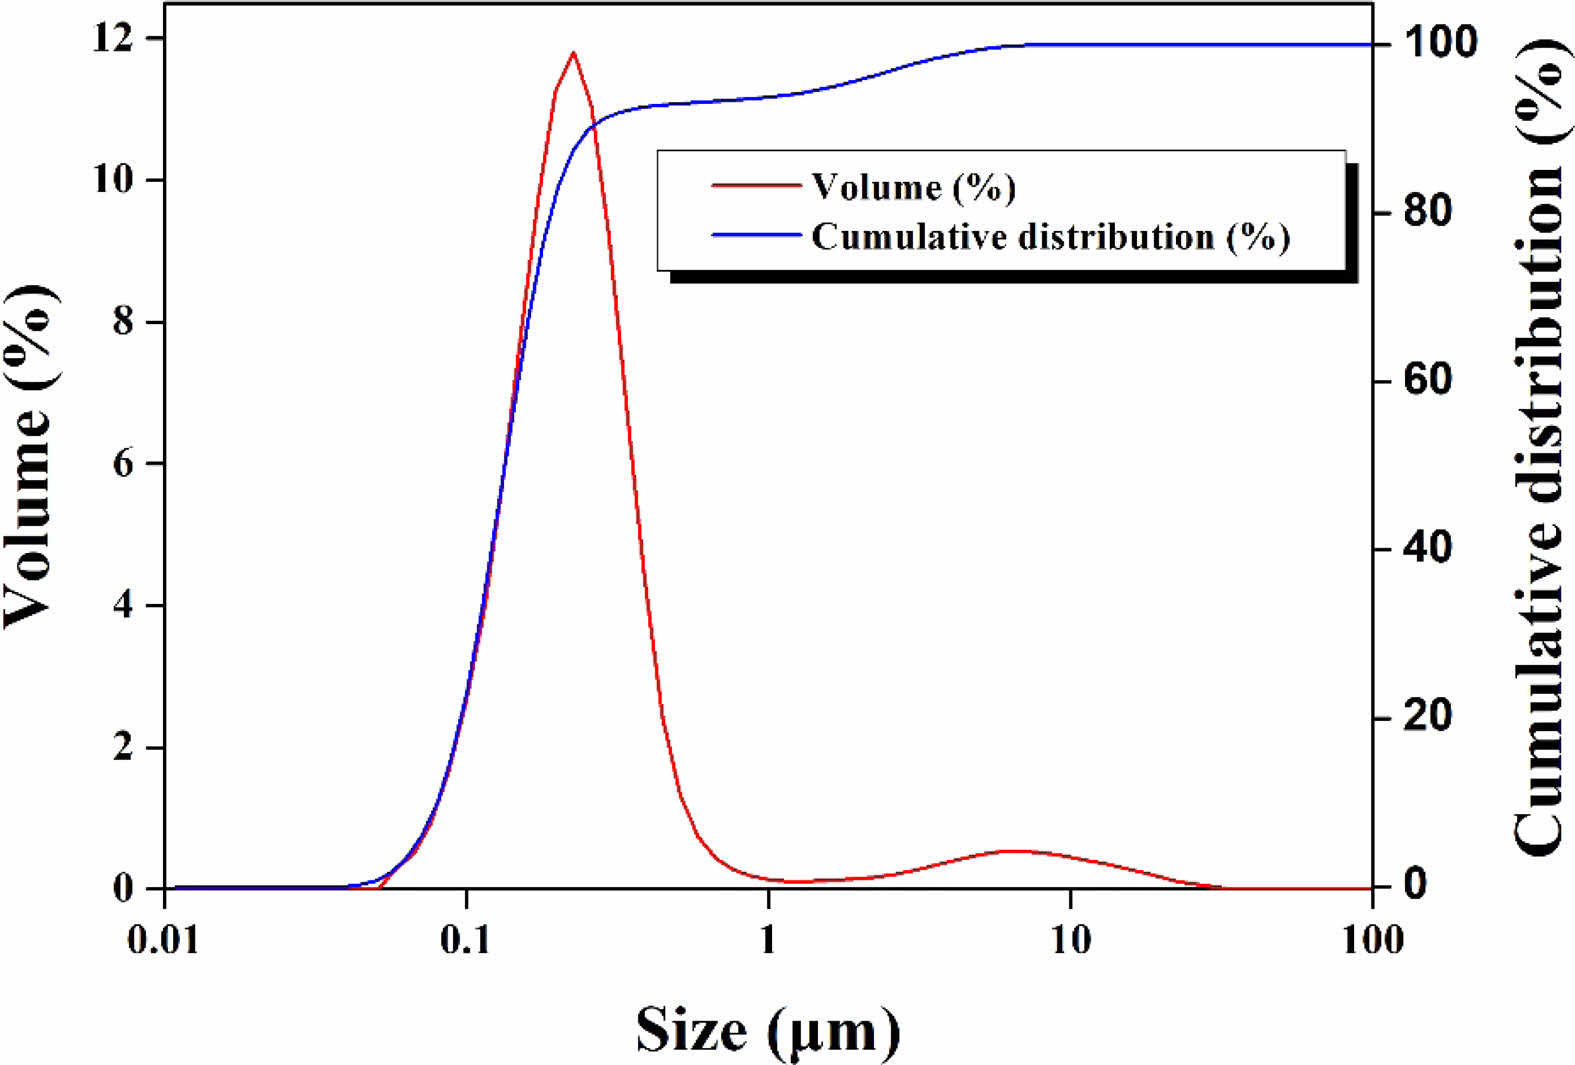
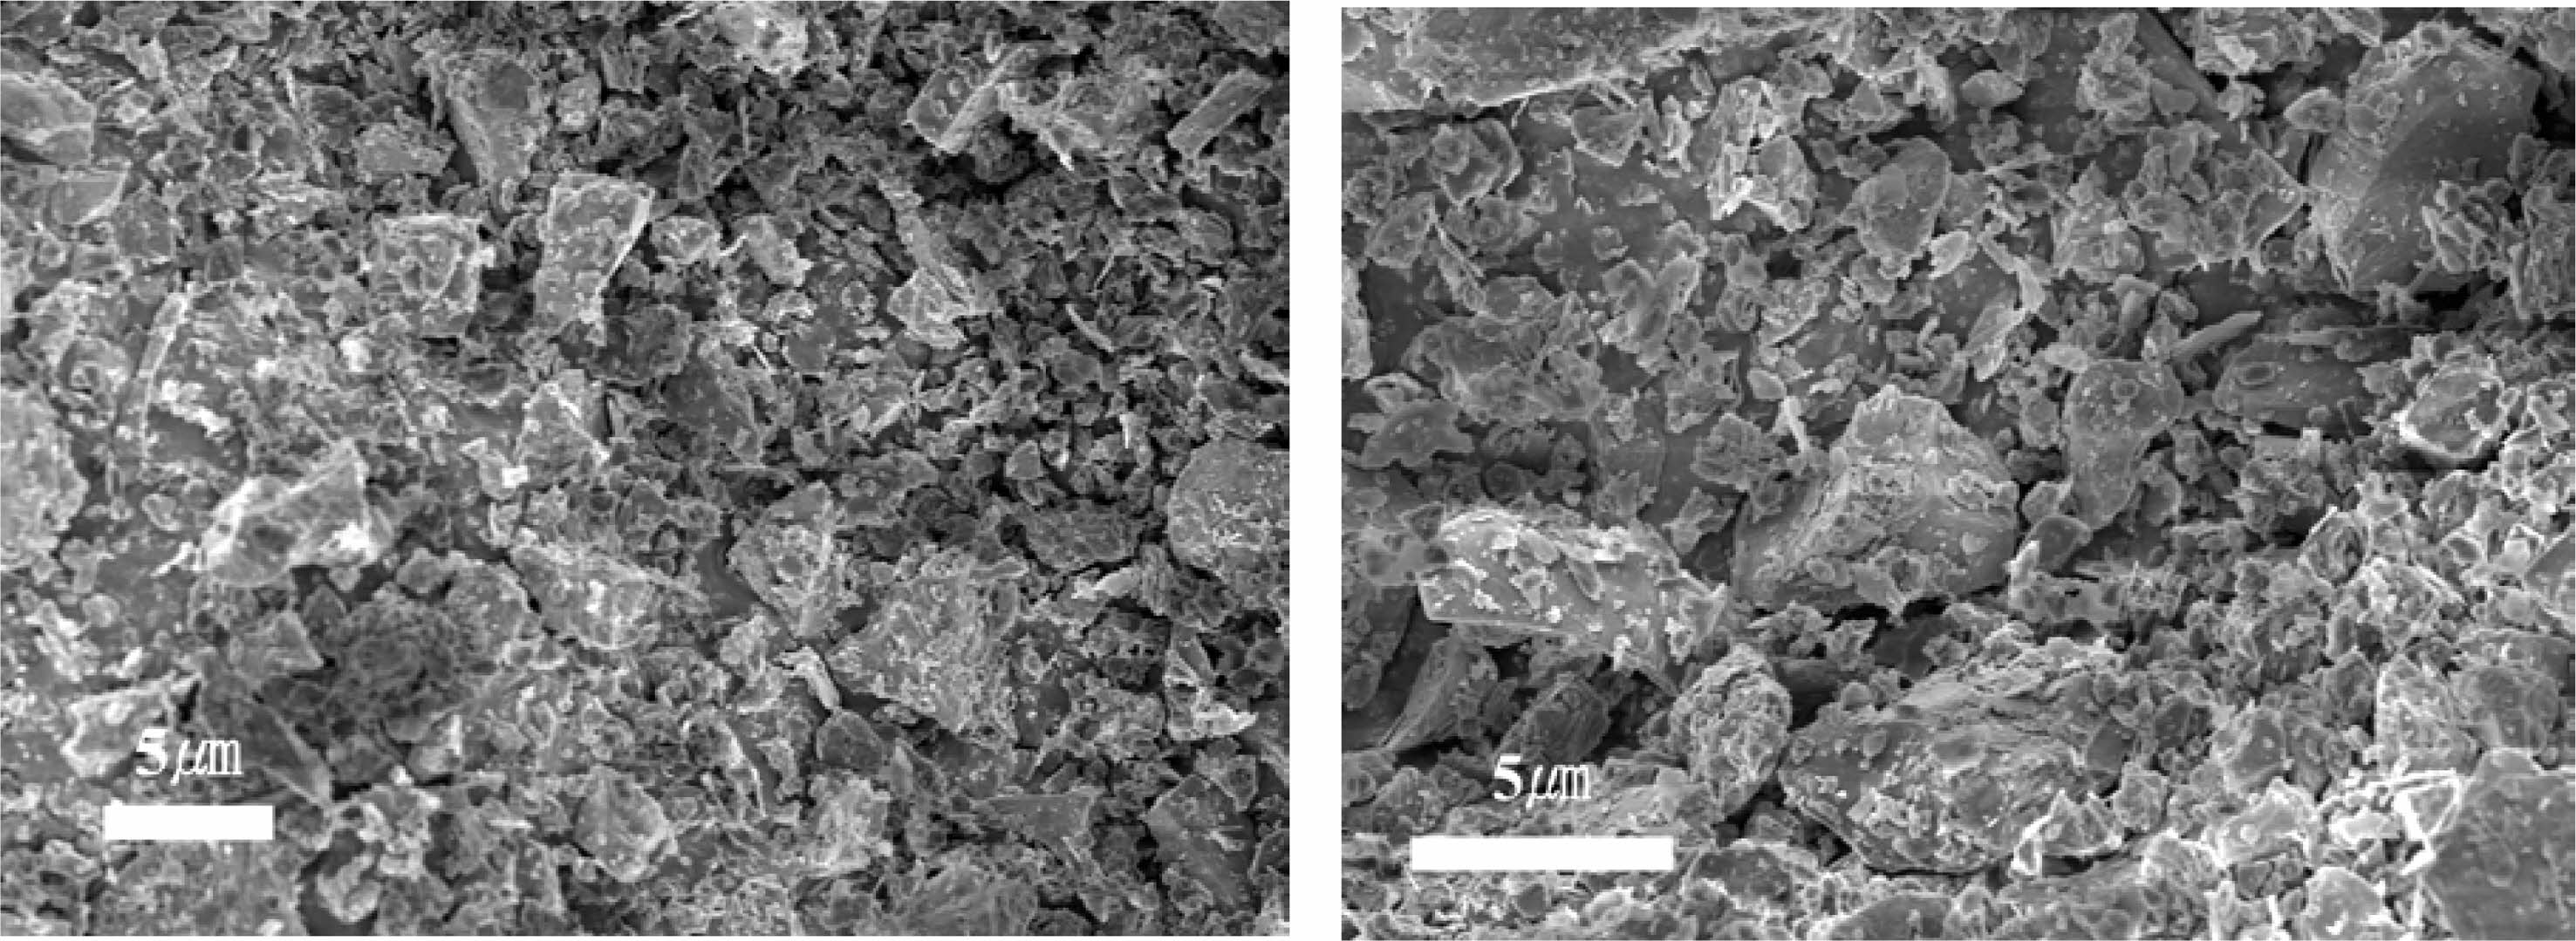
Figs. 1 and 2 show the particle sizes and shapes of raw materials. Particle size analysis revealed that approximately 90% of particles had sizes in the range of 0.1-1 μm, which was consistent with the results observed in the microstructure.
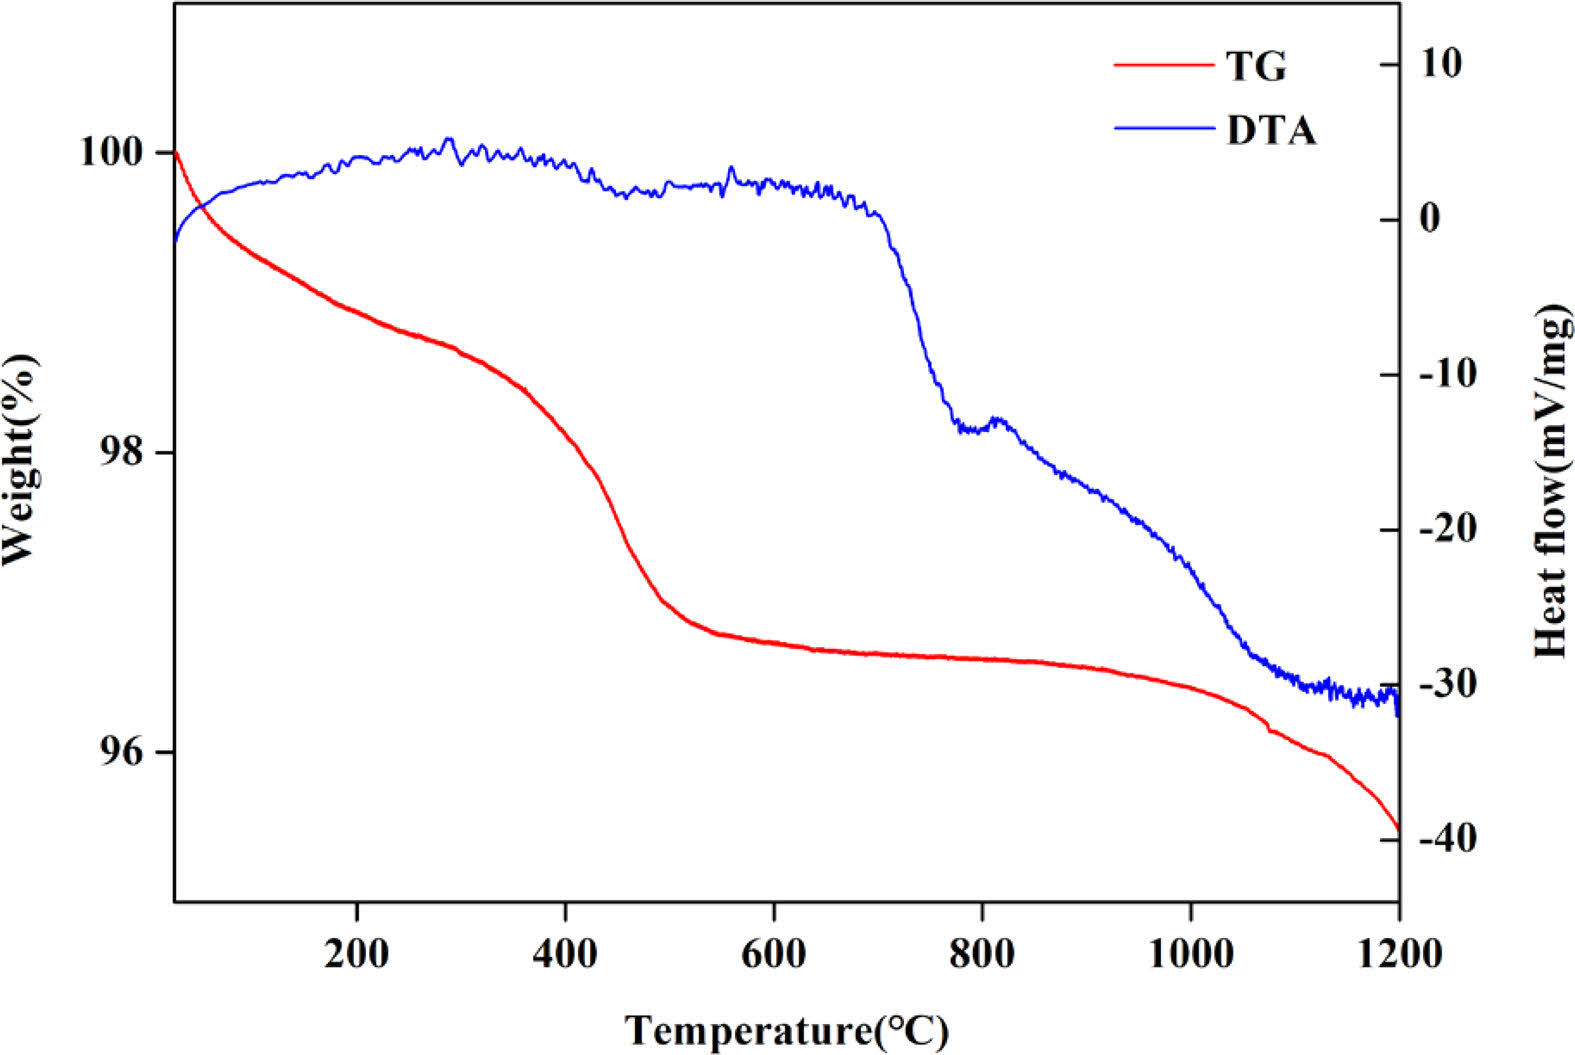
Fig. 3 shows the thermal characteristics of the raw materials obtained by TG-DTA. A weight loss of approximately 3% was observed in the temperature range of RT to 500 ℃, which was determined to derive from the combustion of organic matter contained in the raw material.
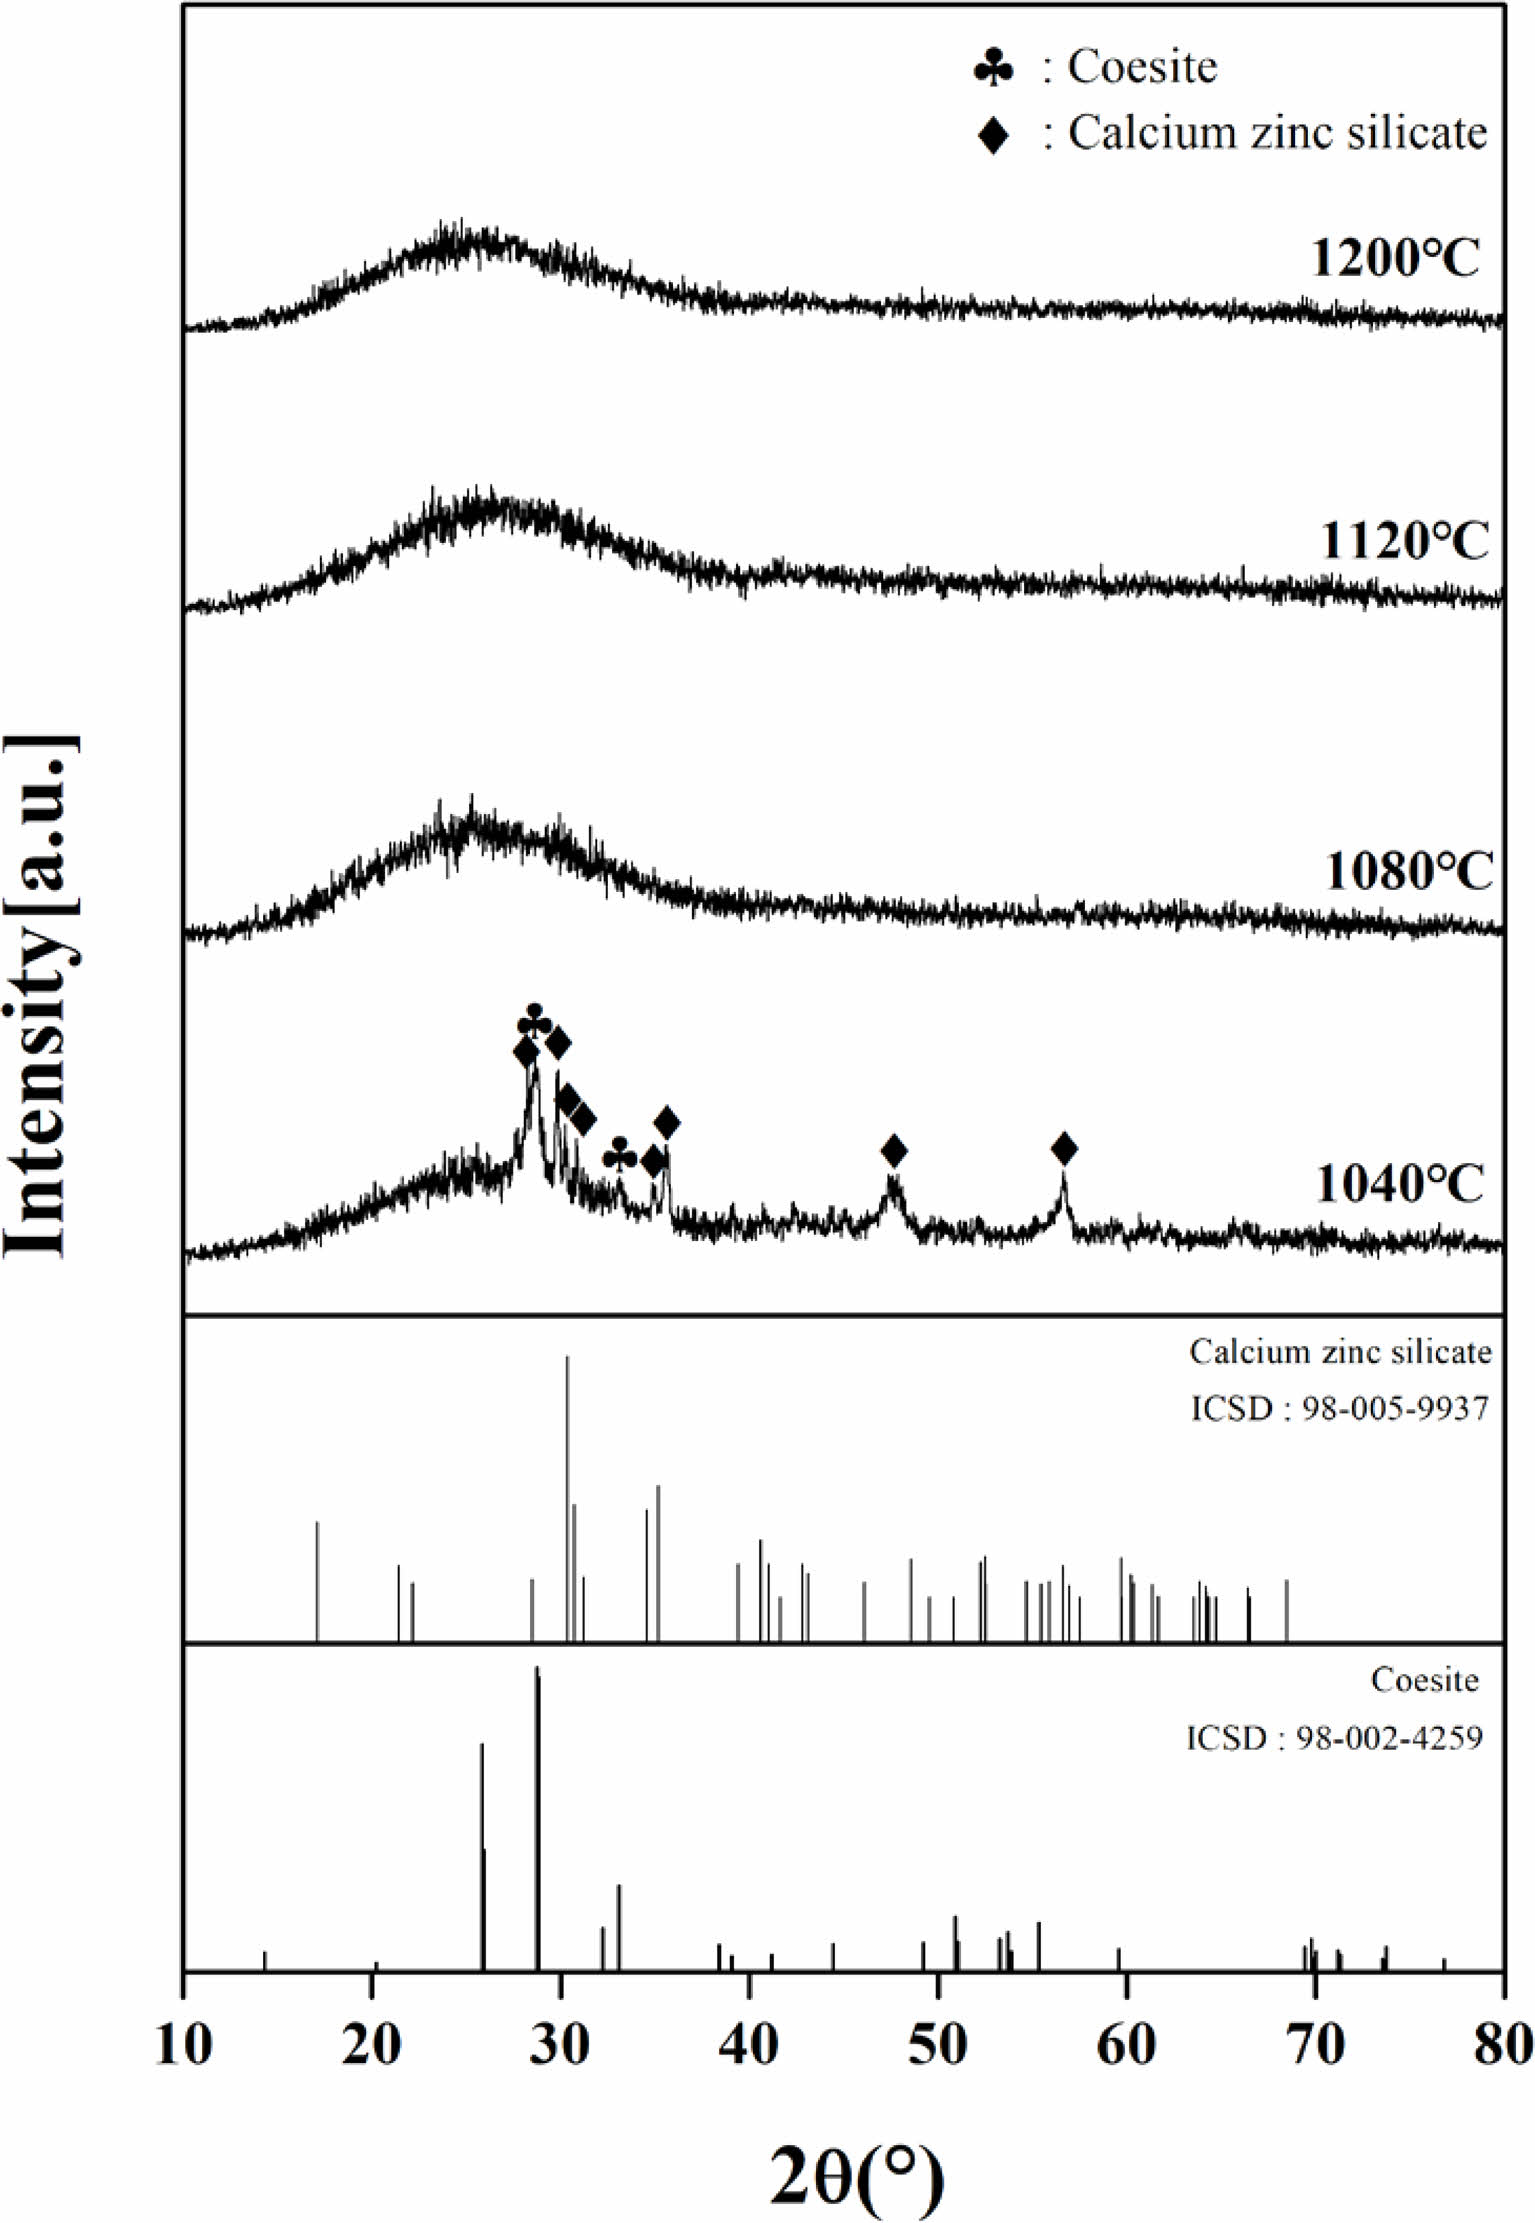
Fig. 4 shows the XRD patterns of the crystalline phase of the heat-treated specimen in the temperature range of 1040-1200 °C. Coesite (SiO2, ICSD: 98-002-4259) and calcium-zinc-silicate (CaZnSiO6, ICSD: 98-005-9937) crystalline peaks were weakly observed in the heat-treated specimens at 1040 °C. By contrast, the specimens heat-treated at temperatures above 1080 °C showed an amorphous phase.
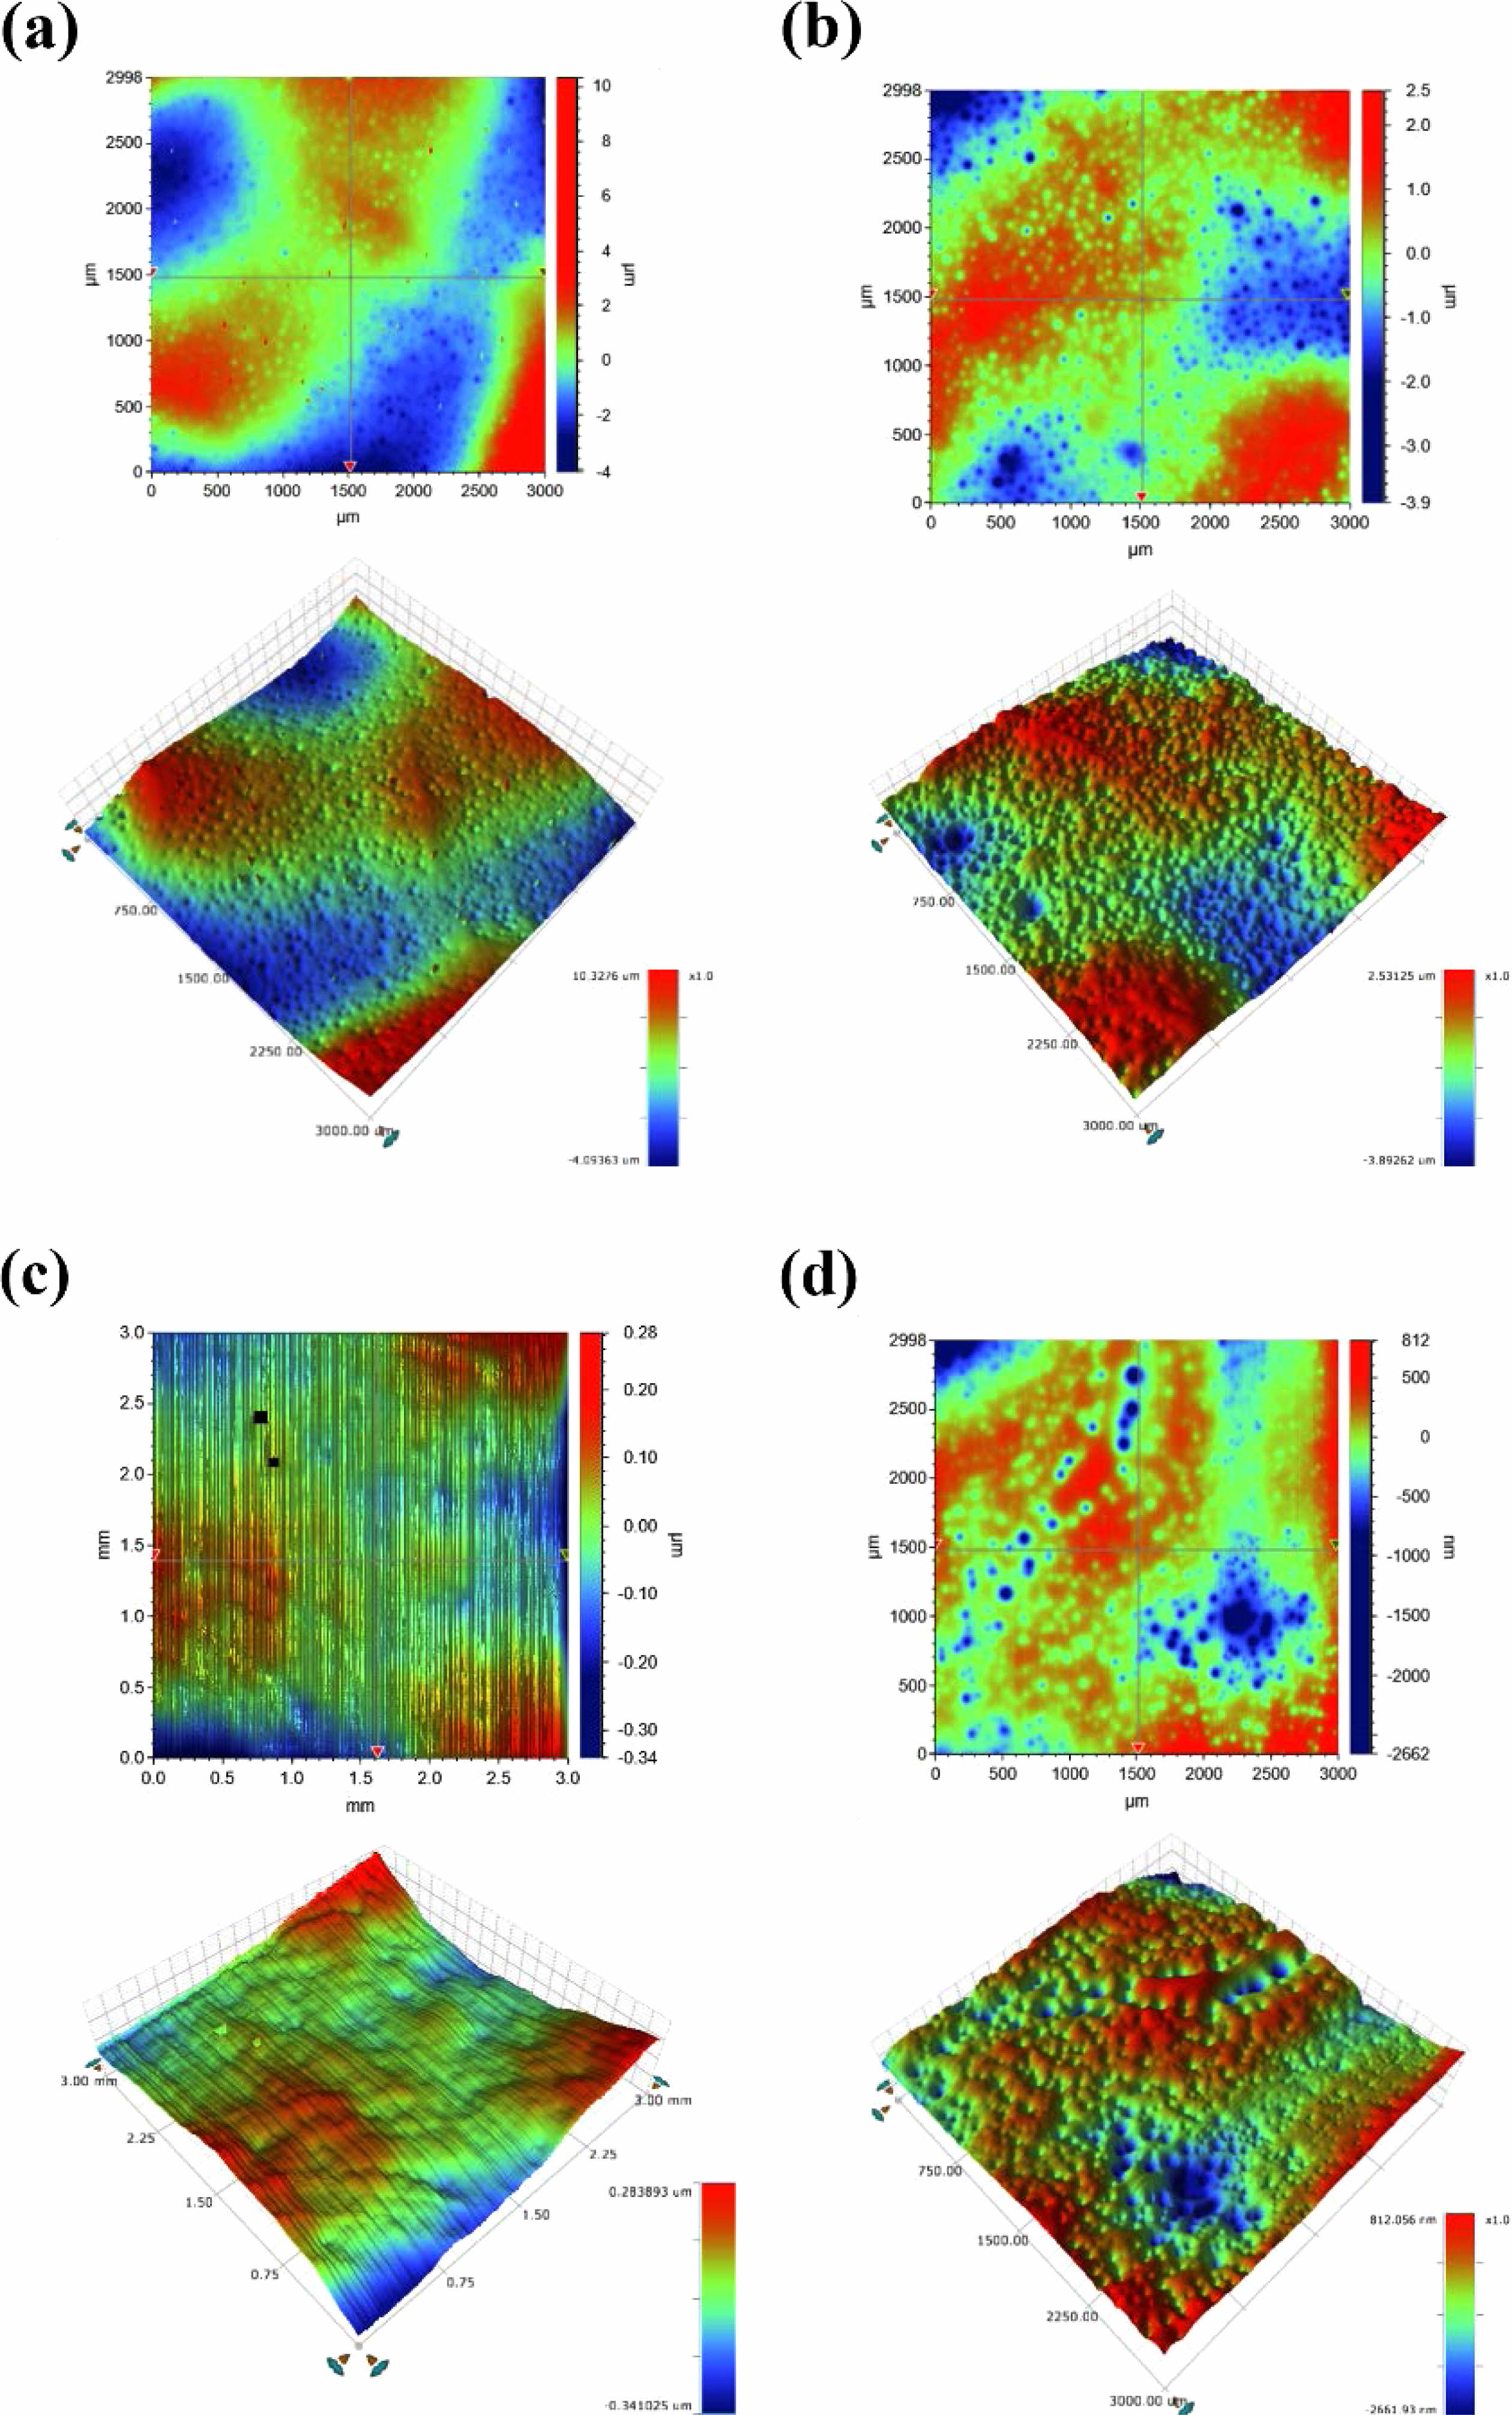
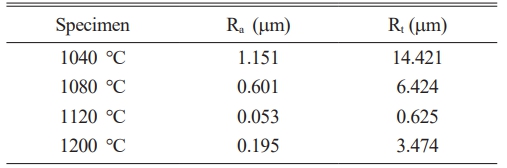
Table 2 shows the results of the surface roughness measurements, and Fig. 5 shows a 3D image of the specimens heat-treated in the temperature range of 1040-1200 ℃. The average roughness (Ra) and maximum roughness (Rt) indicated the lowest surface roughness deviations of 0.053 and 0.625 μm, respectively, under a heat-treatment condition of 1120 ℃. The highest roughness deviations of 1.151 and 14.421 μm were observed in the specimens heat-treated at 1040 ℃ for Ra and Rt, respectively. In the range of 1040-1120 ℃, the surface roughness tended to decrease as the heat-treatment temperature increased, but at 1200 ℃, it tended to increase again.
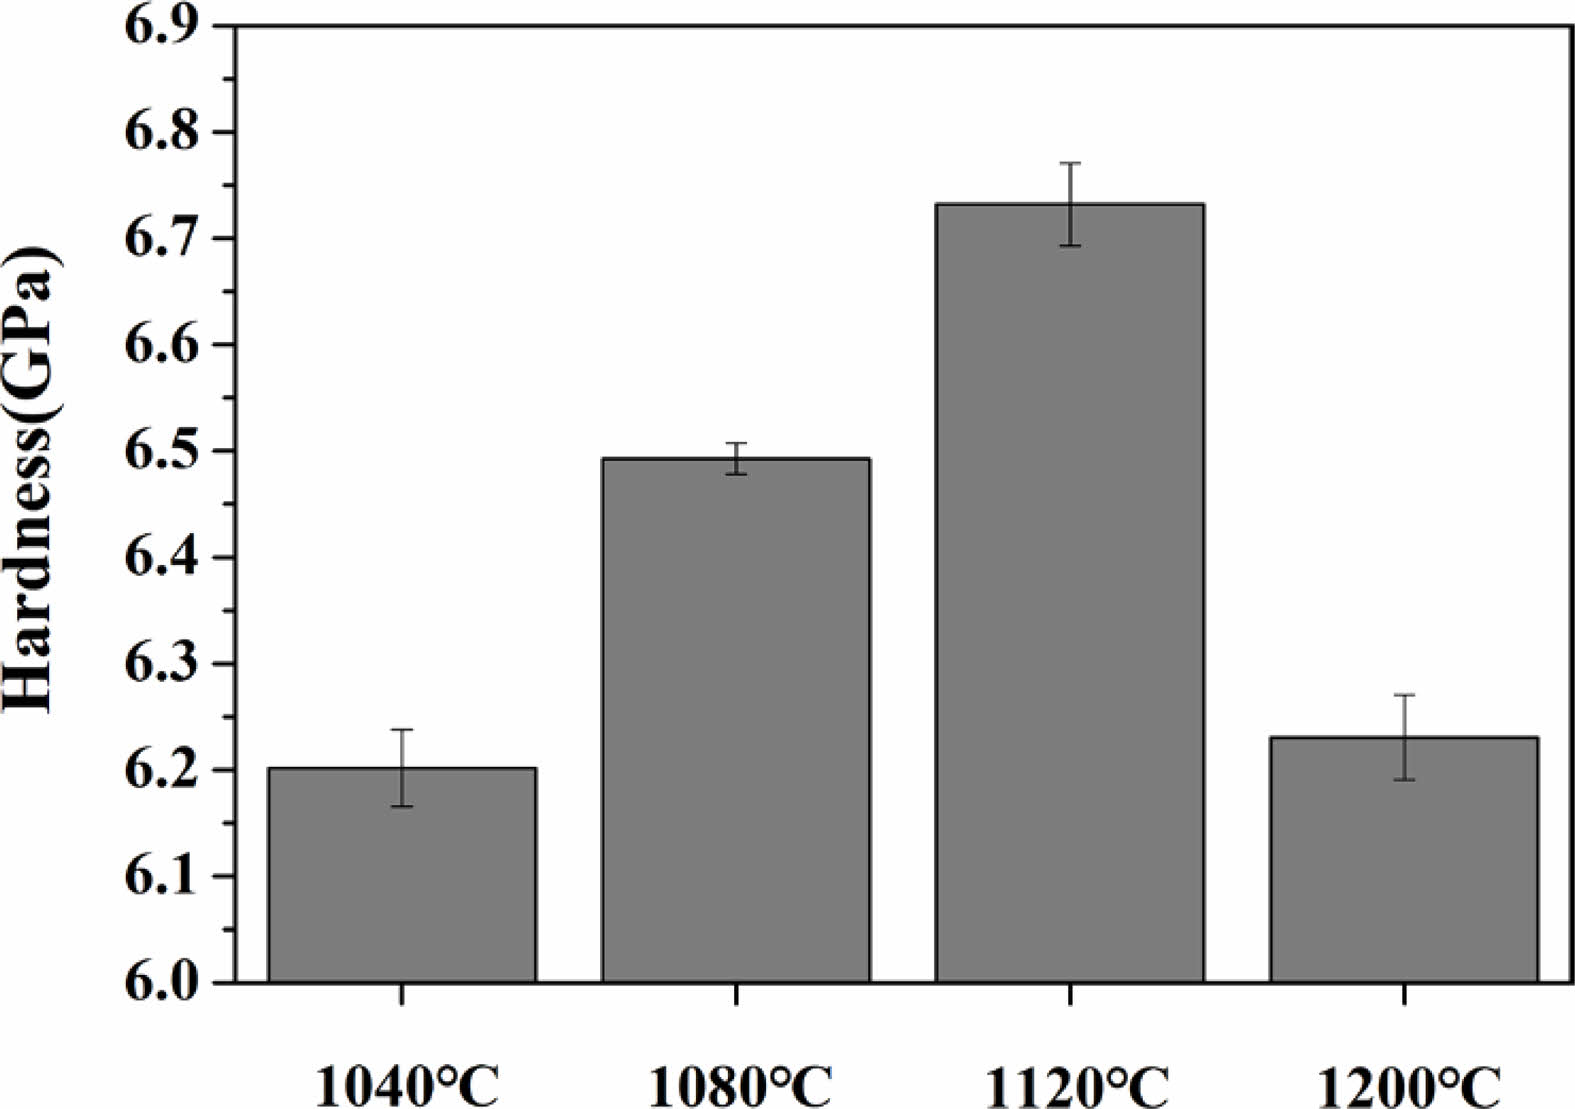
Fig. 6 shows the results of the micro-Vickers hardness of the specimens heat-treated in the temperature range of 1040-1200 ℃. When the heat-treatment temperature increased from 1040 ℃ to 1120 ℃, the hardness increased from 6.20 to 6.73 GPa. However, at 1200 ℃, the hardness tended to decrease again to 6.23 GPa.
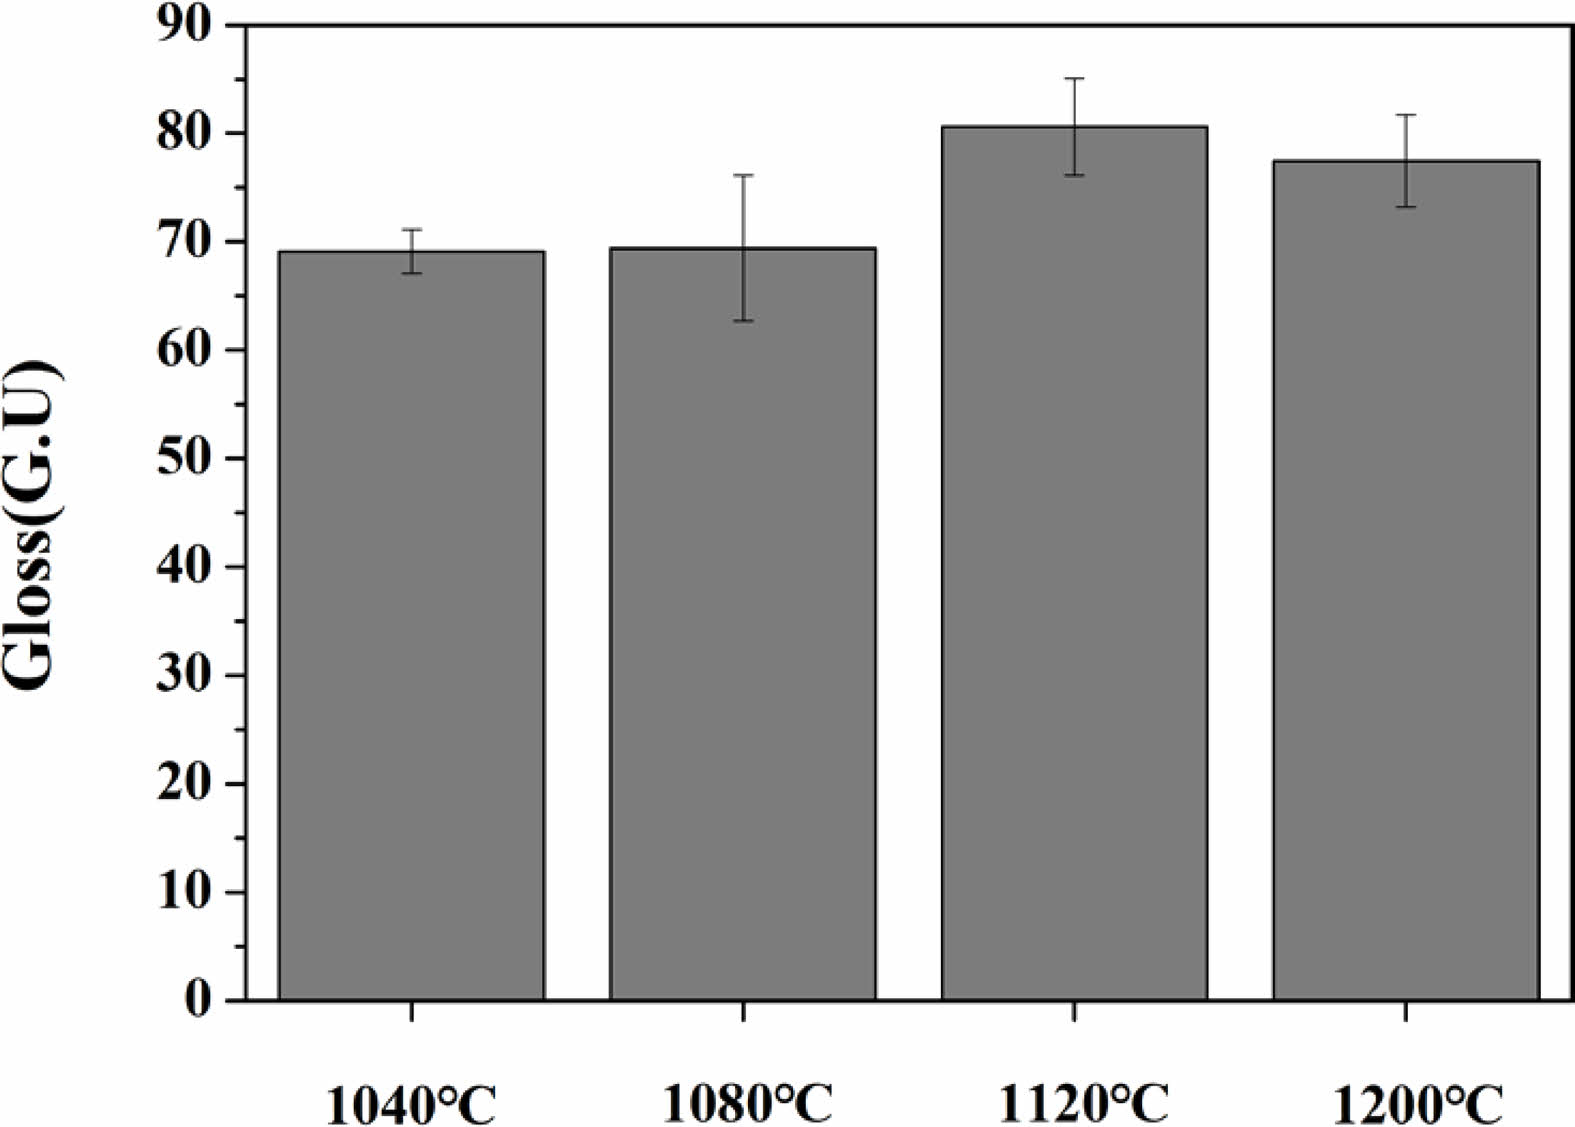
Fig. 7 shows the results of the surface gloss of the specimens heat-treated in the temperature range of 1040-1200 ℃. As the heat-treatment temperature increased from 1040 ℃ to 1120 ℃, the gloss of the glass increased from 69.03 to 82.26 GU. However, at 1200 ℃, a slight decrease in gloss was observed.
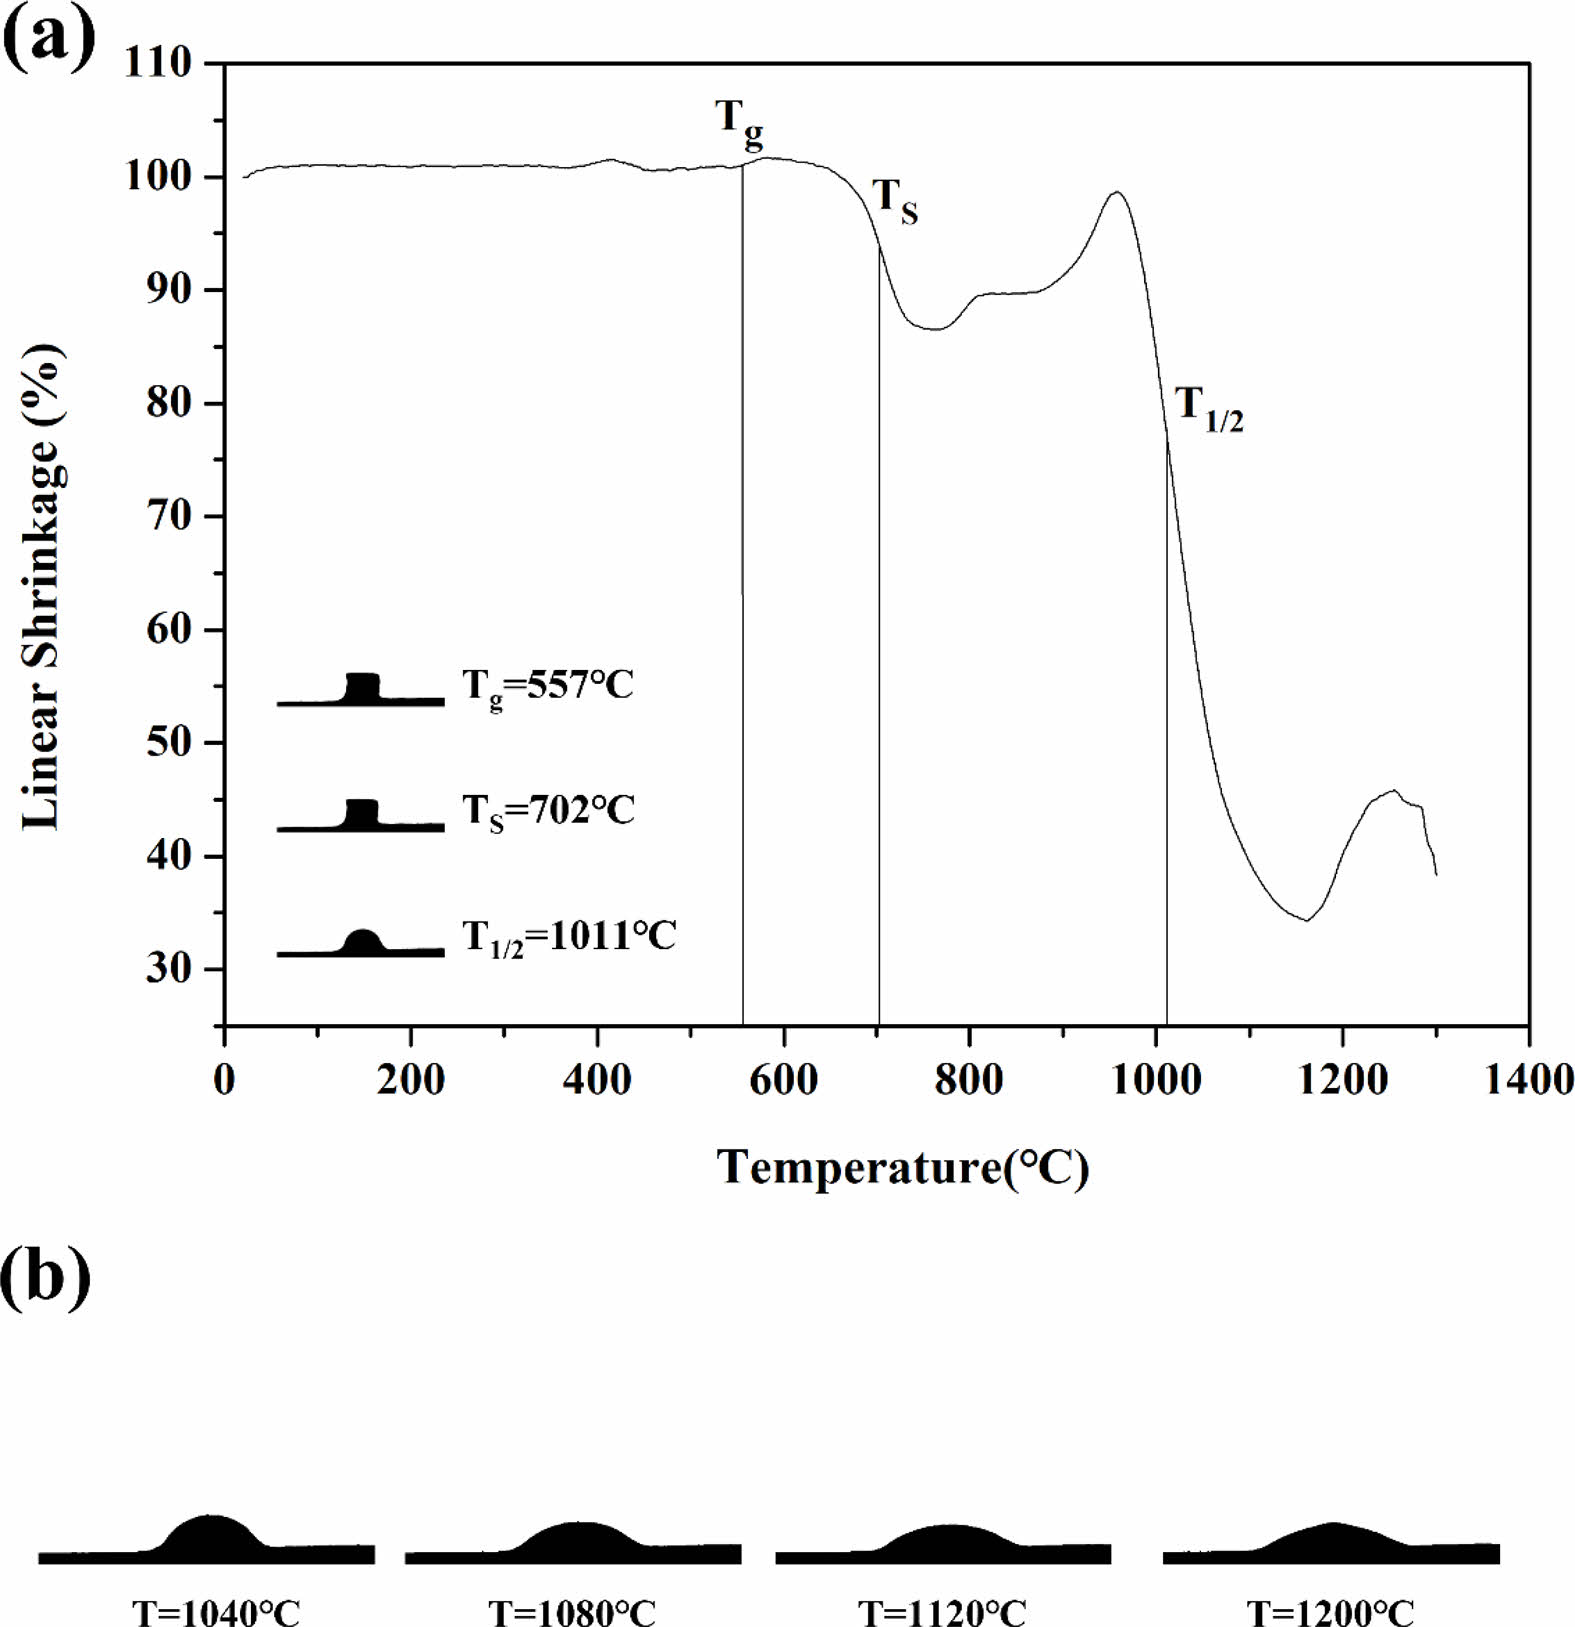
Fig. 8 shows the results of observations of the thermal shrinkage as well as images of the specimens with increasing temperature under HSM. The images for the glass-transition (Tg), softening (TS), and half-sphere (T1/2) temperatures are shown in (a), and images at the different heat-treatment temperatures (1040, 1080, 1120, 1200 ℃) are shown in (b). The glass composition showed initial shrinkage of approximately 660 ℃, and a maximum shrinkage of approximately 65% occurred at 1160 ℃. When the glass powder with various particle size distributions was heat-treated, the initial shrinkage stage occurred when the smallest particles formed necks due to viscous flow, which could be explained by the Frenkel model [27]. As the temperature increased, the pores between the larger particles then disappeared, and the glass reached maximum shrinkage. The sintering kinetics can be explained by the Mackenzie and Shuttleworth model [28]. However, in the final stage of the sintering process following maximum shrinkage, the trapping of undissolved gas or other physical processes such as crystallization may have affected the sintering kinetics, causing a slight increase in shrinkage [29].
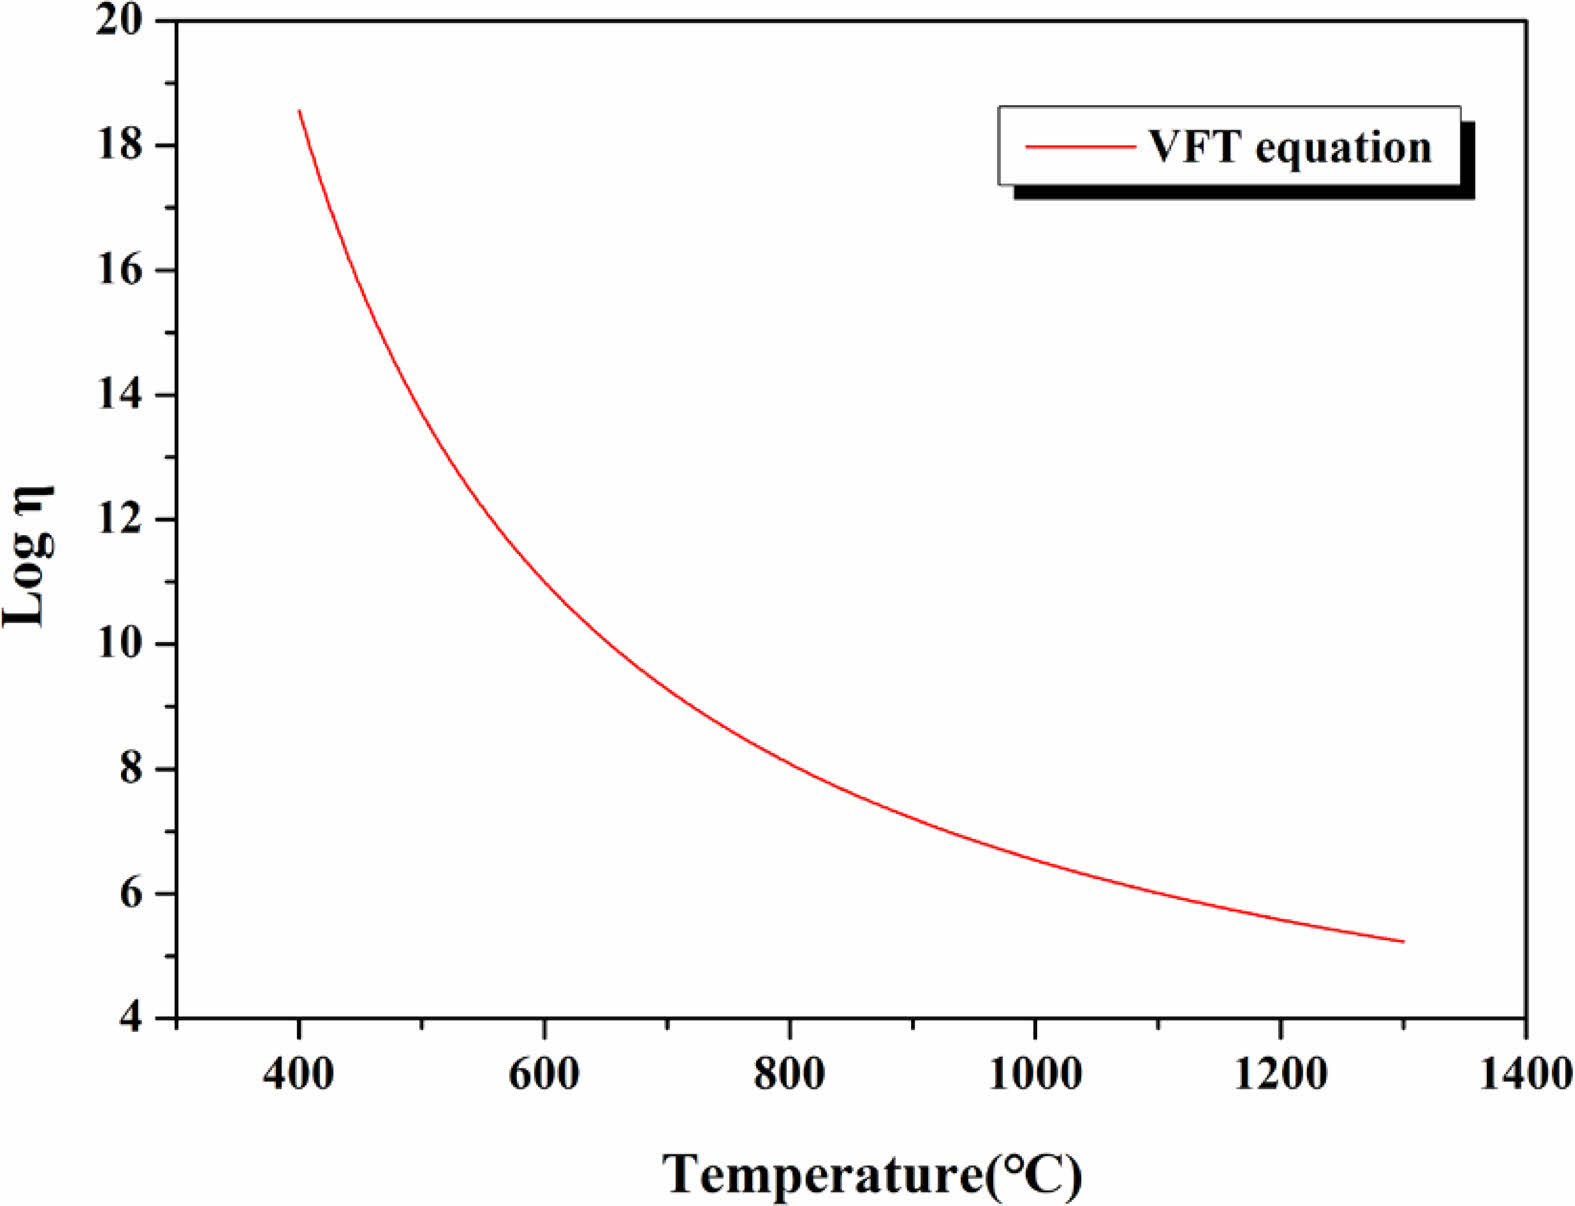
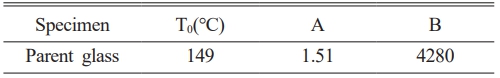
Table 3 lists the values for T0, A, and B obtained using (2)-(4), respectively. The table also lists the observed thermal characteristic temperatures (Tg, TS, T1/2) derived from DTA and HSM for predicting the viscosity of the glass when using the VFT model. Fig. 9 shows the changes in viscosity of the glass in the temperature range of 400-1300 ℃ when using the VFT model as derived from (1). We observed that the viscosity of the glass, which initially was approximately 1019 Pa∙s at 400 ℃, decreased to approximately 105 Pa∙s as the temperature increased to 1300 ℃. This indicated that the glass had higher viscosity values than those of typical silicate glass compositions [30].
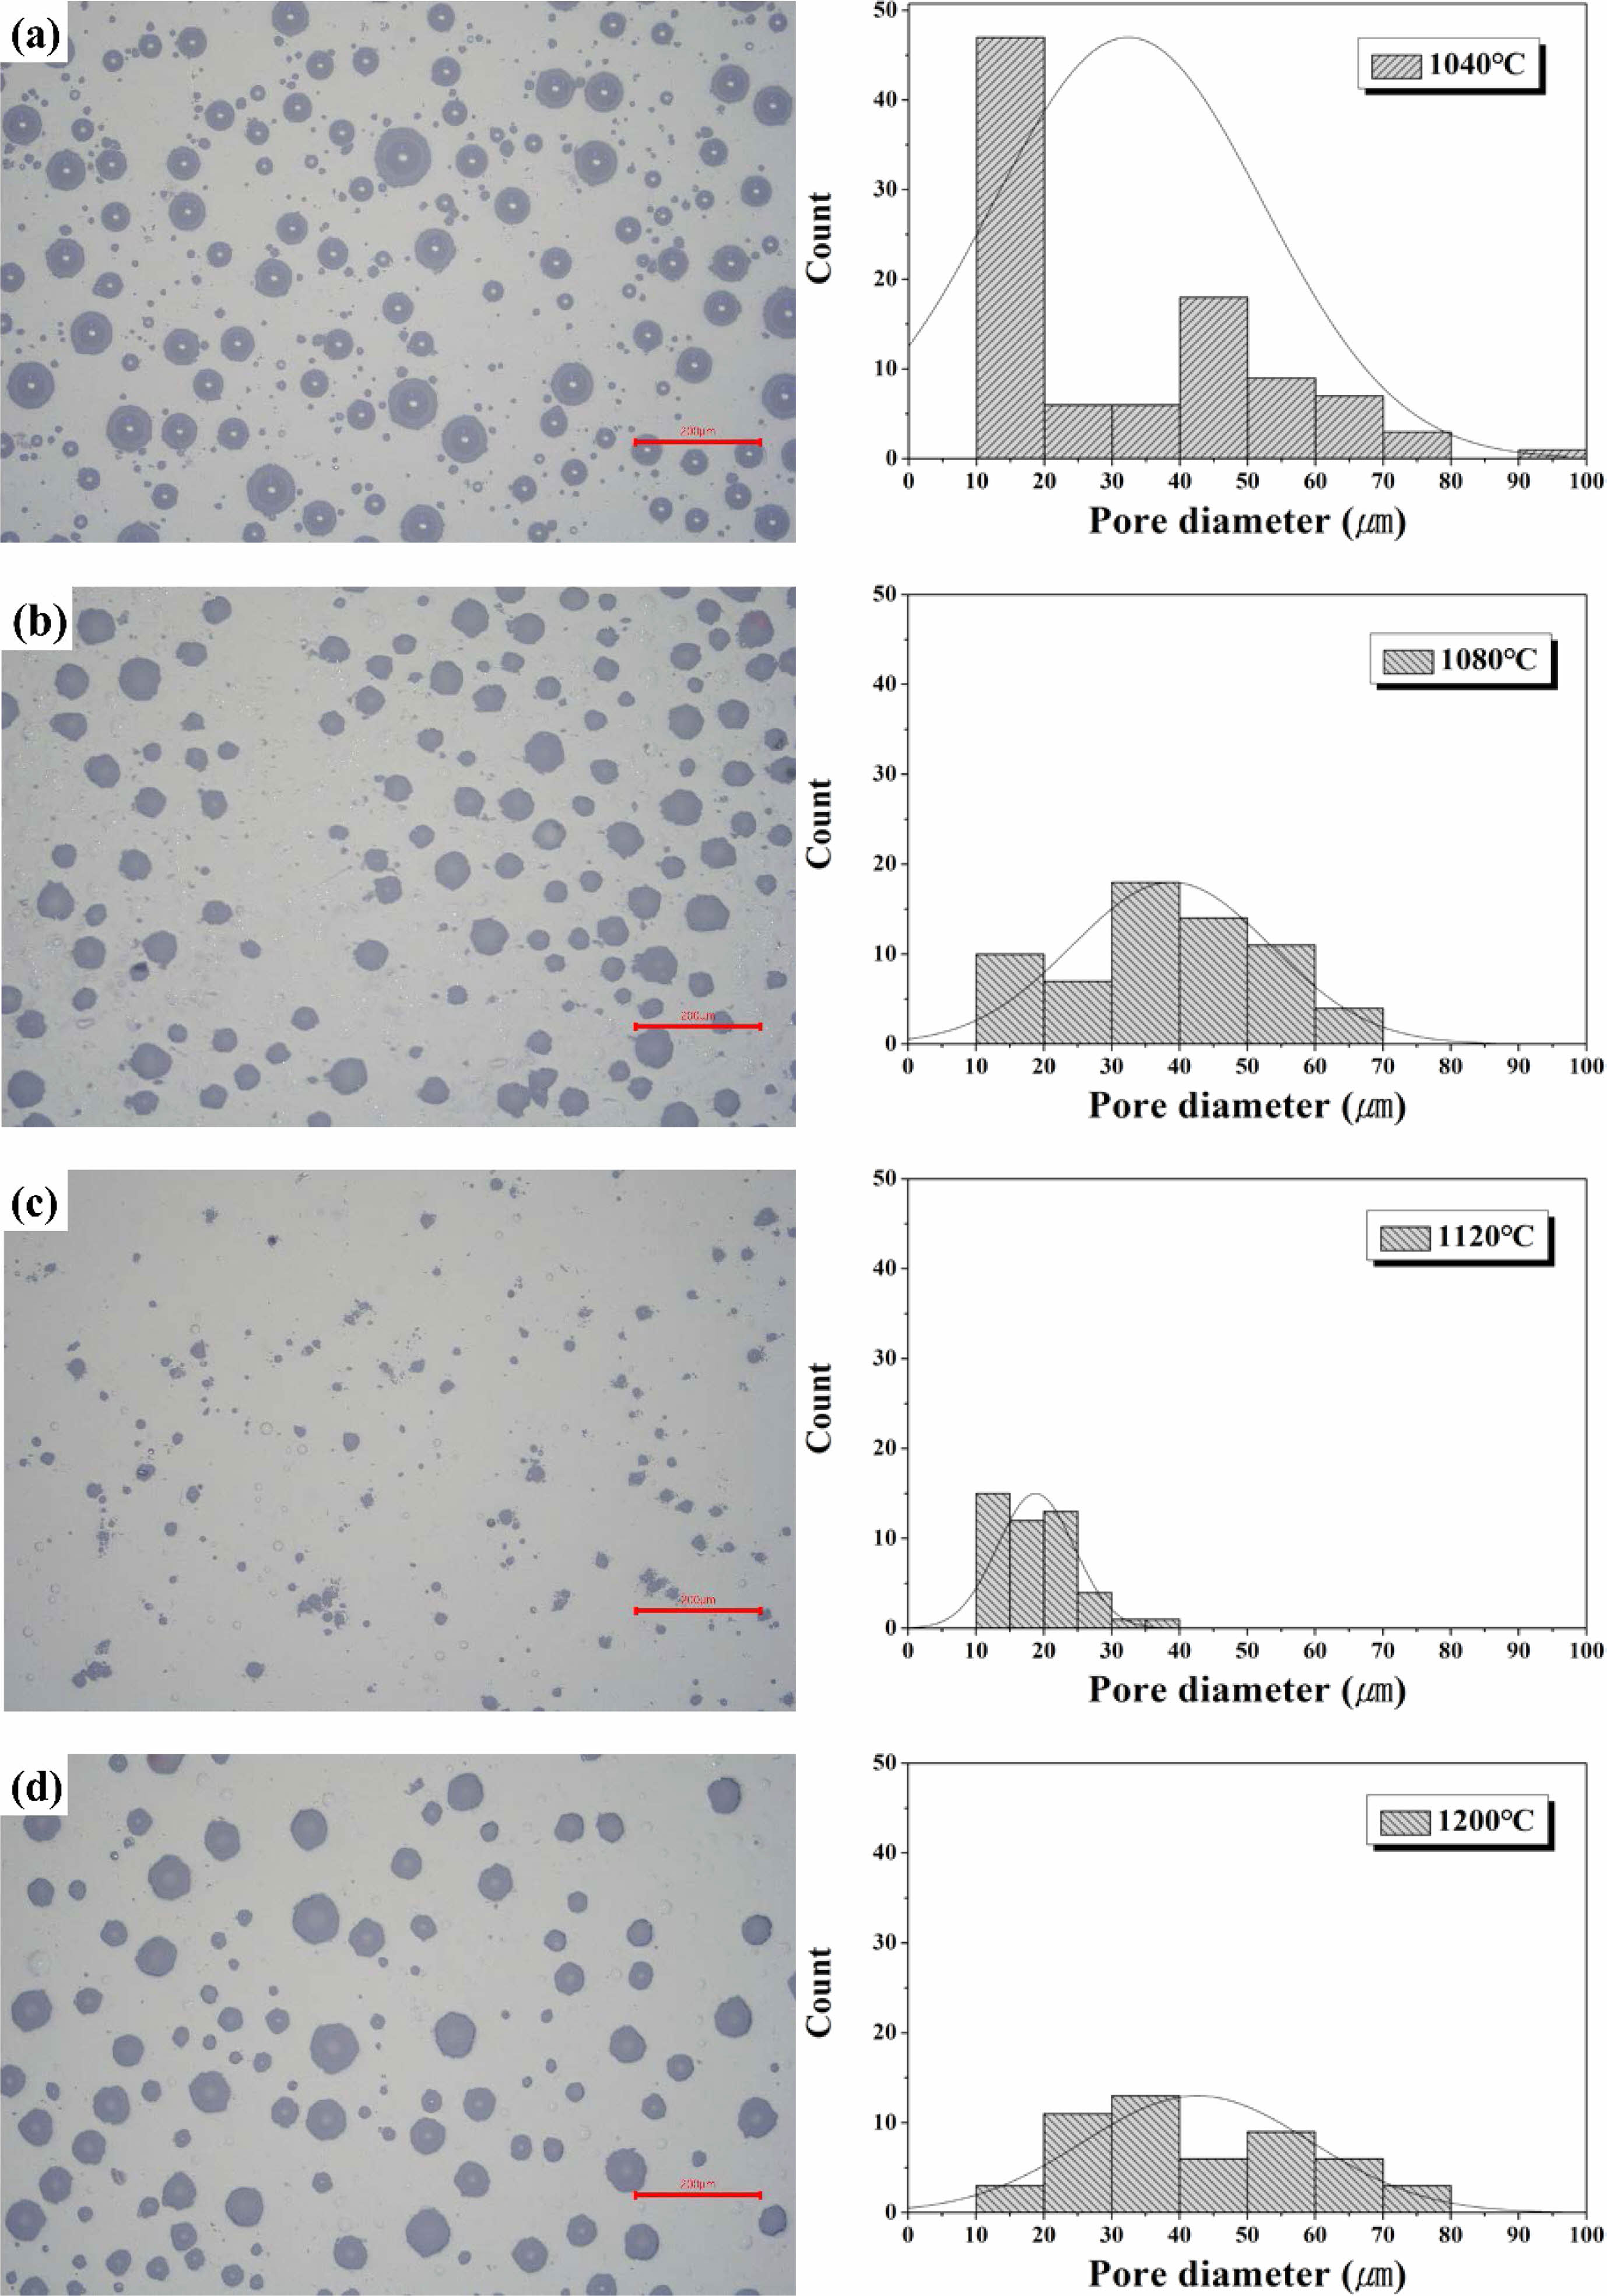
Fig. 10 shows the results of optical microscopy of the surface of glass that was heat-treated in the temperature range of 1040-1200 ℃. These observations confirmed the presence of numerous pores on the surfaces of all the specimens due to their high viscosity. The specimens heat-treated at 1040 ℃ and 1080 ℃ showed pore sizes in the range of 10-80 μm, whereas the pore-size distribution decreased to 40 μm or less at 1120 ℃. As the heat-treatment temperature increased, the pore size tended to decrease, and the smallest pores were observed at 1120 ℃. However, the pore size increased again as the heat-treatment temperature increased to 1200 ℃. The specimen heat-treated at 1120 ℃ exhibited the smallest number and size of pores at the approximate temperature at which the maximum shrinkage was observed in the HSM analysis as shown in Fig. 8.
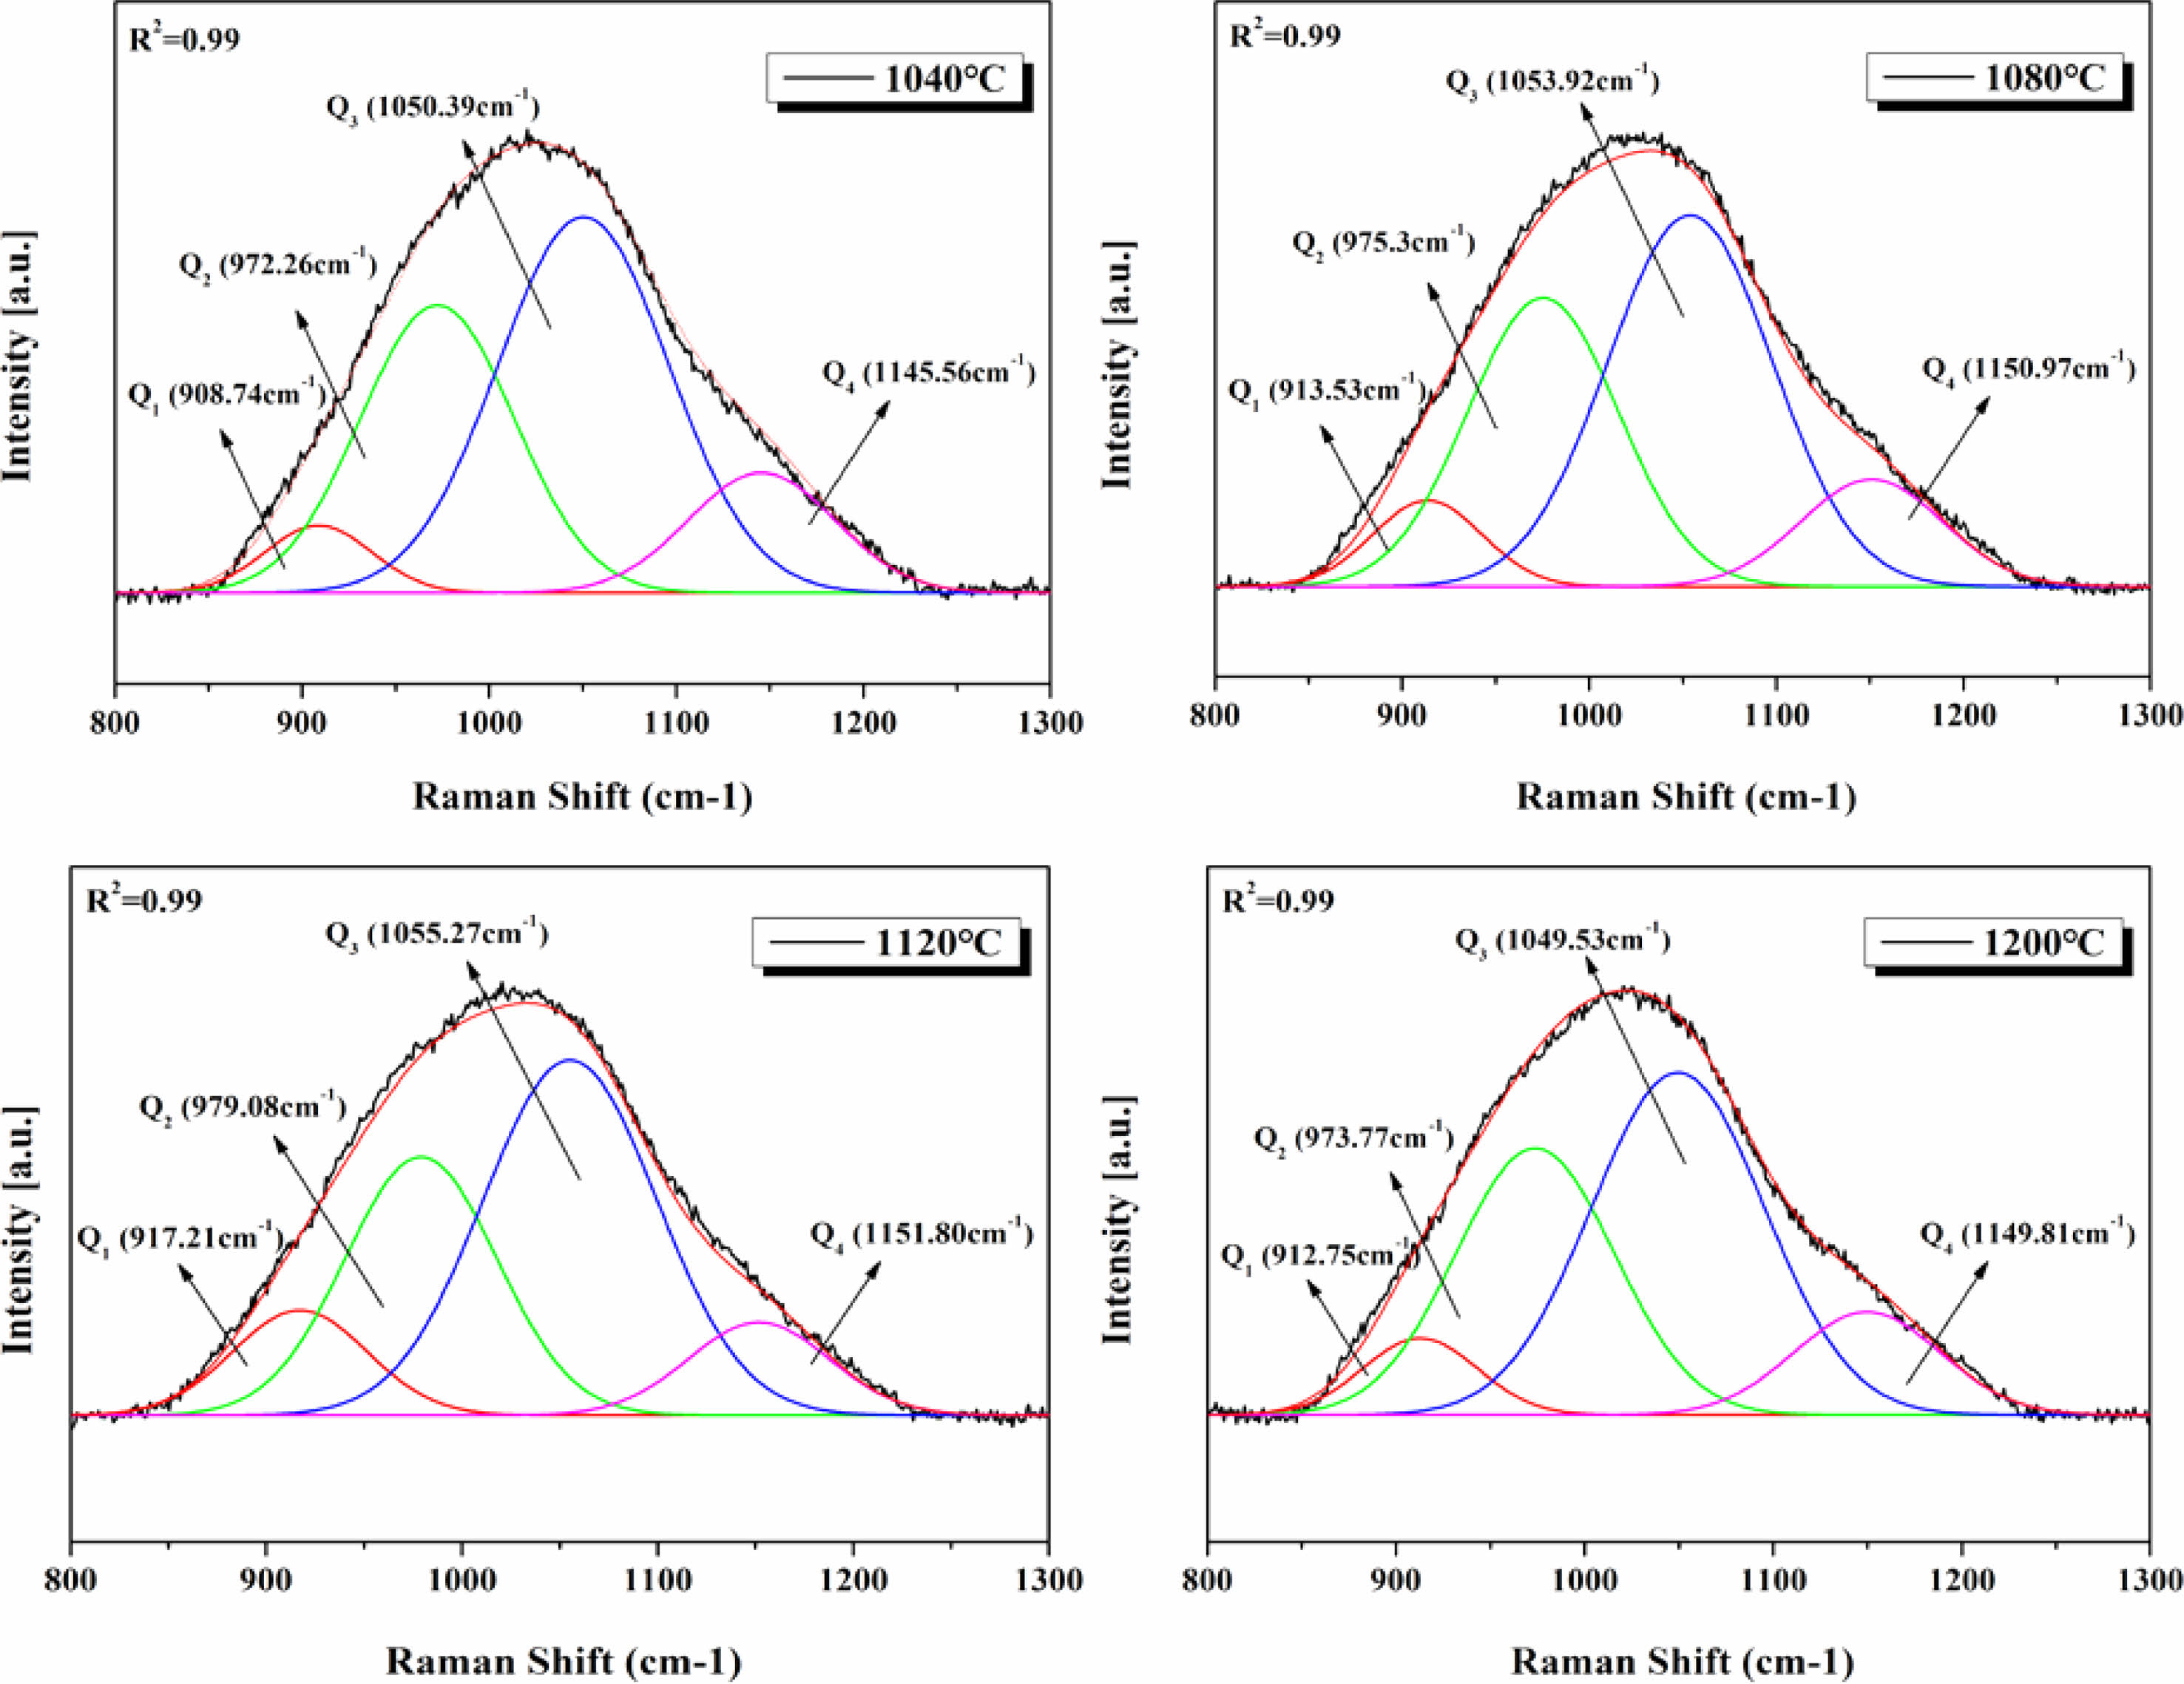
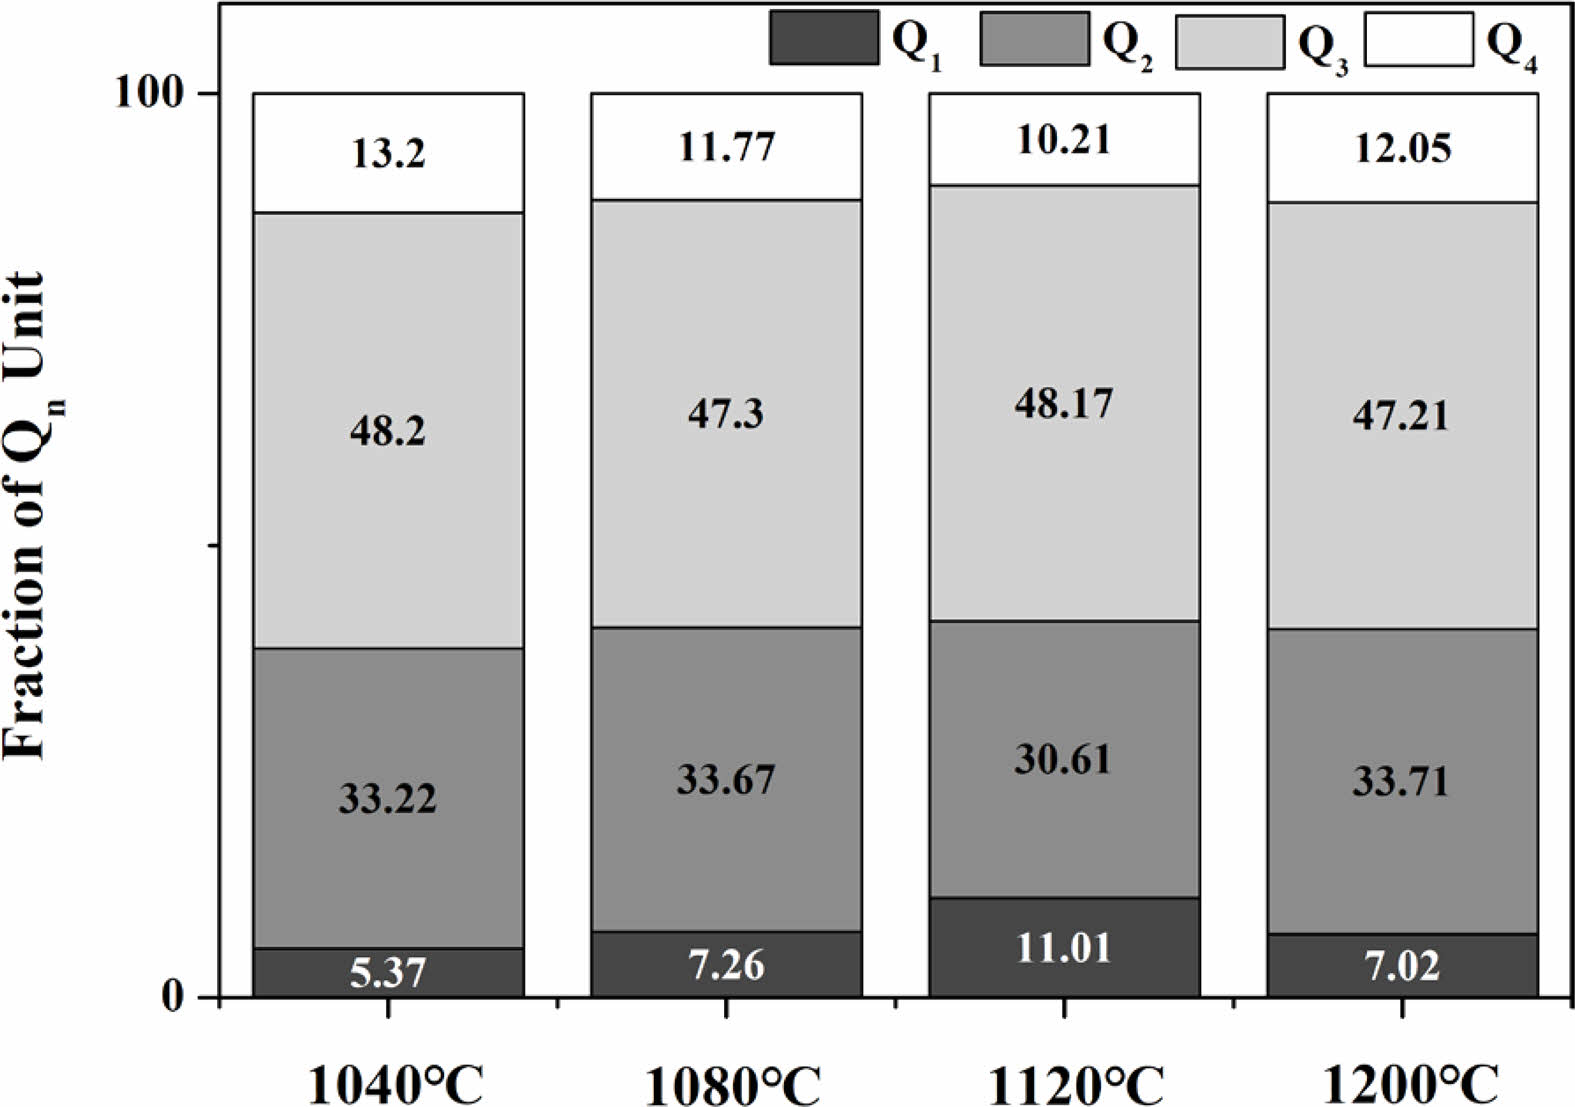
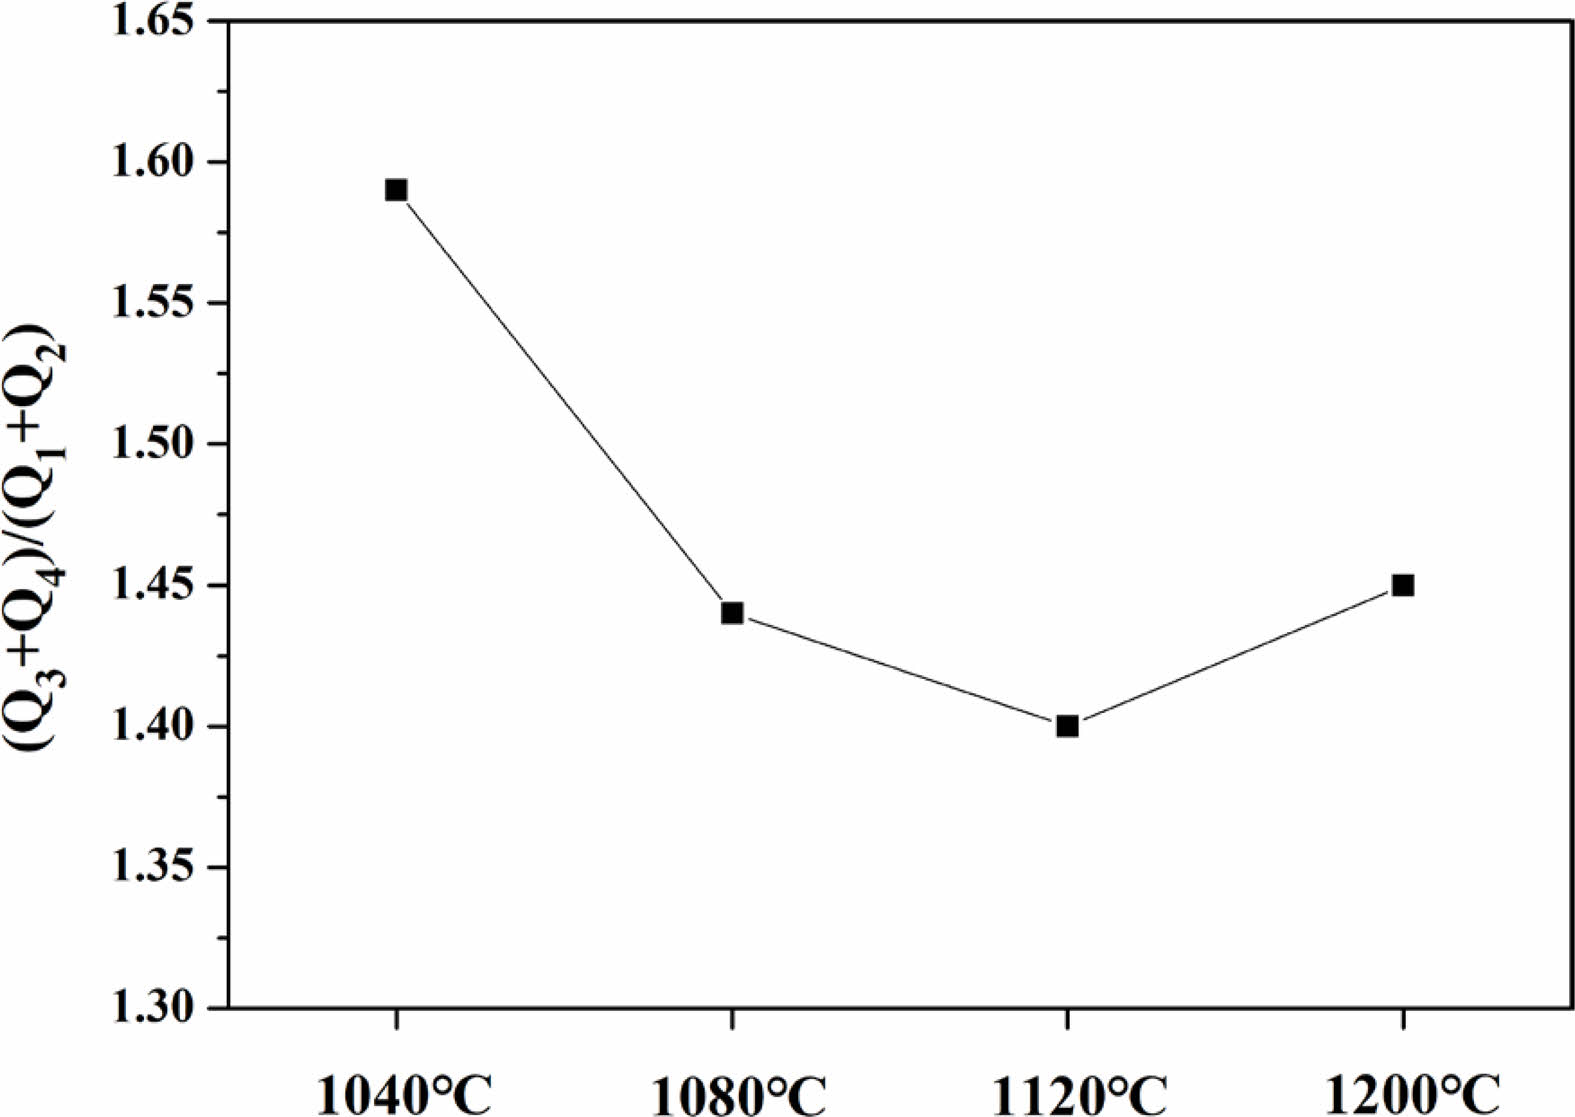
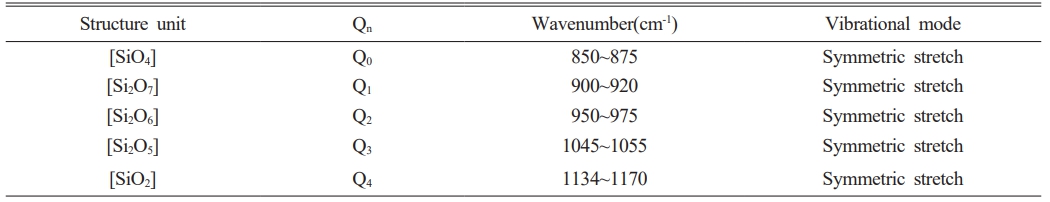
Fig. 11 shows the Raman spectra observed in the range of 800-1300 cm-1 on the surfaces of glass specimens that were heat-treated in the temperature range of 1040-1200 ℃. The Raman spectra were used to evaluate the changes in the properties of the glass matrix. Deconvolution of the Raman spectra obtained from each specimen using Gaussian curves is presented in the figure, and all four specimens could be expressed in terms of Qn (n = 1-4) units. Table 4 presents the criteria used for this process. Qn is typically divided into five structures. As the number of bridging oxygen atoms and degree of polymerization of the glass structure both increases, the value of n also increases. These structures are based on monomers, dipolymers, chain polymers, layer polymers, and mesh polymers, referred to as Q0, Q1, Q2, Q3, and Q4, respectively [31, 32]. The peaks in this range can be represented by Qn units as the non-bridging oxygen increases. The relative ratios of the deconvoluted areas of each Qn unit can be used to qualitatively compare the degree of polymerization in the glass composition. Accordingly, changes in the area fraction of each Qn unit are presented graphically in Fig. 12. As the heat-treatment temperature increased from 1040 ℃ to 1120 ℃, the area of Q4 gradually decreased, resulting in an increase in the area of Q1. However, in the case of the specimen heat-treated at 1200 ℃, the area of Q4 increased again, whereas the area of Q1 decreased. In a study by Guo et al. [33], the ratio of (Q3 + Q4)/(Q0 + Q1 + Q2) was used as a measure to predict viscosity. They reported that as the ratio increased, the proportion of nonbridging oxygen in the melt decreased, resulting in an increase in viscosity. Fig. 13 shows the (Q3 + Q4)/(Q0 + Q1 + Q2) ratio of the specimens heat-treated at each temperature. Results showed that the ratio decreased in the range of approximately 1.4-1.6 as the heat-treatment temperature increased from 1040 ℃ to 1120 ℃; the ratio then increased again at 1200 ℃. Therefore, we correctly predicted that the glass used in this study had the lowest viscosity at 1120 ℃, which was consistent with the results of the surface roughness analysis showing the lowest surface roughness for the sample treated at 1120 ℃. We believe that as the viscosity decreased during heat treatment, the pores generated during the treatment gradually decreased, leading to a decrease in Ra and an increase in the hardness of the glass surface [34].
|
Fig. 1 Particle size distribution of raw material. |
|
Fig. 2 SEM micrographs of raw materials. |
|
Fig. 3 TG/DTA curves of raw material. |
|
Fig. 4 XRD patterns of heat-treatment specimens with different sintering temperature. |
|
Fig. 5 Surface topography of specimens with different sintering temperature. (a) 1040 ℃, (b) 1080 ℃, (c) 1120 ℃, (d) 1200 ℃ |
|
Fig. 6 Micro-Vickers hardness of specimens with different sintering temperature. |
|
Fig. 7 Gloss values expressed as Gloss Unit (GU) of specimens with different sintering temperature. |
|
Fig. 8 (a) Variation in height of glaze powder during the HSM measurement, (b) Photomicrographs of the shape specimen evolution associated to (a). |
|
Fig. 9 Viscosity curve according to the equation proposed by Vogel-Fulcher-Tammann (VFT). |
|
Fig. 10 Optical image of polished surface and pore diameter of specimens with different sintering temperature. |
|
Fig. 11 Representative deconvolution results of Raman spectra in the range of 800-1300 cm-1 of specimens with different sintering temperature. |
|
Fig. 12 The abundance of Qn fraction of specimens with different sintering temperature. |
|
Fig. 13 The Area ratio of (Q3+Q4)/(Q1+Q2) of specimens with different sintering temperature. |
In this study, a SiO2-Al2O3-CaO-ZnO-Na2O system glass was sintered in a temperature range of 1040-1200 ℃ to investigate the changes in surface properties of the glass according to sintering temperature. The results showed that the sample sintered at 1120 ℃ had the lowest average surface roughness and highest hardness and glossiness. Viscosity predictions based on the VFT equation indicated that the glass composition evaluated in this study had a higher viscosity than typical silicate glass compositions. By analyzing the Qn unit area changes in Raman spectra at 800-1300 cm-1, the study predicted the viscosity changes at each sintering temperature and confirmed that the viscosity gradually decreased from 1040 ℃ to 1120 ℃ and then increased again at 1200 ℃. HSM analysis revealed that the maximum shrinkage temperature due to changes in sintering kinetics based on the particle size of the raw powder was approximately 1160 ℃. Therefore, the probability of pore formation on the surface of the sample sintered at 1120 ℃ was confirmed to be the lowest. For the other sintered samples, pores generated due to higher viscosity were not completely removed and instead hardened on the surface. This resulted in a higher pore distribution, which adversely affected the physical properties at the surface.
This work was supported by Kyonggi University Research Grant 2020.
- 1. S. English and W.E.S. Turner, J. Am. Ceram. Soc. 10 (1927) 551-560.
-

- 2. D.U. Tulyaganov, S. Agathopoulos, H.R. Fernandes, andJ. M. F. Ferreira, J. Eur. Ceram. Soc. 27[2-3] (2007) 1665-1670.
-
- 3. N.T. Selli, J. Ceram. Process. Res. 21[6] (2020) 632-639.
-
- 4. J.U. Hur, J.H. Kim, G.S. An, and S.C. Choi, J. Ceram. Process. Res. 21[2] (2020) 213-216.
-
- 5. G. Kayaa, B. Karasub, and A. Cakirb, J. Ceram. Process. Res. 12[2] (2011) 135-139.
-
- 6. W. Holand and G. H. Beall, “Glass-ceramic technology” (John Wiley & Sons, 2019).
-
- 7. R. A. Eppler and D. R. Eppler, “Glazes and glass coatings” (American Ceramic Society, 2000).
- 8. R.K. Brow, Inorganic glasses and glass-ceramics chapter 6 in characterization of ceramics. (Stoneham: Butterworth-Heinemann, 1993) p. 103-118.
- 9. R. Souag, N. Elhayet Kamel, D. Moudir, Y. Mouheb, and F. Aouchiche, J. Ceram. Process. Res. 23[3] (2022) 304-311.
-
- 10. D. Lee, H.S. Hong, H. Jeong, and S.S. Ryu, J. Ceram. Process. Res. 23[2] (2022) 149-153.
-
- 11. L. Deng, R. Jia, F. Yun, X. Zhang, H. Li, M. Zhang, and B. Li, Mater. Chem. Phys. 240 (2020) 122-212.
-
- 12. J. Cheng, Z. Xiao, K. Yang, and H. Wu, Ceram. Int. 39[4] (2013) 4055-4062.
-
- 13. Y.T. Huanga, W.C.J. Weia, and A.B. Wangb, J. Ceram. Process. Res. 22[3] (2021) 264-275.
-
- 14. M.G. Rasteiro, T. Gassman, R. Santos, and E. Antunes, Ceram. Int. 33[3] (2007) 345-354.
-
- 15. J.R. Taylor and A.C. Bull, Ceramics glaze technology. (Institute of Ceramics by Pergamon Press, 1986).
-
- 16. D.S. Sanditov and A.A. Mashanov, Glass Phys. Chem. 36 (2010) 41-44.
-
- 17. J.H. Park, ISIJ Int. 52[9] (2012) 1627-1636.
-
- 18. P. Colomban, A. Tournie, and L. Bellot‐Gurlet, J. Raman. Spectrosc. 37 (2006) 841-852.
-
- 19. D.H. Vogel, Z. Phys. 22 (1921) 645.
- 20. G.S. Fulcher, J. Am. Ceram. Soc. 8 (1925) 339-355.
-
- 21. G. Tammann and W. Hesse, Z Anorg Allg Chem. 156 (1926) 245-257.
-
- 22. F. Magrini, R. Ferrari, and P. Brunetti, Ceram. Inf. 171 (1979) 391-398.
-
- 23. M. Leśniak, M. Gajek, and J. Partyka, J. Therm. Anal. Calorim. 128 (2017) 1343-1351.
-
- 24. E. Neves, E.D. Poffo, M.C. Fredel, H.G. Riella, and O.E. Alarcon, Quim Nova. 21[4] (1998) 534-537.
-
- 25. M. Wang, J. CHeng, J. Li, and F. He, Phys. B 406[20] (2011) 3865-3869.
-
- 26. J. Cheng, Z. Xiao, K. Yang, and H. Wu, Ceram. Int. 39[4] (2013) 4055-4062.
-
- 27. J.A. Frenkel, J. Phys. (USS R) 9[5] (1945) 385.
- 28. J.K. Mackenzie and R. Shuttleworth, Proc. Phys. Soc. B 62 (1949) 833.
-
- 29. I. Kansal, D.U. Tulyaganov, A. Goel, M.J. Pascual, and J.M. Ferreira, Acta Biomater. 6[11] (2010) 4380-4388.
-
- 30. C.P. Martendal and A.P.N. de Oliveira, J. Therm. Anal. Calorim. 130 (2017) 1903-1912.
-
- 31. J. Marchi, D.S. Morais, J. Schneider, J.C. Bressiani, and A.H.D.A. Bressiani, J. Non-cryst. Solids 351[10-11] (2005) 863-868.
-
- 32. N. Umesaki, M. Takahashi, M. Tatsumisago, and T. Minami, J. Non-cryst. Solids 205 (1996) 225-230.
-
- 33. W. Guo, J. Wu, X. Liu, and J. Wang, Ceramics Int. 48[18] (2022) 25933-25939.
-
- 34. L. Chen, A. Ahadi, J. Zhou, and J.E. Ståhl, Procedia CIRP 8 (2013) 334-339.
-
 This Article
-
2023; 24(6): 926-934
Published on Dec 31, 2023
- 10.36410/jcpr.2023.24.6.926
- Received on May 19, 2023
- Revised on Dec 12, 2023
- Accepted on Dec 12, 2023
Services
- Abstract
introduction
experimental procedure
results and discussion
conclusion
- Acknowledgements
- References
- Full Text PDF
Shared
Correspondence to
- Seunggu Kang
-
Department of Advanced Material Engineering, Kyonggi University, Suwon, Korea
Tel : +82–31-249-9767 Fax: +82-31-249-9774 - E-mail: sgkang@kgu.ac.kr
Clean-Energy Research Institute(CRI), Hanyang University, 222, Wangsimni-ro, Seongdong-gu, Seoul, 04763, Korea
E-mail: jcpr@hanyang.ac.kr