


- Experimental investigation of vibrational isolation of automobile seat with various rubber materials
V. Pugazhenthia,*, S. Baskarb and R. Rajappanc
a Department of Mechanical Engineering, Mailam Engineering College, Mailam, Villupuram-604304, Tamilnadu, India
b Centre for Nonlinear Systems, Chennai Institute of Technology, Kundrathur, Chennai-69, Tamilnadu, India
c Department of Mechanical Engineering, Mailam Engineering College, Mailam, Villupuram-604 304, Tamilnadu, IndiaThis article is an open access article distributed under the terms of the Creative Commons Attribution Non-Commercial License (http://creativecommons.org/licenses/by-nc/4.0) which permits unrestricted non-commercial use, distribution, and reproduction in any medium, provided the original work is properly cited.
This research proposes a technique to reduce vibration transmission in vehicle seats by employing Silicon rubber and Neoprene rubber sheets of varying thicknesses between the seat base and seat mount. The aim is to optimize the acceptable vibration level and enhance vibration isolation. The study incorporates the latest advancements in the field of vibration transmission and the vibration properties of car seats. Various rubber sheets, including 3 mm and 4 mm of neoprene rubber, as well as 3 mm and 4 mm of silicone rubber, are mounted between the seat mount and seat base to act as a vibrating table. The research also examines current sensor technologies used to measure the transmission of vibrations from the car's base to the seat. Experimental investigations reveal that using a 4 mm Neoprene rubber sheet on the seat base minimizes transmissibility, resulting in an identified RMS Acceleration of 0.014889 km/s2, RMS Velocity of 6.62675 cm/s, and Displacement of 1.0625 mm. By considering the progress in new findings and the introduction of novel technologies, this research explores the future research directions in this field
Keywords: Vibration isolation, Transmissibility, Dynamic forces, Rubber mount, Optimization, Stiffness, Damping
Automotive seats must isolate vehicle seat vibration and stress that is transferred to the passengers while providing seating for people of a wide range of sizes for reasonably longer periods of time. A natural rubber sheet fitted between the car seat and its base has been introduced to suit these requirements. In order to reduce passenger stress while travelling, there are goals in place to improve the vibration isolation and performance of the seat. The car seat's vibration is a key component of the improvement. The seat transmits all vibration to the human body, which connect the human body to the vehicle, therefore research into seat vibration structures has become the center of desirability in all motorized and truck industries. Any vehicle's operator and passengers may encounter a variety of vibrations during operation and travel, the majority of which are caused by road surface irregularities. The typical range of frequencies at which a vehicle vibration is 0 to 80 Hz. Operators experience loss of focus, fatigue, and a decline in the efficacy of their work as a result. The Eigen frequencies of the human body is intimately connected to the vibrational discomfort frequencies for cars. According to studies, Vibration at low excitation frequencies is the most common cause of lumbago or backache (0.5-4 Hz), which negatively affects operators and travelers physical and mental health as well as their ability to work. These low-frequency vibrations cannot be isolated by the majority of passive suspensions found in standard seats. Vertical vibration at lower frequencies ensures effectively the most observable vibration in the human body, which influences the required car seat isolation system.
Problem Description
When the study effort first began, a vibrational issue was discovered. It is based on how the drivers and passengers, as fellow humans, have interpreted the problem area. The original formulation of the issue involved investigating the vibration of an automobile seat using an electrodynamic vibration shaker and presenting a vibration solution to dampen vibrations by mounting natural rubbers like neoprene rubber (CR) and silicone rubber (VMQ) mounted on a seat base (SB) with various rubber sheet thicknesses. Vibrations have an effect on the human body, the frequency and direction of the vibrations affect the human body, and the sensation of the vibration varies. The sensitivity is divided into horizontal and vertical directions by the frequency weighting, which is provided in ISO 2631. Both lateral and longitudinal accelerations use the horizontal sensory function. The human filter is depicted in ISO 2631 as a transfer utility with varied sensitivity levels on behalf of various frequencies. In a single-frequency vibrating system, the amount of pain felt can be calculated by multiplying the magnitude of the acceleration by the sensitivity weighting factor of the frequency.
When the direct correlation between vibration exposure levels and human health is considered, it is clear that ride comfort is entirely dependent on the frequency, amplitude, and exposure time length of the transmitted vibration. ISO 2631-1 describes frequency curves for single-degree-of-freedom system vibration. Human comfort is most affected by 5-8 Hz translational vibrations along the z-axis, 1-1.25 Hz translational vibrations along the x and y axes, and 0.8 Hz rotational vibrations around three axes. In maximum cases, putting natural rubber at the seat base (SB) is thought to be the best way to isolate vertical vibration, which has been demonstrated to have the highest vibration amplitude and impact on human luxury in automobiles.
Low-frequency vibrations can have negative effects on the human body, such as discomfort, fatigue, dizziness, and even potential health risks like musculoskeletal disorders. To address these vibrations, potential solutions include the use of vibration isolation techniques, such as resilient mounts or damping materials, ergonomic seat design, and the implementation of active vibration control systems to counteract and minimize the transmission of vibrations to the human body.
Materials and Methods
At the points where the seat base meets the floor and where it connects to the seat frame, measurements were carried out using FRF (Frequency Response Function) measurements. It was determined that using the "Sinusoidal" approach was the best way to obtain the FRF. In the sinusoidal approach, the input (stimulation) is applied to the structure using an electrodynamic vibration shaker as a vibration exciter, and the reaction is measured using an accelerometer. The FRF produced in this manner shows the extent to which the input will result in structural vibration. Nearly all of the values in FRF graphics match the resonance frequency. The information on the different rubber sheets applied between the car seat and exciter table was obtained by comparing the obtained FRF. These sites were chosen as the stimulation implementation points during measurement. Because, the seat will be stimulated at the point where it connects to the base. It was found that the connection points between the exciter table and the seat's construction are response sites where passengers will directly feel floor vibrations. The data from the seat and exciter table was obtained using two vertical axis accelerometers. According to the application guidelines, the automobile seat to be tested must be positioned on a vertical platform of a vibration shaker with movements in the vertical direction (ISO 8041). And, the material properties are followed by ASTM Standards. The mounting platform's size must be huge enough to support the seat strongly. Seat vibration tests are including measurements that compare the effects of such vibrations on the body transported in a seat to the effects of such vibrations on various thicknesses of rubber sheets mounted on the seat base (SB).
To enhance vibration isolation from the vehicle's chassis to the seat, five vibration isolation principles were applied to the testing of automobile seats. To Active vibration control systems, namely, 3 mm Neoprene rubber (CR3), 4 mm Neoprene rubber (CR4), 3 mm Silicone rubber (VMQ3), and 4 mm Silicone rubber (VMQ4). An accelerometer is used to measure the frequency, force, displacement, acceleration, and other vibration-related characteristics in active control of vibration. Mechanical components are used to dampen unwanted vibrations in passive vibration control, which uses no power, no sensors, and no actuators [1-6].
The vibration and noise characteristics in rubber engine mounts examining the performance of different rubber materials and designs in reducing vibrations and noise transmitted from the engine to the vehicle structure. The study provides valuable insights for the development and optimization of rubber engine mounts to enhance vehicle comfort and reduce noise levels [7]. The Experimental study on driver seat vibration characteristics focuses on investigating the vibration characteristics of the driver seat in a crawler-type combine harvester. The study contributes to the field by presenting experimental findings on seat vibration and serves as a valuable reference for future studies aiming to improve the design and performance of agricultural machinery seats [8].
Research Contribution
The research proposes a technique for reducing vibration transmission in vehicle seats by incorporating silicon rubber and neoprene rubber sheets of varying thicknesses between the seat base and seat mount. Experimental investigation demonstrates that mounting a 4 mm neoprene rubber sheet significantly minimizes vibration transmission, resulting in reduced RMS acceleration, RMS velocity, and displacement values. The study also highlights the future direction of research in this field, considering advancements in sensor technologies and the introduction of new technologies for improved vibration isolation in vehicle seats.
Dynamics Vibrational Systems
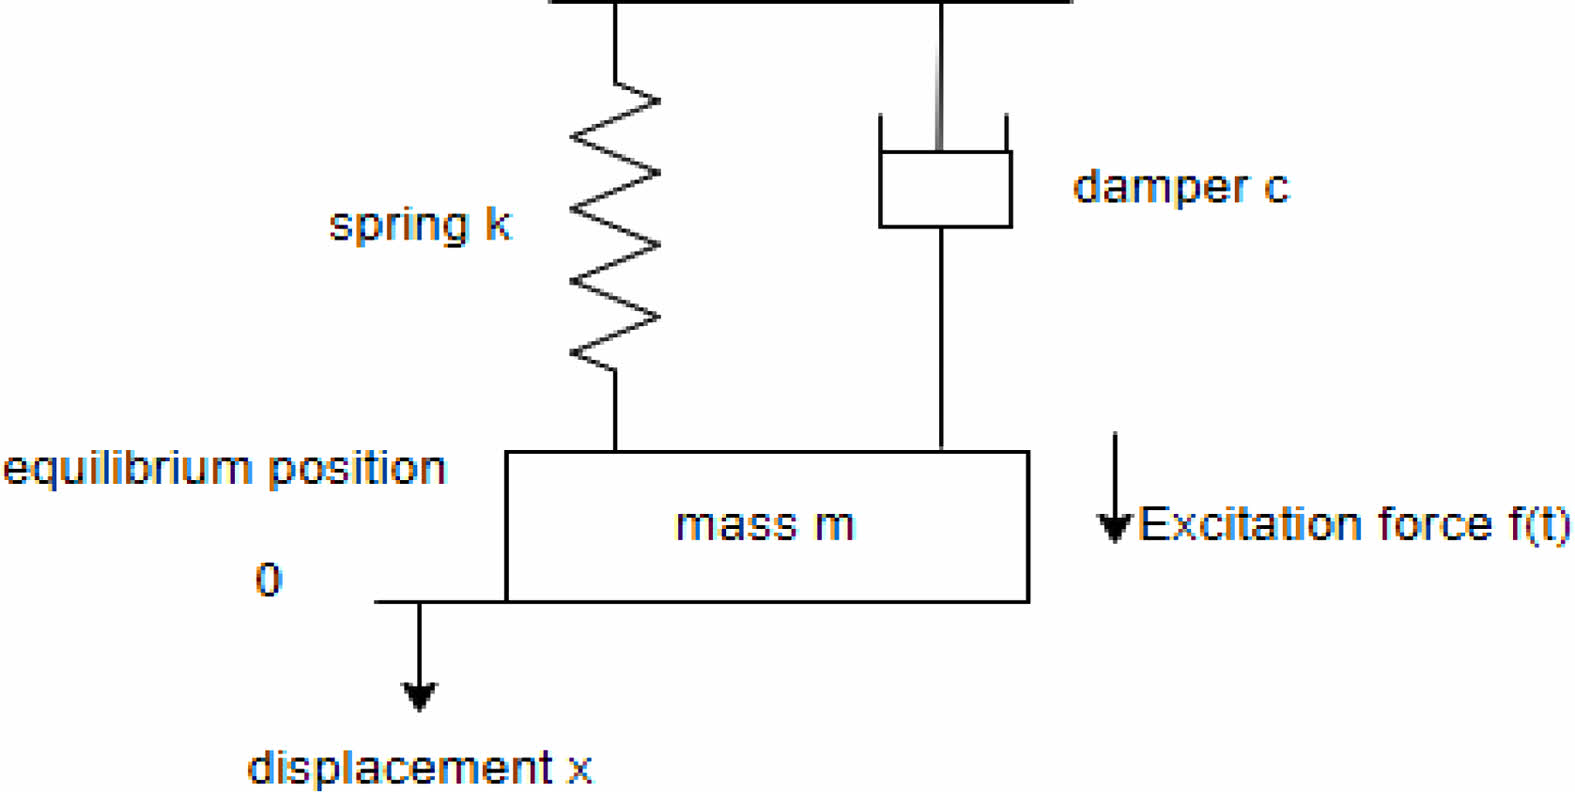
In a vibration isolation system, the damper and spring play vital roles. The spring provides the system with stiffness, supporting the weight and absorbing shocks, while the damper dissipates energy, reducing the system's oscillations and providing damping. These components work together to control vibration amplitudes, enhance stability, and improve the overall performance of the system by reducing vibrations transmitted to the seat. A mechanical system that vibrates back and forth in respect to an equilibrium position is said to be vibrating. If vibrations are to be produced, a mechanical structure is required; without a mechanical coupling, the vibrations cannot move. Fig. 1, which illustrates the components of a vibratory system as single degree of freedom, demonstrates the mass, damper, spring, and excitation. SDOF designates that just one direction of movement is permitted for the structure, and all other directions are locked. When the mass in the system is exposed to the excitation force, the displacement modifies and oscillation is produced. The mass is a rigid body that causes vibrations in the system, loses or gives kinetic energy to produce movements that can be expressed as displacements in units of meter, speeds in units of seconds, or accelerations in units of m/sec. Newton's second law of motion states that the acceleration of an object is directly proportional to the net force applied to it and inversely proportional to its mass. This law provides a quantitative relationship between force, mass, and acceleration, emphasizing that a larger force or smaller mass will result in greater acceleration.
Newton's second law of motion states that force equals weight multiplied by acceleration. Looking at eq. (1).

The variables are as follows:
f(t) = Force applied
m = mass [kg]
c = coefficient of viscous damping [Ns/m]
k = stiffness [N/m]
u = displacement [m]
ii = acceleration [m/s2]
v = velocity [m/s]
The damper ‘c’ exists only when a force is applied to the opposing force at the opposite spectrum and the damper's coefficient is expressed in force per unit velocity. Its role is to convert the system's created energy into thermal energy; it lacks both mass and flexibility. When the spring K is deformed in extension or compression, it exists. It is proposed to deform elastically in order to absorb or store energy. To demonstrate a second-order linear differential equation with constant coefficients, deliberate the following Eq. (1) can be rewritten as Eq. (2). In Fig. 1, the components of a vibratory system are illustrated.
Transmissibility
The amount of vibration that is transferred between two systems is known as transmissibility, which also determines whether vibrations should be isolated or dampened. Therefore, a system's transmissibility reflects how well the system's attenuation is working. The weight to which the isolator is exposed determines the solution. Furthermore, the isolator's stiffness and damping coefficient are compared to the frequency of the system disturbance (fd). Resonance can be computed using Eq. (3) and occurs when the frequency of the isolation system (fn) and the disturbance system's input are equal to one, or when the system's frequency matches the isolator's natural frequency. Depending on the frequency of the system, vibrations might either increase or decrease. Choosing the appropriate suspension for a given system is crucial. This is incorrect for viscoelastic materials, which are non-linear because it is predicated on linear characteristics.

Resonance can be determined by using the equation:

where m is the mass of the system and k is the stiffness of the isolation system. If the frequency of the disturbance system matches the resonant frequency of the isolation system, resonance occurs, leading to increased vibration transmission and potential amplification of vibrations.
Root Mean Square (RMS)
The root mean square of the instantaneous values over a specified time period. It has to do with the power of the wave. One of the crucial elements for determining the condition of machinery is the RMS value of velocity shown in eq. (5).
Basic evaluation technique utilizing acceleration of weighted root-mean-square
The weighted root-mean-square acceleration specified in this sub clause, must always be measured as part of the vibration evaluation performed in accordance with this section of IS0 2631. For rotational vibration, Radians per second squared is the unit used to express the weighted root mean square acceleration (rad/s2), while translational vibration is expressed in meters per second squared (m/s2). The weighted root mean square acceleration must be calculated using the equation below (Refer to eq. (6)) or its frequency domain equivalent.

Where aw(t) is the weighted acceleration as a function of time, expressed in m/s2 or rad/s2, and T is the measurement's duration in seconds.
The suitable weighting curve must be chosen and applied along with the relevant k factor (a scaling factor), which has a value of 1.4 for the X and Y directions and a value of 1.0 for the Z direction, when this equation is applied to each measurement location as per standard of IS0 2631-1.
Seat Effective Amplitude Transmissibility (SEAT)
The SEAT value is the ratio of the vibration generated on top of the seat to such vibration generated when sitting directly on the vibrating floor. SEAT value is defined as follows:
Whereas the weighted Root Mean Square can be used to represent weighted vibration on the seat and weighted vibration on the floor (RMS).
The effectiveness of a seat's ability to isolate vibration has frequently been assessed using SEAT values. SEAT ratings can be used to assess a seat's ability to dampen vibrations from floor. It is a non-dimensional measurement of a seat's ability to isolate the body from shock or vibration. SEAT value more than 100% shows that the seat has made the vibration more uncomfortable, whereas SEAT value less than 100% indicates that the seat has reduced the amount of vibration or provides valuable isolation. SEAT value can also be determined using the ISO 2631-recommended frequency-weighted RMS accelerations. Seat effective amplitude transmissibility is used to assess benefits and to better understand the damping characteristics of seating systems in real-world settings. The SEAT% experimental analysis is conducted on car seats. SEAT values were obtained by introducing the analyzer's post-processed data for the rubber materials mounted on the seat's base. The "Accelerometer (Control) on the seat" represents the integral of frequency felt on the seat, whereas the "Accelerometer (Input2f) on the vibrating table" represents the integral of frequency felt on the vibrating table. Eq. (7) can be explained using a basic understanding of integrals as the ratio of the area under the acceleration graph on the seat to the acceleration graph on the vibrating Table [9-15].
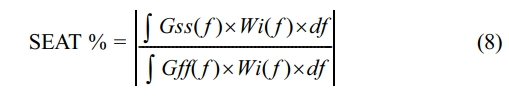
Where Gss( f ) and Gff( f ) are the power spectral densities of the seat and floor, including both, and Wi( f ) is the frequency weighting for the human reaction to vibration.
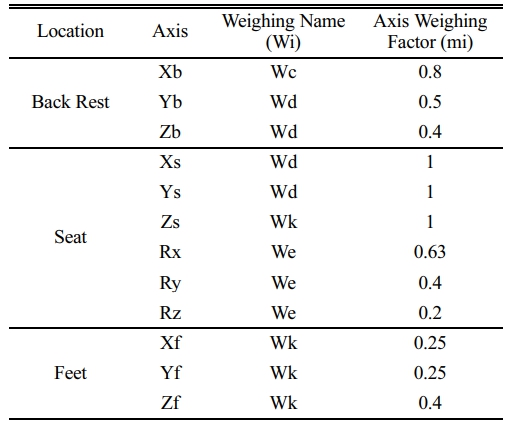
Frequency Weighing for Automobile Seat:
According to ISO 2631-1, frequency weighing Wb(f) for an automobile seat in the "Z" axis is considered "Wk" =1. (Refer to Table 1).
|
Fig. 1 A Vibratory System's Component Parts. |
An experimental analysis carried out on an Electrodynamic Vibration Shaker Machine (Model: DS – 300). Electrodynamic Vibration Shaker is used to generate sinusoidal signals during laboratory tests. Due to safety concerns, a mass system (consisting the fixture, moving coil, vertical slip table, and car seat) with a dead load weight limit of up to 50 kg was used in the lab test. The frequency was increased for this test from 5 Hz to 100 Hz.
1. Electrodynamic Vibration Shaker (Model: DS – 300),
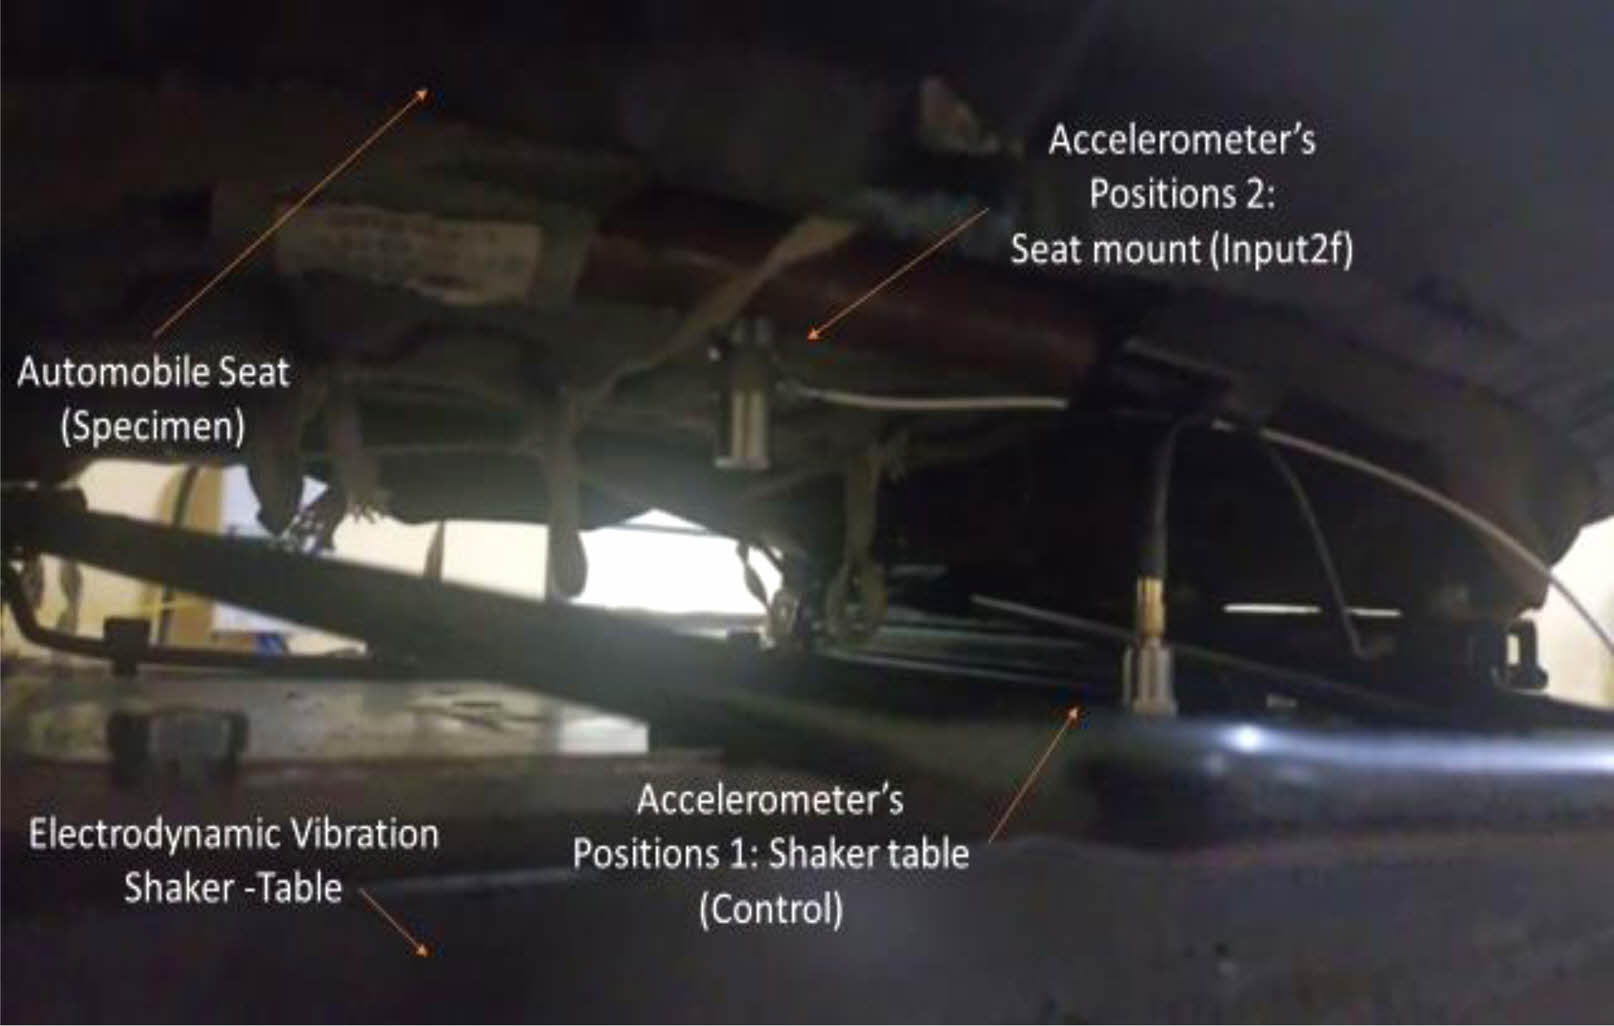
2. Two accelerometers:
- Accelerometer’s Positions 1(Referred as control): Seat Base (SB) as Shaker table, (1 No.)
- Accelerometer’s Positions 2(Referred as Input2f): Seat mount (SM), (1 No.)
3. Vibration Controller (Model: UCON VT-9004),
4. Digital Switching Power Amplifier (Model: PA – 300),
5. Computer System (PC i7, 4GB RAM, 500GB HDD),
6. Cooling Blower,
7. Automobile Seat (Specimen).
8. Rubber Materials [Silicon Rubber (VMQ) and Neoprene Rubber (CR)]
While the accelerometer (Input2f) installed on the seat base (SB) offered output data, the accelerometer (control) installed on the seat mount offered input data (SM) as vibrating table. The results of the acceleration tests are reported according to the various testing setups. The output graphs showed displacement, velocity, and accelerations in relation to frequency.
Reference Spectrum of Acceleration
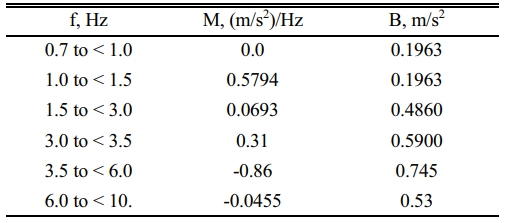
The testing of automobile seat were performed using an acceleration spectrum. The sine test program can define a test spectrum in units of acceleration. The spectrum was constructed to produce accelerations at levels as great as possible without having the DS-300 vibration shaker exceed its stroke limits. For programming purposes, the acceleration reference spectrum was defined using a combination of constant slope segments.

Where,
A = acceleration (m/s²),
M = slope [(m/s²)/Hz],
f = frequency (Hz),
B = acceleration intercept (m/s²), and
f* = upper frequency limit of the previous band or the lower limit of the current band.
Where, M = slope [(m/s²)/Hz],
f = frequency (Hz),
B = acceleration intercept (m/s²),
The parameters of the employed acceleration test spectrum of eq. (8) are given in Table 2 with the resulting spectrum shown in Fig. 2 & 3. This spectrum functions as a reference spectrum for the UCON VT-9004 vibration control system. The variance between the reference and measured test spectrums on the shaker table generates an error spectrum for updating the drive control. An actual test spectrum measured at the base of the seat (Accelerometer named as Input2f), and shaker’s table (Accelerometer named as control), is shown in Fig. 2 & 3 [15-21].
|
Fig. 2 Automobile Seat Mounting and Accelerometer sensor |
The vibration test for an automobile seat was performed five times, with each repetition considered a run. A single linearly increasing frequency sweep was used in each test run. The swept frequency range was 5 to 100 Hz. The sweep time per run was 5 minutes, with a sweep rate of 1 Oct/Min (0.01549 Hz/s). A startup time of 5 minutes was used to equalize the system. The startup was performed at 5 Hz, with the acceleration amplitude gradually increasing to full test level. During the tests, a total of 2500 acceleration values for the Vibrating table and seat-base were recorded. At each test, the signal (i.e. test period) in the Electrodynamic Vibration Shaker is 5 minutes. Including material replacement and seat setup, as well as any delays, the average setup time has been 20 minutes. The seat had to be mount again after each modification. As time passed, it was only necessary to add or change material combinations.
The challenge has been to keep all of the configurations in the same position throughout the tests. Rubber materials, two accelerometers, and an automobile seat must be placed in a specific position in order to achieve optimal vibration. The position with the rubber mounting in the automobile seat base presented a significant challenge when compared to other reference size differences in the dimensions of the rubber sheet. The test generated a list of optimum vibrational results, which could then be further evaluated and tested with the appropriate measurements. The test's goal was to run as many various rubber sheet materials and thickness groupings as possible in order to generate a few options that could be further evaluated. This was a sorting phase to determine which materials had the best thickness and material properties [22-29].
Dominant Frequency Analysis and evaluation
According to the experiment analysis, the automobile seat was taken through the electrodynamic vibration shaker up to a load of less than 50 kg, which included the fixture, moving coil, vertical table, and specimen (Automobile seat). Acceleration data is obtained from two accelerometers located at the shaker table (Accelerometer named as control) and seat base (SB) (Accelerometer named as Input2f), respectively. The dominant frequency and transmissibility gains are calculated using frequency weighted acceleration data, and the frequency weighted velocity and displacement data are observed [30-41].
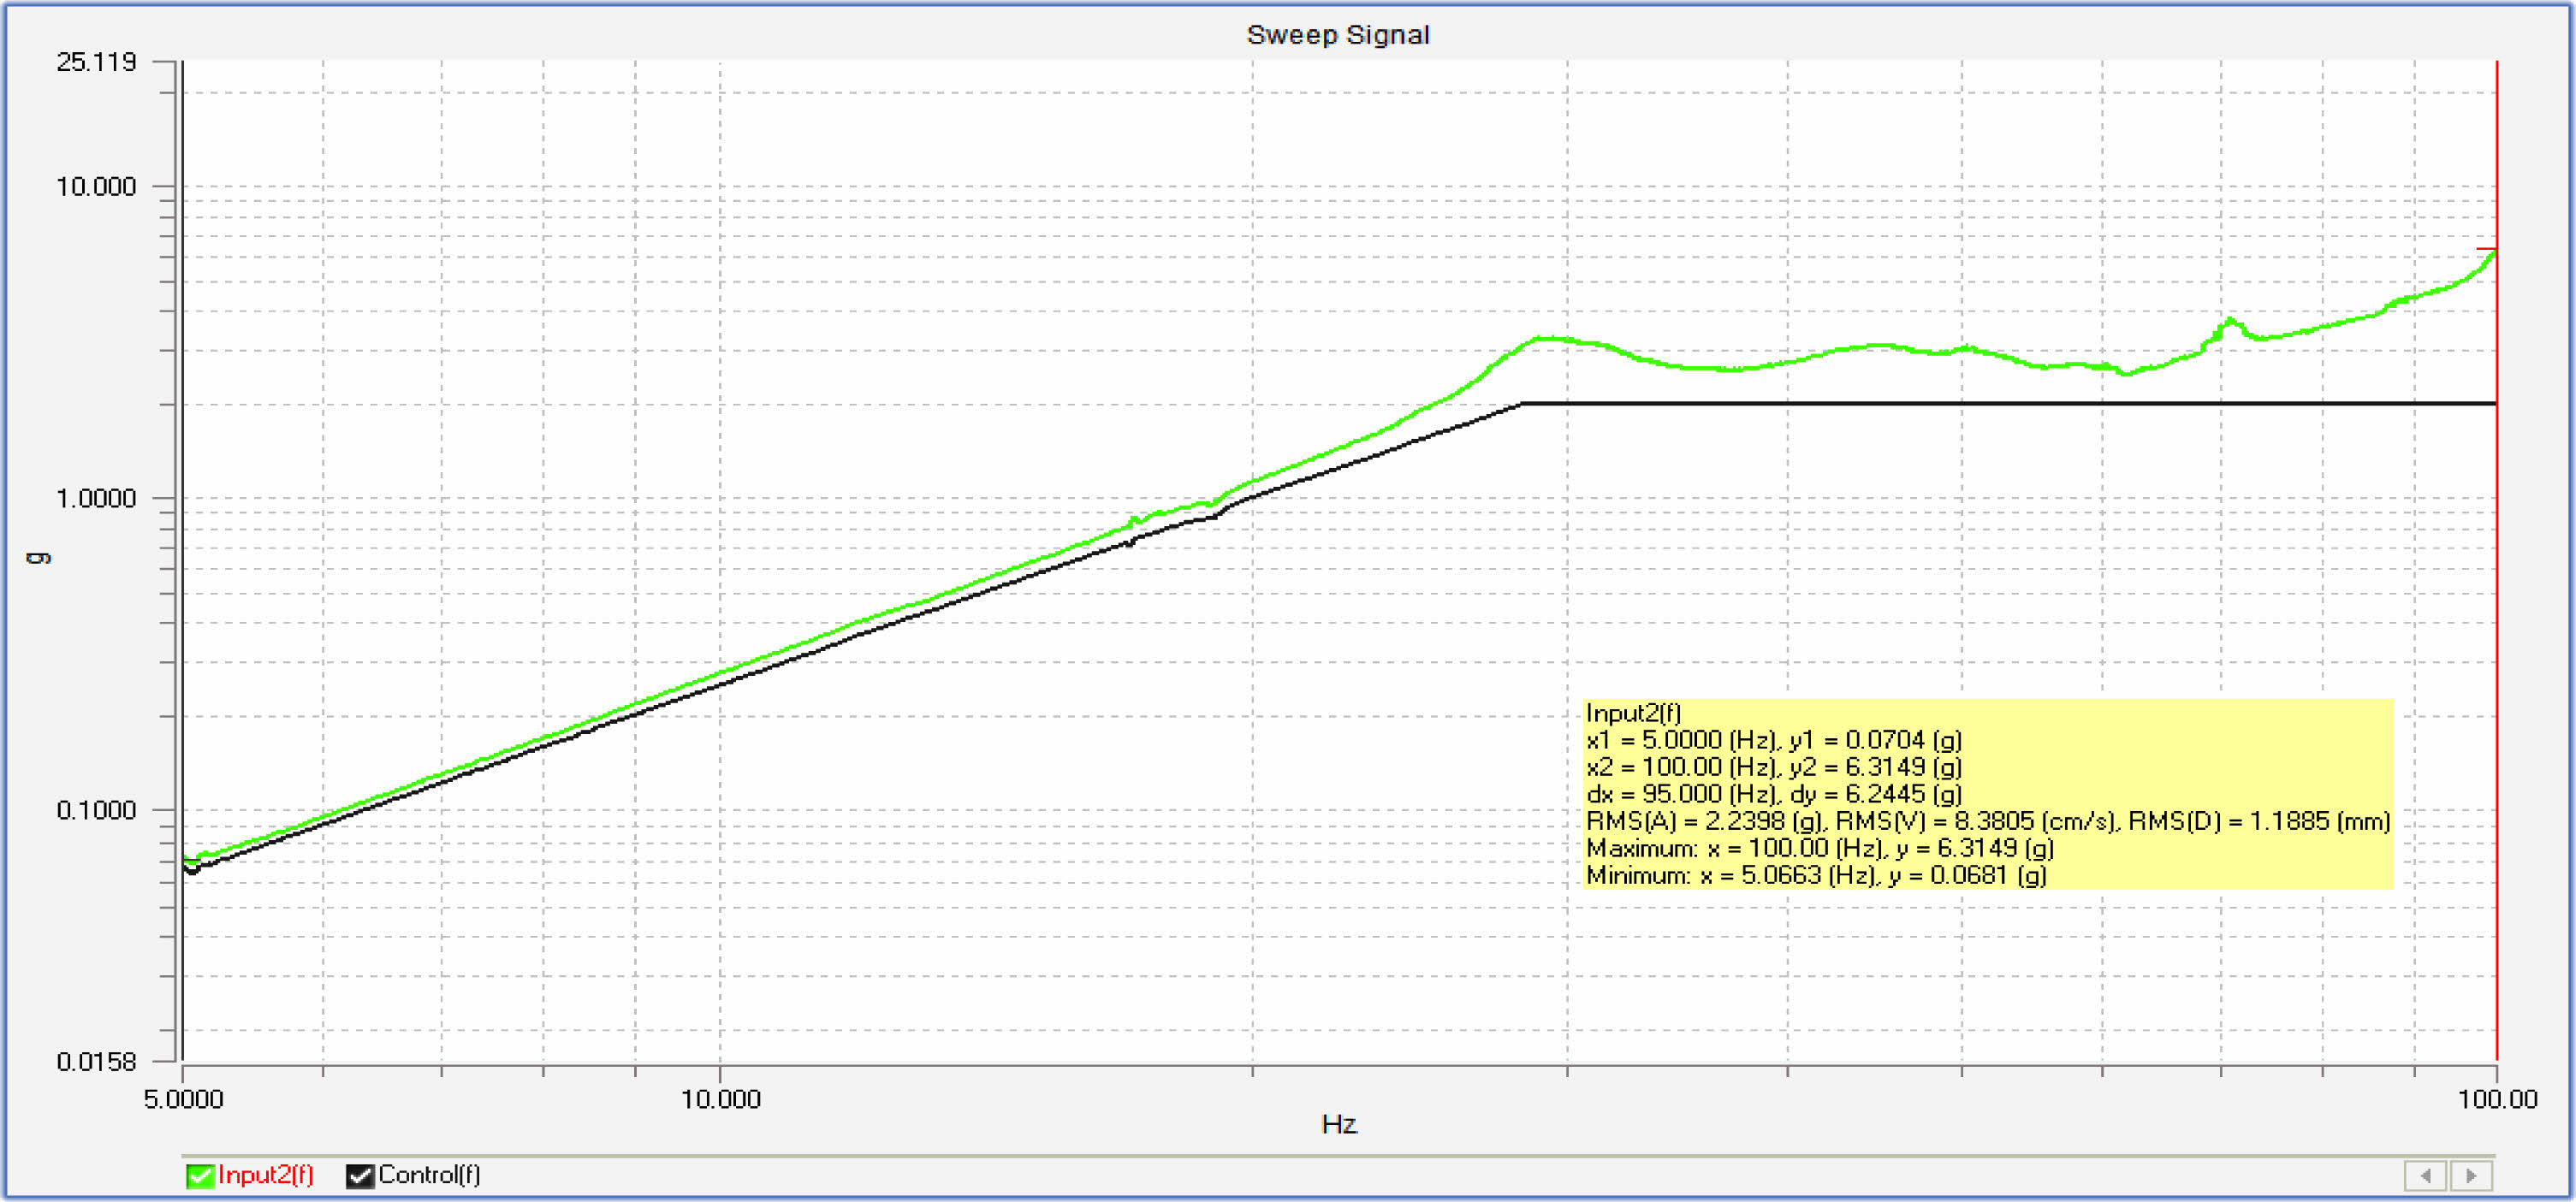
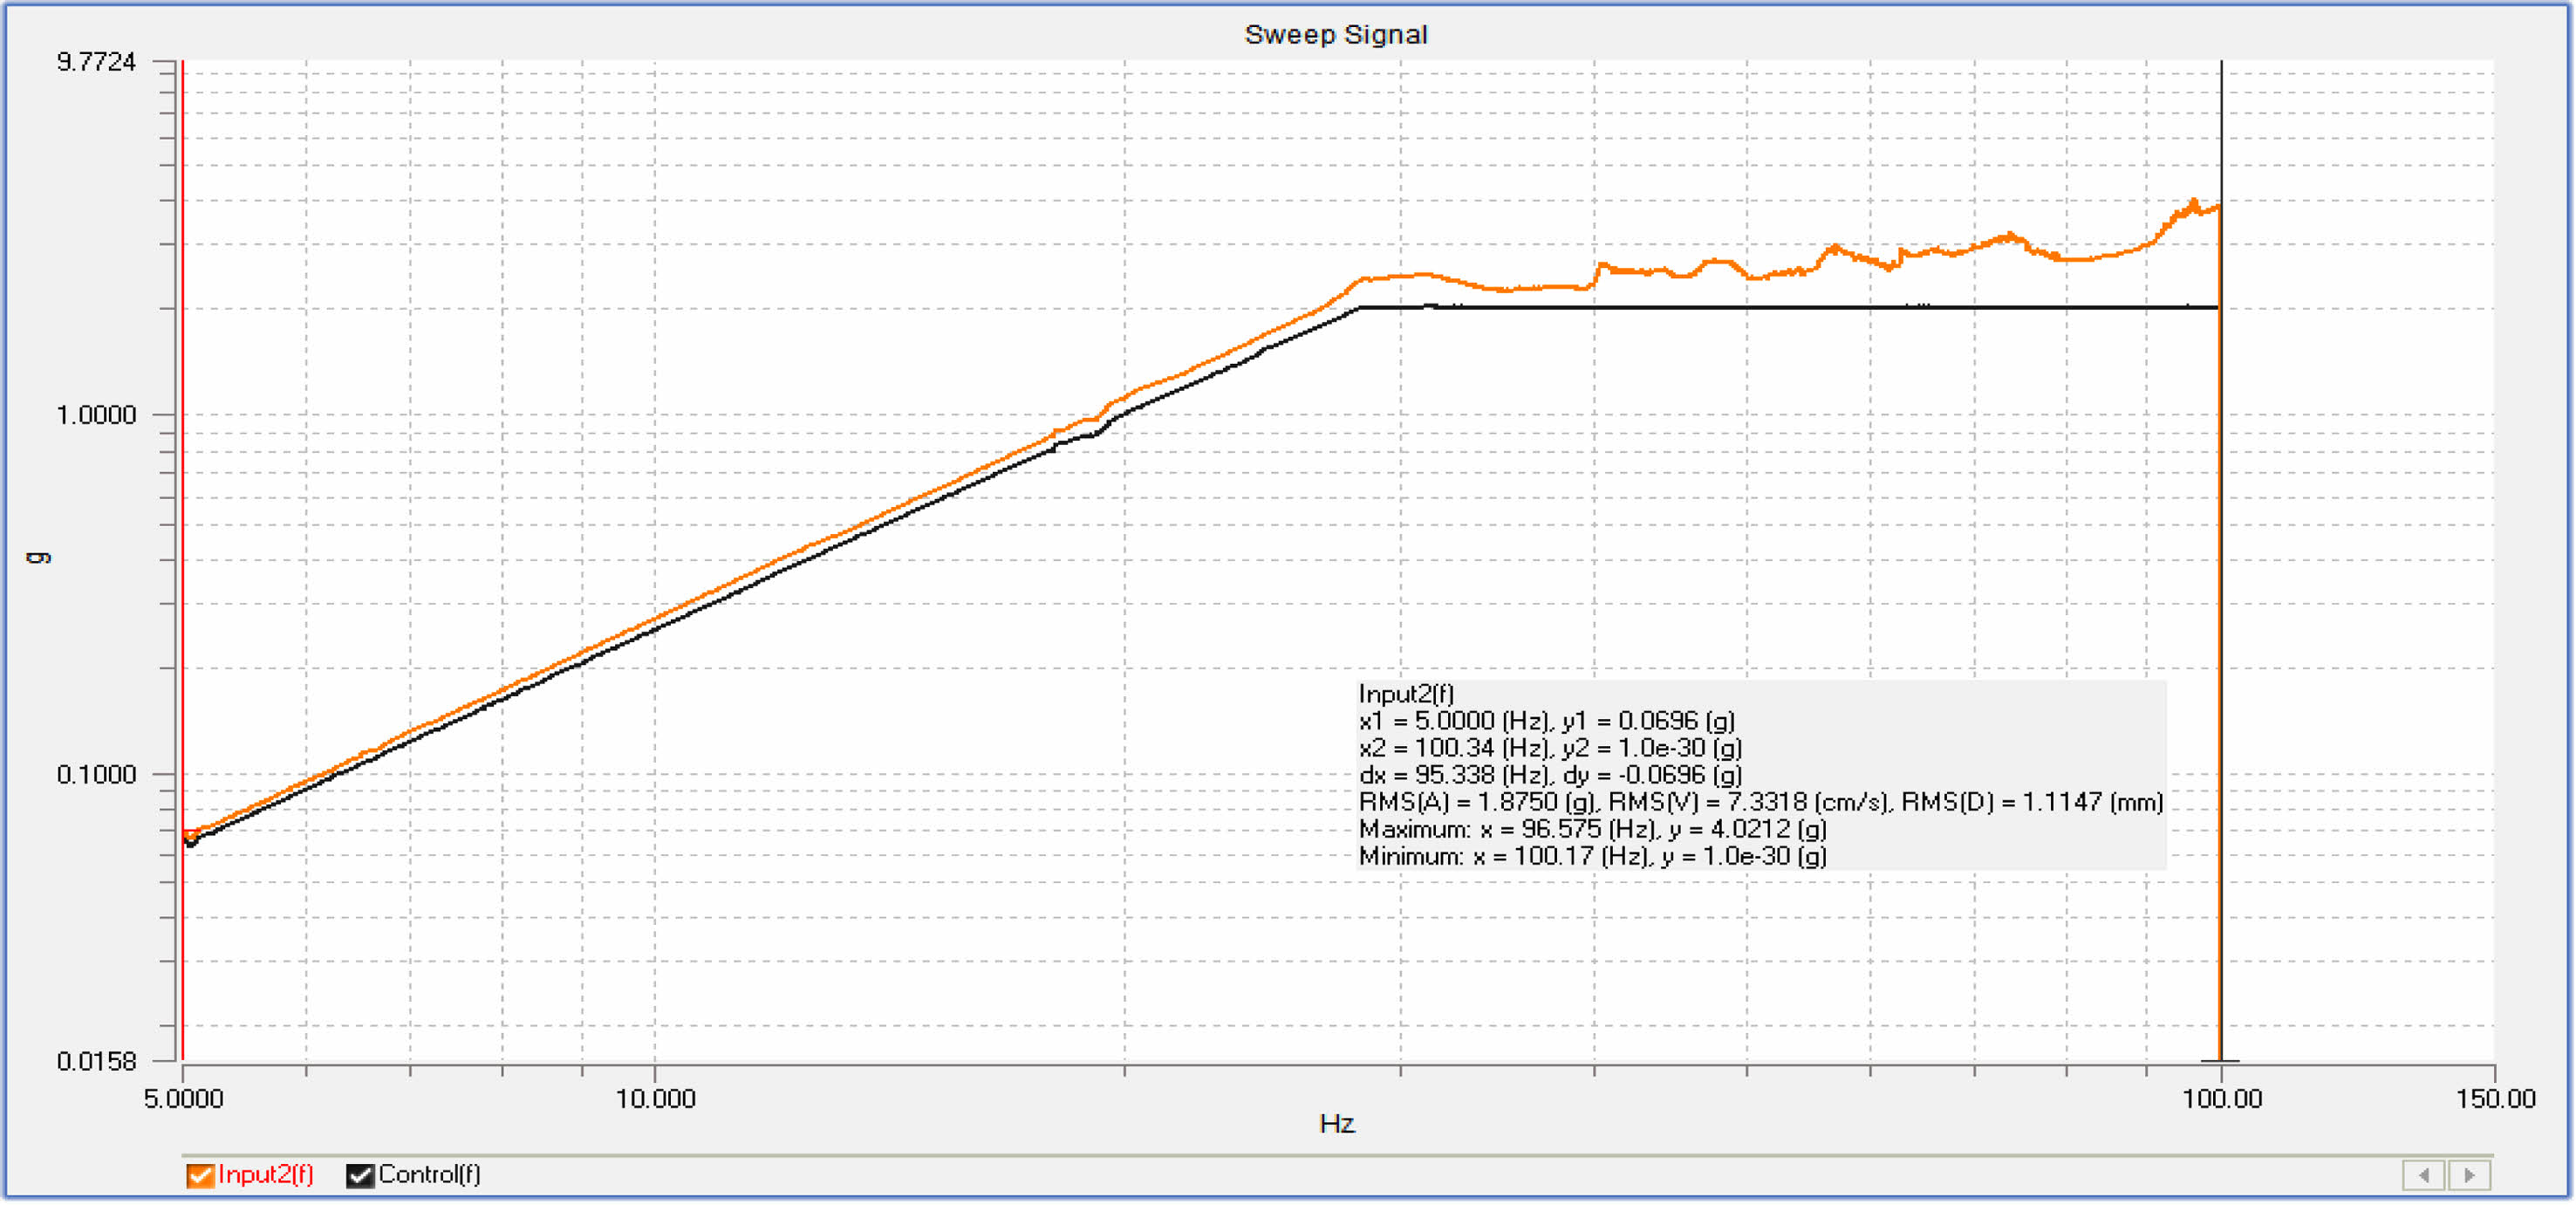
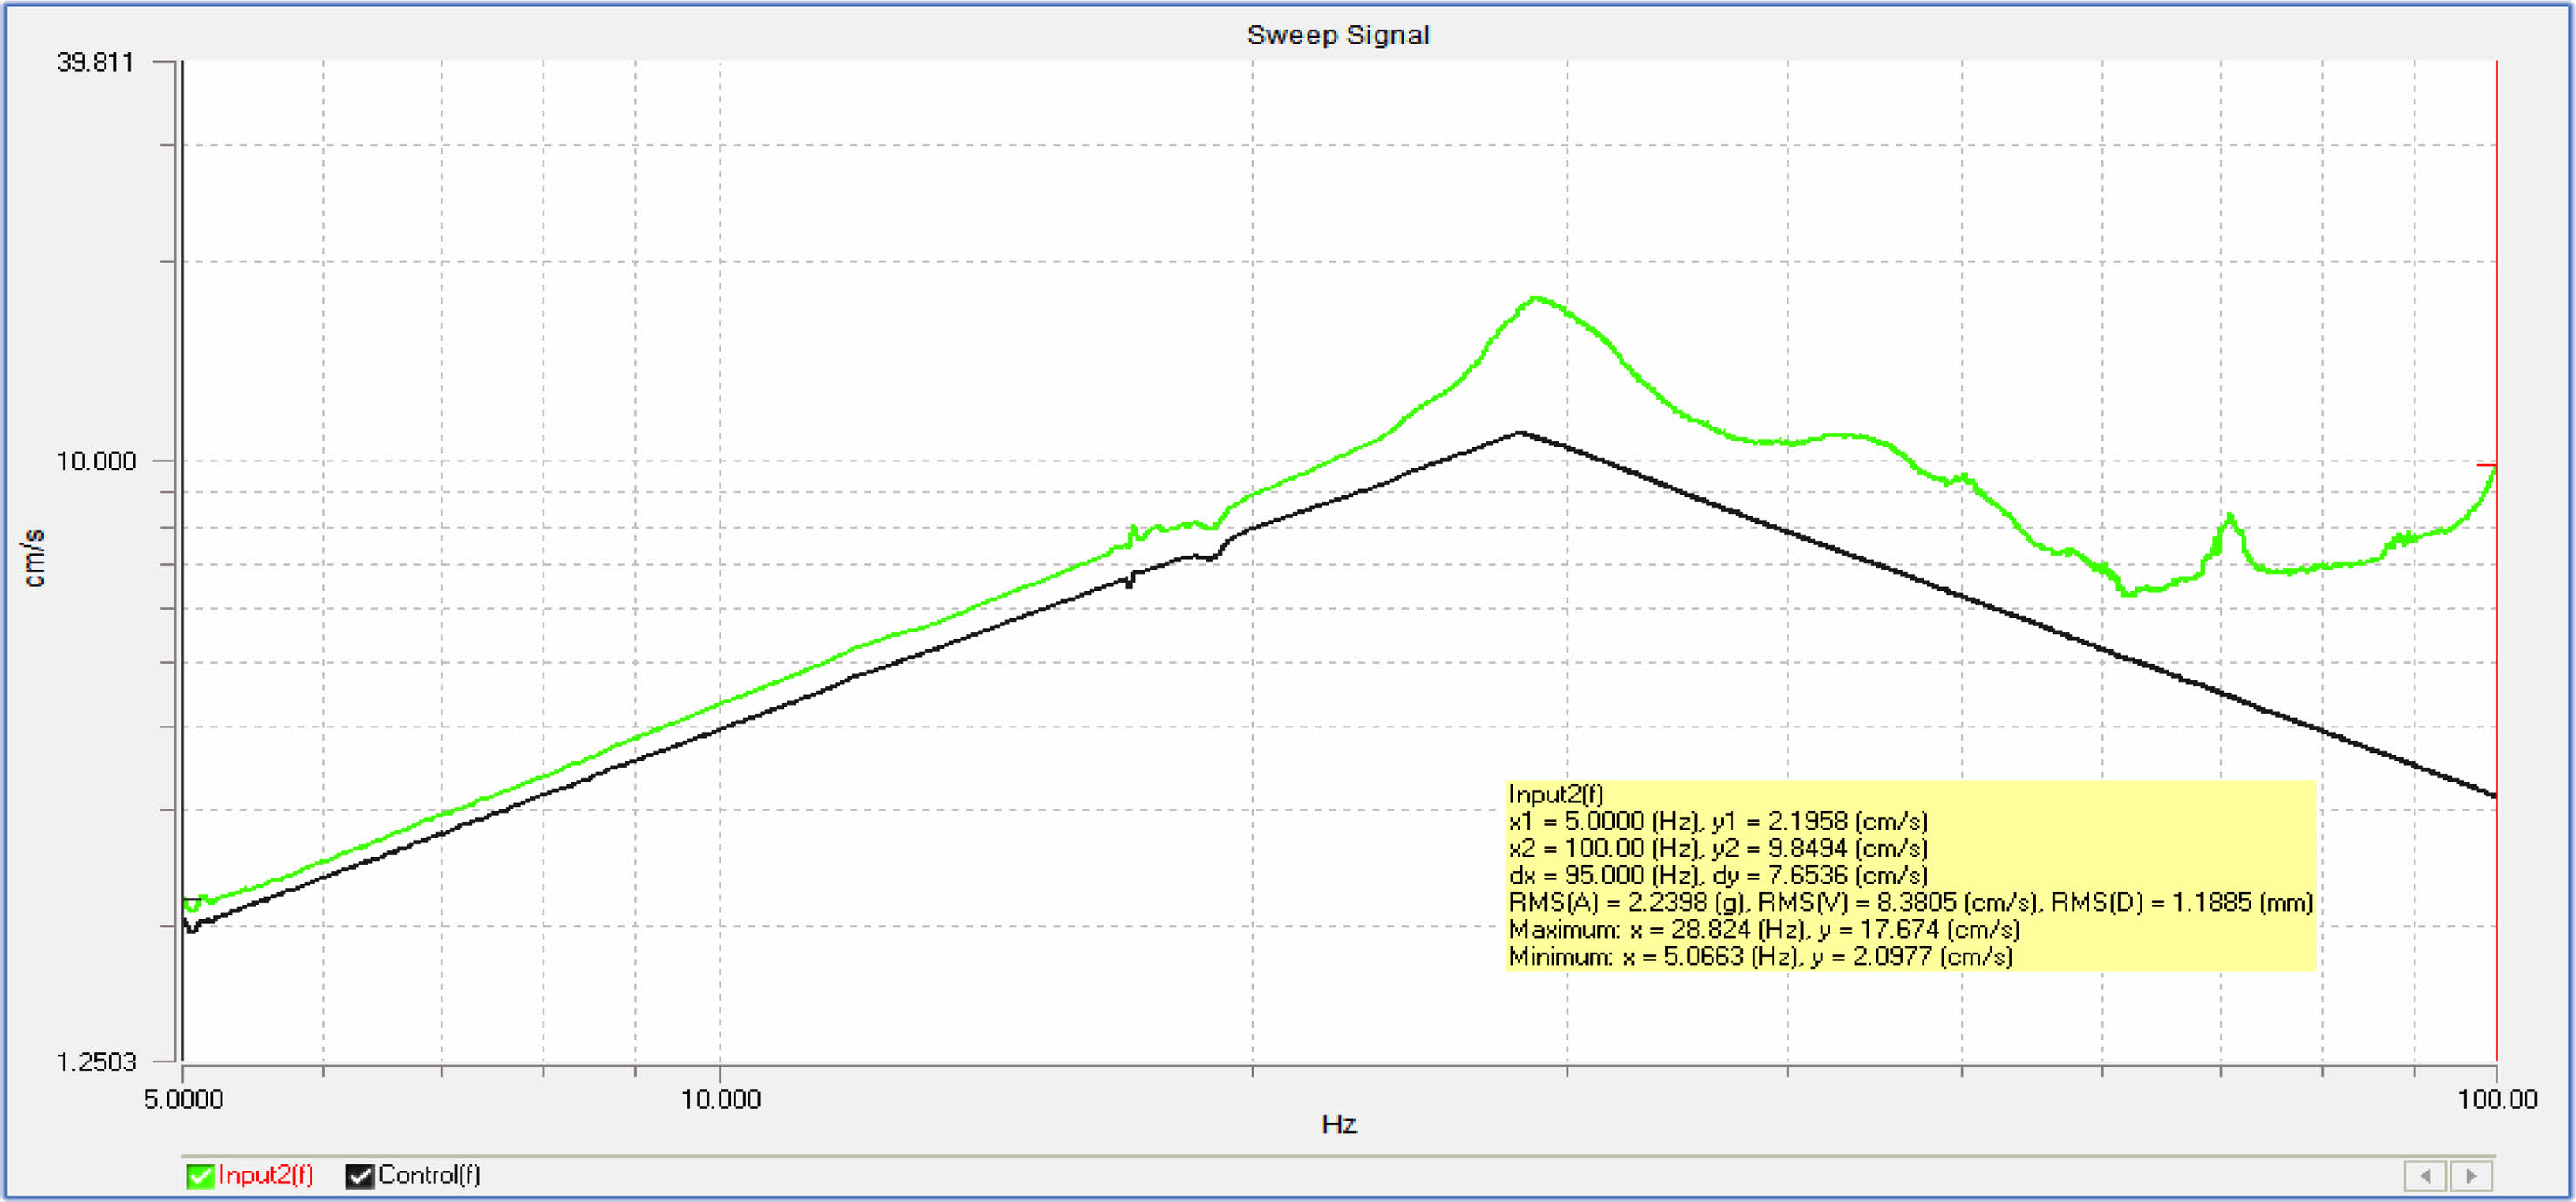
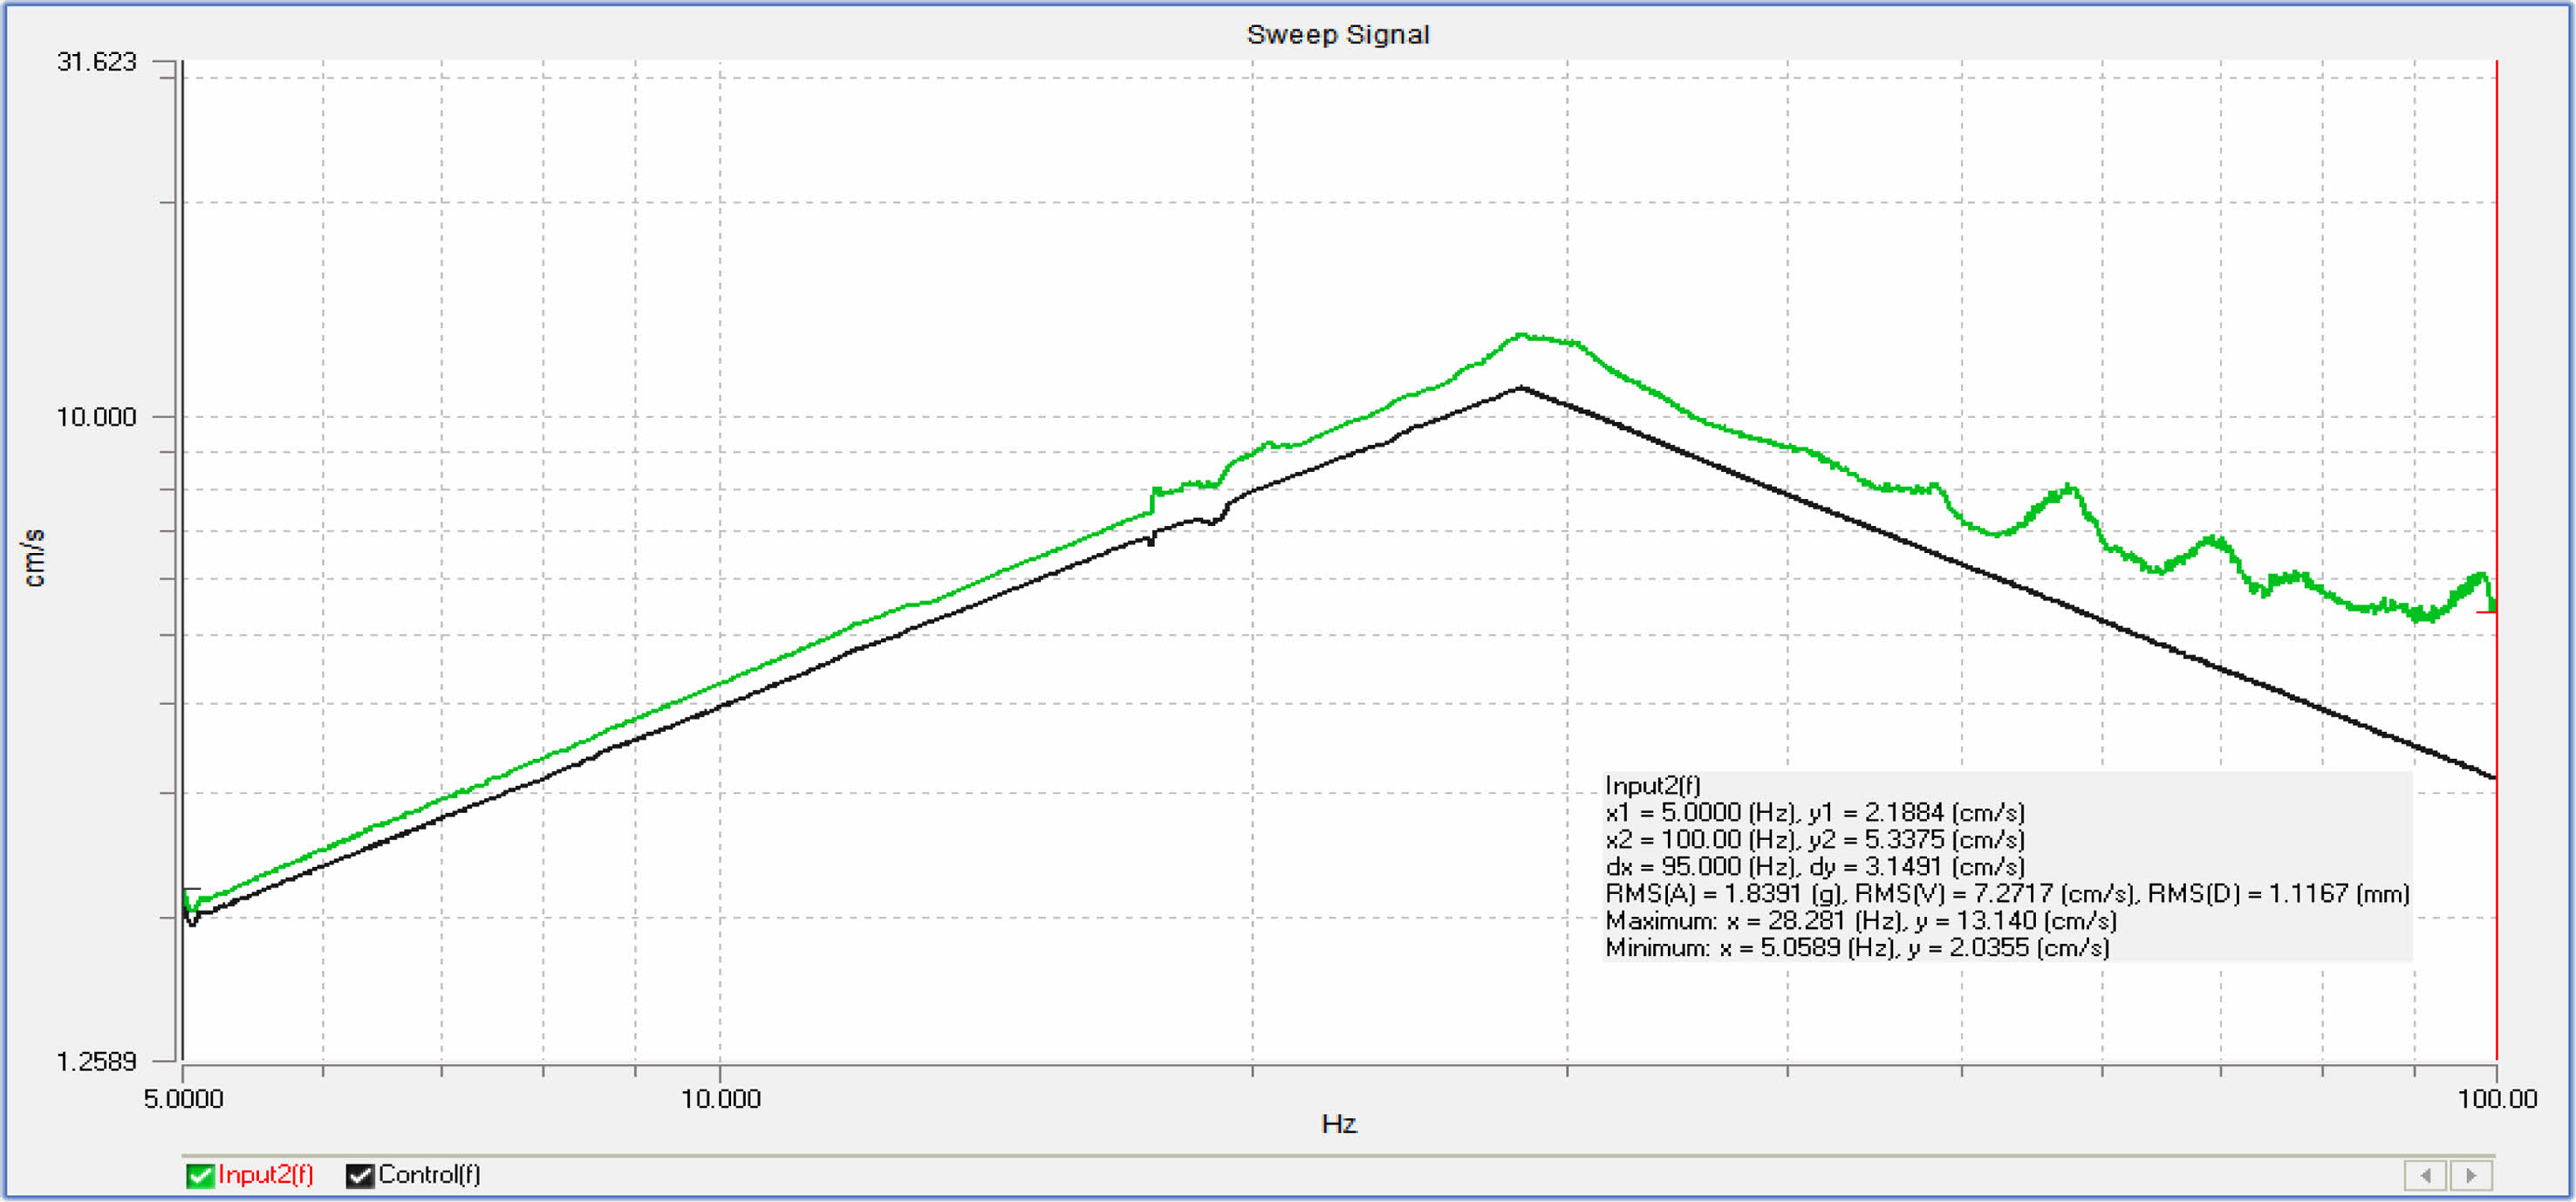
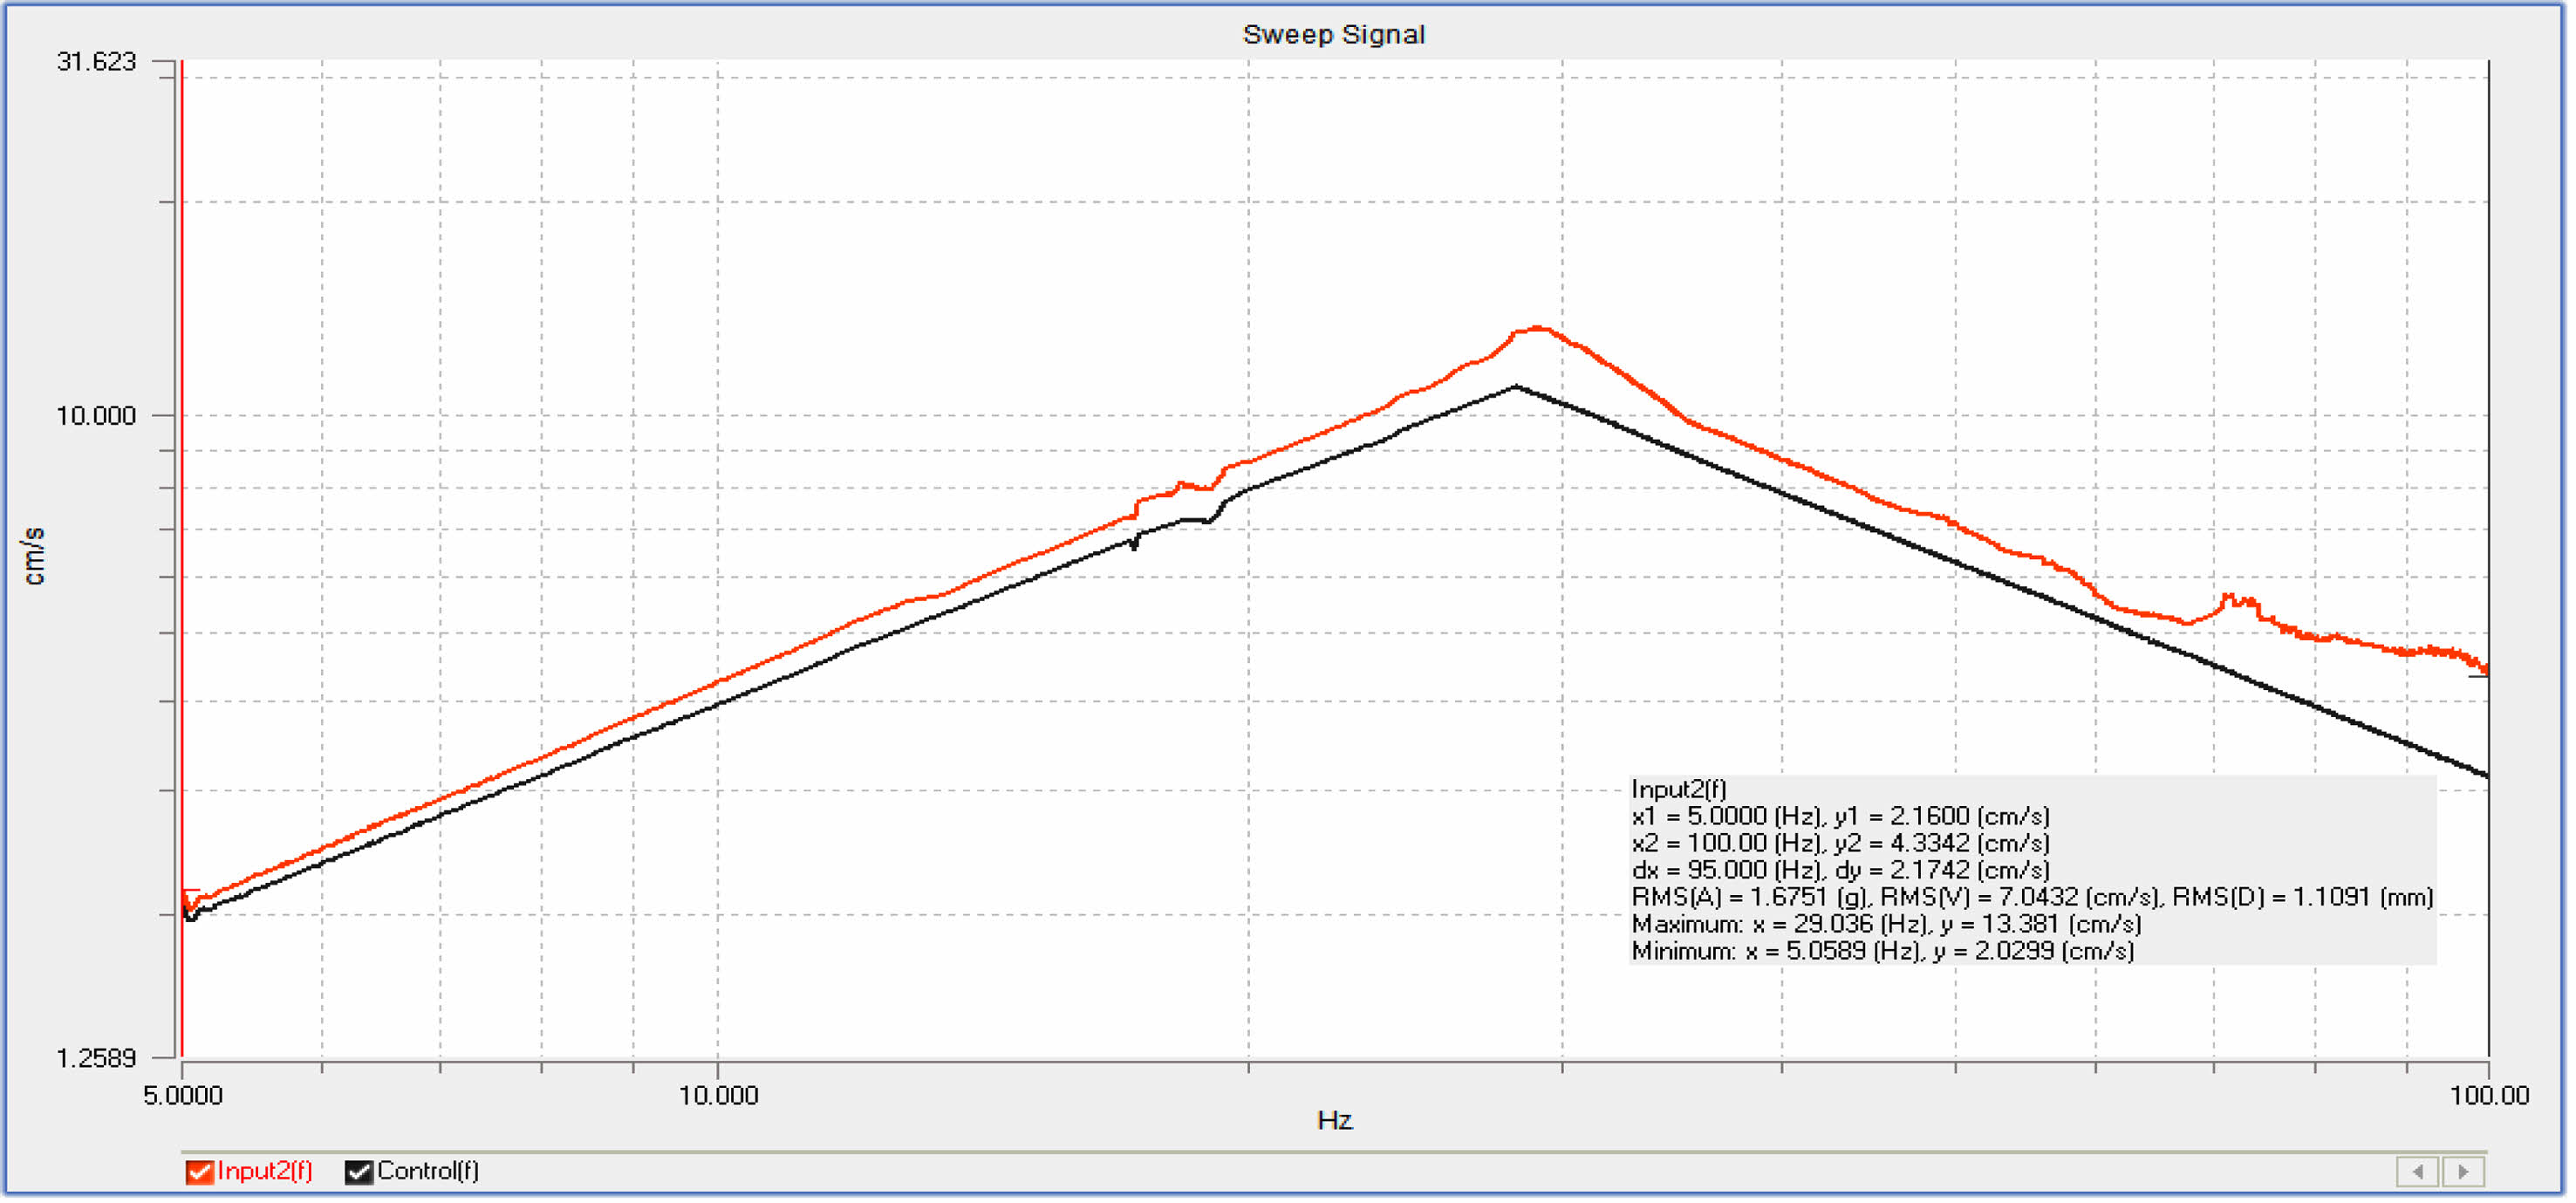
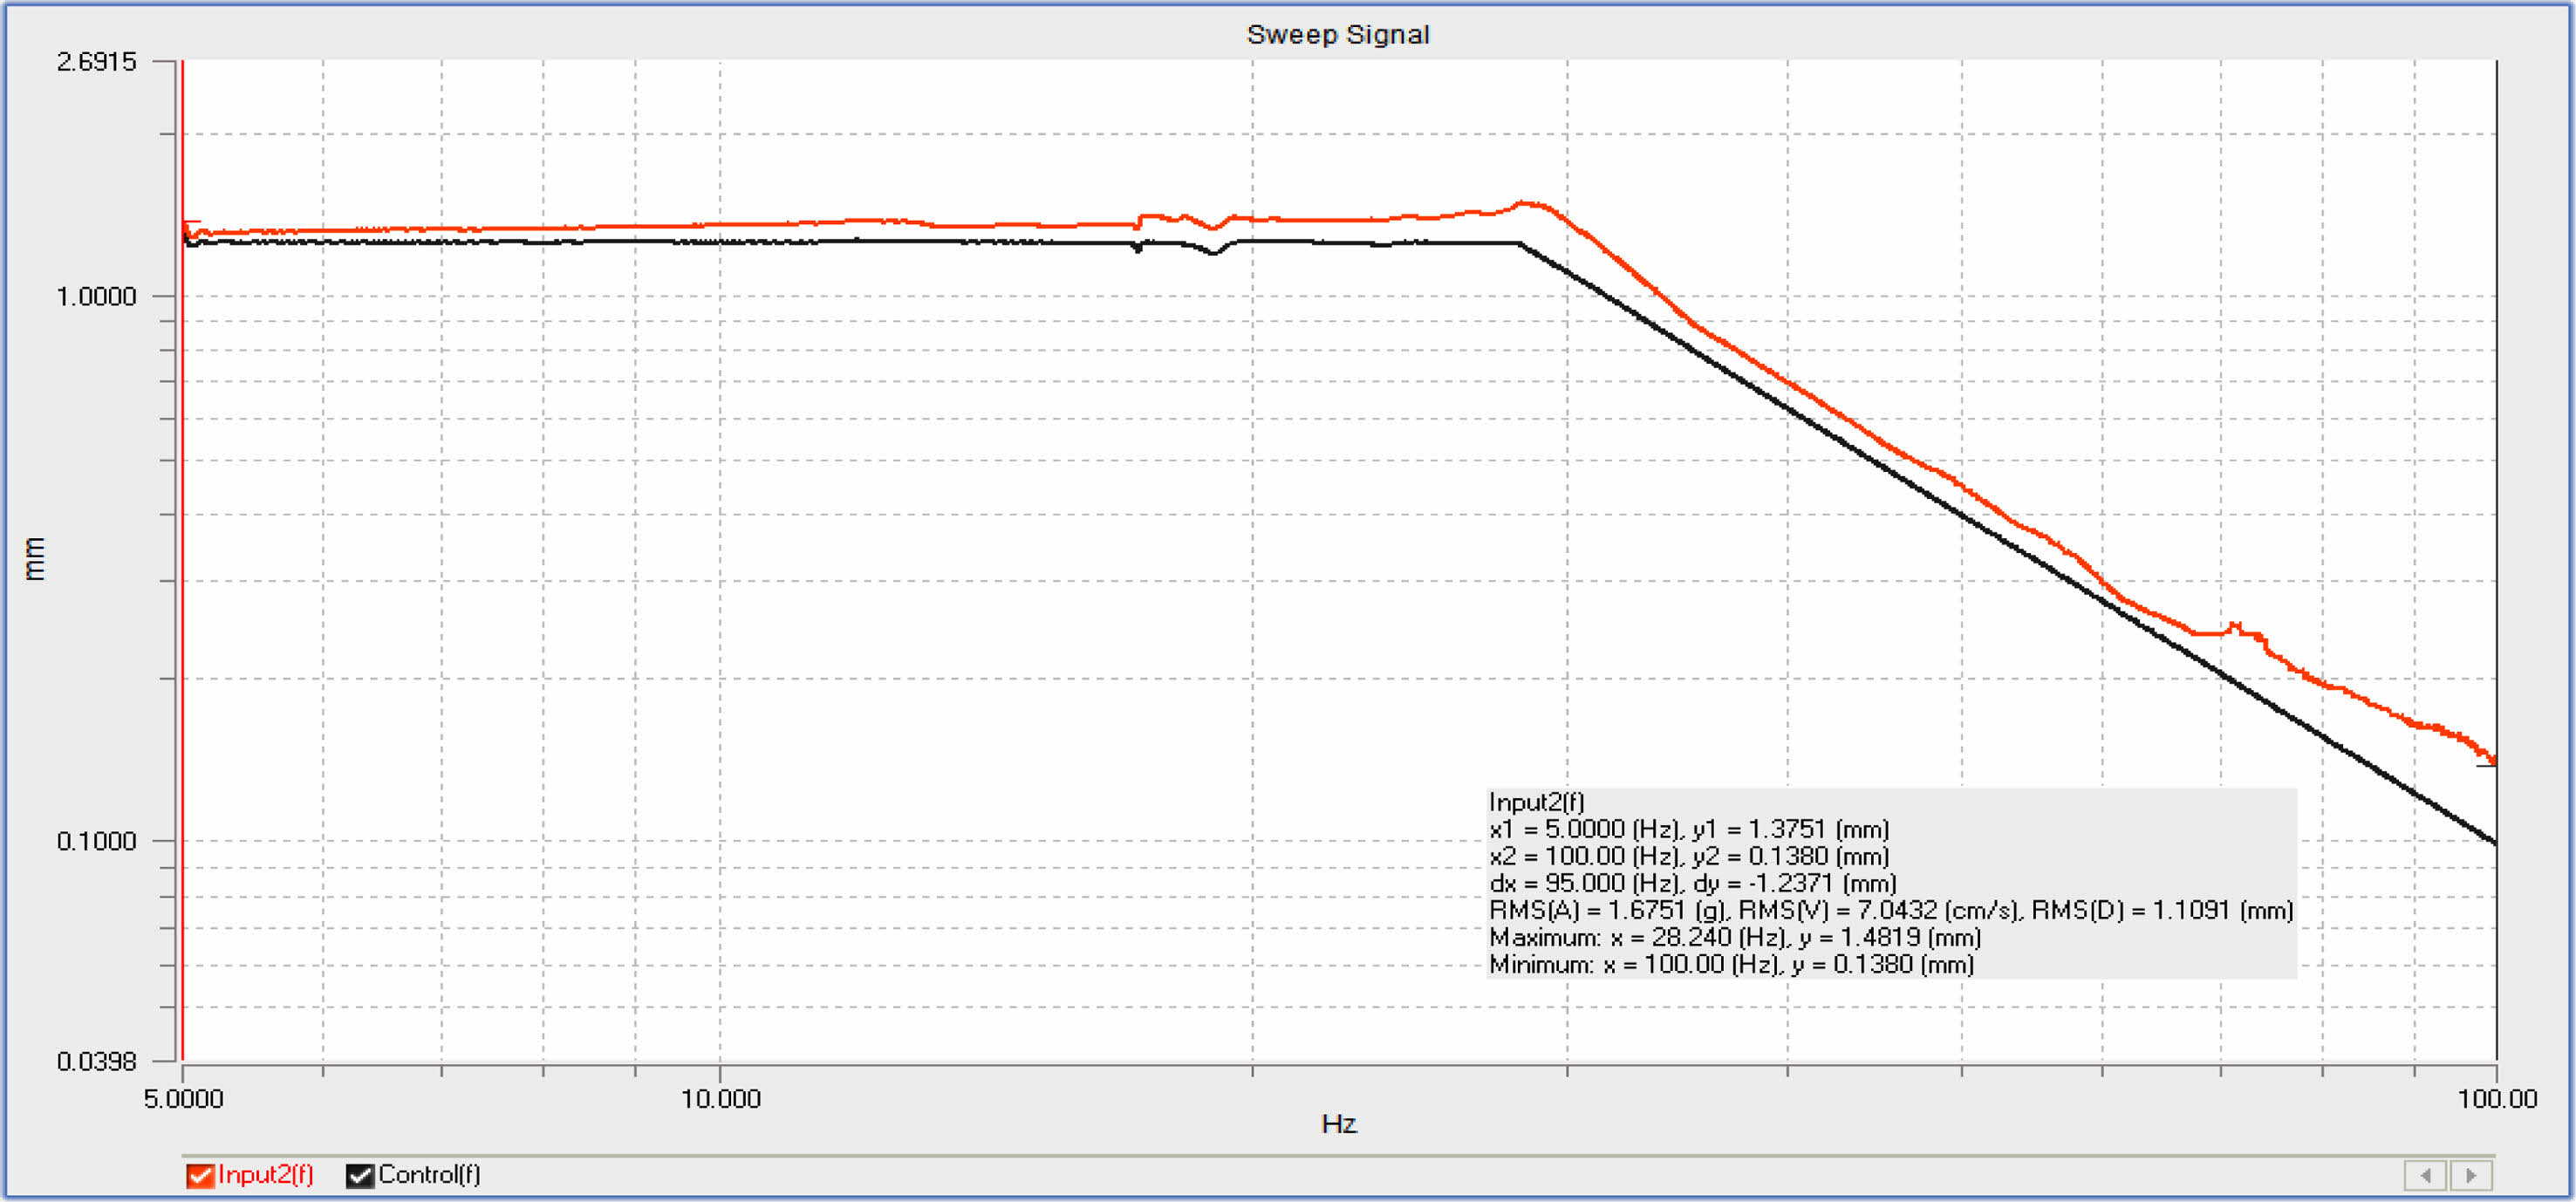
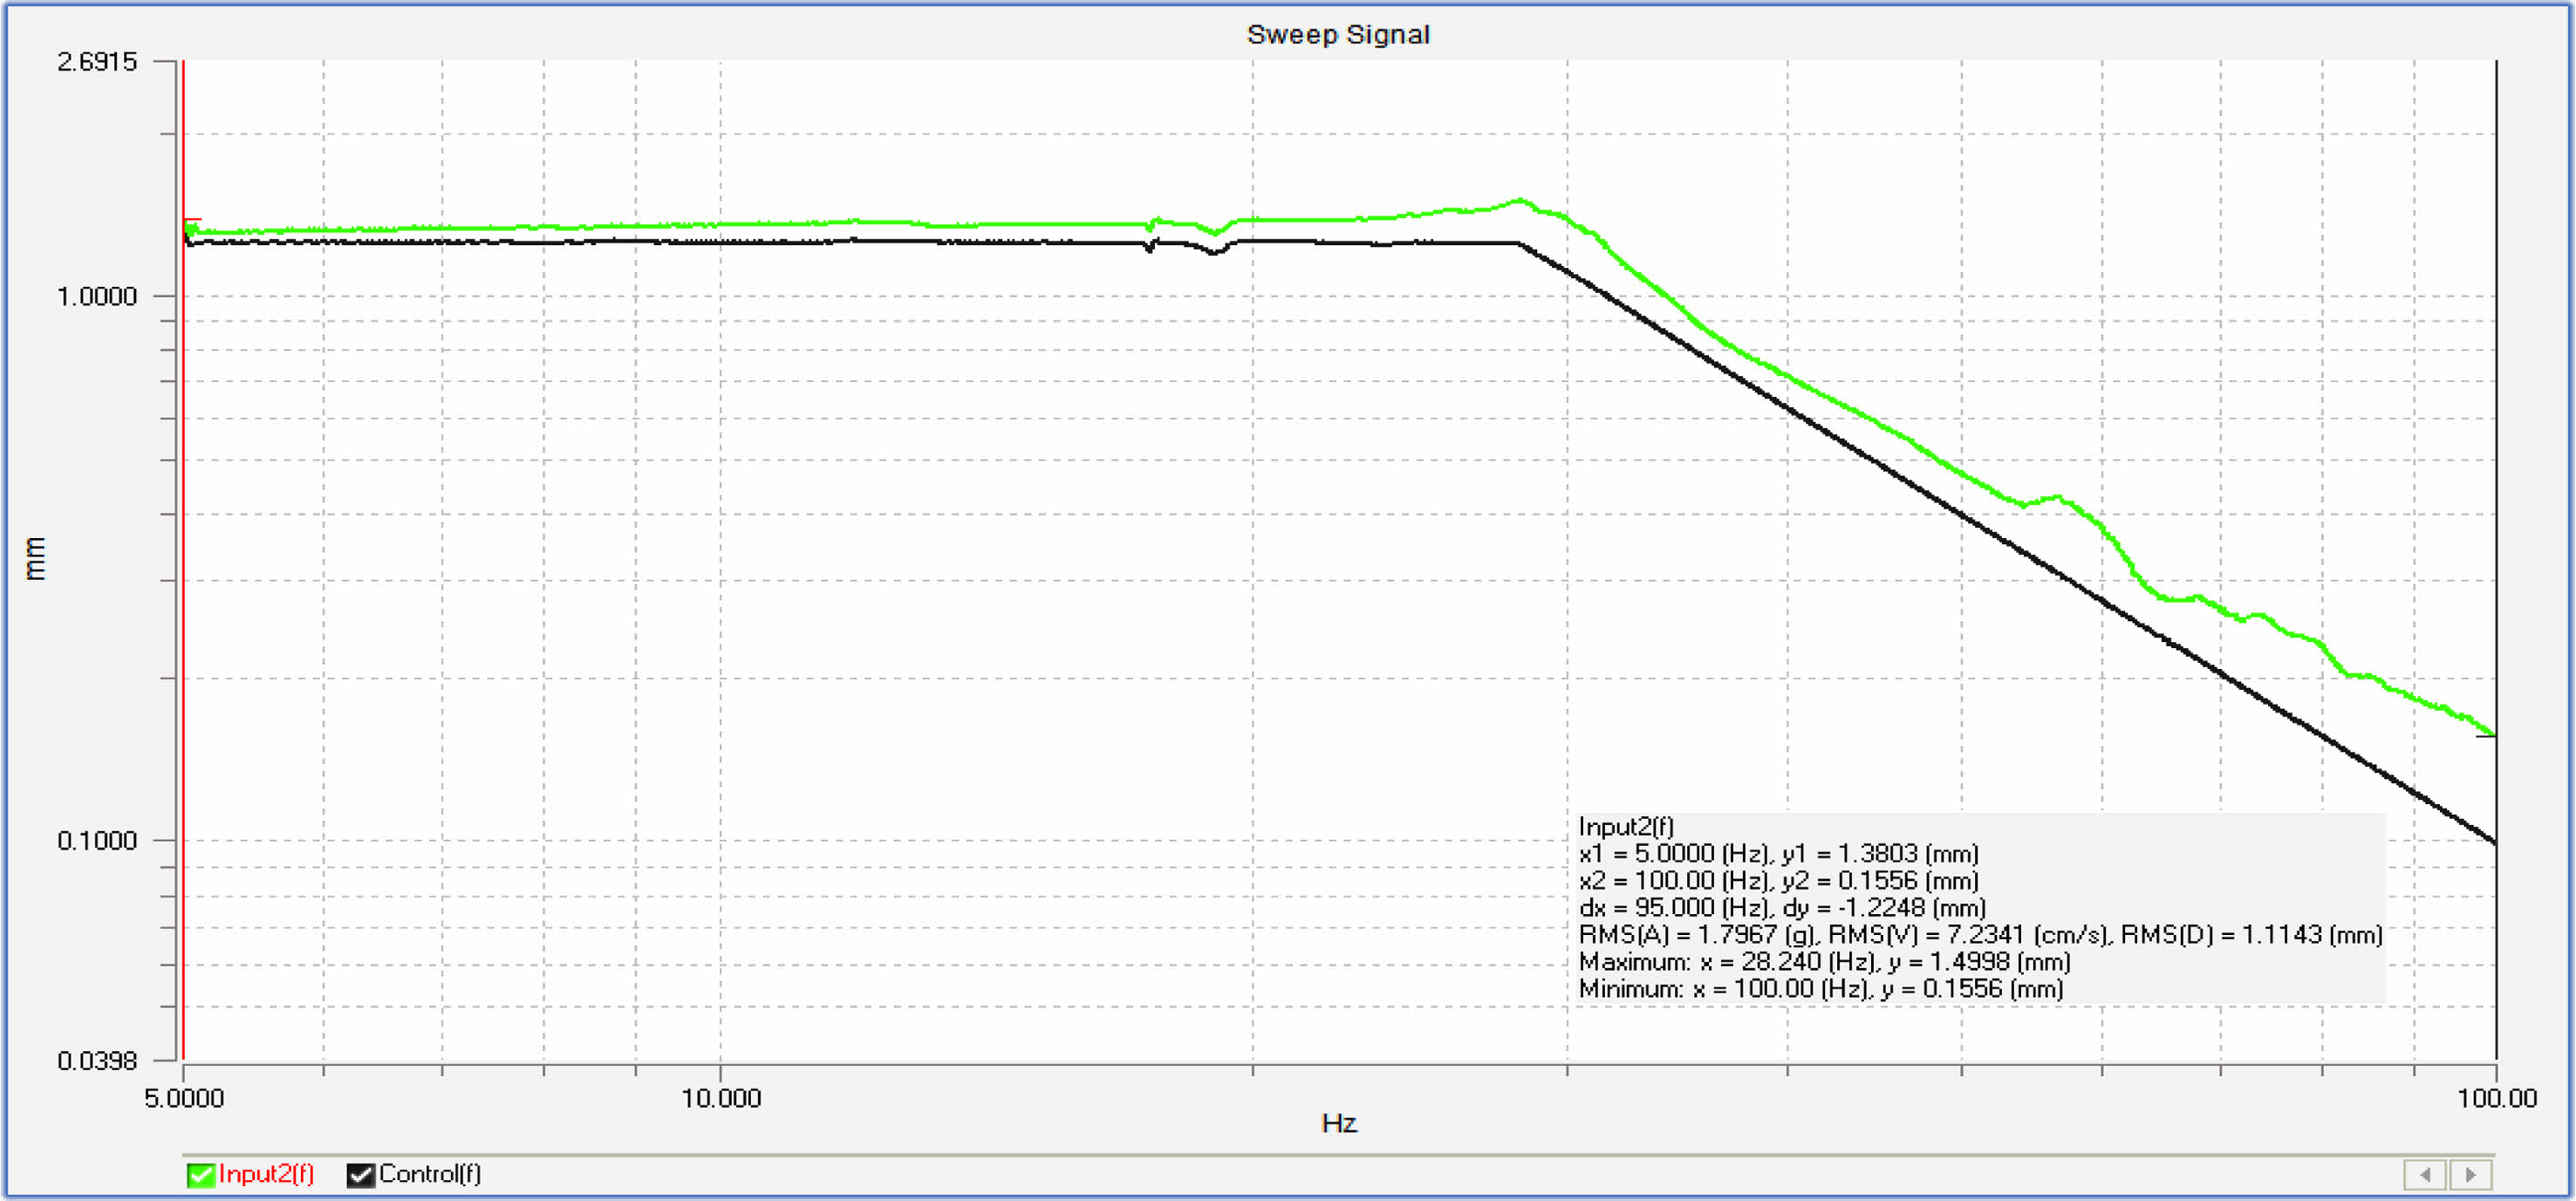
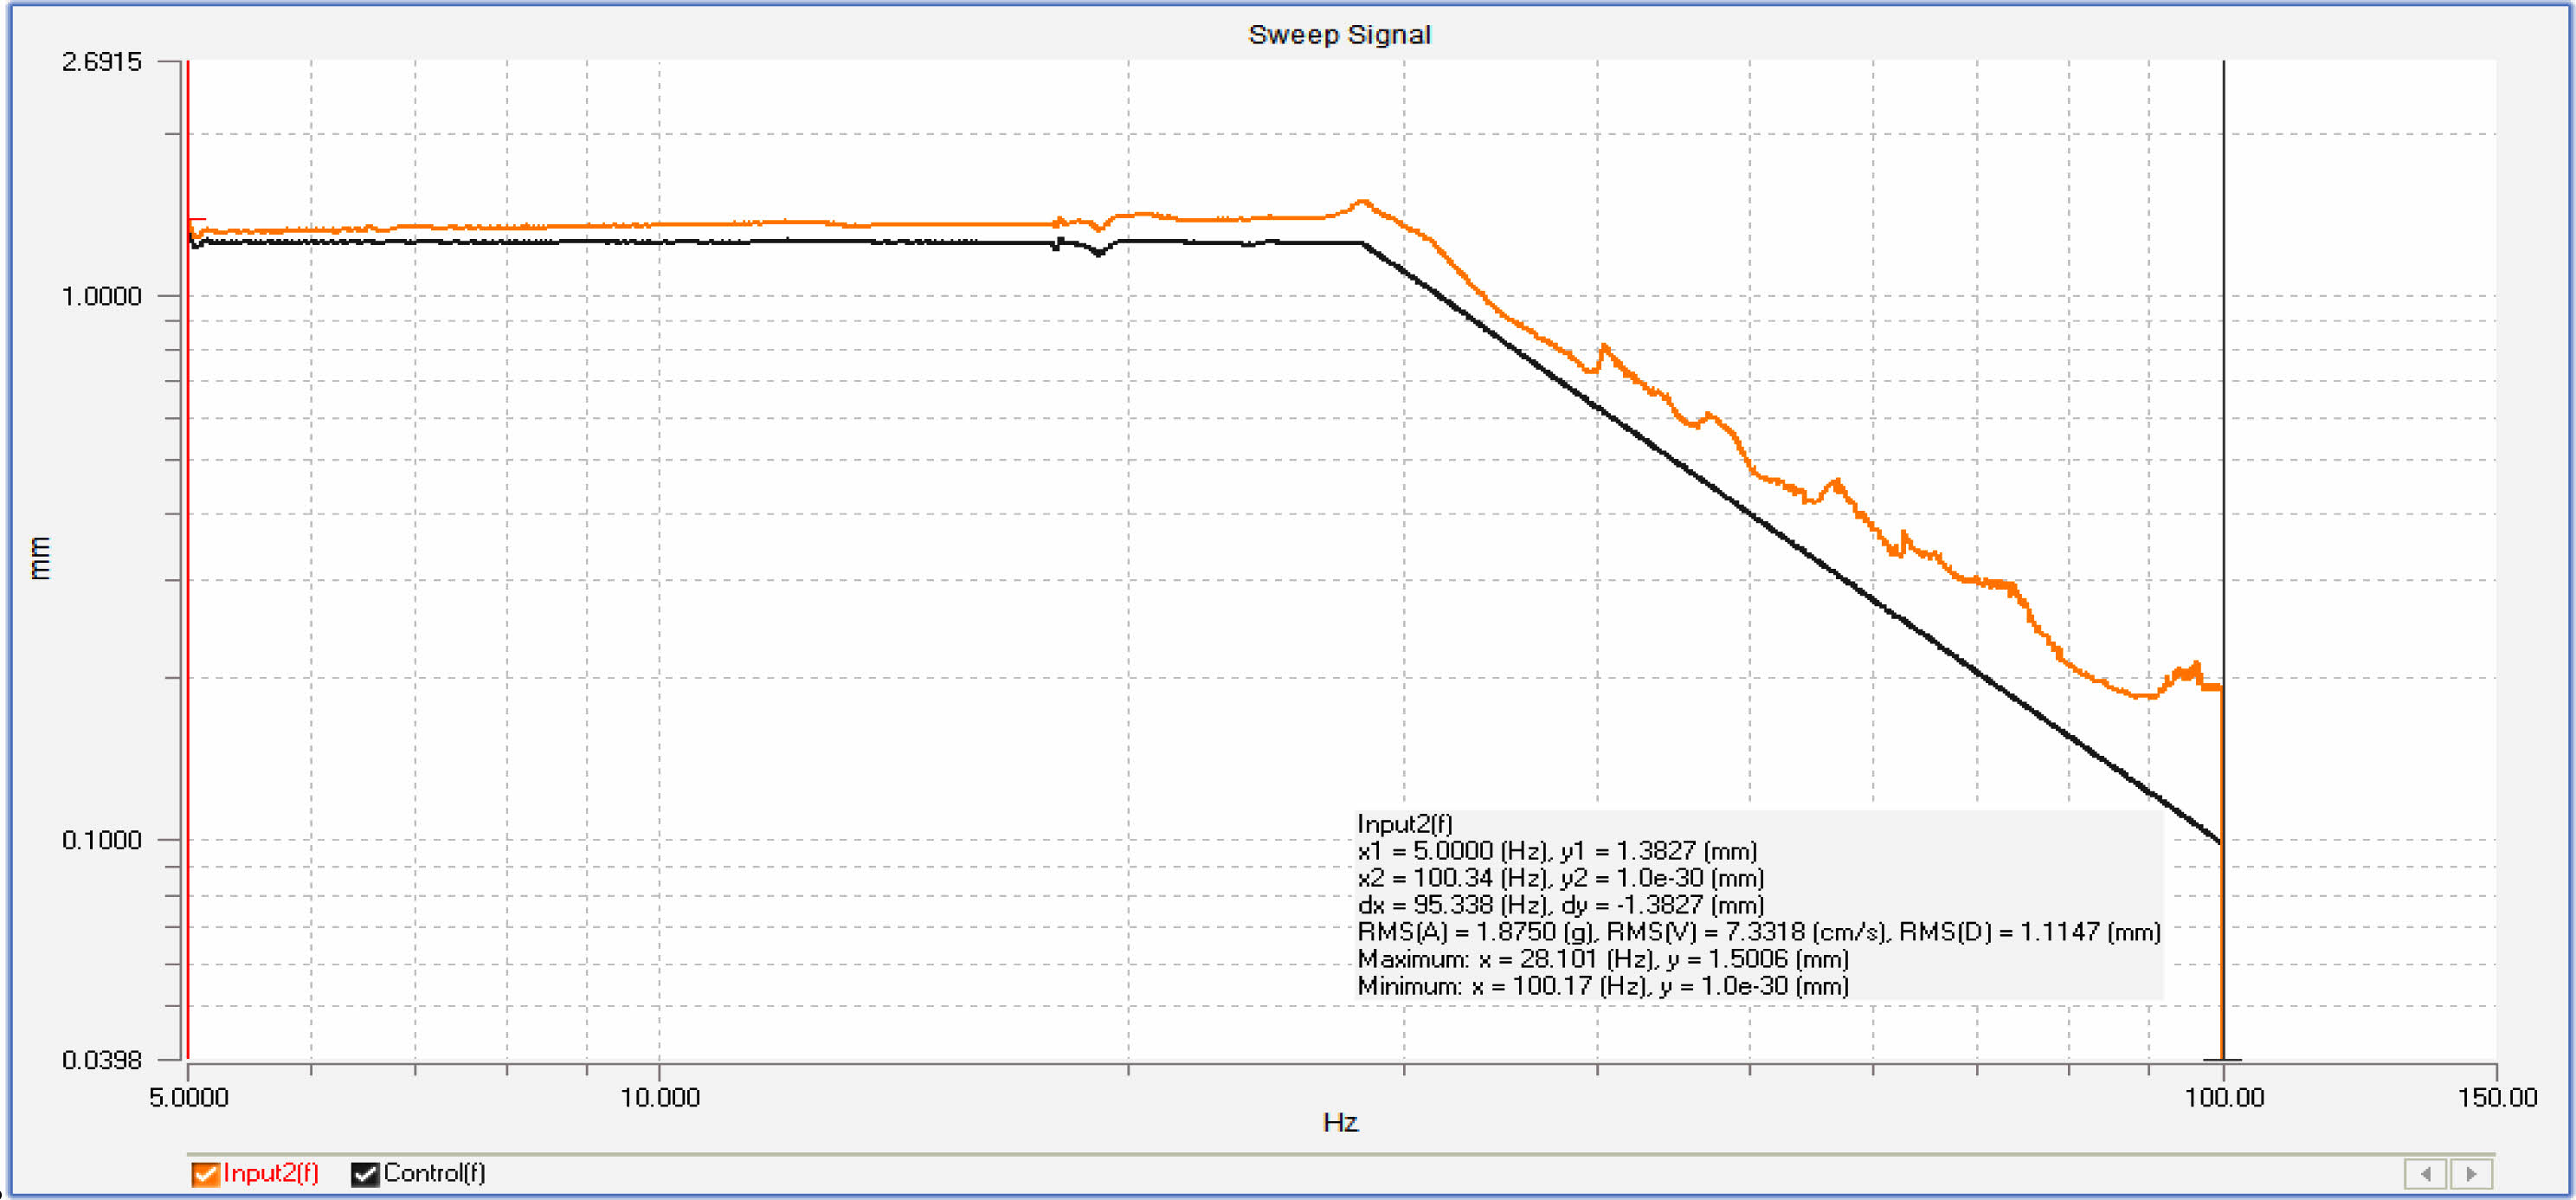
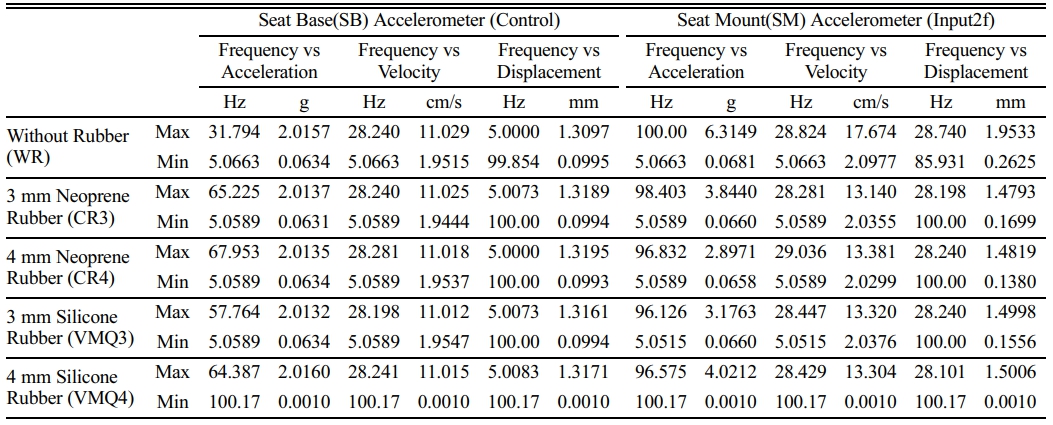
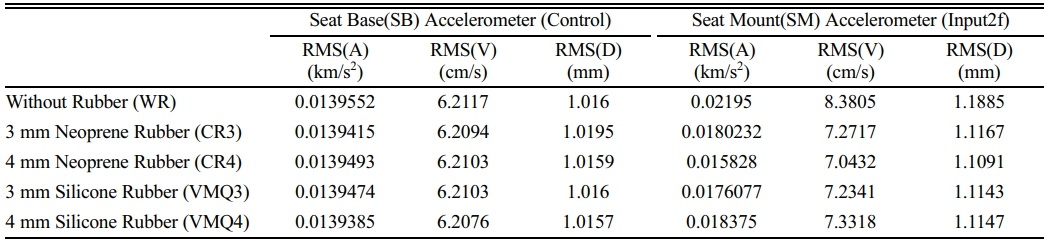
The simulation results presented in Figs. 4 to 18 and Table 3 illustrate the sinusoidal signals measured by the seat base accelerometer (Control) and seat mount accelerometer (Input2f) for different rubber sheets. The results indicate that the use of a 4 mm neoprene rubber sheet yields the lowest transmissibility, as evidenced by the reduced amplitudes of acceleration, velocity, and displacement signals, thereby demonstrating its effectiveness in reducing vibration transmission in the vehicle seat system.
The acceleration, velocity, and displacement on the seat base (SB) and seat mount (SM) with various rubber sheet parameters are plotted in Figs. 4 to 18 and Table 3 shows the various Sinusoidal Signal for Seat Base (SB) Accelerometer (Control) and Seat Mount (SM) Accelerometer (Input2f) in a various rubber sheets. The graph plots can be used to identify variations in vibration levels. The acceleration, velocity, and displacement data show that the system's performance varies depending on the rubber sheets. The transmissibility ratio for various rubber sheet parameters has been determined. And, according to ISO 2631, the transmissibility is plotted with respect to 0 to 80 Hertz is the frequency range.
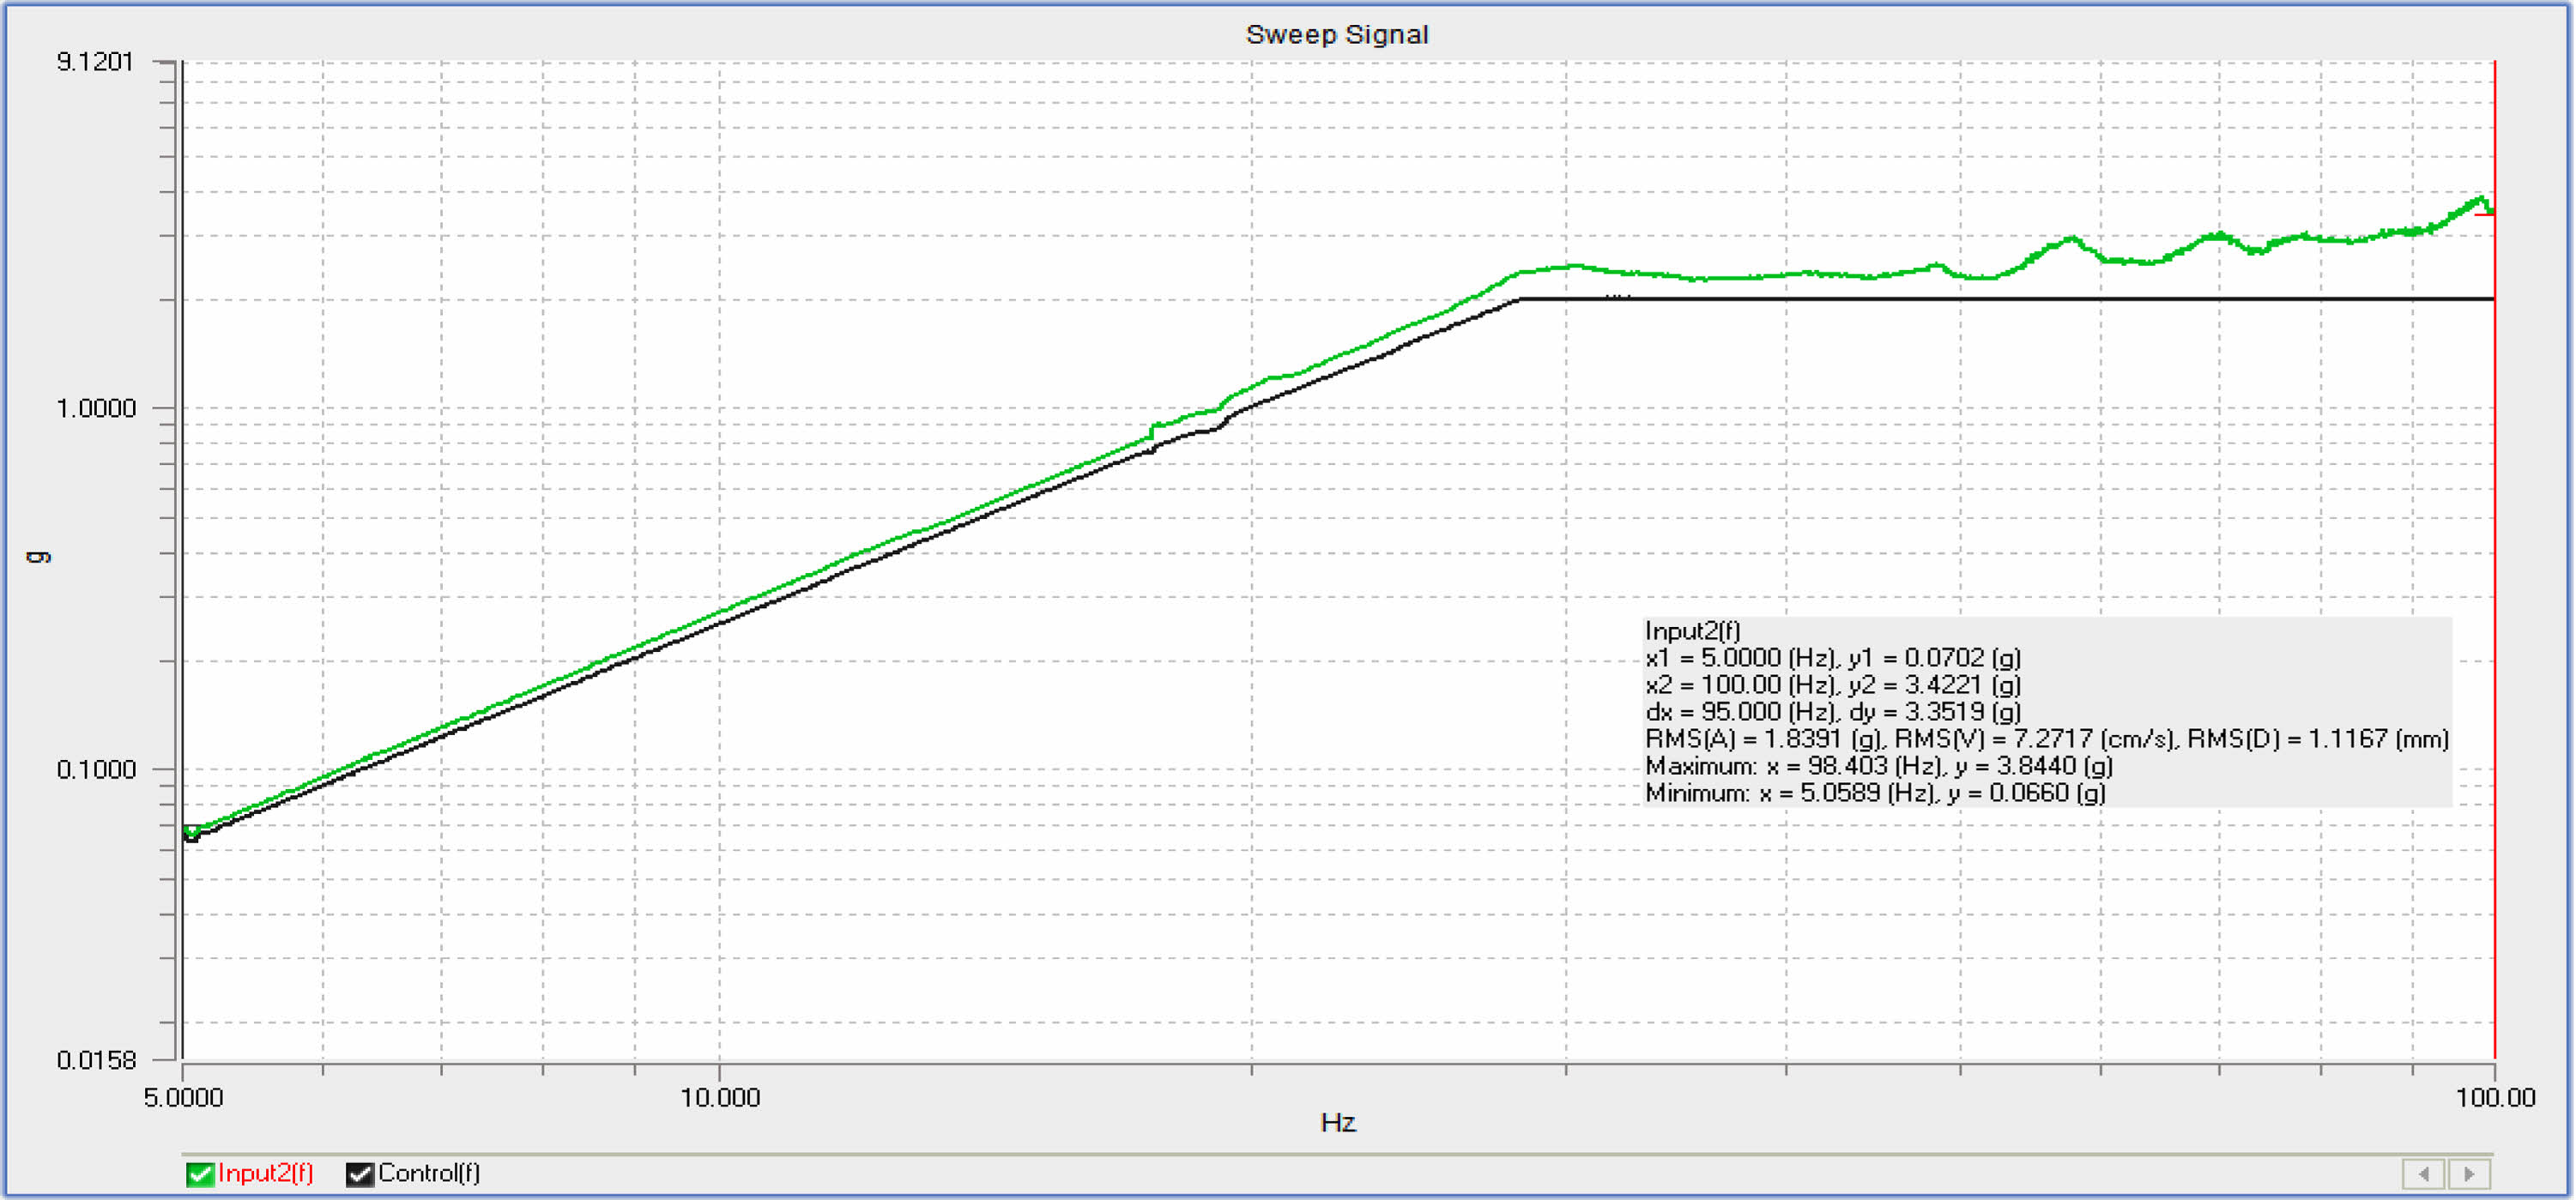
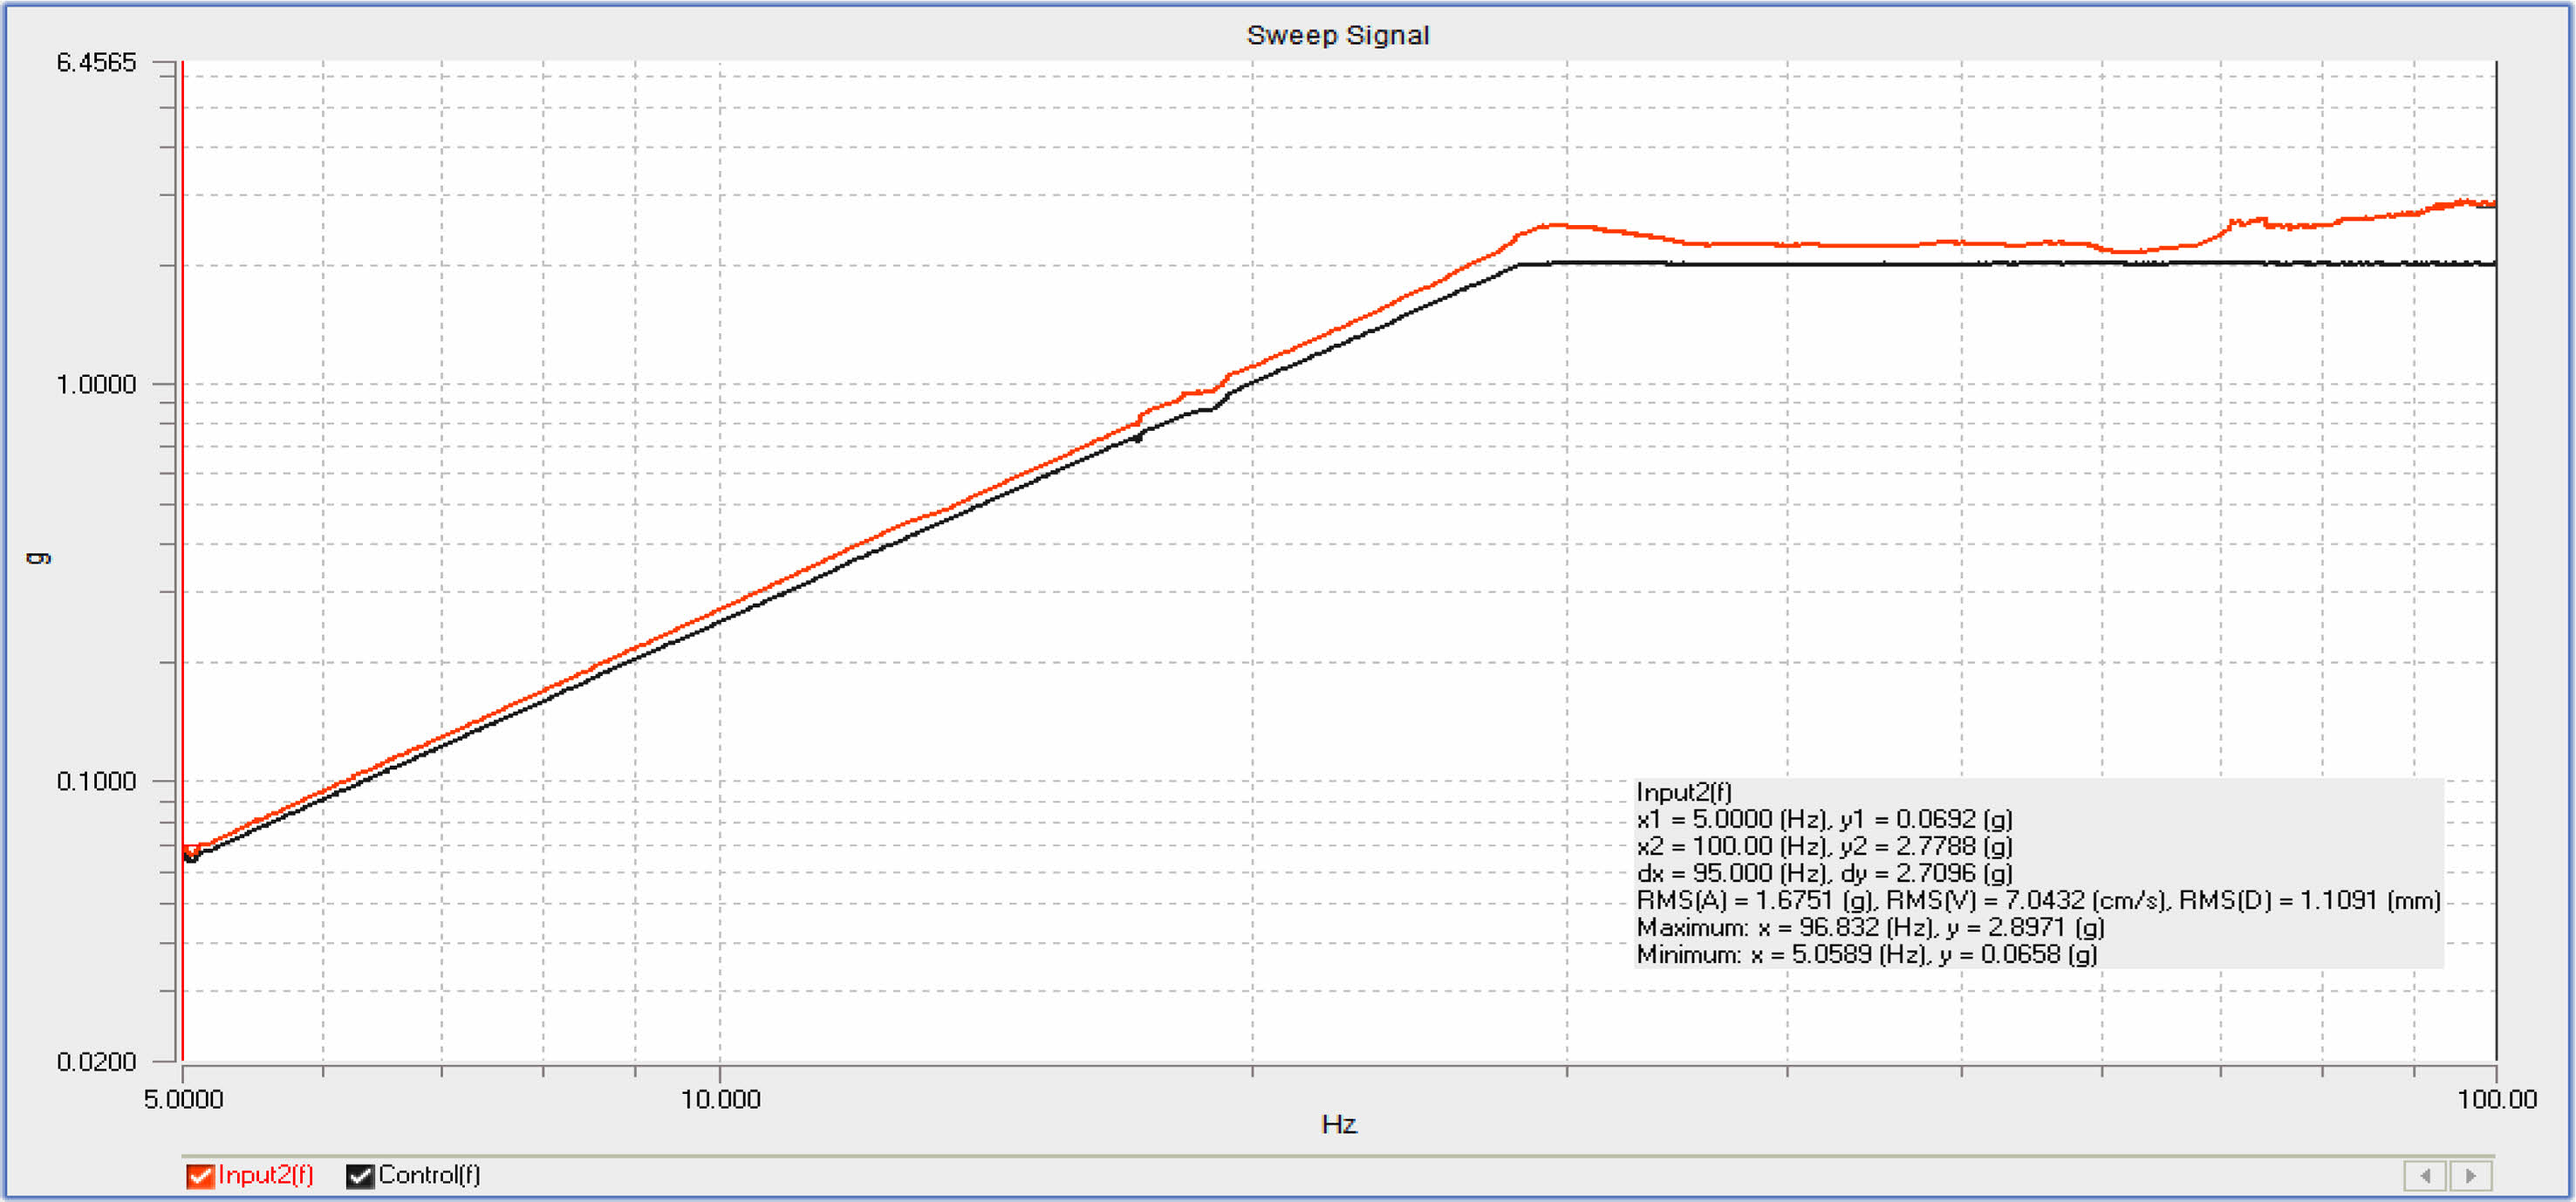
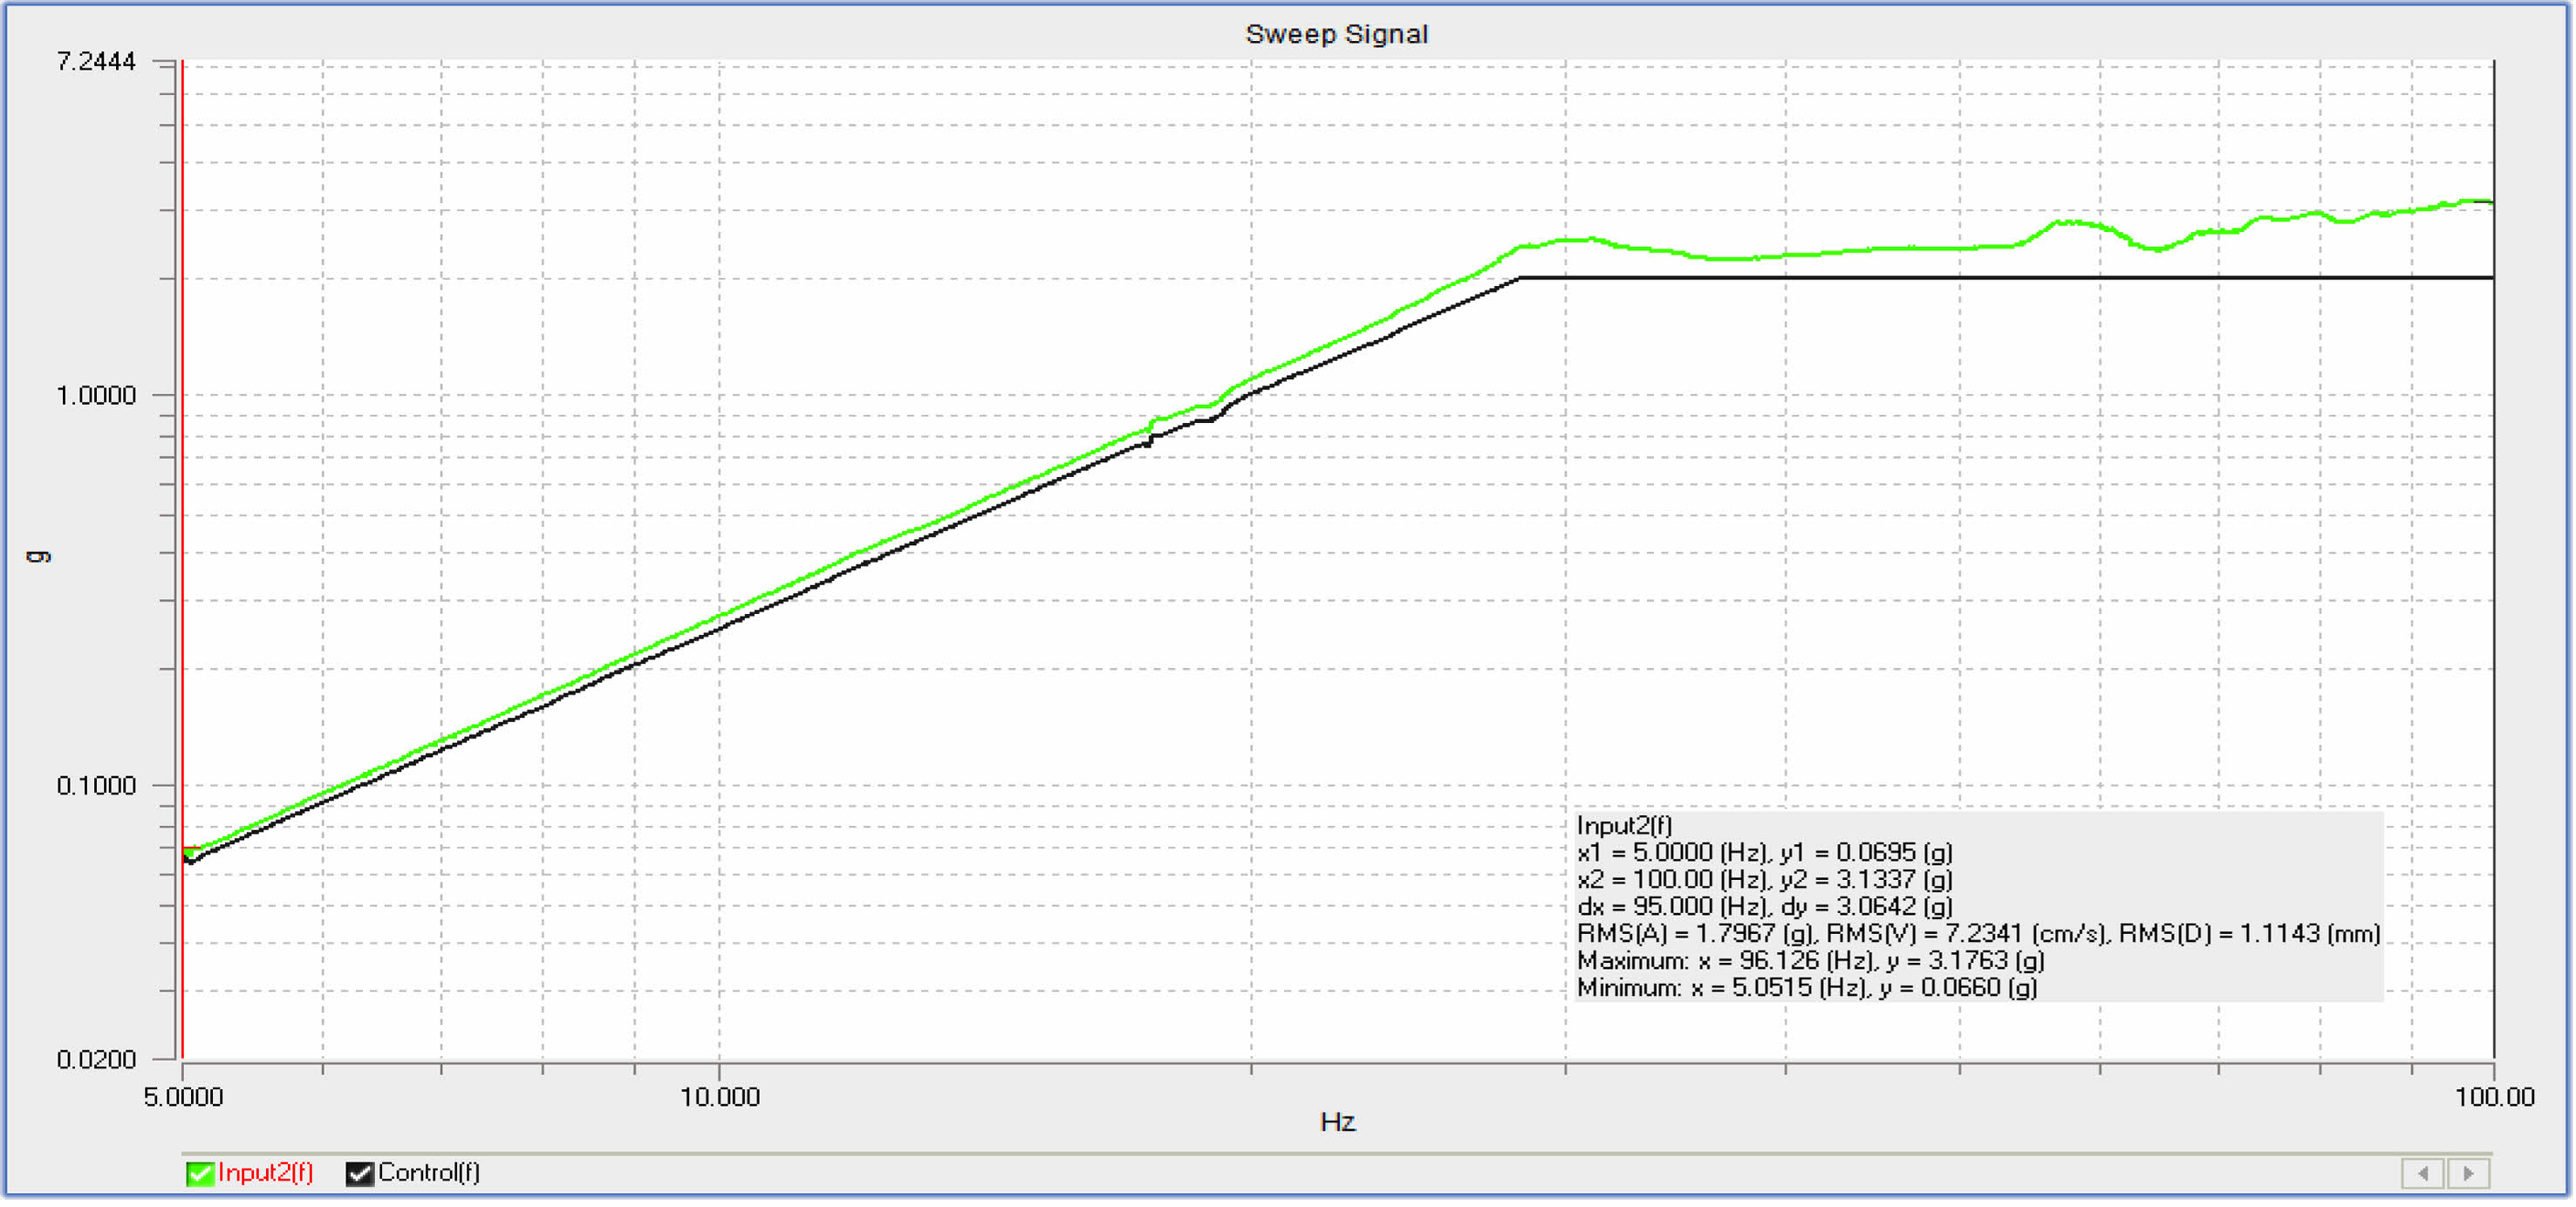
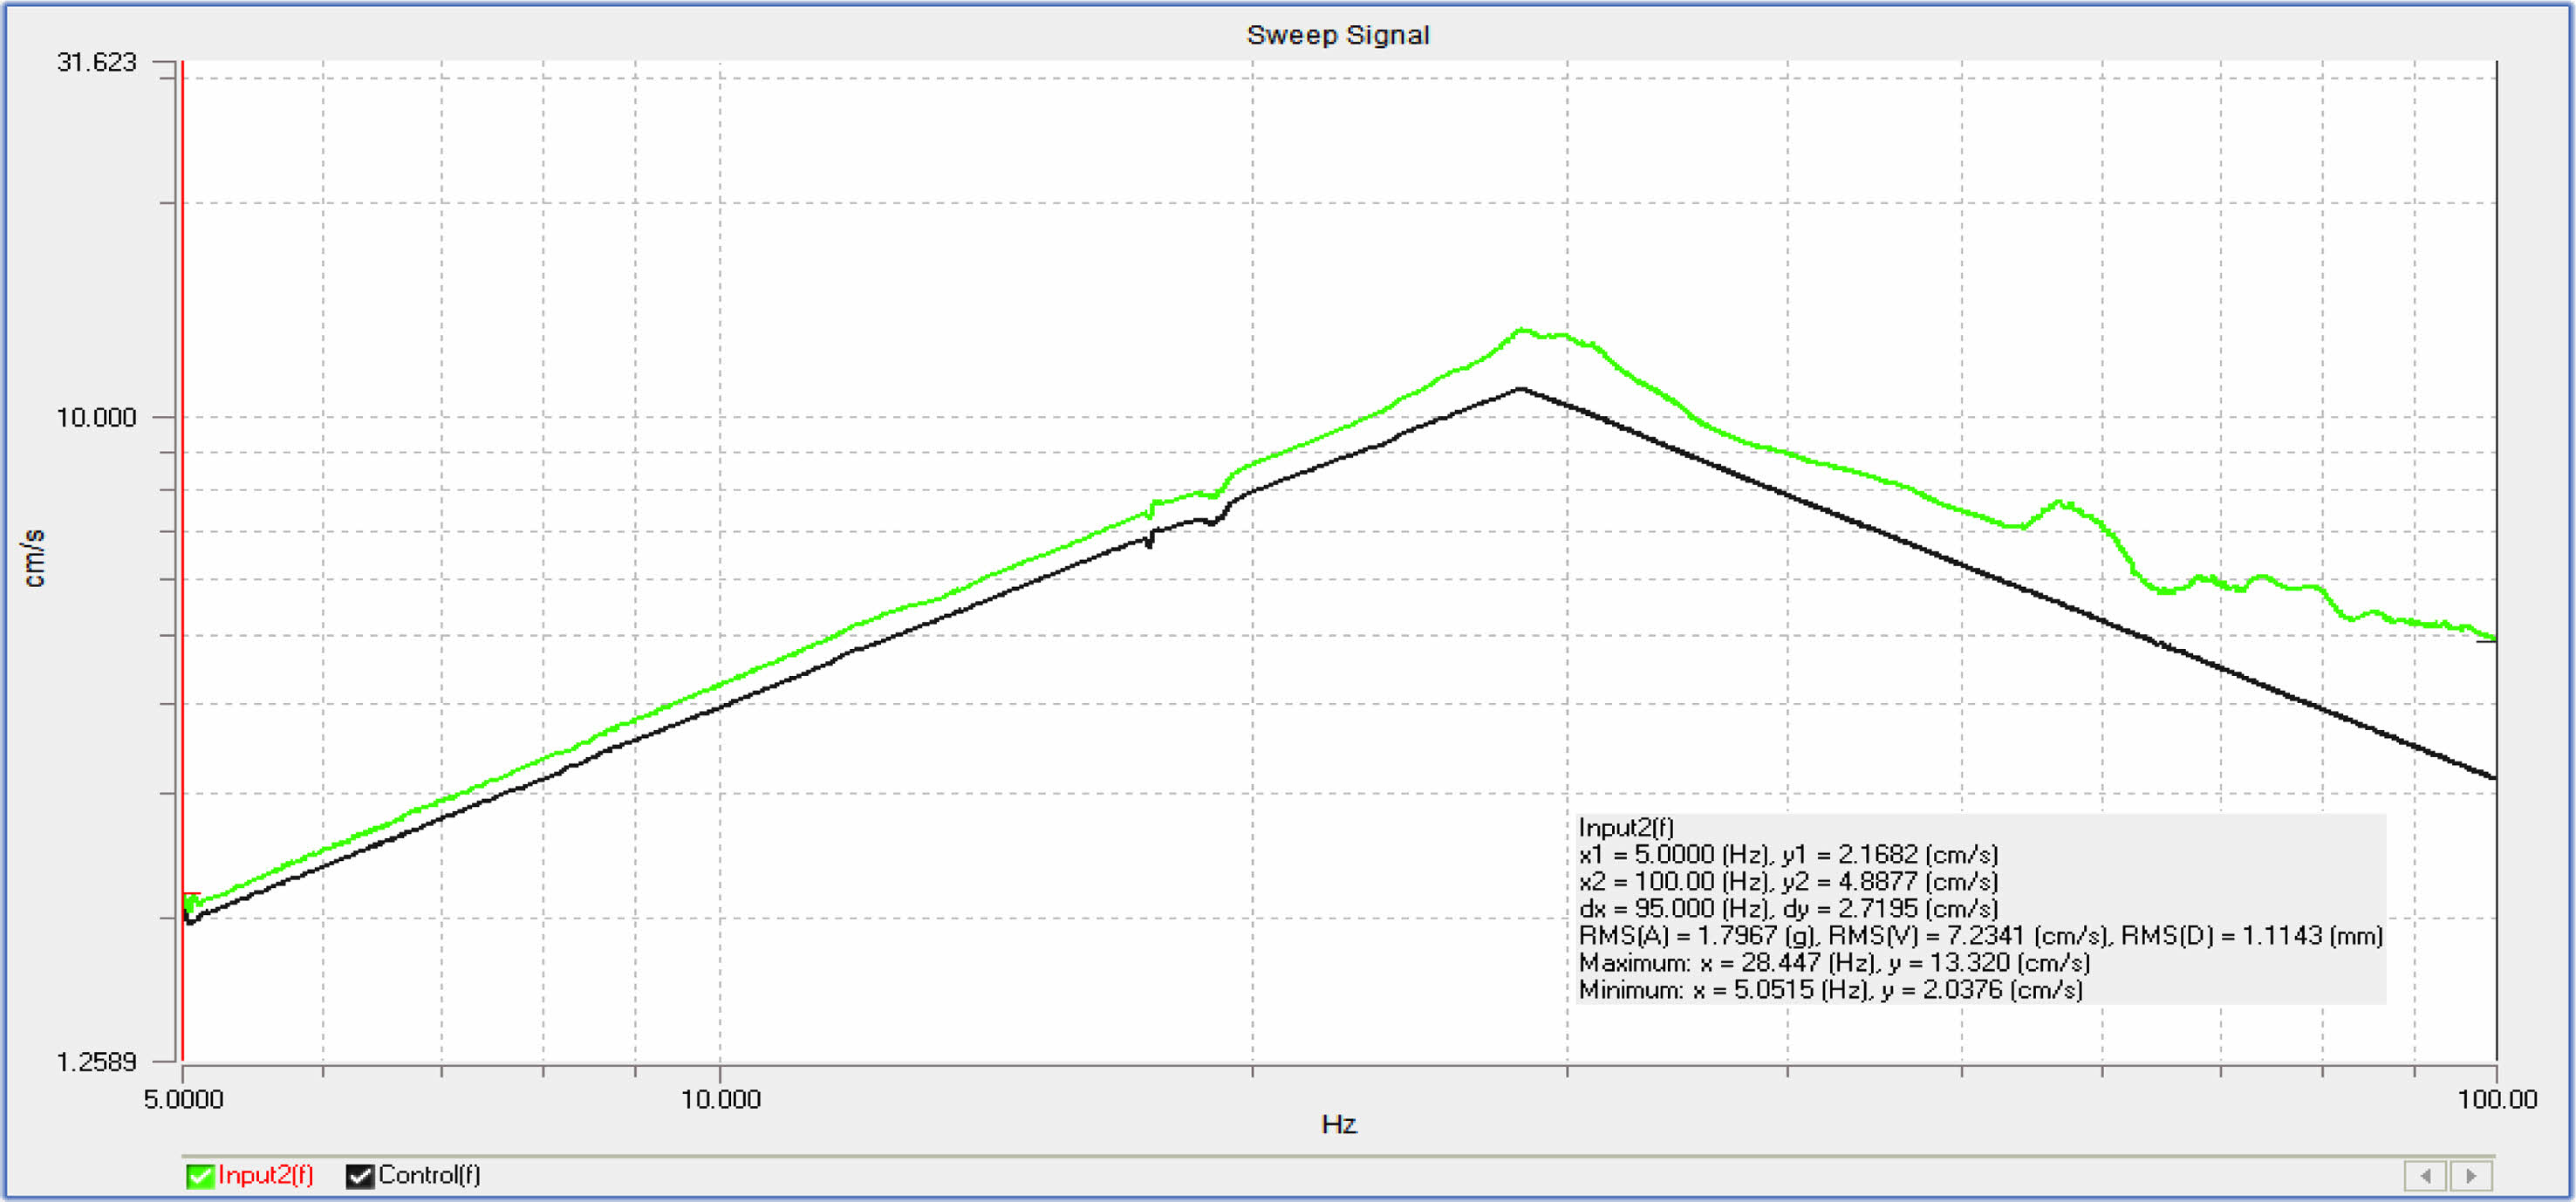
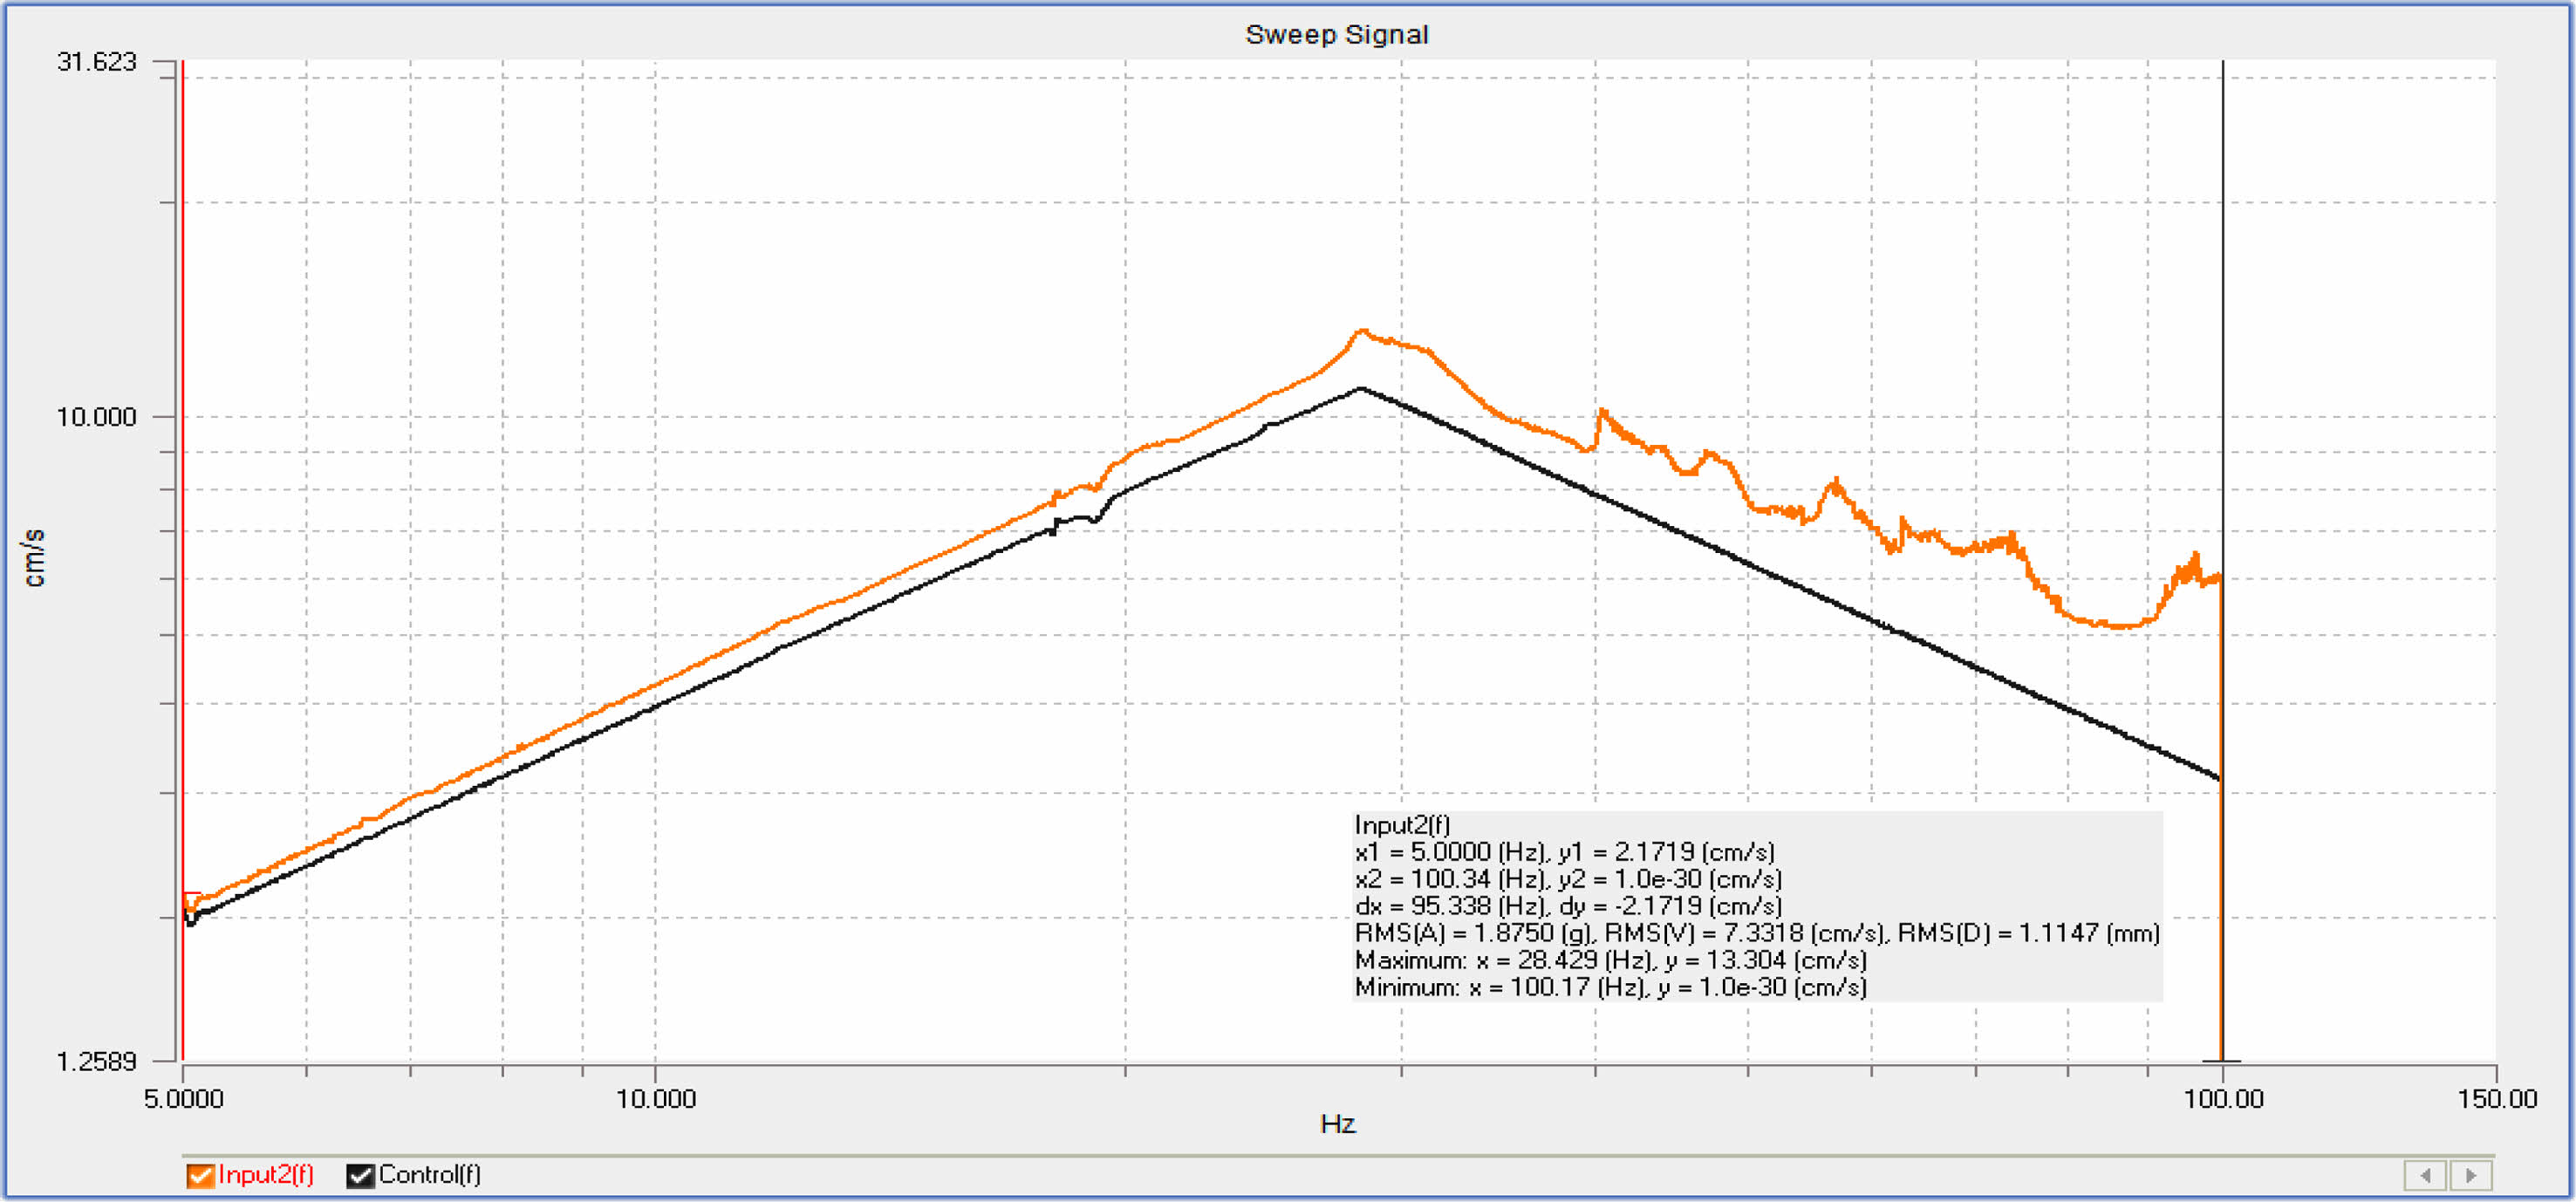
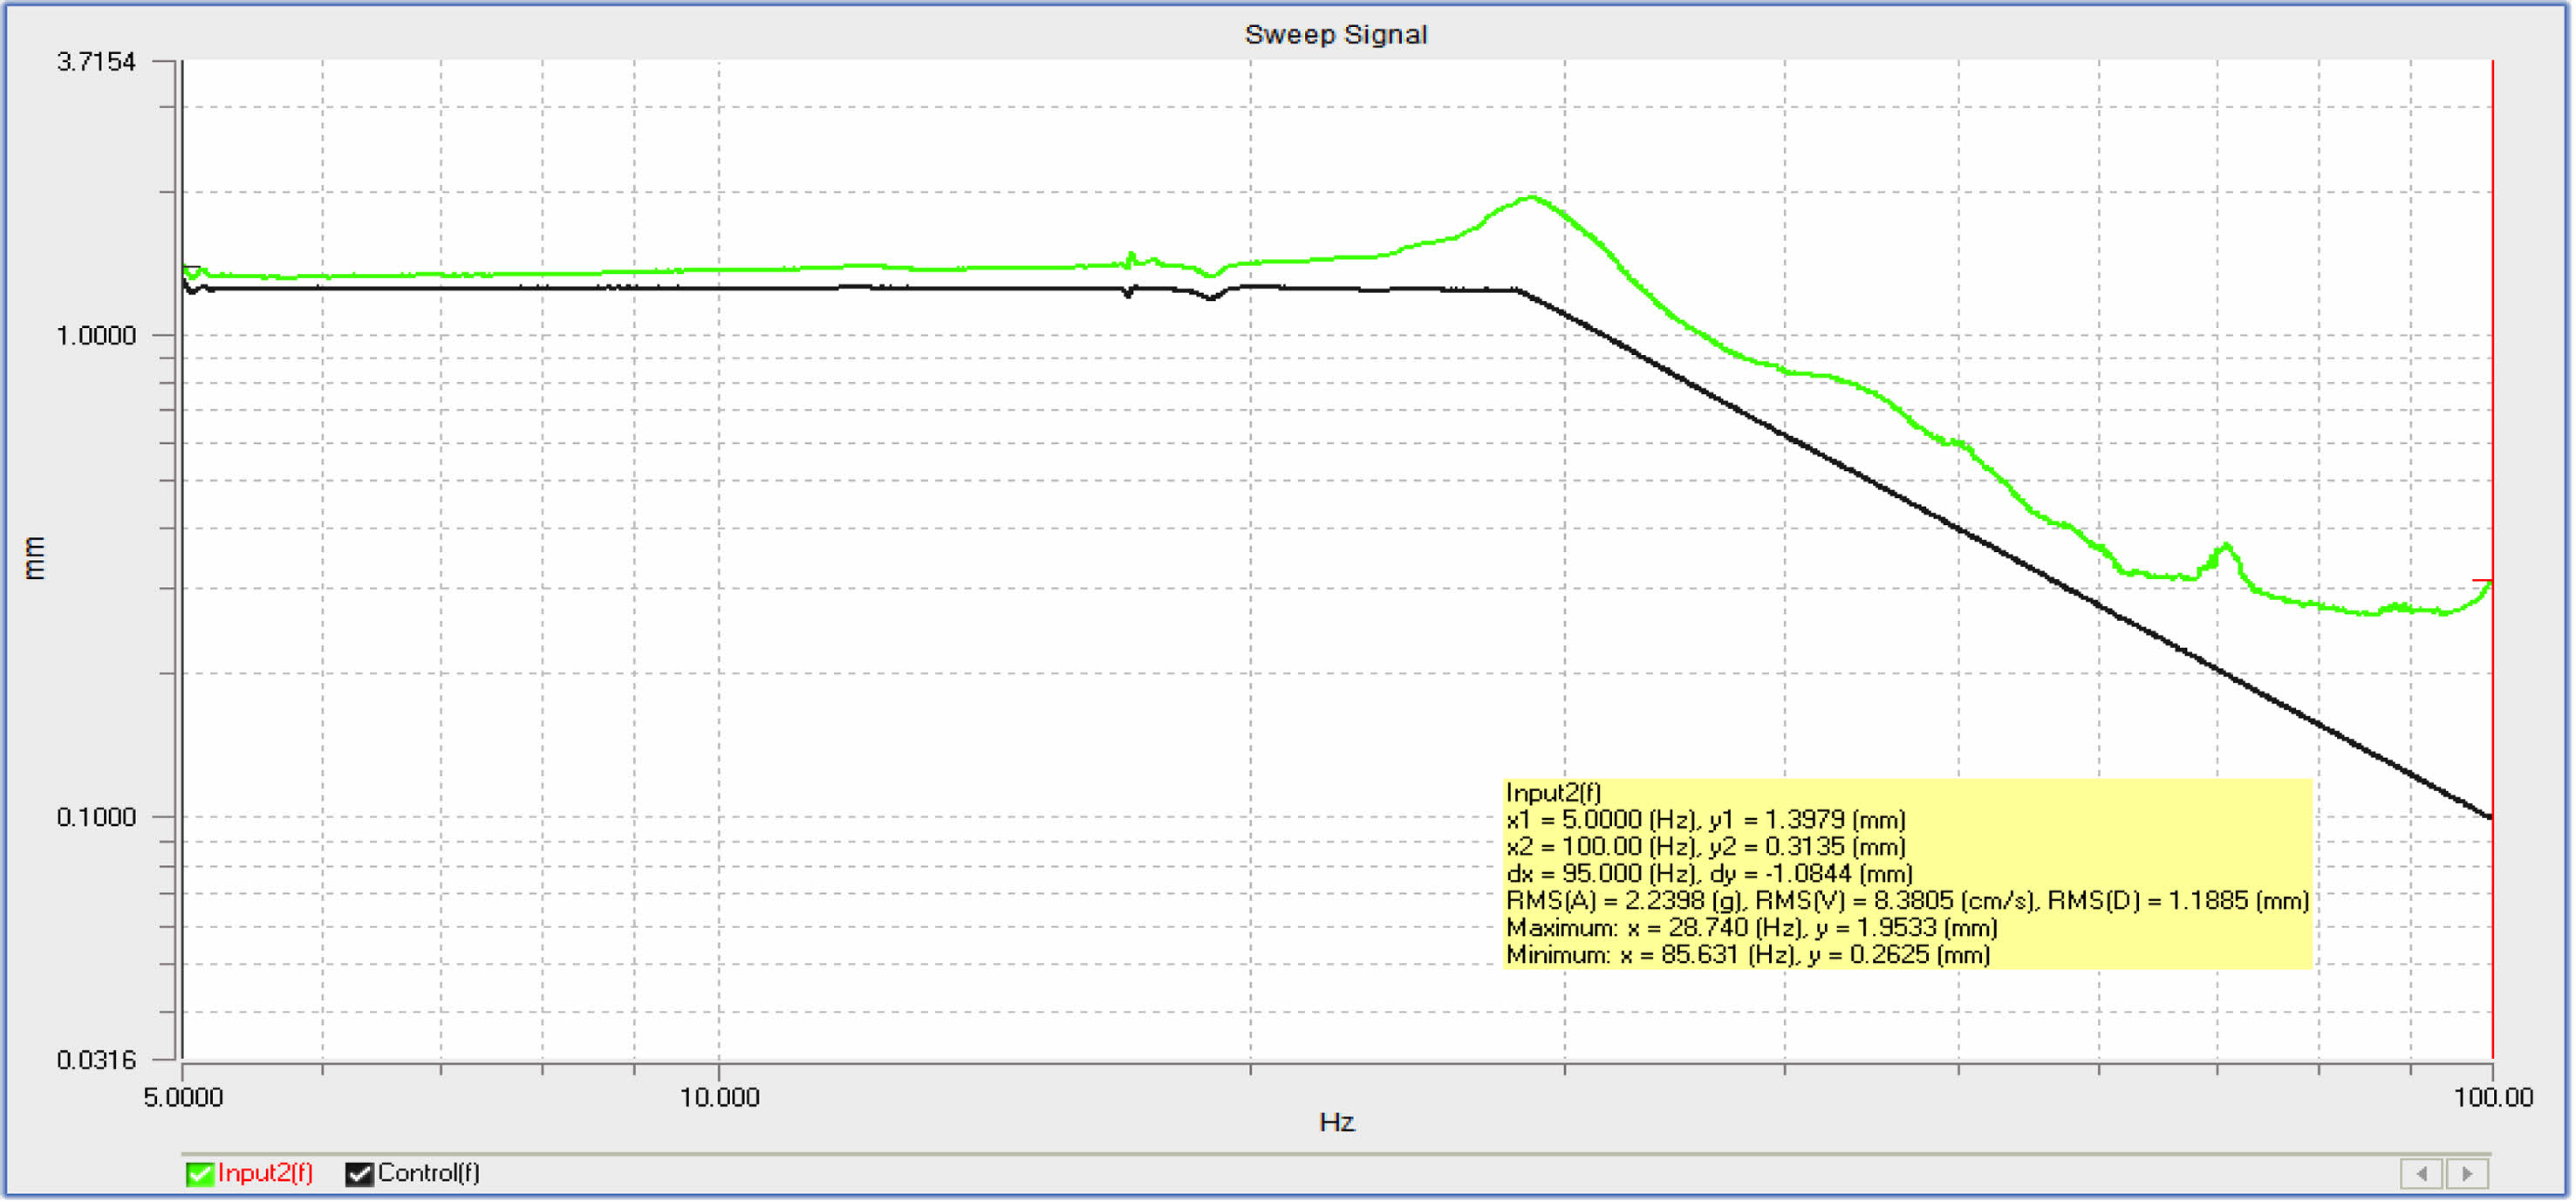
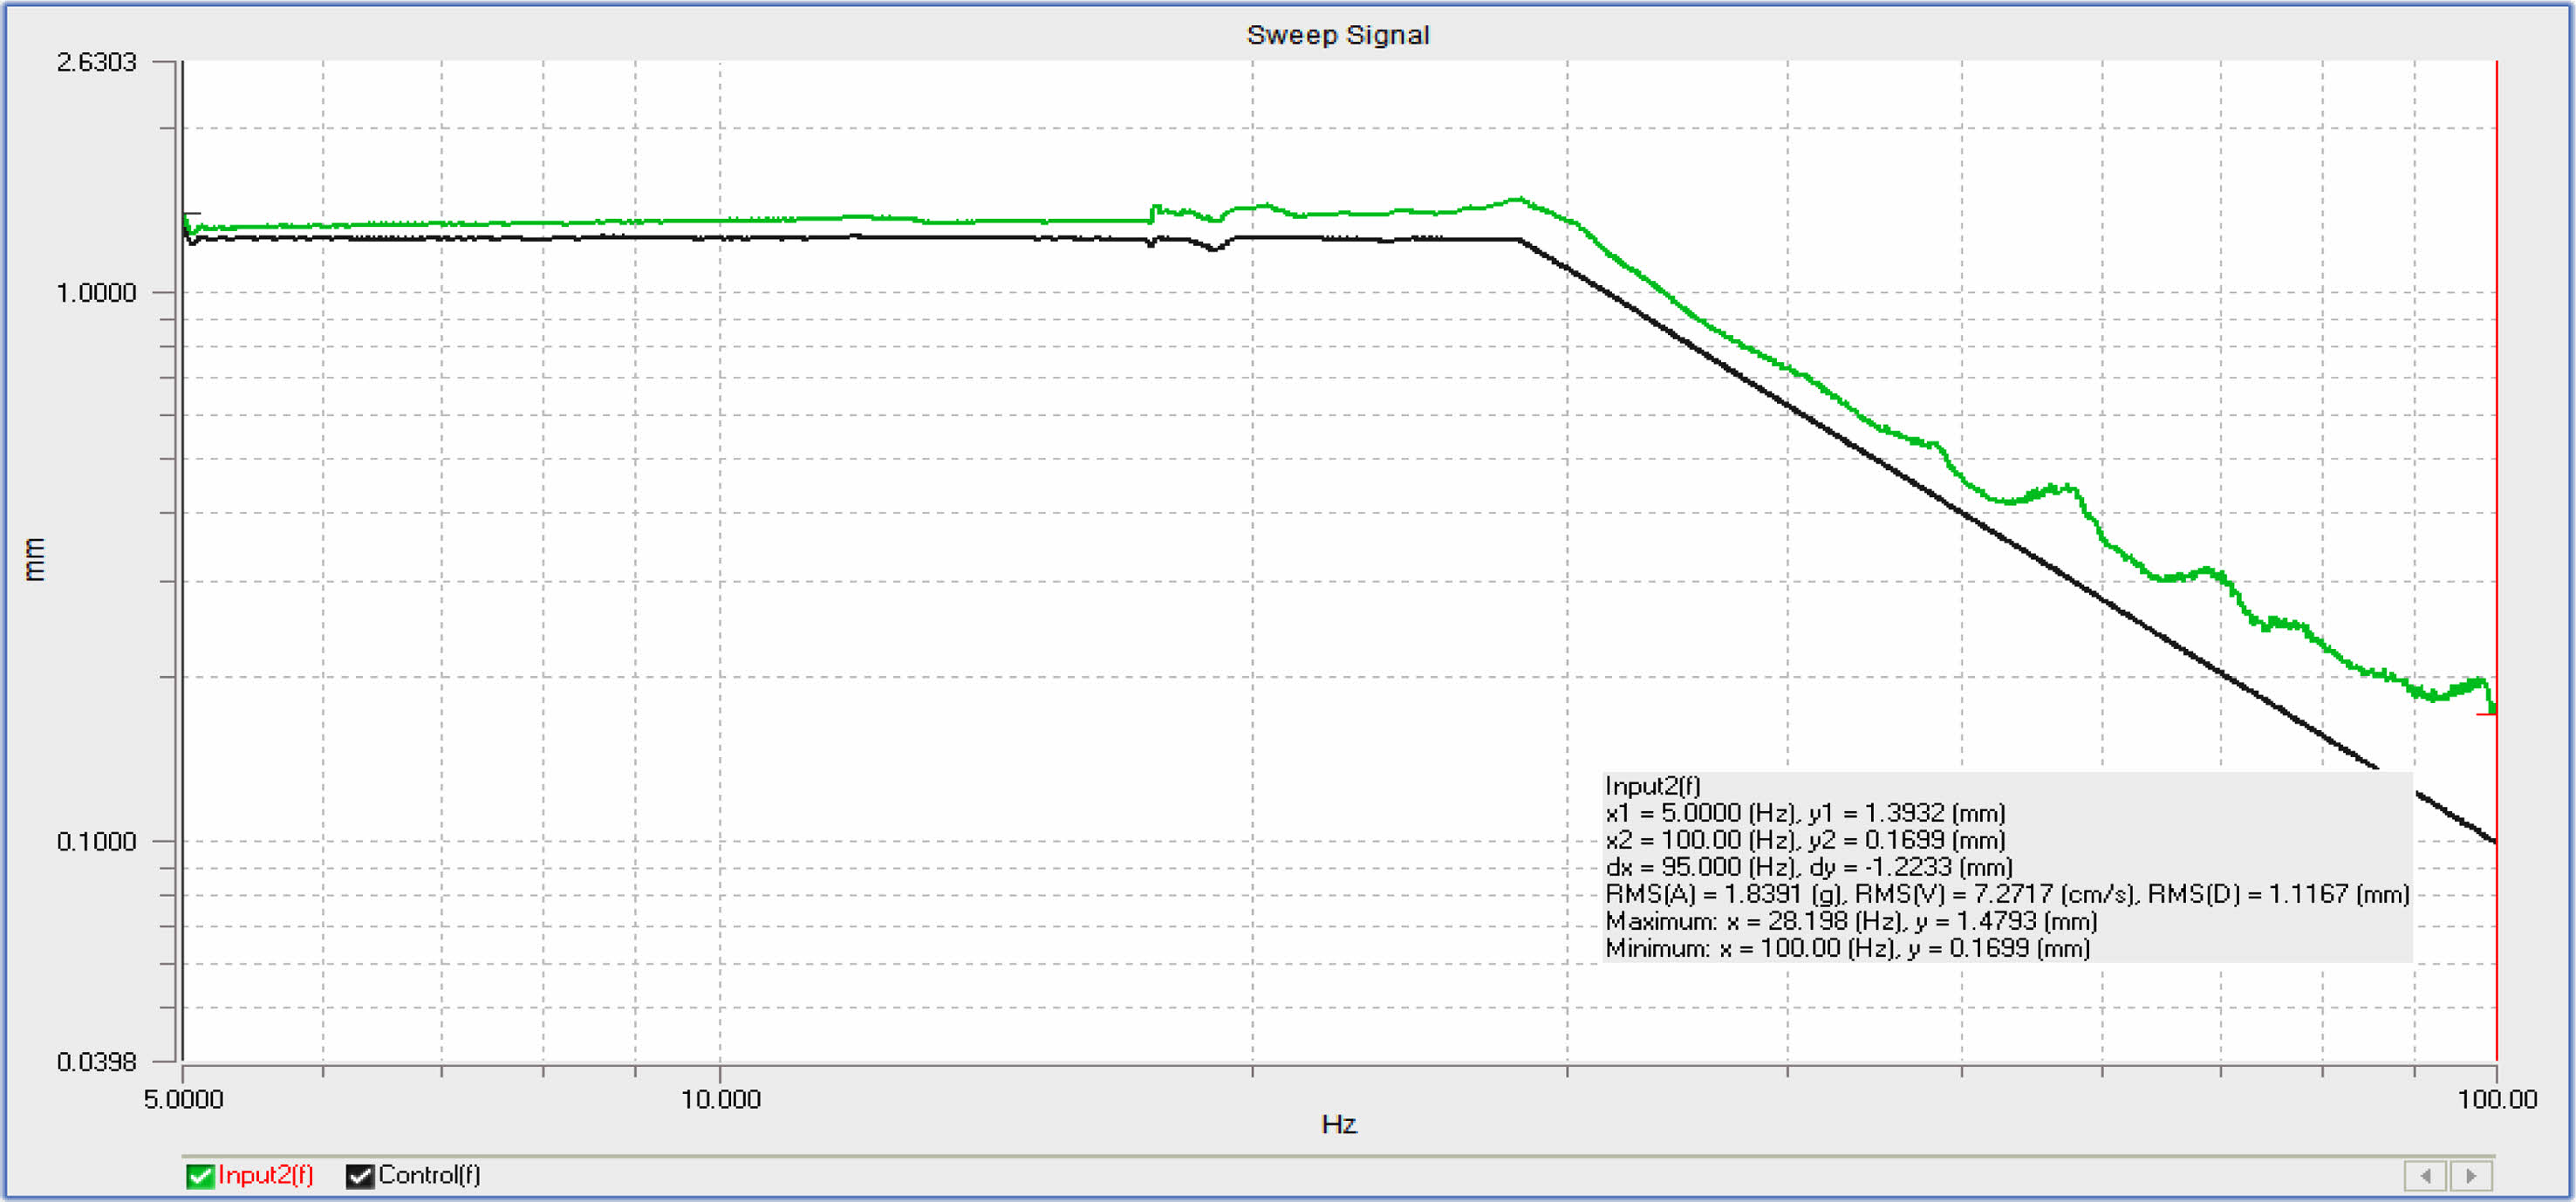
This seat vibration analysis was tested using sinusoidal excitations. The experiment was subjected to various sinusoidal vibrations with frequencies ranging from 5 to 100 Hz. The magnitudes of the excitation vibrations for mounting various thicknesses of rubber sheets, such as 3 mm Silicone rubber (VMQ3), 4 mm Silicone rubber (VMQ4), 3 mm Neoprene rubber (CR3), 4 mm Neoprene rubber (CR4), and without rubber (WR), were the same. Figs. 4-8 show the frequency domain accelerations of the seat base (SB) as shaker table and seat mount (SM) for 3 mm Silicone rubber (VMQ3), 4 mm Silicone rubber (VMQ4), 3 mm Neoprene rubber (CR3), 4 mm Neoprene rubber (CR4), and without rubber (WR) when the excitation vibration frequencies were set to 5 and 100 Hz, respectively. Figs. 6, 11, and 16 show that the optimization in peak accelerations, velocity, and displacement of the seat base (SB) can be obviously reduced, implying that the seat base receives significantly fewer vibration characteristics (SB).
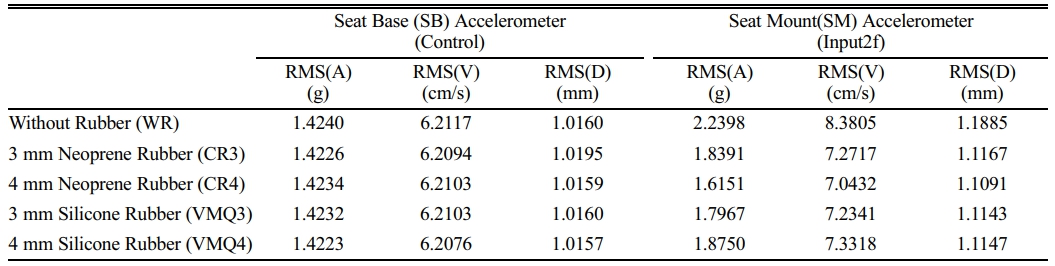
For a more in-depth investigation of suspension performance, the measured accelerations are calculated using root mean square (RMS). Table 6 shows the RMS results, which show a minimum transmissibility of 0.014889 km/s2 RMS Acceleration, 6.62675 cm/s RMS Velocity, and 1.0625 mm Displacement in 4 mm Neoprene Rubber (CR4) Sheet.
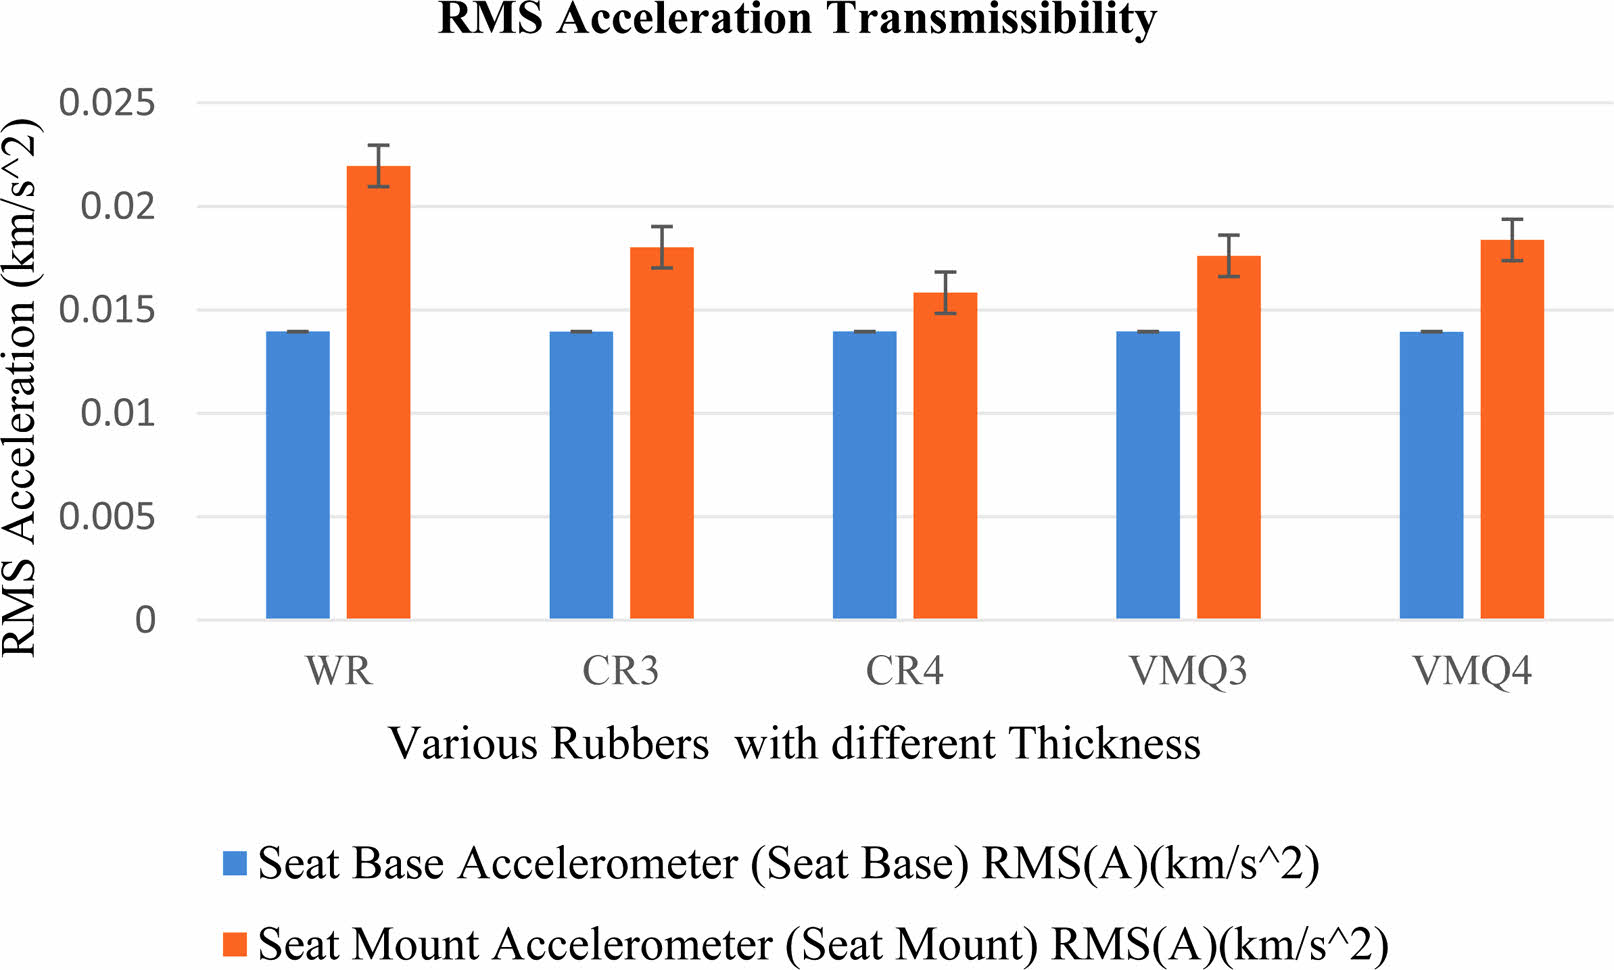
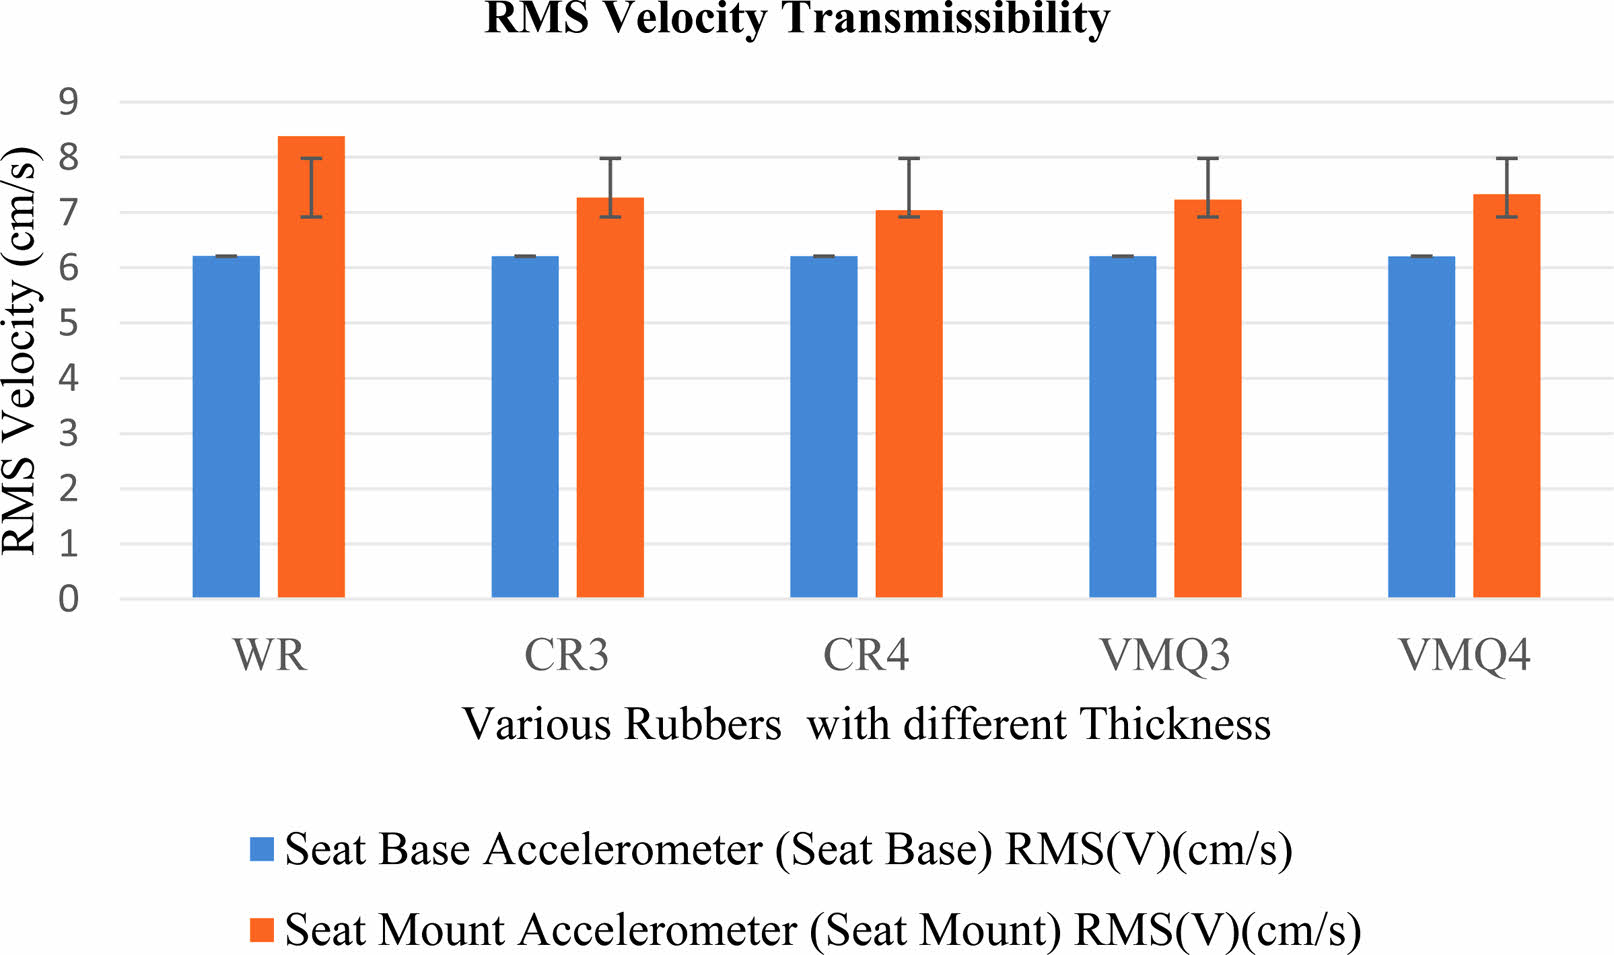
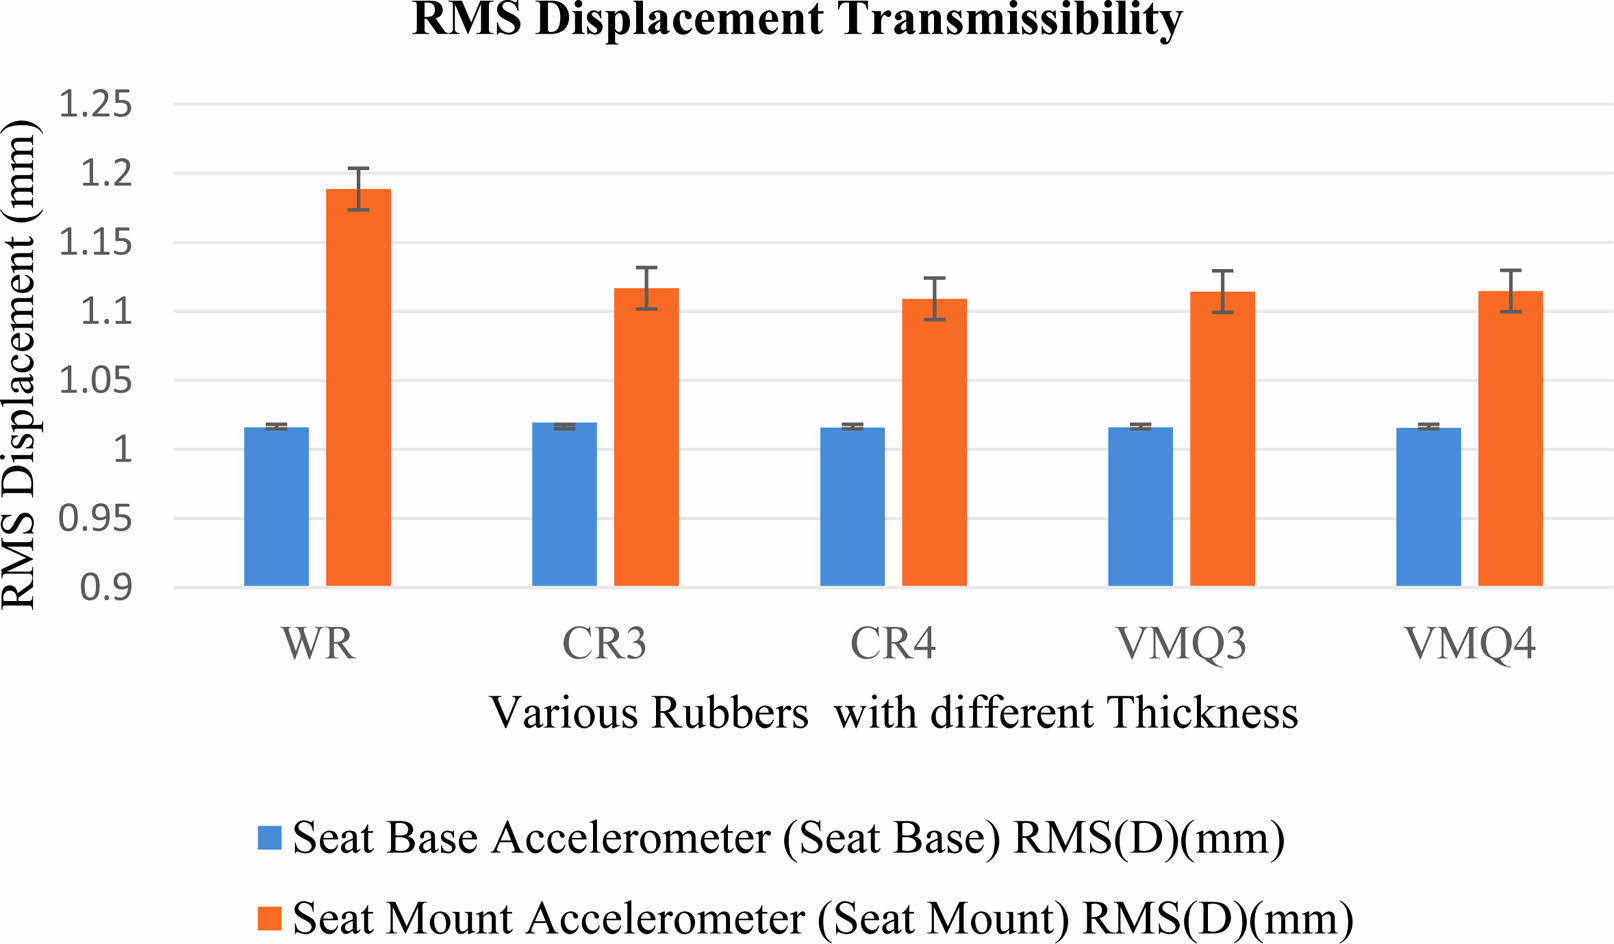
Figures 19 and 20 depict acceleration transmissibility, Fig. 21 depicts velocity transmissibility, and Fig. 22 depicts displacement transmissibility, which is calculated as the relation of the Vibration Shaker Table's RMS values to the Seat Base's RMS values. It can be seen that the 4 mm Neoprene Rubber (CR4) Sheet found to outperform the 3 mm Silicone Rubber (VMQ3), 4 mm Silicone Rubber (VMQ4), 3 mm Neoprene Rubber (CR3), and the Vehicle Seat without rubber (WR) mounting.
When we compare the transmissibility of 4 mm Neoprene rubber (CR4) sheet mount between Vibrating table and Automobile seat base (SB) to 3 mm Neoprene rubber (CR3), 3 mm silicone rubber (VMQ3), 4 mm silicone rubber (CR4) and without rubber (WR) sheet refer from Fig. 19, Fig. 20 and Fig. 21. Otherwise, when comparing the transmissibility of the four rubber sheets mounted between the seat as an isolating material and without a rubber sheet, the variation in transmissibility values varies with rubber material and thickness. Table 3, 4, 5,
Fig. 3, 4, 5, 6, 7, 8, 9, 10, 11, 12, 13, 14, 15, 16, 17, 18, 19, 20, 21
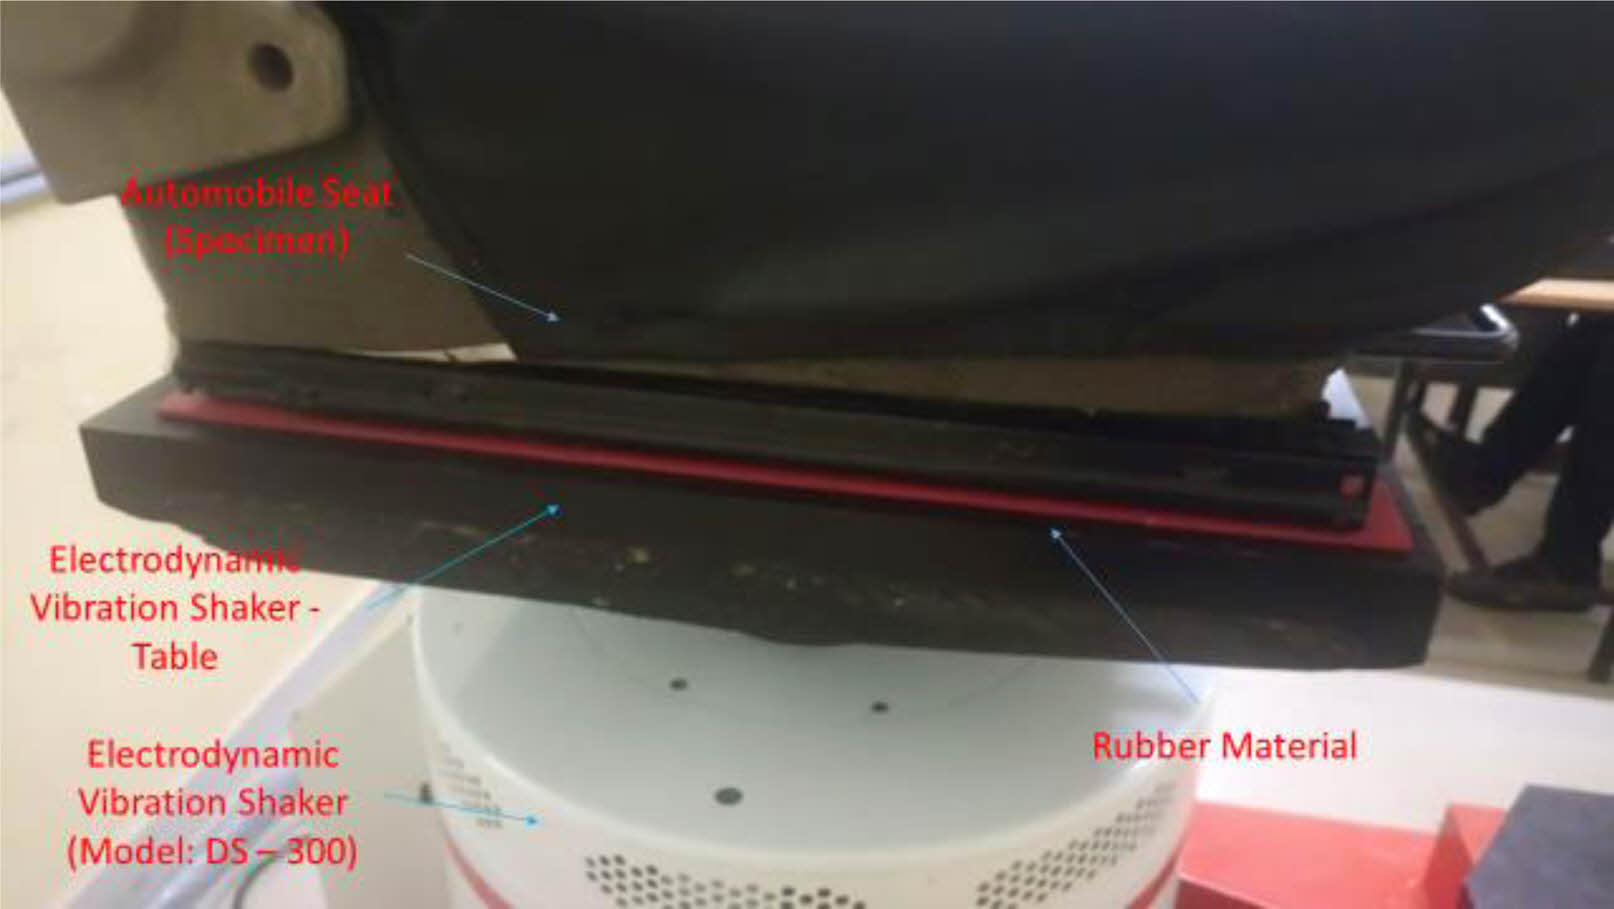
|
Fig. 3 Automobile Seat Mounting on Vibration shaker table with Rubber Sheet. |
|
Fig. 4 Without Rubber Mount (WR) - Frequency vs Acceleration. |
|
Fig. 5 3 mm Neoprene Rubber Mount (CR3) - Frequency vs Acceleration. |
|
Fig. 6 4 mm Neoprene Rubber Mount (CR4) - Frequency vs Acceleration. |
|
Fig. 7 3 mm Silicone Rubber Mount (VMQ3) - Frequency vs Acceleration. |
|
Fig. 8 4 mm Silicone Rubber Mount (VMQ4) -Frequency vs Acceleration. |
|
Fig. 9 Without Rubber Mount (WR) - Frequency vs Velocity. |
|
Fig. 10 3 mm Neoprene Rubber Mount (CR3) - Frequency vs Velocity. |
|
Fig. 11 4 mm Neoprene Rubber Mount (CR4) - Frequency vs Velocity |
|
Fig. 12 3 mm Silicone Rubber Mount (VMQ3) - Frequency vs Velocity. |
|
Fig. 13 3 mm Silicone Rubber Mount (VMQ3) - Frequency vs Velocity. |
|
Fig. 14 Without Rubber Mount (WR)-Frequency vs Displacement. |
|
Fig. 15 3 mm Neoprene Rubber Mount (CR3) - Frequency vs Displacement. |
|
Fig. 16 4 mm Neoprene Rubber Mount (CR4) - Frequency vs Displacement. |
|
Fig. 17 3 mm Silicone Rubber Mount (VMQ3) - Frequency vs Displacement |
|
Fig. 18 4 mm Silicone Rubber Mount (VMQ4) - Frequency vs Displacement. |
|
Fig. 19 RMS Acceleration Transmissibility. |
|
Fig. 20 RMS Velocity Transmissibility. |
|
Fig. 21 RMS Displacement Transmissibility |
|
Table 3 Sinusoidal Signal for Seat Base (SB) Accelerometer (Control) and Seat Mount (SM) Accelerometer (Input2f) in a various rubber sheets. |
|
Table 5 RMS of acceleration, velocity and Displacements in a various rubber sheets (Evaluation of Dominant SEAT Transmissibility Analysis). |
|
Table 6 RMS acceleration, velocity and displacement averages for various rubber sheets. |
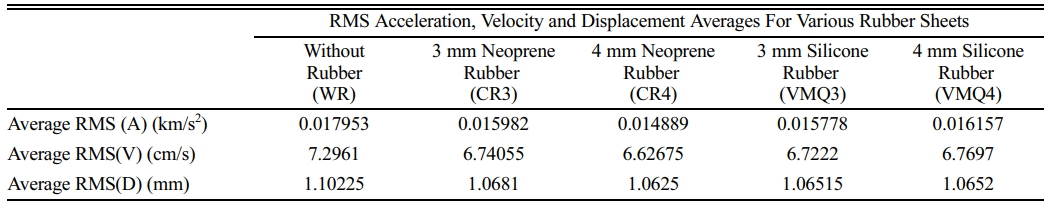
The primary goal of this work is to compare the transmissibility of Rubber Sheets such as Silicon Rubber (VMQ) and Neoprene Rubber (CR) with varying thickness sheets mounted in a vehicle seat. When compared to other rubber sheets, 4 mm Neoprene Rubber (CR4) exhibits reliable and good isolation behaviour’s. According to the discussions, the 4 mm Neoprene Rubber (CR4) has good isolation properties. Depending on the results obtained and the level of isolation effectiveness. Figs. 22, 23 & 24 show that when compared to 3 mm Neoprene rubber (CR3), 3 mm silicone rubber (VMQ3), 4 mm silicone rubber (VMQ4) sheet, and without rubber Mount (WR), the 4 mm Neoprene rubber (CR4) significantly reduces vibration Transmissibility. Table 6 displays the RMS results, which show that the minimum transmissibility in 4 mm Neoprene Rubber (CR4) Sheet is 0.014889 km/s2 RMS Acceleration, 6.62675 cm/s RMS Velocity, and 1.0625 mm Displacement.
This research is supported by All India Council for Technical Education – Research Promotion Scheme (AICTE-RPS) [File No. 8-104/FDC/RPS/POLICY-1/2021-22]
No participation of humans takes place in this implementation process
No violation of Human and Animal Rights is involved.
No funding is involved in this work.
Conflict of Interest is not applicable in this work.
All authors are contributed equally to this work
- 1. M.J. Griffin, Technol. Eng. (2012) 616-637.
-

- 2. Z. Lin, J. Zhang, M. Li, Y. Zhuang, C. Liu, and J. Lin, J. Sound Vib. 529 (2022) 116939.
-
- 3. L. Picu, M. Picu, and E.V.C. Rusu, Int. Multidiscip. Scientif. Geo Conf. 30 (2018).
- 4. N. Zhang and Q. Zhao, J. of Vibration Eng. Technol. 9 (2021) 1885-1902.
-
- 5. T.D. Le and K.K. Ahn, J. of Sound Vibrat. 330[26] (2011) 6311-6335.
-
- 6. L. Cheng, H. Wen, X. Ni, C. Zhuang, W. Zhang, and H. Huang, Mach. 11 (2022) 30.
-
- 7. S. Santhosh, V. Velmurugan, V. Paramasivam, and S. Thanikaikarasan, Mater. Today: Proc. 21 (2020) 638-642.
-
- 8. S. Sun, J. Yang, P. Wang, M. Nakano, L. Shen, S. Zhang, and W. Li. Front. Mater. 8 (2021) 594843.
-
- 9. T.E. Coe, J.T. Xing, R.A. Shenoi, and D. Taunton, Ocean Eng. 36 (2009) 732-746.
-
- 10. J.S. Karajagikar, N.R. Rajhans, B.B. Ahuja, and R.G. Rajhans, SAE Int. (2011).
-
- 11. J.L. Van Niekerk, W.J. Pielemeier, and J.A. Greenberg. J. of Sound and Vib. 260 (2003) 867-888.
-
- 12. E. Carletti and F. Pedrielli, Int. J. Ind. Ergonomics. 68 (2018) 46-56.
-
- 13. W.J. Pielemeier, J.A. Greenberg, V. Jeyabalan, and J.L. Van Niekerk, SAE Int. (2001).
-
- 14. S.A. Kumaresh and M.F. Aladdin, AIP Publ. (2019).
-
- 15. K.Y. Lin, J.R. Hwang, J.M. Chang, and J.L. Doong, Int. J. Vehicle Design. 57 (2011) 162-177.
-
- 16. M. Fellenius, Technol. Eng. Sci. (2017) 1-30.
- 17. L. Dahilm, Inter. J. of Electron. Mech. Mechatronics Eng. 6[1] (2016).
- 18. A.N. Rimell, and J. Neil, J. Mansfield. Ind. Health., 45 (2007) 512-519.
-
- 19. M. Fellenius, dB Eng. (2017).
- 20. S.K. Patra, S. Rakheja, H. Nelisse, P.É. Boileau, and J. Boutin. Int. J. Ind. Ergonomics. 38 (2008) 483-498.
-
- 21. J. Mansfield, P. Holmlund, R. Lundström, P. Lenzuni, and P. Nataletti, J. Biomechanics. 39 (2006) 3062-3070.
-
- 22. S. Rakheja, S. Sankar, and Y. Afework, Int. Rep. (1988).
- 23. A.V. der Westhuizen and J.L. van Niekerk, J. Sound Vib. 295 (2006) 1060-1075.
-
- 24. G.S. Paddan and M.J. Griffin. J. Sound Vib. 253 (2002) 215-241.
-
- 25. S. Sivakumar and L. Jayakumar, Sound Vib. 53 (2019).
-
- 26. S. Solaiachari and J. Lakshmipathy, J. Vib. Control. 29 (2023) 689-699.
-
- 27. S. Solaiachari and J. Lakshmipathy, Iranian J. Sci. Technol. (2021) 1-11.
-
- 28. S.K. Kim, S.W. White, A.K. Bajaj, and P. Davies, J. Sound Vib. 264 (2003) 49-90.
-
- 29. R.A. Hassan and K. McManus, J. Low Freq. Noise, Vib. Active Control. 21 (2002).
-
- 30. I.A. Rehn, Börje, C. Bergdahl, C. Ahlgren, B. Järvholm, R. Lundström, T. Nilsson, and G. Sundelin, J. Sound Vib. 253 (2002) 21-29.
-
- 31. R.J. Doolan and V.F. Mannino, SAE Tech. Paper. (1995).
-
- 32. K. Yabe, T. Inagaki, and T. Kondo, SAE Tech. Paper (2015).
-
- 33. R. Tamaki, K. Konishi, and M. Murata, JSAE Annual Congress Proc. [138-13].
- 34. K. Kazuhito, S. Kitazaki, and H. Tobata, SAE Tech. Paper. (2004).
-
- 35. L. Wei and J. Griffin, J. Sound Vib. 214 (1998) 121-137.
-
- 36. P. Boileau, (1996) 6340-6340.
- 37. S. Thanikaikarasan, G. Masthanvali, and V. Velmurugan, Mater. Today: Proc. 46 (2021) 10244-10247.
-
- 38. M. Kolich, S.D. Essenmacher, and J.T. McEvoy, J. Sound Vib. 281 (2005).
-
- 39. W. Wang, S. Rakheja, and P.E. Boileau, Int. J. of Ind. Ergonomics. 34 (2004).
-
- 40. M. Oliver, P. Hope, L. Conrad, R.J. Jack, J.P. Dickey, and T. Eger, Occupational Ergonomics (2016).
-
- 41. S.J. Park, S.M. Min, M. Subramaniyam, H. Lee, D. Gyun Kim, and C. Pyo Hong, SAE Int. (2014).
-
 This Article
-
2023; 24(5): 907-920
Published on Oct 31, 2023
- 10.36410/jcpr.2023.24.5.907
- Received on Aug 17, 2023
- Revised on Aug 30, 2023
- Accepted on Sep 17, 2023
Services
- Abstract
introduction
evaluating theory
experimental setup
testing methods
result and discussion
conclusion
- Acknowledgements
- Ethics Approval and Consent to Participate
- Human and Animal Rights
- Funding
- Conflict of Interest
- Author Contributions
- References
- Full Text PDF
Shared
Correspondence to
- V. Pugazhenthi
-
Department of Mechanical Engineering, Mailam Engineering College, Mailam, Villupuram-604304, Tamilnadu, India
Tel : 9444932734 - E-mail: vpmech@rocketmail.com
Clean-Energy Research Institute(CRI), Hanyang University, 222, Wangsimni-ro, Seongdong-gu, Seoul, 04763, Korea
E-mail: jcpr@hanyang.ac.kr