


- Exploring the relationship between TIG welding current and AA5754-H111 joint characteristics
G. Tamil Kumarana,* and K.S. Jayakumarb
aDepartment of Mechanical Engineering, DMI College of Engineering, Chennai, India – 600123
bDepartment of Mechanical Engineering, Sri Sivasubramaniya Nadar College of Engineering, Chennai, IndiaThis article is an open access article distributed under the terms of the Creative Commons Attribution Non-Commercial License (http://creativecommons.org/licenses/by-nc/4.0) which permits unrestricted non-commercial use, distribution, and reproduction in any medium, provided the original work is properly cited.
This study focused on the effects of pulse current factors, such as peak current, base current, pulse frequency, and pulse length, on the mechanical and metallurgical characteristics of AA5754-H111 steel during gas tungsten arc welding. A total of eighteen connections were created by correcting the above changes. The purpose of the current research is to examine the mechanical and microstructural characteristics of welded joints. The optical microscope and SEM analysis were used to carry out the metallurgical characterization. The different types of welding parameter used and evaluated all the welded samples. The combination of 160A peak current, 75 Hz pulse frequency, and a 42% duration pulse results in the welded samples' superior mechanical properties as compared to other input welding conditions. These joints have advantages such as consistently distributed deposits, better fusion zone hardness, and increased grain quality in the weld zone. These characteristics assist to enhance the tensile characteristics present in joints
Keywords: Aluminium alloy, TIG welding, Mechanical properties, Microstructural properties
Aluminium alloys are essential in mechanical engineering due to their lightweight, lightweight, and corrosion-resistant properties, making them ideal for high-strength components in sectors like aircraft and marine engineering [1-3]. Aluminium 5000 series alloys are vital in mechanical engineering due to their excellent properties such as weldability, corrosion resistance, and high strength-to-weight ratio. They are especially suited for building structures, automobile and aircraft chassis and other high-performance applications with high probability of fatigue related stresses [4, 5]. AA5754-H111 is an aluminium alloy with excellent formability and good strength; it is commonly used in automotive body panels and structural parts with emphasis on aesthetics and durability [6, 7].
The uses of aluminium 5000 series alloys are manifold and welding of such components is crucial. Aluminium alloys are heavily industrialized materials and are thus typically joined using different welding methods based on the specific requirements. Techniques such as Tungsten Inert Gas (TIG) welding, Metal Inert Gas (MIG) welding, Arc welding, Laser beam welding, Electron Beam welding, Resistance welding and specialized techniques such as Friction Stir Welding (FSW) methods have been used to join aluminium alloys of varying grades in either similar or dissimilar joint configurations [8]. FSW has seen tremendous increase in research in the recent years due to its relative recent introduction compared to established methods such as TIG, MIG welding processes [9]. However, FSW also entails notable disadvantages compared to TIG welding methods such as its inability to make filler joints, and it is incapable of joining thick aluminium materials, and production of Heat Affected Zone (HAZ) with poorer grain structure [10]. Thus, research in TIG welding is capable of contributing to reduction of weld defects, better microstructure control, and better joining of dissimilar metals [11]. There are many techniques employed for joining of aluminium depending on the applications, with the most notable being Tungsten Inert Gas (TIG) welding as it is capable of joining a wide range of aluminium alloys of different grades [12]. TIG welding is typically characterized by controlled heat input and cleaner welded joints resulting in potentially durable joints; TIG welding technology makes use of a tungsten electrode to join aluminium alloys. TIG welding of aluminium is also being constantly researched upon for potential improvements of weld joint performance [13-15]. Senthur Vaishnavan and Jayakumar [16] explored the impact of welding process parameters on tungsten inert gas welding of aluminum alloys 5083-H111 and 5754-H111 and found that the input current was the most significant influencing parameter. The optimized process parameters included 170 A input current, 11 lit/min gas flow rate, and 0.5% scandium addition weight. Manikandan et al. [17] investigated the impact of heat input on the mechanical properties of Al-5086 alloy during TIG welding. They reported that the increased heat input led to reduced porosity and crystallization fracturing, while a medium heat input (1e2 kJ/mm) resulted in the best mechanical qualities, with only 18.26% reduction in strength. Weld location affects the microstructural properties of TIG welded aluminum alloy. The base metal, the stress zone, and the fusion zone are the three distinct zones formed during the welding process. During welding, the cooling air has a significant impact on the shape of the melting zone and the heat affected zone. Huang et al. [18] reported optimized TIG welding of AA7055 with TiB2 ceramic particles was able to be result in enhanced joint with increased tensile strength and ductile fracture. The ceramic particles were responsible for reinforcing the joint making it suitable for lightweight and high-strength applications. Cheng et al. [19] reported that inclusion of TiC-TiB2 ceramic particles hindered coarsening of the grain structure, while modifying the precipitation of the joint during TIG welding of AA7055 alloy. They observed 3% improvement in tensile strength and 4% improvement in elongation during break compared to non-ceramic included welding process. Hadji et al. [20] reported that during TIG-brazing of stainless steel and aluminium, the included TiSiC ceramic interacted with the steel enabling better weld penetration. The ceramic created a complex phase with the steel side thereby reducing the occurrence of welding cracks. Senthilkumar et al. [21] found that peak current and pulse frequency directly affect the tensile properties of AA 6061 aluminium alloy weldments, while base current and pulse on time have an inverse relationship, with increased peak current increasing tensile strength and pulse on time decreasing it. Min et al. [22] examined the impact of heat input on the microstructures and mechanical properties of AZ61 magnesium alloy plates. Results showed that increased heat input coarsens grains in both fusion and heat-affected zones, increases the width of the heat-affected zone, decreases the continuous β-Mg17Al12 phase, and increases the ultimate tensile strength of the welded joint. Singh et al. [23] examined the effects of heat input on the microstructures and mechanical properties of AZ61 magnesium alloy plates, finding that increased heat input coarsens grains, widens the heat-affected zone, and increases welded joint tensile strength. Sivashanmugam et al. [24] examined the welding of 7075 alloy using Gas Tungsten Arc Welding and Gas Metal Arc Welding with argon as a shielding gas. Results showed that GMAW joints had lower strength compared to GTAW values, with a 28% improvement. Hardness was lower in the weld metal region compared to HAZ and BM regions, with high hardness in GTAW (HAZ) and GMAW (HAZ). He et al. [25] reported that by the use of twin aluminum hot wire technique in TIG welding-brazing improved joint formation, they were able to reduce interfacial intermetallic compounds, and increase the joint strength, resulting in reliable aluminum alloy and stainless-steel joints. Singh et al. [26] reported that in pulsed TIG welding, high peak current could result in deeper weld penetration, leading to more uniform thermal energy distributions and decreased solidification rate. Kumar and Sundarrajan [27] carried out research on tungsten inert gas (TIG) welding optimization for AA 5456 aluminium alloy welds. They emphasized the value of optimization in improving the mechanical characteristics of welds made with the AA 5456 aluminium alloy using pulsed TIG welding. According to their research, increasing the pulse current and frequency can result in welds with increased micro hardness and tensile strength. Ramarajan and Jayakumar [28] investigated the effect of pulsed TIG welding parameters on the properties of AA5083 and AA6082 welds. They found that increasing the pulse length and frequency resulted in greater tensile strength and stiffness of the weld. Guo et al. [29] examined the plasma-MIG hybrid welding process of 5083 aluminum alloy and found that the best welding parameters such as plasma arc current 100 A, MIG arc current 180 A, and welding speed 500 mm/min greatly improved the welding quality.
This present work is an investigation of TIG welding of AA5754-H111 alloy to understand the relationship between welding current variations and their impacts on the microstructure and overall properties of TIG welded joints. The goal is to evaluate the AA5754-H111 alloy's behavior when subjected to varying TIG welding currents, identifying how these variations in welding current may influence the microstructure characteristics of the welded joints to contribute valuable insights to the broader understanding of welding processes.
AA5754-H111
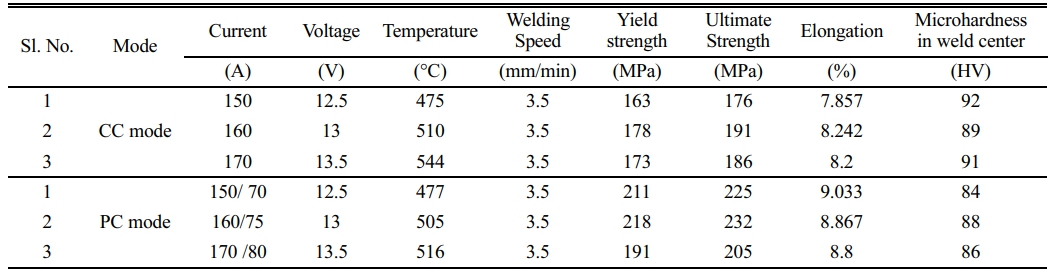
This study focused on the aluminium alloy AA5754-H111 and investigated the effects of TIG welding input current on joint characteristics. The objective was to comprehend how changes in welding current impact the properties and functionality of the welded joints in this particular aluminium alloy. This alloy is known for its high strength and cannot be cured. Therefore, it is widely used in applications requiring corrosion resistance and high mechanical strength. The design is known for its ease of machining and welding, as well as its ability to withstand stress and load. Its chemical composition can be deduced from Table 1.
Methods
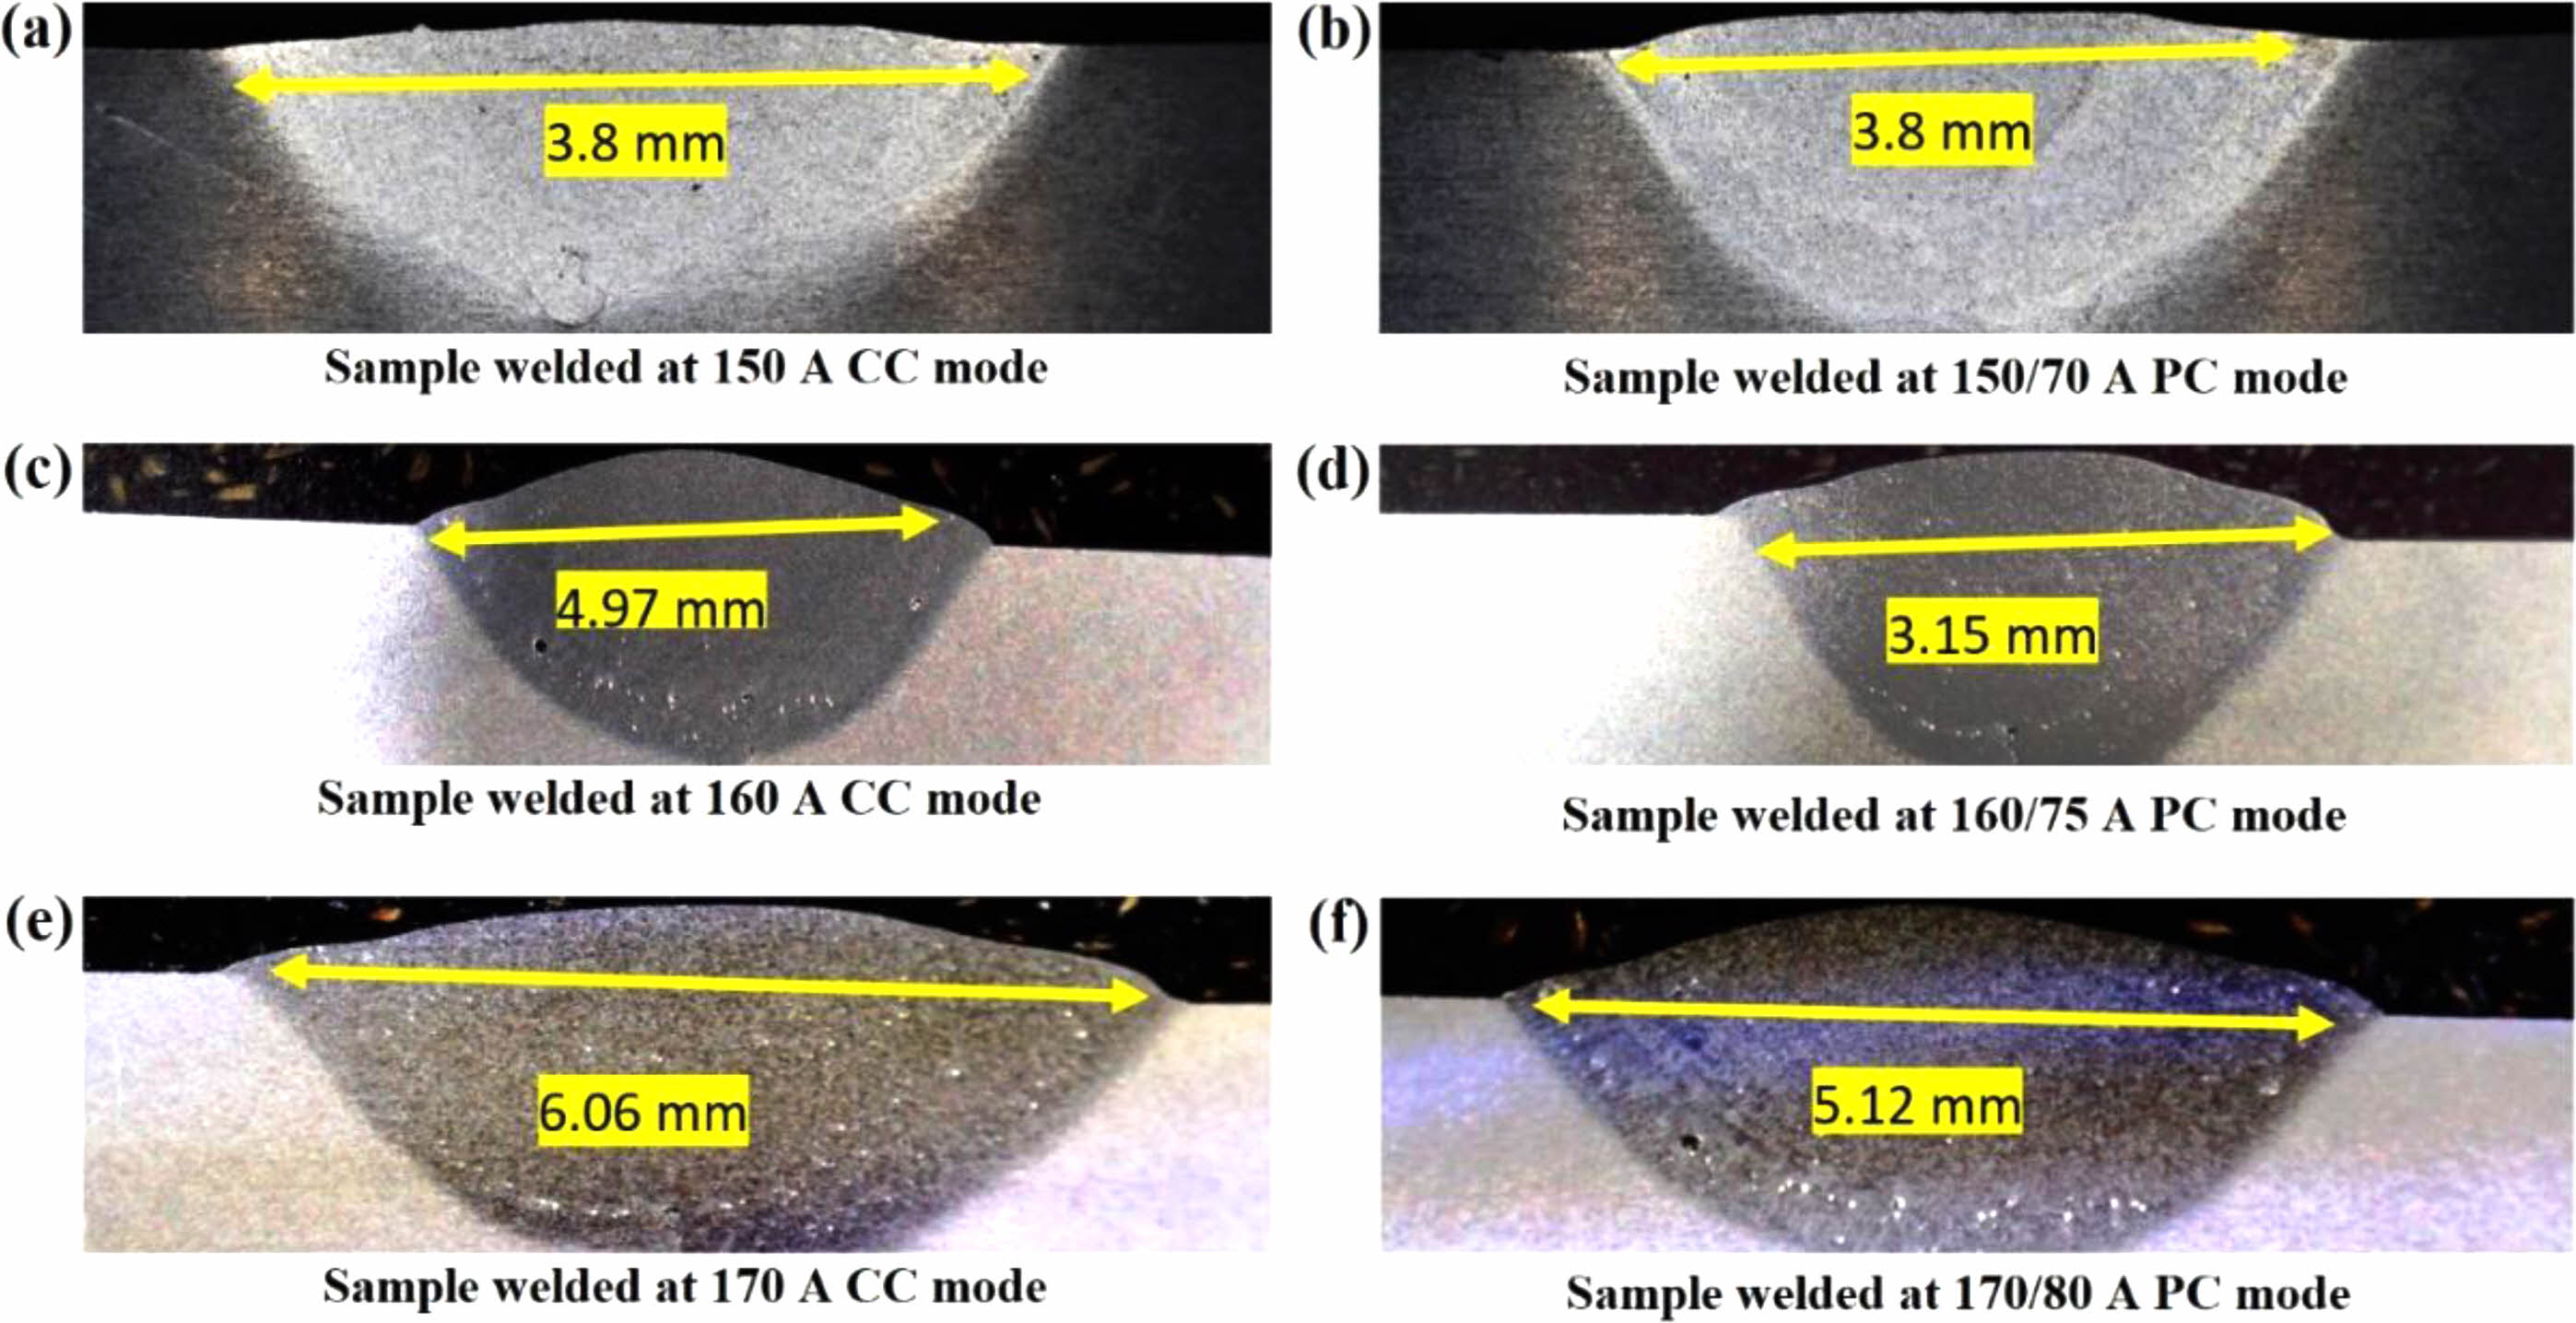
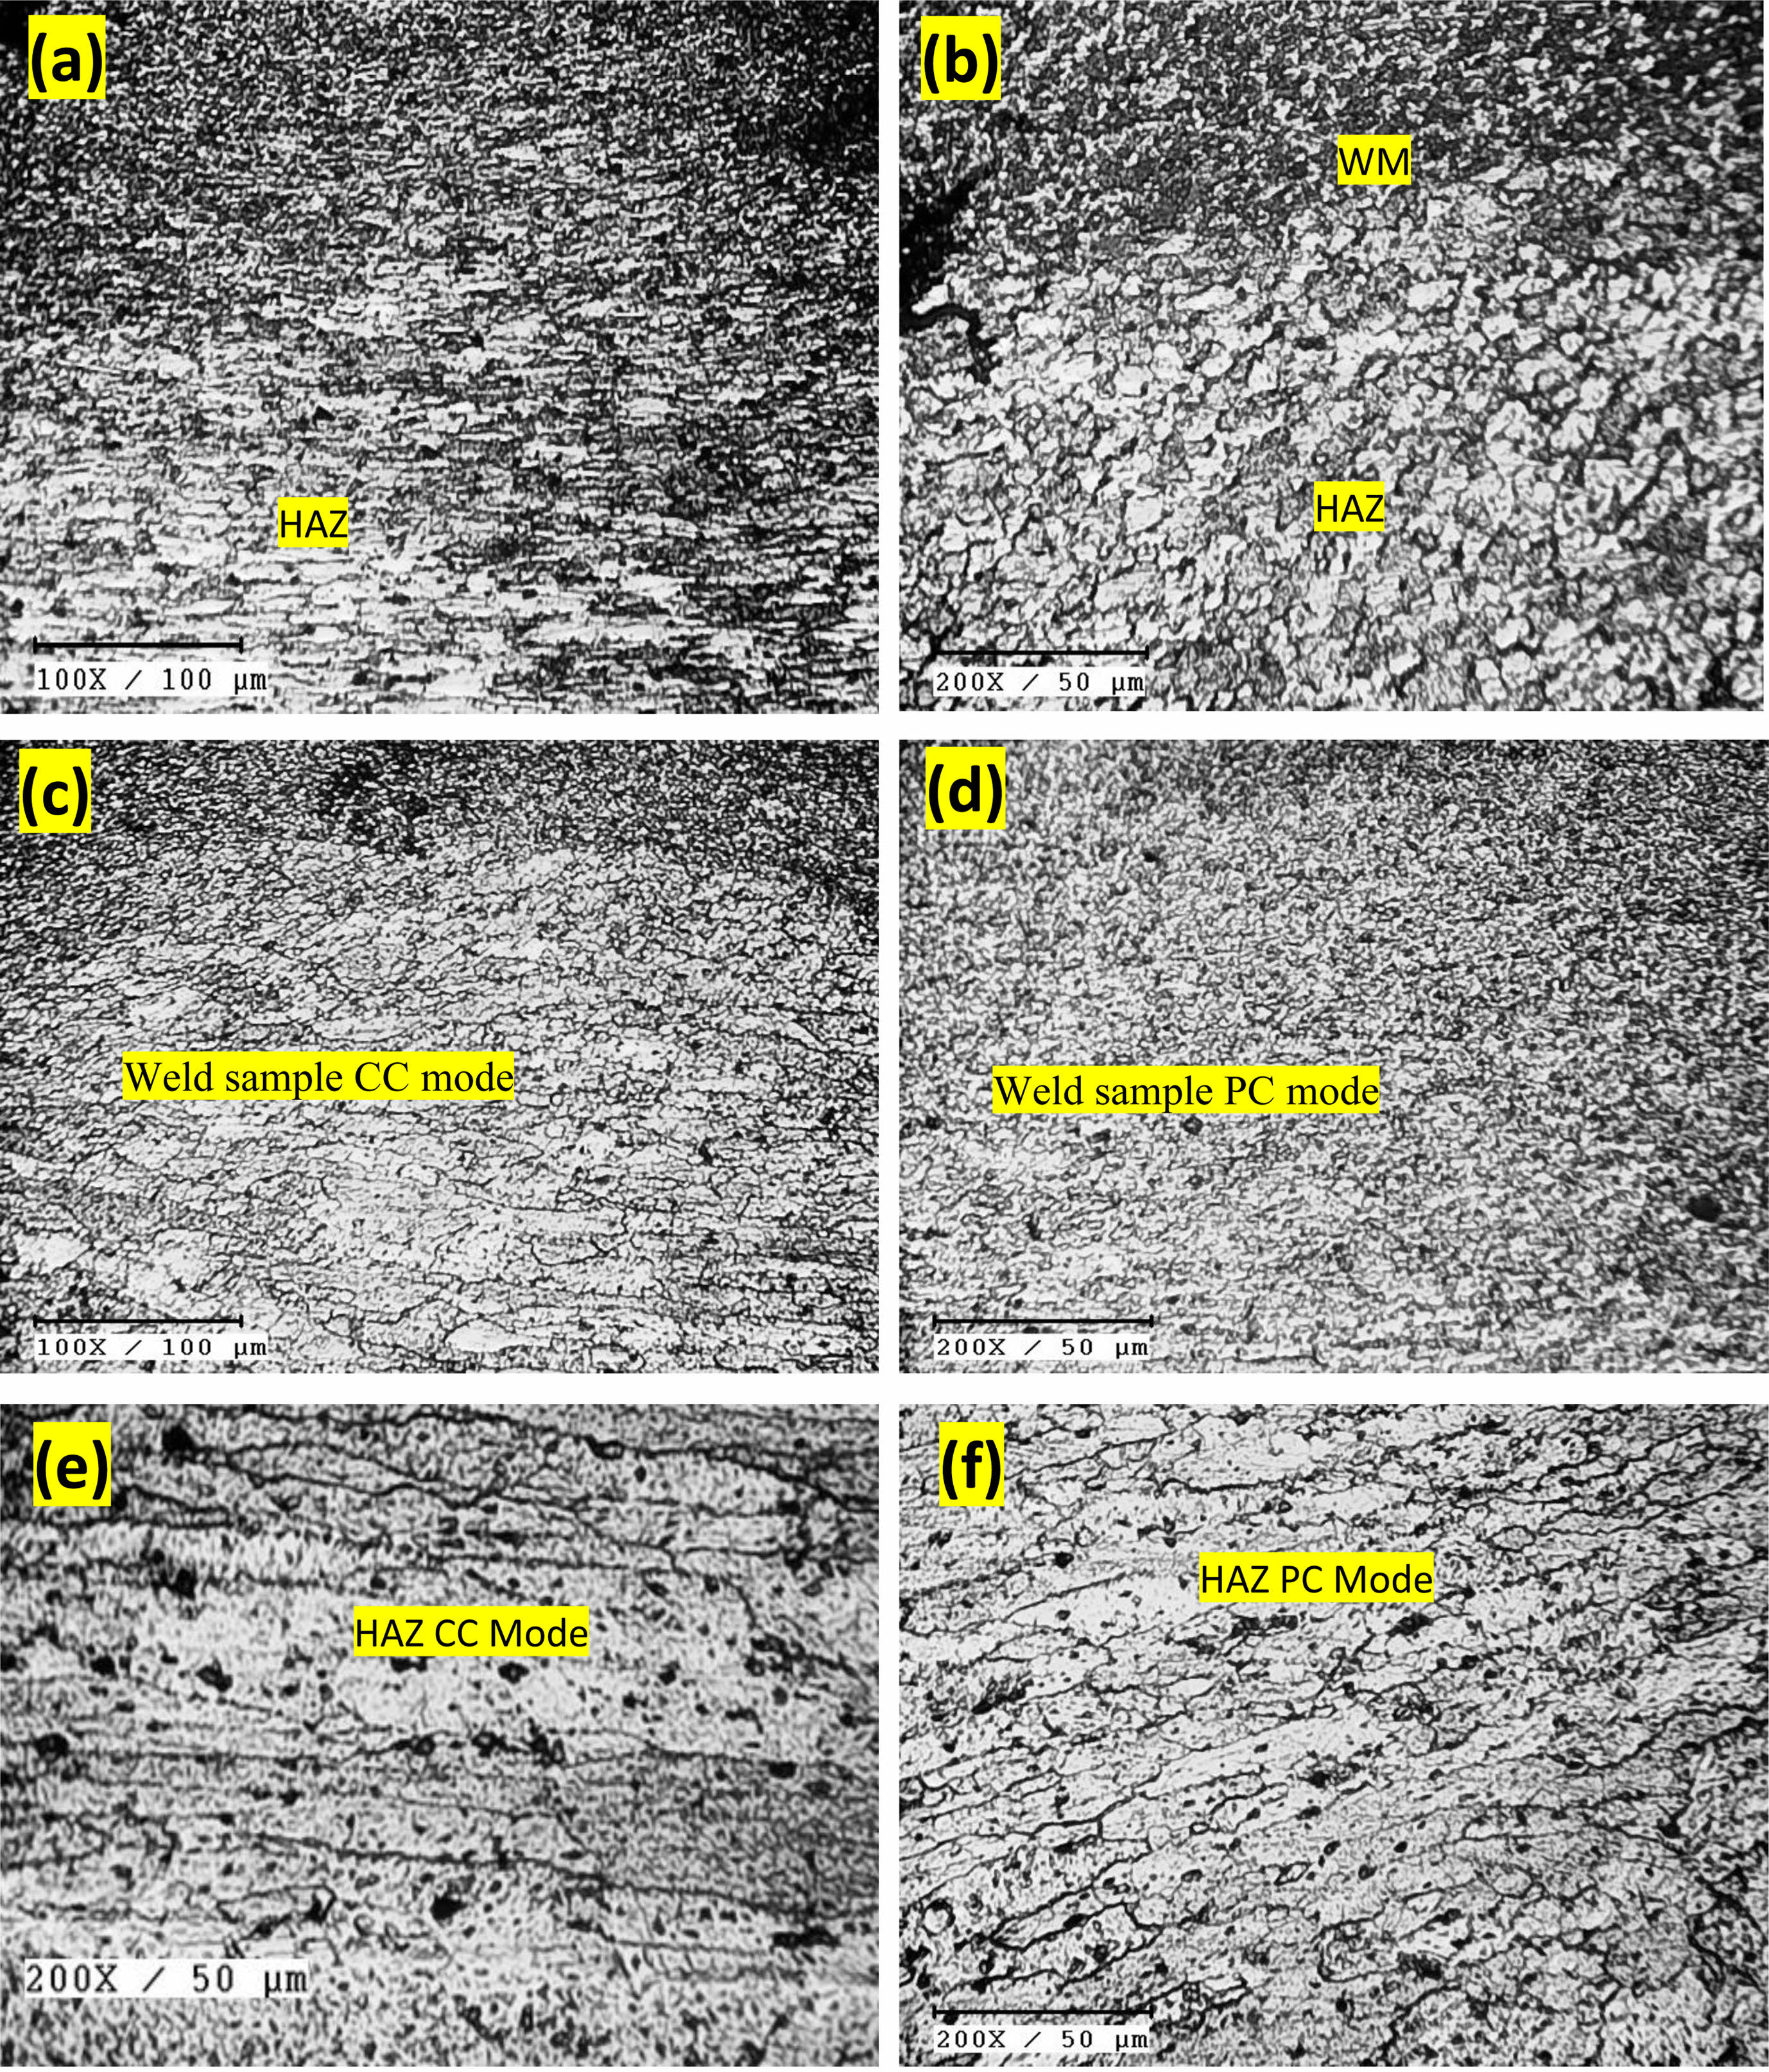
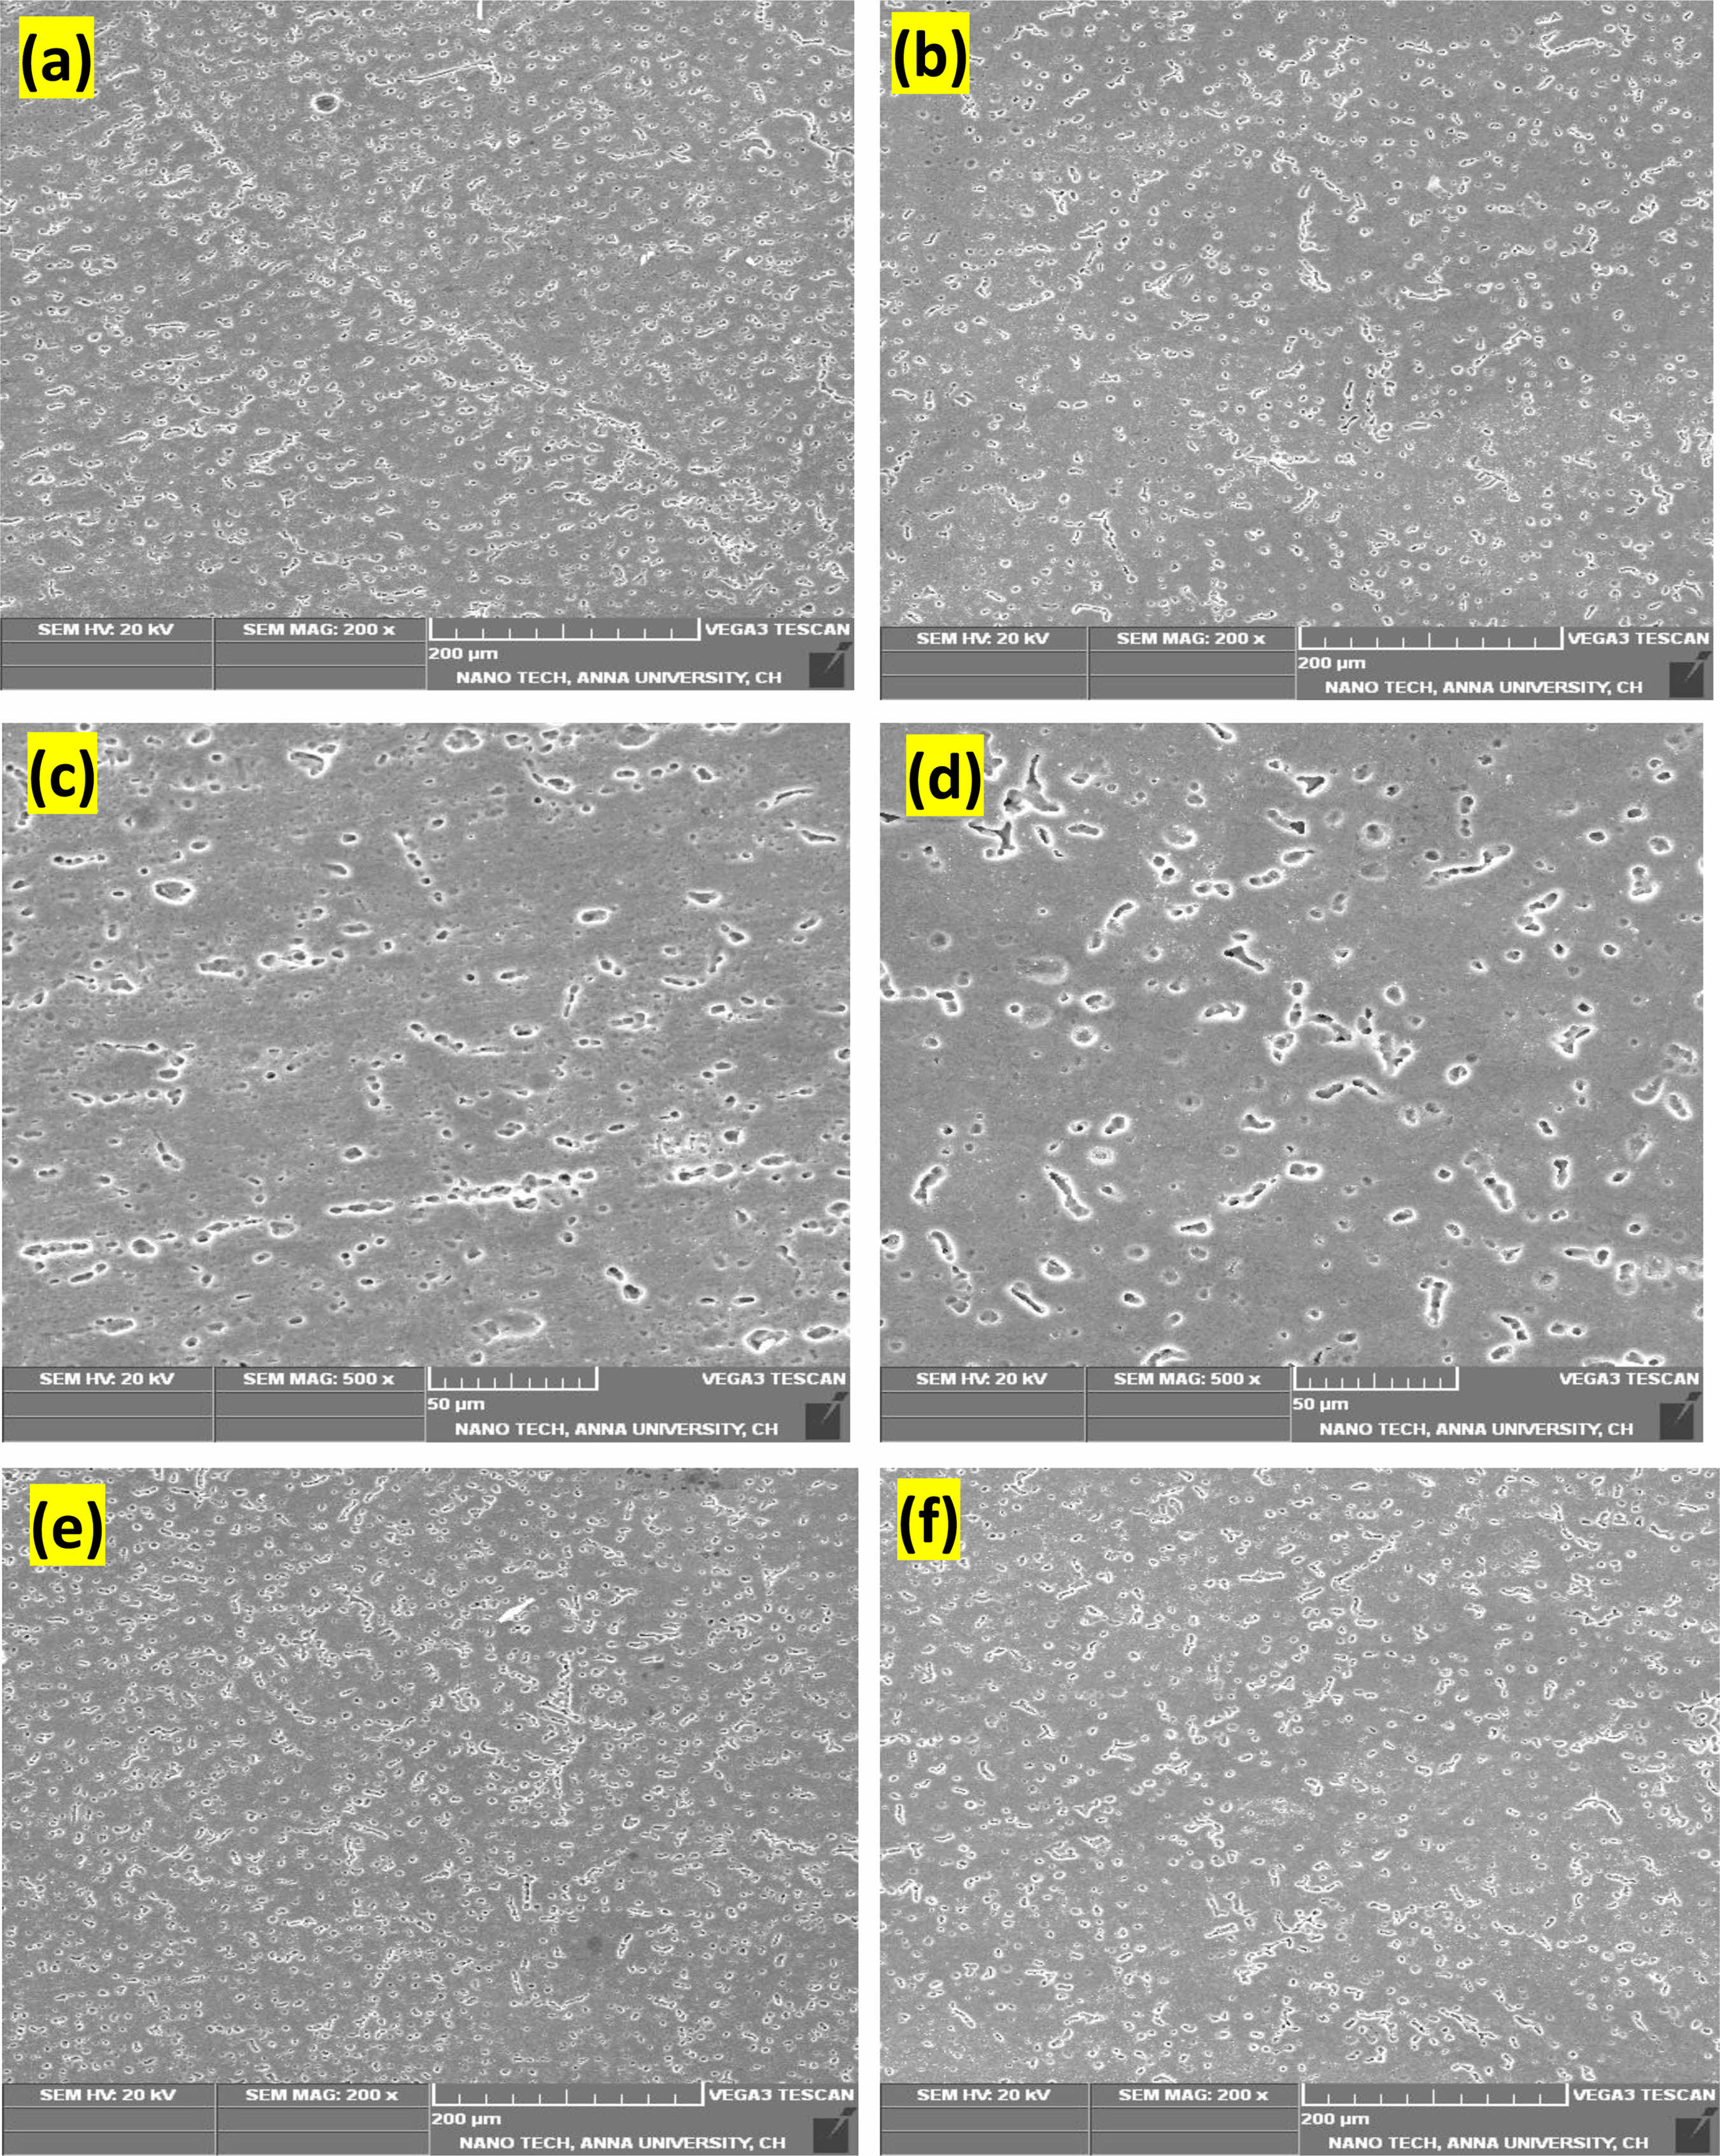
A study has been made to control the weld depth. Joints made using continuous currents show a penetration of 3.45 to 3.87 mm, while joints made using existing materials show a depth of 3.46 to 3 mm. Made 56mm. The penetration rate of the plate thickness for the existing connection and power supply is 0.36 and 0.38, respectively. These connectors have similar properties. Additional properties of the joints were investigated, including tensile properties, microhardness, microstructure, and residual stress. In this work, the tensile strength of the welded connection was assessed using a Universal Testing Machine (UTM). The UTM is a flexible testing device that can examine the mechanical characteristics of materials, including welded joints, by applying controlled tensile, compressive, or torsional stresses. The researchers were able to precisely and uniformly evaluate the tensile strength of the welded joints by using the UTM. To create a similar joint, the 6 mm thick welded plate is reduced to the 1.5 mm thick plate. Three models were evaluated for each joint and the results are shown in Table 2. The sample was made according to ASTM E8-04 requirements. This model has been tested for damage. For welded joints, fracture analysis can be used to analyze the microstructure of the joint and identify defects that could cause it to fail. The first step in identifying the bone of a welded joint is to carefully remove the bone and prepare it for pathological examination. The surface should be cleaned and polished to remove any residue or contaminants that may hinder inspection. After the surface is prepared, it can be examined under a scanning electron microscope (SEM) to identify features that may indicate failure. Hardness was then evaluated at three locations using a diamond-notched Vickers microhardness test tool (ASTM E384): joint weld, 5 mm from weld core and 15 mm from weld core. The applied force was 0.62 N and the indentation was held for 12 s, resulting in a Vickers microhardness measurement of 0.05 HV. Table 1 shows the Vickers hardness values of the weld zone 5 mm and 15 mm from the bead center for the two welding methods. The strength of the metal bond is affected by factors such as grain size and microstructural composition. The thermal cycle during welding has a significant effect on growth and expansion. The junction metal and interface region will be attractive because the junction metal has the highest temperature and cools rapidly, resulting in small grains. The polished surface of the welded sample was water etched after it was prepared according to conventional metallographic methods to obtain a clear image of the weld material. The program is combined with an optical lens. Figure 2 shows the results of the microstructure analysis performed in three areas: the contact area, the center of the source and the hazard zone (HAZ).
|
Fig. 1 Macrostructures of welded samples at CC and PC modes. |
|
Fig. 2 OM analysis (a) interface (b) HAZ interface (c) CC mode (d) PC mode (e) HAZ of CC mode (f) HAZ of PC mode. |

Macroscopy of weld cross section
Temperature of Cooling: Metal Used in the Weld: Composition Size of the Grain: These variables interact during welding to influence the final characteristics of the weld joint since they are interconnected. Additionally, important factors that affect the grain size and its stage of development within the weld are the heat input rate during welding and the cooling rate after welding. To achieve desired weld qualities, such as grain size and general mechanical strength, effective management of these factors is crucial. It's essential to comprehend and maximize these aspects to produce high-quality, dependable welded joints in a variety of applications. Images of the beads were taken using a stereo zoom lens. The weld piece morphology and related test results are shown in Fig. 1. 250 seconds were used to measure the weld zone's temperature. specifically, at 5, 15 and 30 mm from the center of the weld seam. A Lab VIEW DAQ (data acquisition) program was used to capture temperature data at 1-second intervals. Heating and cooling curves for different heat sources are shown in Table 2. The maximum temperature is also shown in Table 2. However, since the heat input of 544 J/mm causes cracks in the weld, no temperature measurements were recorded for this feature. Especially in the region where the temperature is higher than 5 mm from the weld center, the temperature drops from 100 °C to 200 °C was determined. The results are summarized in Table 2.
Microstructural analysis
The microstructure of the weld fusion zone in the joint samples is shown in Figs. 2(a) through 2(f). The micrographs show that the welding procedure significantly affects the grain size in the fusion zone of the aluminium alloy AA5754-H111. In contrast to earlier welds, the fusion zone produced by 160 A peak current, 75 A base current, 6 Hz pulse frequency, and 50% pulse period stands out for having favorable grain properties in the fusion area. The fusion zone also has a large number of moderately concentrated precipitated particles. Fig. 3
The microstructure of the welded joints created by decreasing the heat input is shown in Fig. 5. Partial weld penetration is seen at the coldest temperatures in welded junctions when the peak current is less than 160 A, the base current is less than 75 A, and the pulse duration is less than 50%. The joints decreased tensile strength may be caused in part by this insufficient penetration. According to earlier research [30, 31], using high-quality power would generally provide error-free access to the port.
Tensile Strength Analysis
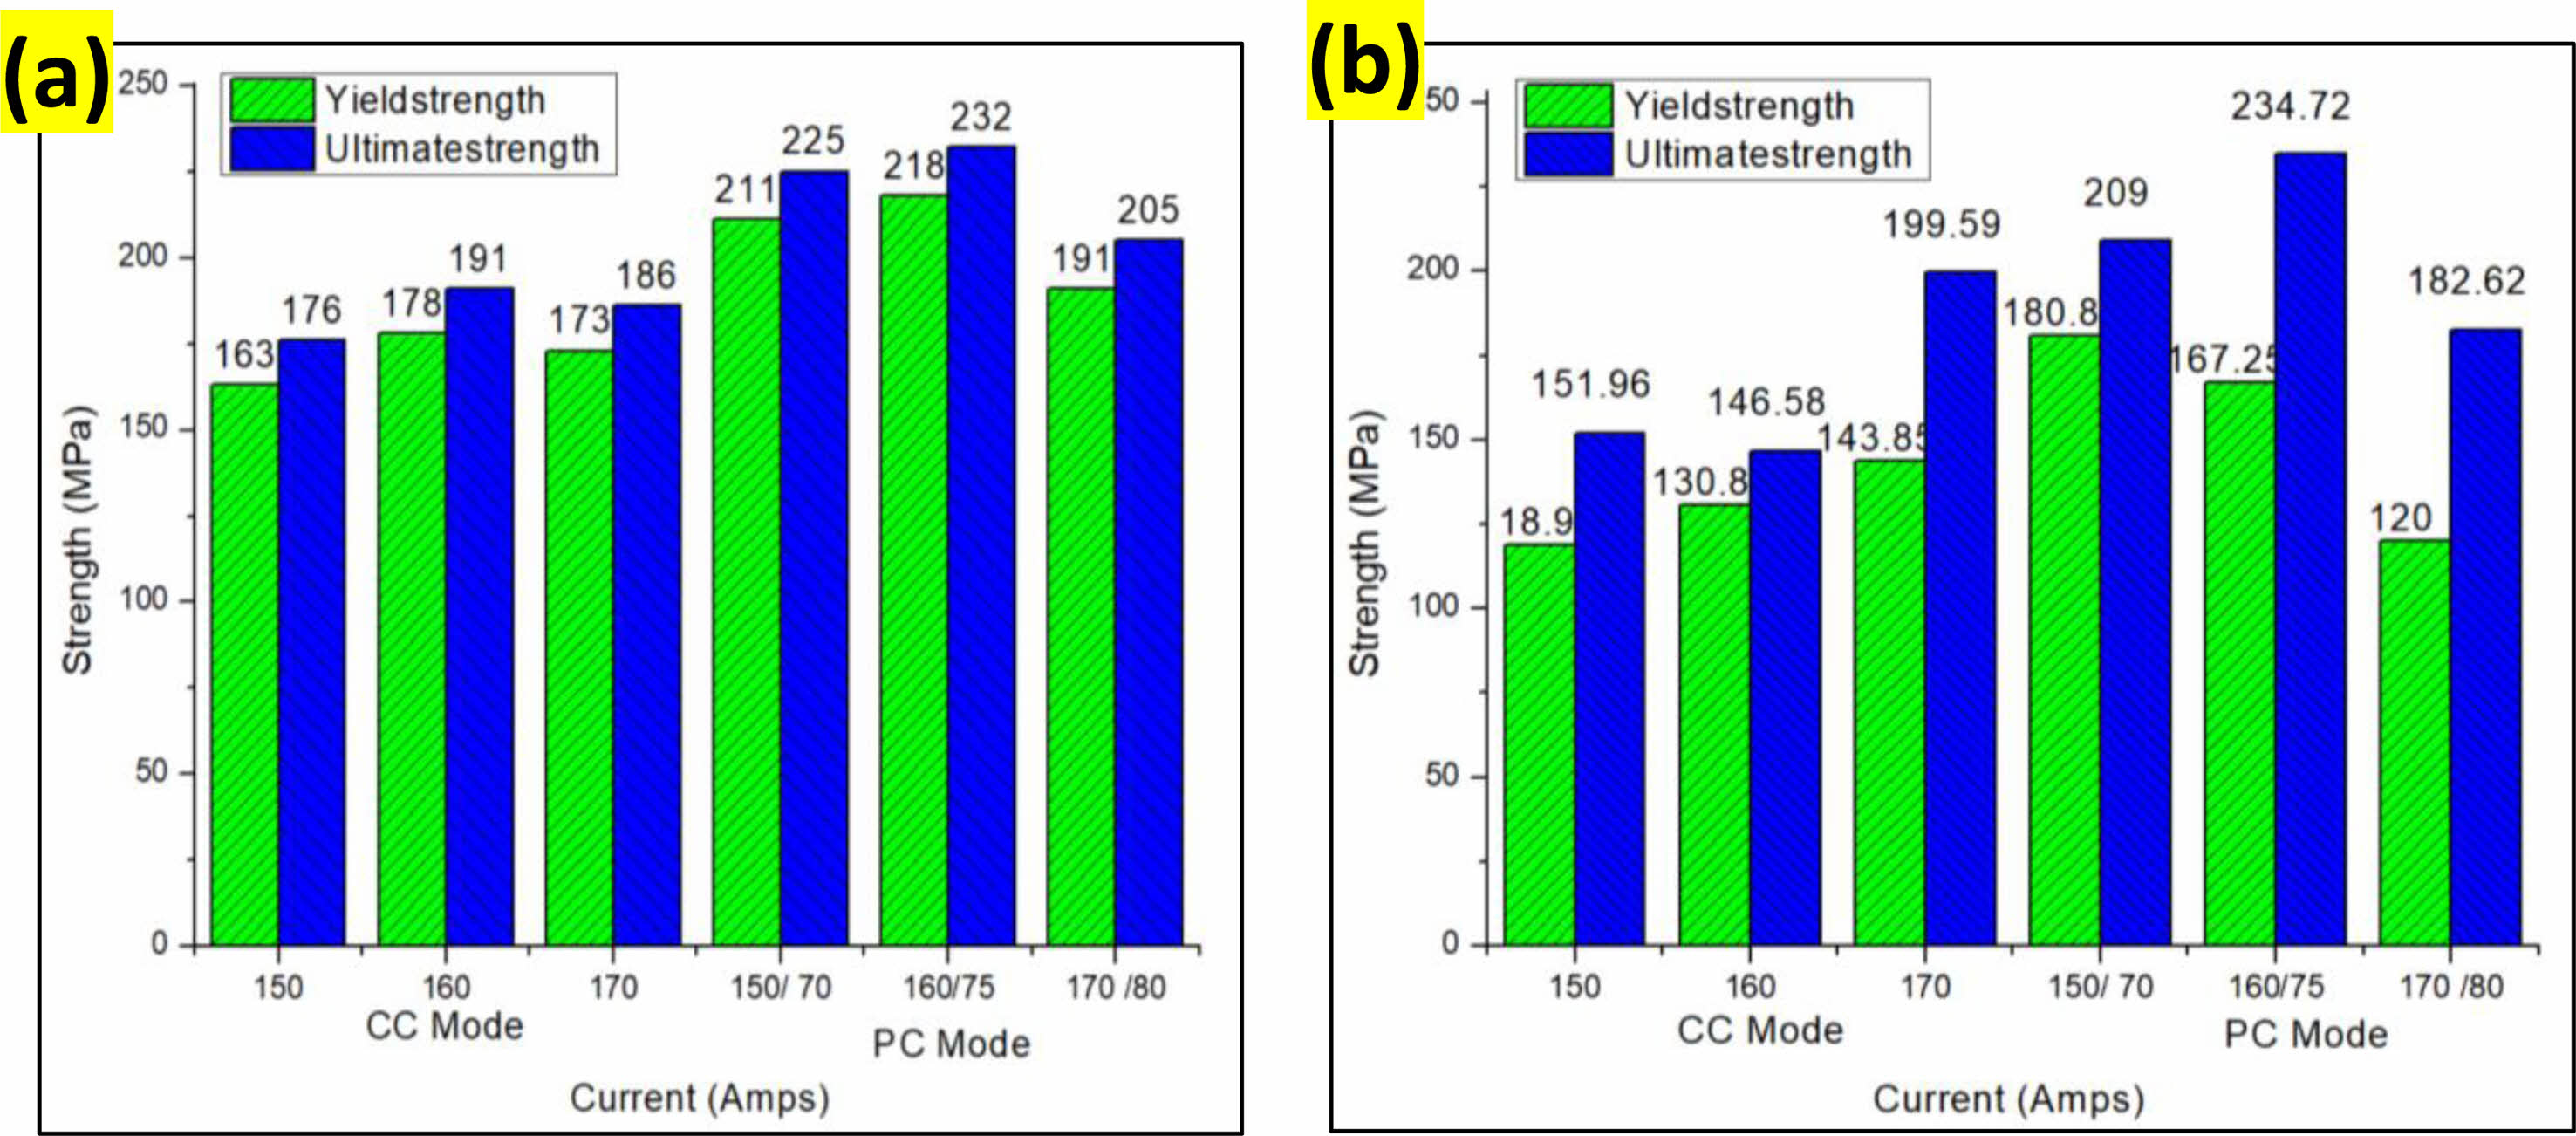
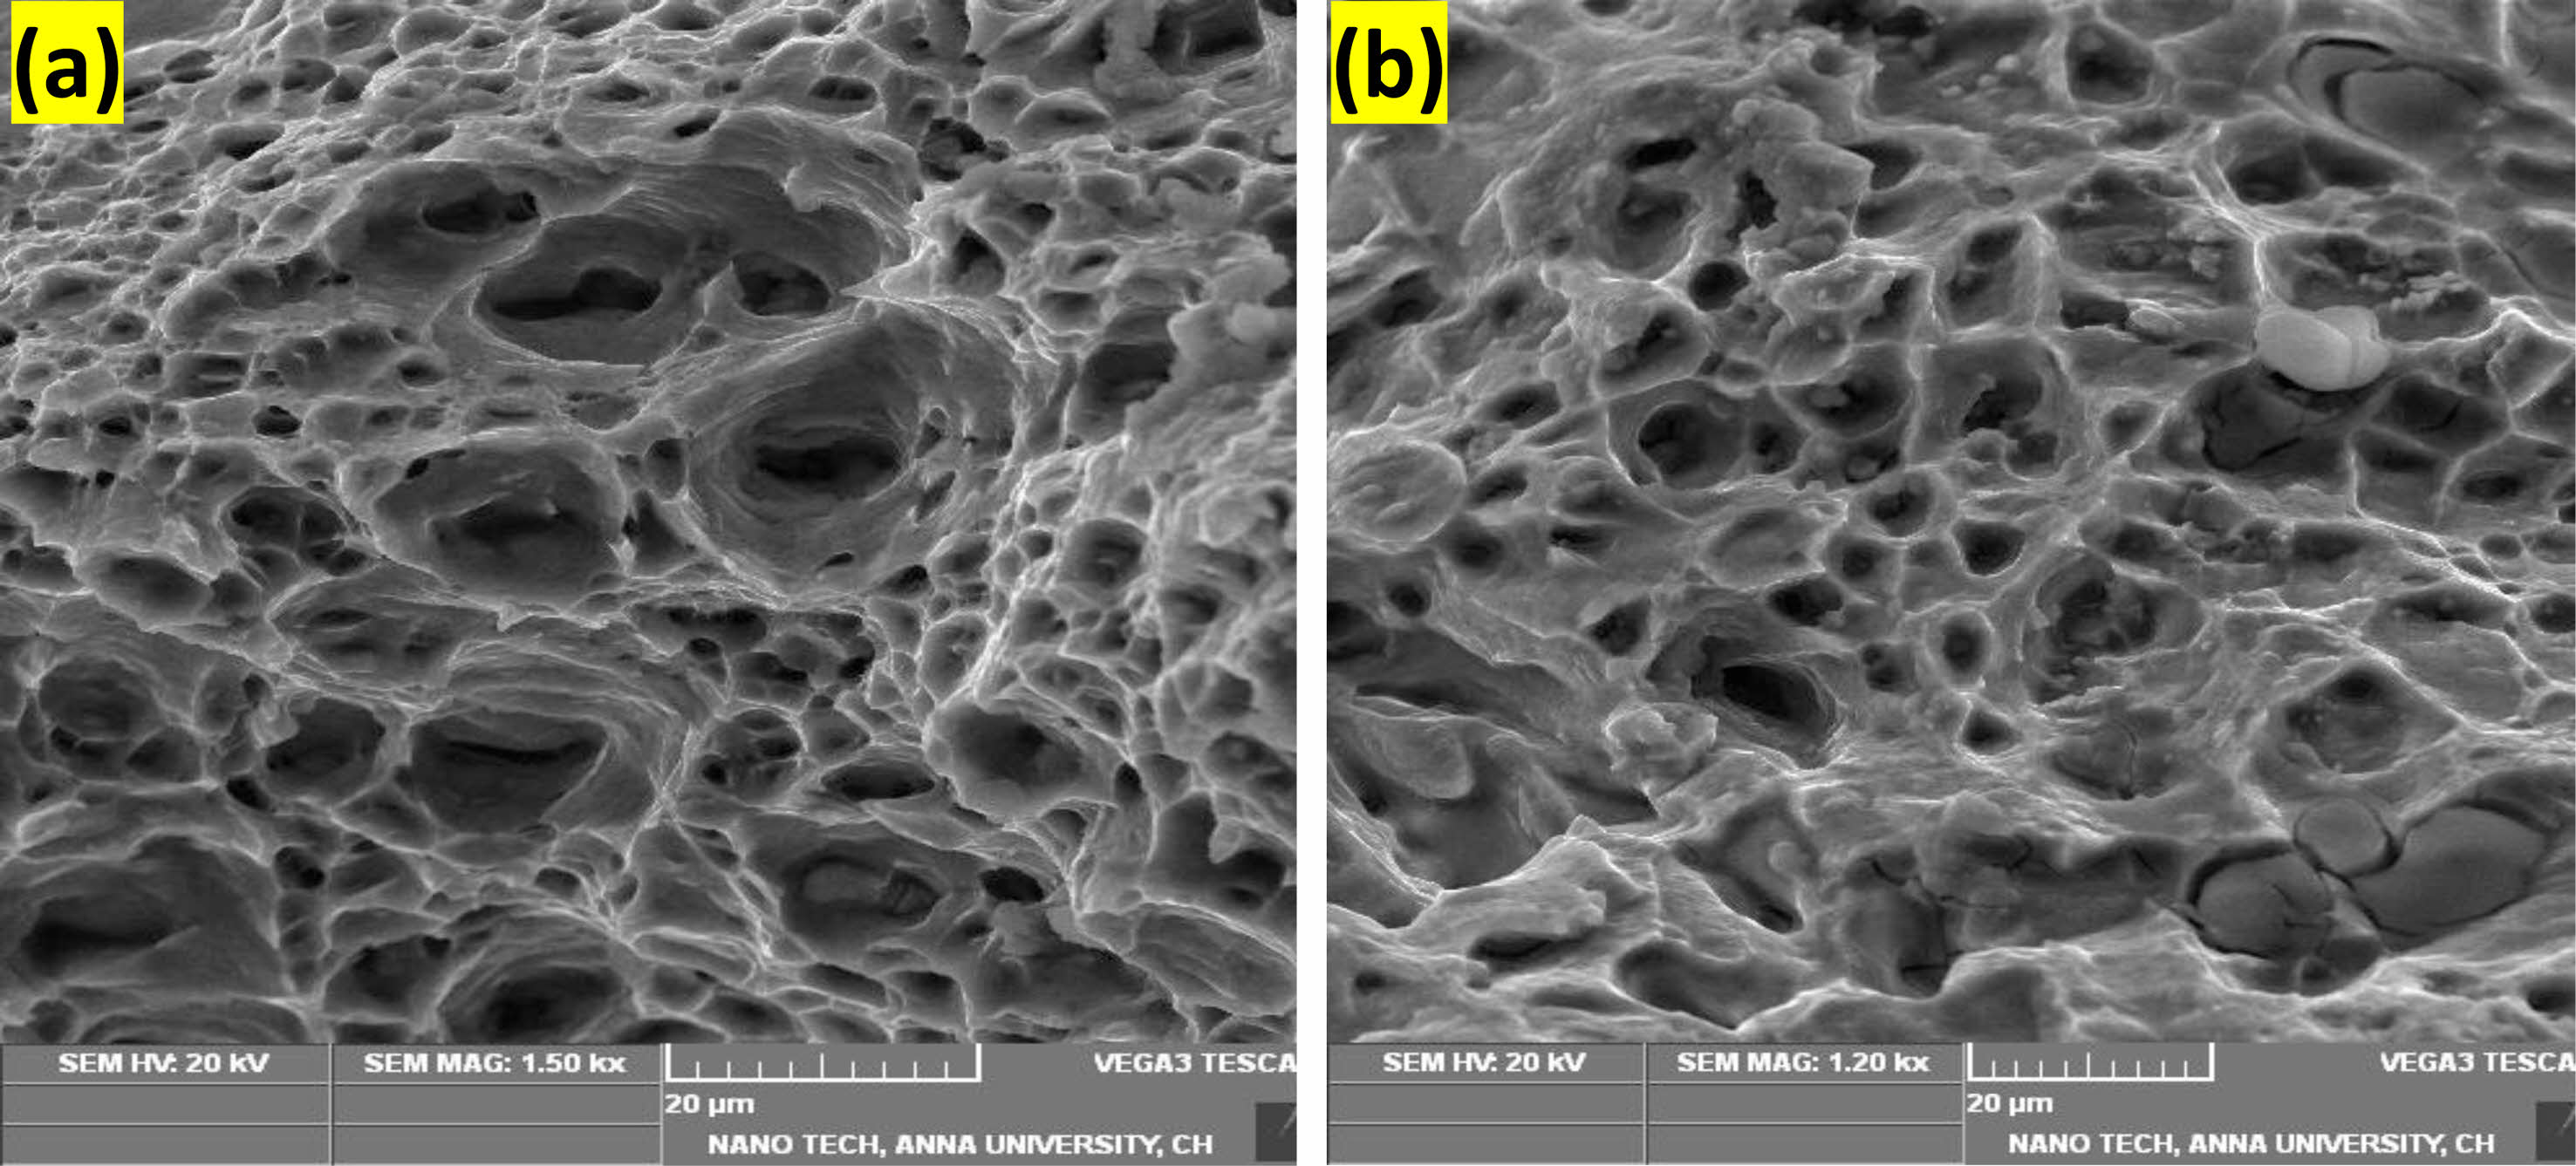
This study evaluated the transverse tensile strength of joints made of AZ31B magnesium alloy with pulsed current tungsten arc welding. Tensile strength, elongation, decreased cross-sectional area, tensile rupture, strength ratio, and joint performance are some of the analysis techniques. Table 2 displays the three samples that were utilised in each case along with the average outcomes. The ultimate tensile strength of an unnotched specimen is compared to the tensile strength of a notched specimen under maximum load using the notched strength ratio (NSR). The NSR of the base metal is 0.89 before to welding, however PCGTAW (Pulsed Current Gas Tungsten Arc Welding) causes a drop in the NSR of the weld metal. Notably, the NSR did not improve in the joints with 160 A peak current, 75 A base current, 6 Hz pulse frequency, and 50 pulses. The junction efficiency, calculated as the difference between the base metal's welded tensile strength and the joint's tensile strength, was also looked at. The joint reached a maximum efficiency of 87.4% while welding at certain settings, including 160 A peak current, 75 A base current, 6 Hz pulse frequency, and 50% pulse length. The Fractographical SEM examination of welded samples with and without notches is shown in Fig. 5, illustrating the higher mechanical properties achieved.
Microhardness Analysis
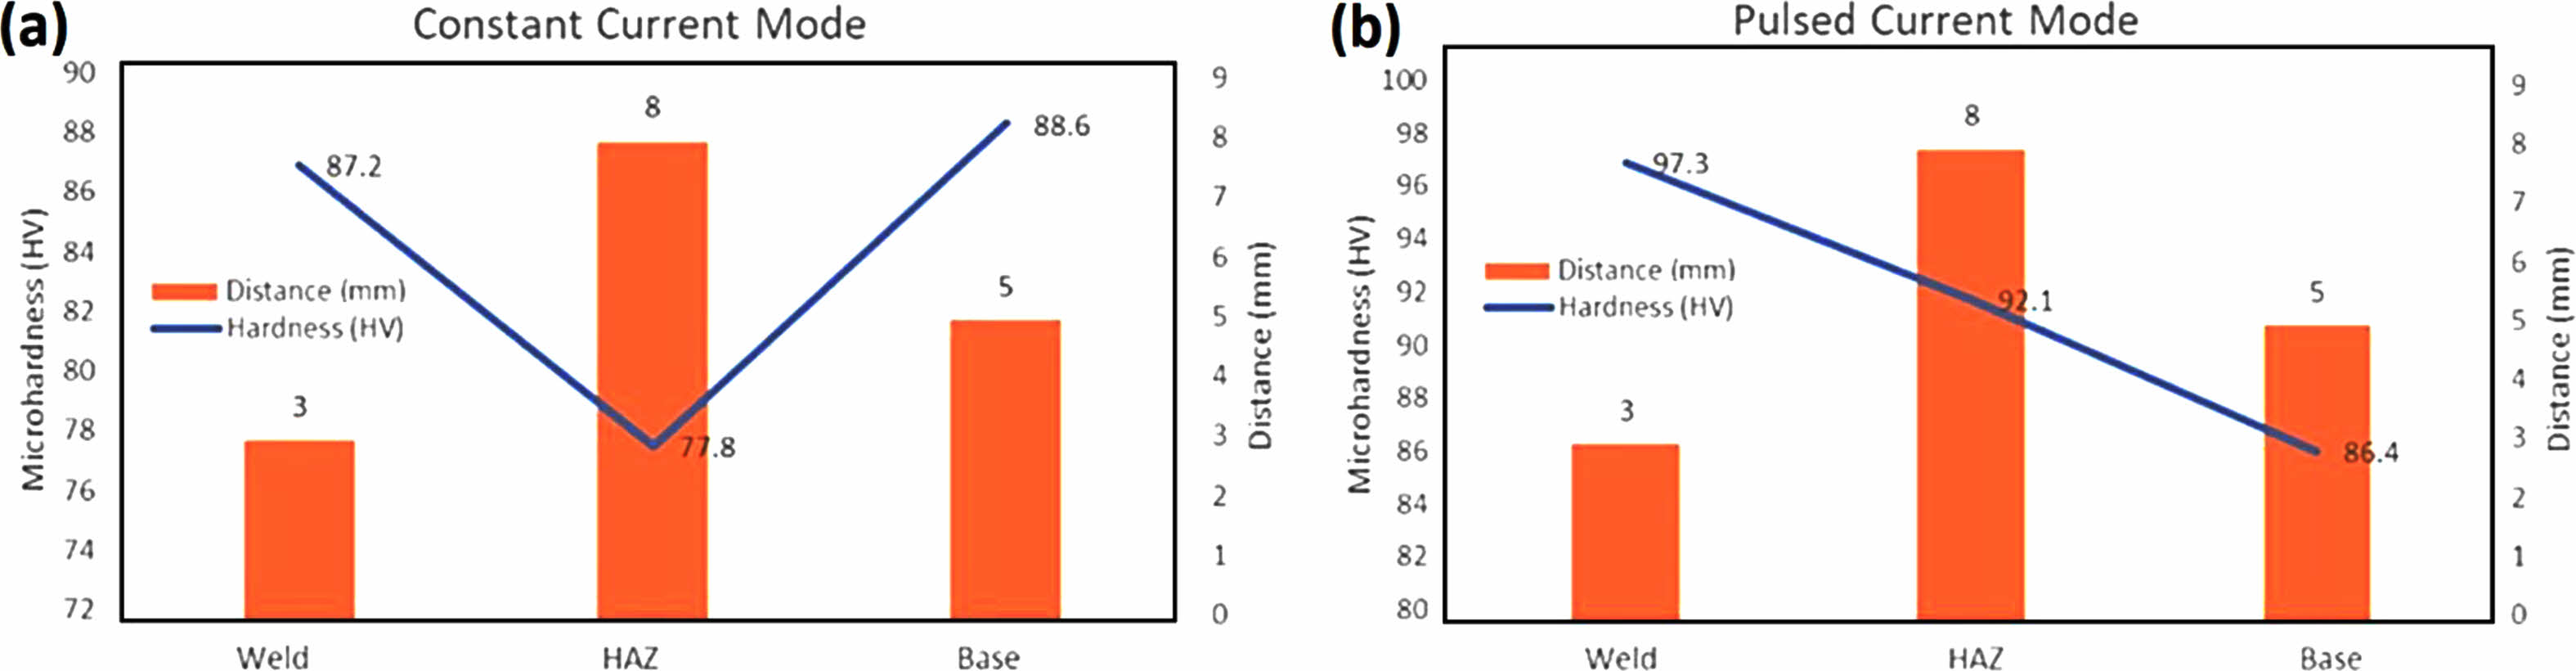
The Vickers micro hardness test results over the joint's average thickness are shown in Fig. 6. The base material's (base metal's) measured hardness value is 86 HV. The co-fusion zone design, however, showed an improved hardness value of 88.6 HV while employing 160 A peak current, 75 A base current, 6 Hz pulse frequency, and 50% pulse length. The joint's extraordinary tensile strength as compared to other joints is a result of the increased stiffness inside the fusion zone. Additionally, as shown in Fig. 4, all tensile test specimens showed failure at the joint between the weld metal and the heat-affected zone (fusion zone). Within the fusion zone, the crucial breaking point is located in the area with the lowest stiffness distribution [32].
|
Fig. 3 SEM analysis (a) weld interface CC mode (b) weld interface PC mode (c) HAZ CC mode (d) HAZ PC mode (e) top surface CC mode (f) top surface PC mode. |
|
Fig. 4 Tensile strength (a) Smooth Specimen (b) Notched Specimen |
|
Fig. 5 Fractographical analysis of tensile fractured welded samples (a) Normal welded sample (b) Notched Samples |
|
Fig. 6 Vickers Microhardness analysis (a) CC mode of welded joint and (b) CC mode of welded joint. |
The investigation led to the following conclusions
• In the fusion region, the fusion zone created by 160 A peak current, 75 A base current, 6 Hz pulse frequency, and 50% pulse period stands out for having good granular qualities. There are also a lot of precipitated particles that are somewhat concentrated in the fusion zone. When the peak current, base current, and pulse duration are all under 160 A, partial weld penetration is observed in welded joints at the coldest temperatures. This inadequate penetration may contribute to the joints' lower tensile strength.
• During tensile tests, the smooth and notched specimens exhibited their peak ultimate strengths (232 MPa & 234.72 MPa) when the TIG welding was conducted at PC mode with current at 160/75 A, voltage at 13 V at a temperature of 505 oC, welding speed at 3.5 mm/min.
• The Vickers hardness tests showed a contrasting trend, wherein the CC mode welded specimens exhibited higher hardness levels, while the PC mode specimens were relatively lower, indicating the agreement between the tensile strengths and elongation results. Their lower hardness led to increased elongation and subsequently higher ultimate strengths.
The authors declare no conflicts of interest and report that no funding was involved in this research. This manuscript has not been submitted elsewhere for publication.
- 1. P. Gopi Krishnan, B. Suresh Babu, S. Madhu, S.J. Gowrishankar, C. Bibin, S. Saran, S. Shree Ram, A.R. Sri Hari, and S. Vidyasagar, J. Ceram. Process. Res. 22[5] (2021) 483-489.
-

- 2. R. Pandiyarajan, and M.P. Prabakaran, J. Ceram. Process. Res. 21[6] (2020) 690-698.
-
- 3. M. Abbasi, M. Givi, and B. Bagheri, Proc. Inst. Mech. Eng., Part B (2020) 1-9.
-
- 4. P. Muthurasu, and M. Kathiresan, J. Ceram. Process. Res. 22[6] (2021) 697-704.
-
- 5. R. Crushan, and P. Ashoka Varthanan, J. Ceram. Process. Res. 22[6] (2021) 620-628.
-
- 6. G. Casalino, M. Mortello, P. Leo, K.Y. Benyounis, and A.G. Olabi, Mater. Des. 61 (2014) 191-198.
-
- 7. G. Tamil Kumaran, K.S. Jayakumar, and R. Vimal Samsingh, Recen. Adv. Mater. Technol. Lect. Notes Mech. Eng. 292 (2022) 215-223.
-
- 8. P. Gopi Krishnan, B. Suresh Babu, and K. Siva, J. Ceram. Process. Res. 21[2] (2020) 157-163.
-
- 9. R. Srinivasan, B. Suresh Babu, P. Prathap, Ruben Whenish, R. Soundararajan, and G. Chandramohan, J. Ceram. Process. Res. 22[1] (2021) 16-24.
-
- 10. J. Umar Mohamed, P.L.K. Palaniappan, P. Maran, and R. Pandiyarajan, J. Ceram. Process. Res. 22[3] (2021) 306-316.
-
- 11. R. Pandiyarajan, and M.P. Prabakaran, J. Ceram. Process. Res. 21[6] (2020) 690-698.
-
- 12. Y.S. Tarng, H.L. Tsai, and S.S. Yeh, Int. J. Mach. Tools Manuf. 39[9] (1999) 1427-1438.
-
- 13. M. Dewan, J. Liang, M. Wahab, and A. Okeil, World J. Eng. 10[1] (2013) 11-22.
-
- 14. M.V. Rao, P.S. Rao, and B.S. Babu, Mater. Focus. 6[3] (2017) 325-330.
-
- 15. M.V. Rao, P.S. Rao, and B.S. Babu, World J. Eng. 17[6] (2020) 831-836.
-
- 16. S. Senthur Vaishnavan, and K. Jayakumar, Mater. Manuf. Proc. 37[2] (2022) 143-150.
-
- 17. V. Manikandan, K. Mariselvam, R. Nekin Joshua, C. Ramesh, and K. Arunprasath, Mater. Tod.: Proc. 66[3] (2022) 683-689.
-
- 18. T. Huang, J. Xu, L. Yu, Y. Cheng, Y. Hu, and H. Zhang, Mater. Tod.: Proc. 29 (2021) 102835.
-
- 19. Y. Cheng, W.-X. Yuan, J.-H. Xu, L.-H. Yu, Y.-X. Hu, T. Huang, and H. Zhang, J. Mater. Sci. 58 (2023) 802-817.
-
- 20. Y. Hadji, A. Haddad, M. Yahi, M.E.A. Benamar, D. Miroud, T. Saharaoui, M. Hadji, and M.W. Barsoum, Ceram. Int. 42[1] (2016) 1026-1035.
-
- 21. T. Senthil Kumar, V. Balasubramanian, and M.Y. Sanavullah, Mater. Des. 28[7] (2007) 2080-2092.
-
- 22. D. Min, J. Shen, S. Lai, and J. Chen, Mater. Char. 60[12] (2009) 1583-1590.
-
- 23. G. Singh, A.S. Kang, K. Singh, and J. Singh, Mater. Tod.: Proc. 4[2] (2017) 3590-3600.
-
- 24. M. Sivashanmugam, C.S. Jothi, T. Kumar, and M. Sathishkumar, Front. Mech. Eng. 2010 (2010) 241-246.
- 25. H. He, C. Wu, S. Lin, and C. Yang, J. Mater. Eng. Perf. 28 (2019) 1180-1189.
-
- 26. A.K. Singh, V. Dey, and R.N. Rai, Mater. Tod.: Proc. 4[2] (2017) 1252-1259.
-
- 27. A. Kumar, and S. Sundarrajan, Mater. Des. 30[4] (2009) 1288-1297.
-
- 28. A. Ramarajan, and K. Jayakumar, Mater. Res. Express. 10 (2023) 026504.
-
- 29. Y. Guo, H. Pan, L. Ren, and G. Quan, Int. J. Adv. Manuf. Technol. 98 (2018) 1433-1440.
-
- 30. N.S. Patel, and R.B. Patel, Int. J. Comp. Eng. Res. 4[1] (2014) 27-31.
- 31. N. Jeyaprakash, A. Haile, and M. Arunprasath, Int. J. Eng. Sci. 4[2] (2015) 11-20.
- 32. Kumar, and S. Sundarrajan, Int. J. Adv. Manuf. Technol. 42 (2009) 118-125.
-
 This Article
-
2023; 24(5): 860-867
Published on Oct 31, 2023
- 10.36410/jcpr.2023.24.5.860
- Received on Jul 25, 2023
- Revised on Sep 23, 2023
- Accepted on Oct 1, 2023
Services
- Abstract
introduction
materials and methods
results and discussion
conclusions
- Declaration
- References
- Full Text PDF
Shared
Correspondence to
- G. Tamil Kumaran
-
Department of Mechanical Engineering, DMI College of Engineering, Chennai, India – 600123
Tel : +91 988 467 0312 - E-mail: tharikatamil@gmail.com
Clean-Energy Research Institute(CRI), Hanyang University, 222, Wangsimni-ro, Seongdong-gu, Seoul, 04763, Korea
E-mail: jcpr@hanyang.ac.kr