


- Characteristics of an organic-inorganic hybrid filter consisting of LaMn0.5Fe0.5O3 nanofibers dispersed in PAN
Hee-Seon Kima, Han-Jung Kimb, Yoonkap Kimb and Jong-Won Yoona,*
aDepartment of Materials Science and Engineering, Dankook University, Cheonan-si 31116, Republic of Korea
bNano Electronic Materials and Components Research Center, Gumi Electronics and Information Technology Research Institute (GERI), Gumi-si 39171, Republic of KoreaThis article is an open access article distributed under the terms of the Creative Commons Attribution Non-Commercial License (http://creativecommons.org/licenses/by-nc/4.0) which permits unrestricted non-commercial use, distribution, and reproduction in any medium, provided the original work is properly cited.
Organic-inorganic hybrid nanofiber filters having the LaMnO3 and LaMn0.5Fe0.5O3 dispersed in polyacrylonitrile (PAN) were successfully synthesized by two-step electrospinning. In the first step, the LaMnO3 and LaMn0.5Fe0.5O3 nanofibers were synthesized by vertical-type electrospinning and heat treatment in air at 600 °C. The LaMnO3 and LaMn0.5Fe0.5O3 nanofibers have a single-phase orthorhombic crystal structure without forming secondary phases and impurities. TEM images revealed that the nanofibers were composed of nanoparticles with a diameter of about 15 nm in pure LaMnO3 and 18 nm in LaMn0.5Fe0.5O3 nanofibers. As a results of XPS analysis, LaMn0.5Fe0.5O3 nanofibers showed more oxygen defect than LaMnO3 nanofibers. In the second step, the LaMnO3 and LaMn0.5Fe0.5O3 nanofibers were homogeneously pulverized and mixed with a PAN solution to produce a filter using drum-type electrospinning. Filter performance was evaluated by the filter quality factor (QF) obtained by measuring the filtration efficiency and pressure drop of the filter. Compared to the reference (H11 nonwoven fabric), the QF increase rates of PAN, PAN/LaMnO3, and PAN/LaMn0.5Fe0.5O3 nanofiber filters were 4.1%, 12.4%, and 24.9%, respectively
Keywords: LaMn0.5Fe0.5O3 nanofiber, PAN, electrospinning, particulate matter filter
Organic-inorganic hybrid materials are functional materials with applications in optics, microelectronics, bioenergy, and environmental catalysis by combining organic and inorganic components [1]. They show excellent characteristics when used in solar cells and electrochemical devices such as electrolyte materials for secondary batteries [2-4]. Improvement in the collection of fine dust is also reported because of the synergistic effect of organic and inorganic substances in filters using metal oxide nanoparticles dispersed in organic-inorganic hybrid materials [5].
Various filters are used to remove fine dust (PM2.5), among which is the high-efficiency particulate air (HEPA) filter, a filter made of melt-blown nonwoven fabric [6]. The nonwoven material is polypropylene (PP), widely used as an air filter because of its high filtration efficiency and low-pressure drop attributed to its high porosity and dense pore size. Additionally, PP has been reported to exhibit electrostatic force around the fibers, making HEPA filters effective in the filtration of PM2.5 [7, 8]. However, the charge decays with time, causing the PM filtration performance, under certain conditions, to be remarkably reduced. Another disadvantage of HEPA filters is their relatively high air resistance [9, 10].
In order to compensate for this disadvantage, research on filters using organic nanofibers has been conducted. The materials used are mainly polymers such as polyacrylonitrile (PAN) [11], polyamide (PA) [12], nylon [13], polyurethane (PU) [14], and PVDF (polyvinylidene fluoride) [15], among which PAN has superior hydrophobicity and relative thermal stability. Polymer nanofibers are known to have high-efficiency fine dust-trapping because they have dipoles on their surfaces [16]. There are a few reports that the efficiency of collecting fine dust increases because of the release of negative ions in a filter prepared from metal oxide nanoparticles, including Al2O3, SiO2, MgO, Fe2O3, Na2O, TiO2, and FeO dispersed in organic nanofibers [17-19]. Additionally, there have been reports on improving PM filtration performance through a hierarchical structure by adding magnetic Fe3O4 nanoparticles to organic nanofibers or coating organic nanofibers with MnO2 [20, 21].
There is a report on improving electrical conduction by doping the A-site element of LaFeO3 with Sr [22]. Also, in our previous works [23-25], primary research was reported on improving the magnetic and electrical properties of nanofibers by doping Mn or Ga in the B- site of LaFeO3 nanofibers. Also, there has been a report on enhancing magnetic properties in Mn-doped BiFeO3 nanofibers [26]. In those papers, it was reported that as the substitution amount of the A-site or B-site increased, many oxygen vacancies occurred, which affected the magnetic/electrical properties. The LaMnO3 has been developed as a sensor material with high gas sensitivity by surface adsorption to gases such as CO or NO [27, 28]. It has been reported that oxygen defects play a vital role in improving sensor performance in metal oxide gas sensors [29, 30]. Also, it has been reported that PM is formed by combining with small solid particles in the air, including organic carbon, elemental carbon, other organic matter, nitrates, sulfates, and inorganic matter [31]. Therefore, it is interesting to clarify the relationship between the adsorption of fine dust in PAN/LaMnO3 and LaMn0.5Fe0.5O3 nanofibers.
In this study, LaMn0.5Fe0.5O3 nanofibers were fabricated by substituting up to 50% of the B site of LaMnO3 nanofibers to investigate the effect of oxygen defects on filter performance. This paper aims to improve filter performance by fabricating organic-inorganic hybrid filters by dispersing LaMnO3 and LaMn0.5Fe0.5O3 nanofibers in PAN.
Synthesis of the LaMnO3 and LaMn0.5Fe0.5O3 nanofibers
LaMnO3 nanofibers were prepared using electrospinning. A sol-gel solution by dissolving polyvinylpyrrolidone (PVP, Mw = 1,300,000, Sigma Aldrich), lanthanum nitrate hexahydrate (99.999%, Sigma Aldrich), manganese nitrate tetrahydrate (≥97%, Sigma Aldrich), and N,N-dimethylformamide (99.8%, Sigma Aldrich) at room temperature while stirring for 2 h. To prepare LaMn0.5Fe0.5O3 nanofibers, 50 mol% of iron nitrate nonahydrate (98%, Sigma Aldrich) was first added to a LaMnO3 sol-gel solution and stirred at room temperature for 2 h.
A vertical-type electrospinning unit purchased from Nano NC Co., Ltd (Korea) was used to prepare LaMnO3 and LaMn0.5Fe0.5O3 nanofibers. The LaMnO3 and LaMn0.5Fe0.5O3 precursor solution was loaded into a 10 mL syringe with a 0.15 mm stainless-steel needle diameter. The distance between the needle tip and the collector plate was 16 cm. The collector plate was covered with aluminum foil. Electrospinning was conducted by applying a high voltage of 18.5 kV to the solution through the needle tip and fixing the flow rate to 15 μL min−1. As-spun LaMnO3 and LaMn0.5Fe0.5O3 nanofibers were calcined at 600 °C in the air for 2 h with a heating rate of 5 °C min−1. The heat-treated LaMnO3 and LaMn0.5Fe0.5O3 nanofibers were pulverized through a ball milling process for a uniform length.
Materials characterization
The crystal structure of the metal oxide nanofibers was characterized via X-ray diffraction measurements using an X-ray diffractometer (Ultima IV, Rigaku, Japan) with Cu Kα radiation (λ = 0.154 nm) operated at 40 kV and 30 mA. The 2θ measurement range was at 10° to 80°. To confirm the shape of the nanofibers and the fabricated filters, a field emission scanning electron microscope (SIGMA-500, Carl Zeiss, Germany) was used with an applied voltage of 20 kV. To analyze the presence and content of metal oxide nanofibers dispersed in the organic-inorganic hybrid nanofibers, energy-dispersive X-ray spectroscopy (EDS) analysis was conducted using NORAN System 7 (Thermo Fisher Scientific, USA). The morphologies of the samples were further observed by transmission electron microscopy (TEM) and high-resolution transmission electron microscopy (HRTEM) investigation by Carl Zeiss Co. (Germany) FE-TEM, Libra 200FE transmission electron microscope (TEM). X-ray photoelectron spectroscopy (XPS) was conducted using AXIS Nova (Kratos, UK) with a monochromatic Al Kα source at 1,486.6 eV, a voltage of 15 kV, and an emission current of 10 mA. The binding energy for the samples was calibrated by setting the measured binding energy of C 1s to 284.8 eV.
Fabrication of PAN/LaMnO3 and PAN/LaMn0.5Fe0.5O3 nanofibers filter
PAN solution was prepared using polyacrylonitrile (PAN, MW = 150,000) and N,N-dimethylformamide (99.8%, Sigma Aldrich) by stirring at 60 °C for 24 h. Then the pulverized LaMnO3 and LaMn0.5Fe0.5O3 nanofibers of 0.2 g were added into the PAN solution with stirring at room temperature for 2 h. In this case, an ESR100D drum-type equipment (Nano NC Co., Ltd., Korea) was used for electrospinning. The distance between the needle tip and the collector was 20 cm. A high voltage of 15 kV was applied through the needle tip, the flow rate was fixed at 1 mL/h, and the rotation speed of the collector was at 500 rpm. A commercial polypropylene (PP) material (H11 nonwoven fabric) was used to cover the collector and act as a substrate for the filter.
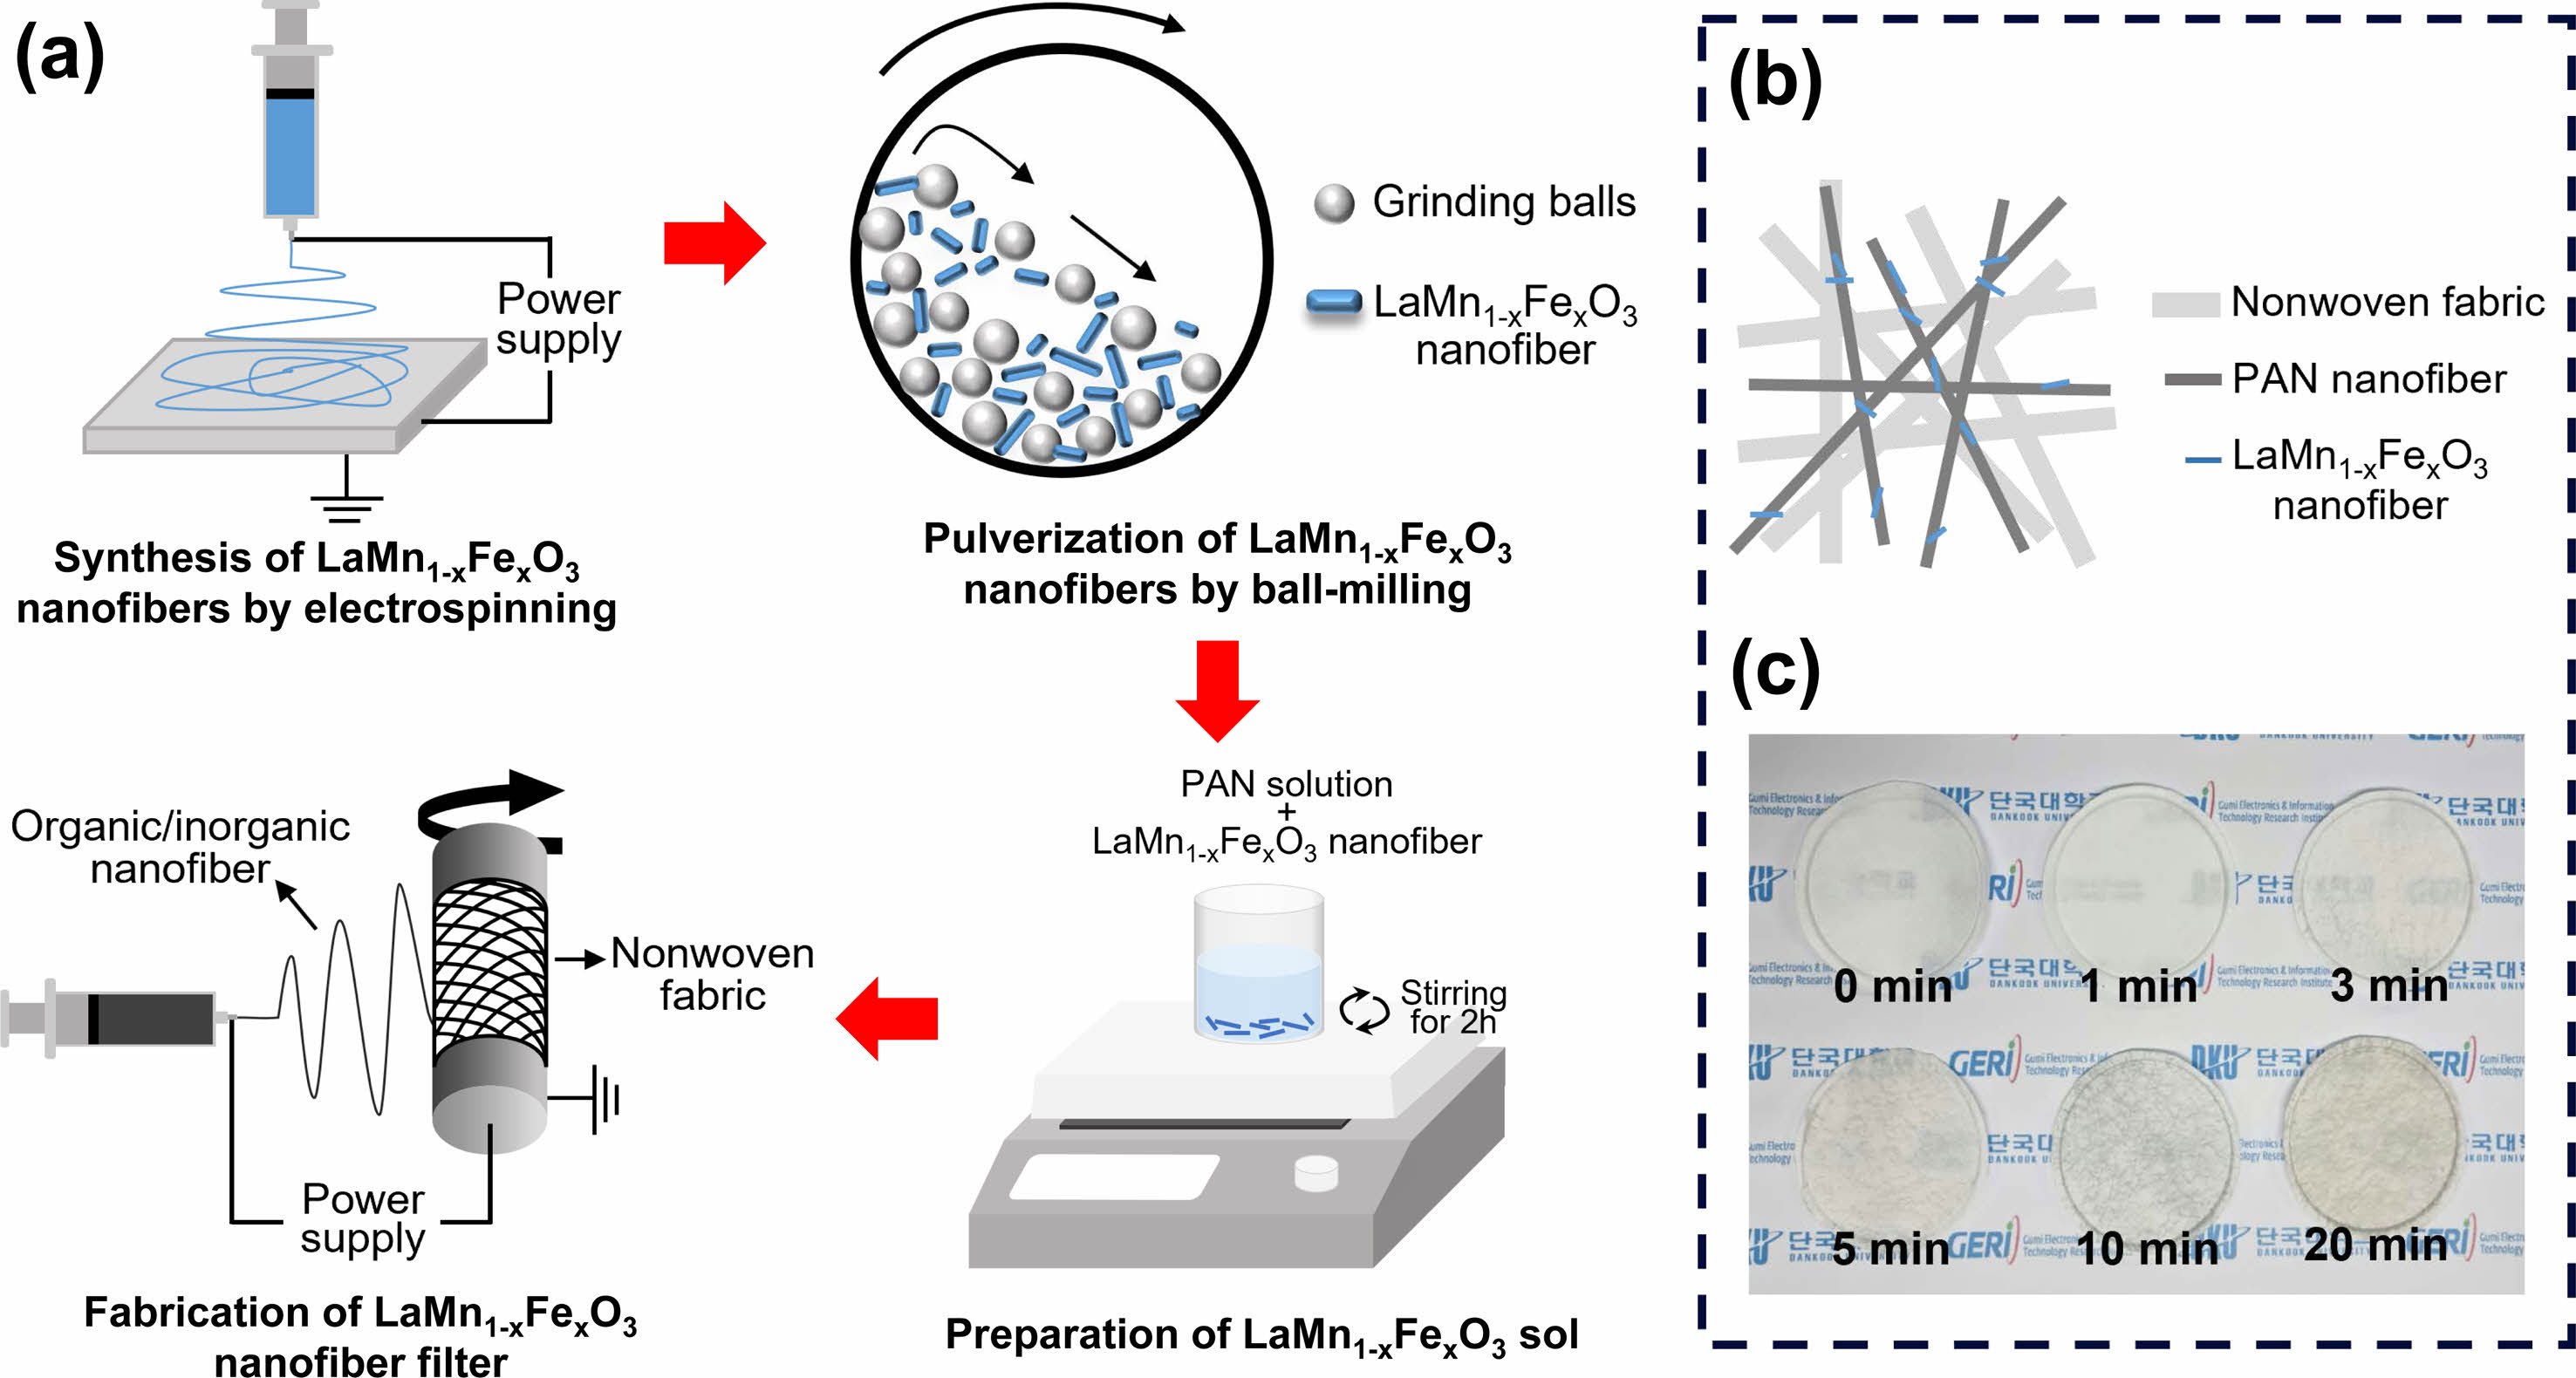
Figure 1(a) shows a schematic diagram of the filter fabrication process using the PAN/LaMnO3 and PAN/LaMn0.5Fe0.5O3 nanofibers. Also, Fig. 2(b) is a drawn picture of PAN/LaMnO3 and PAN/LaMn0.5Fe0.5O3 nanofibers filter dispersed on an H11 nonwoven fabric.
For the fabrication of nanofiber filters with optimized density, the accumulation time was adjusted to 0, 1, 3, 5, 10, and 20 min, as shown in Fig. 1(c). As the accumulation time increased, the filter color changed to dark gray.
Particulate matter filtration test
The fine dust filtration performance of the PAN/LaMnO3 and PAN/LaMn0.5Fe0.5O3 nanofibers filter with reference to the device proposed in the reported works of literature was evaluated as shown in Fig. SI 1 [32]. A light-scattering-type PM sensor (PM2007, Wuhan Cubic Optoelectronic Co. Ltd.) was used calibrated using standard test equipment before the test. Incense smoke was used as fine dust, composed of particles with a diameter of 0.3 to 10.0 μm as confirmed by optical measurements (Optical Particle Sizer 3330, TSI) [32]. Pressure at a flow rate of 22 L min−1 was supplied to the filters through a vacuum pump (Rocker300), and the pressure drops across the filters were measured using a differential pressure meter (Testo 510, Testo Inc.). PM filtration efficiency can be calculated by measuring the concentration of incense smoke before and after the filters as summarized in the following formula: efficiency, % = ((C1 − C2)/C1) × 100 [33]. All samples for testing were prepared in a circular shape with a diameter of 60 mm. A simple air purifier using a handmade plastic jig was set up, and a DC fan was used to test the air purification performance (speed) in the chamber. The fabricated air purifier and wireless PM sensor were placed in a polycarbonate chamber with a volume of ~400 L, and a certain amount of smoke was supplied. The air purifier was operating at a constant driving voltage, and the change in the concentration of fine dust in the chamber was monitored in real-time. The initial concentration of fine dust supplied into the chamber was ~250 μg m−3.
|
Fig. 1 (a) Schematic of the manufacturing process of the LaMnO3 and LaMn0.5Fe0.5O3 nanofibers filter, (b) Schematic of the PAN/LaMnO3 and PAN/LaMn0.5Fe0.5O3 nanofibers filter dispersed on an H11 nonwoven fabric, (c) Actually pictures of the PAN/LaMnO3 and PAN/ LaMn0.5Fe0.5O3 nanofibers filter according to accumulation time. |
|
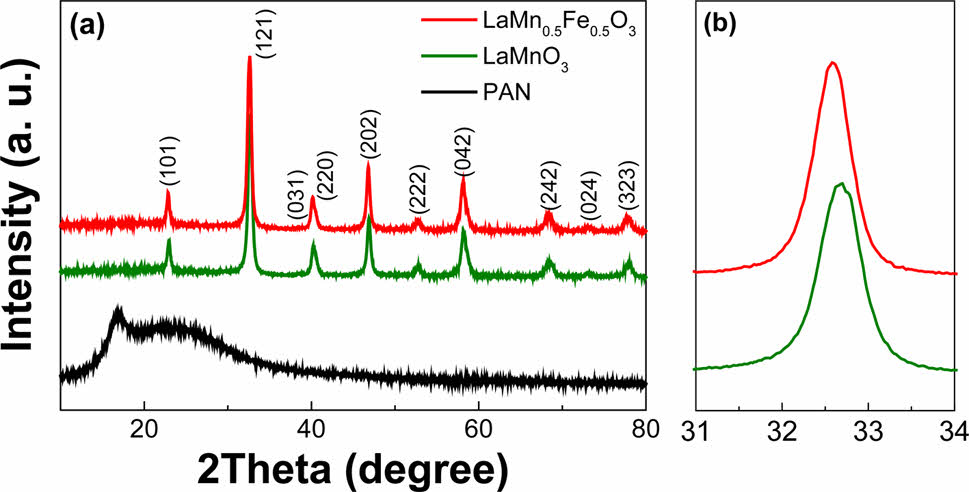
Fig. 2 (a) XRD patterns of the PAN, LaMnO3, and LaMn0.5Fe0.5O3 nanofibers; (b) Enlarged XRD patterns. |
Figure 2a shows the XRD patterns of a PAN and the LaMnO3 and LaMn0.5Fe0.5O3 nanofibers. The LaMnO3 and LaMn0.5Fe0.5O3 nanofibers have a single-phase orthorhombic crystal structure without forming secondary phases and impurities. Since PAN is an organic material, the crystal peak is not expressed, and its peak appears in a typical broad form similar to that of the previously reported XRD peak of PAN. The (121) peaks near 32.6° shift to a lower angle compared to LaMnO3 (as seen in Fig. 2b). The peak shift is due to substituting with Fe3+ (0.645 Å), which has a larger ionic radius than that of Mn3+ (0.58 Å). The average crystallite size of the Fe-substituted LaMnO3 nanofibers was calculated using Scherrer’s formula, and the average crystal size of the LaMnO3 and LaMn0.5Fe0.5O3 nanofibers is 15.25 and 18.43 nm, respectively.
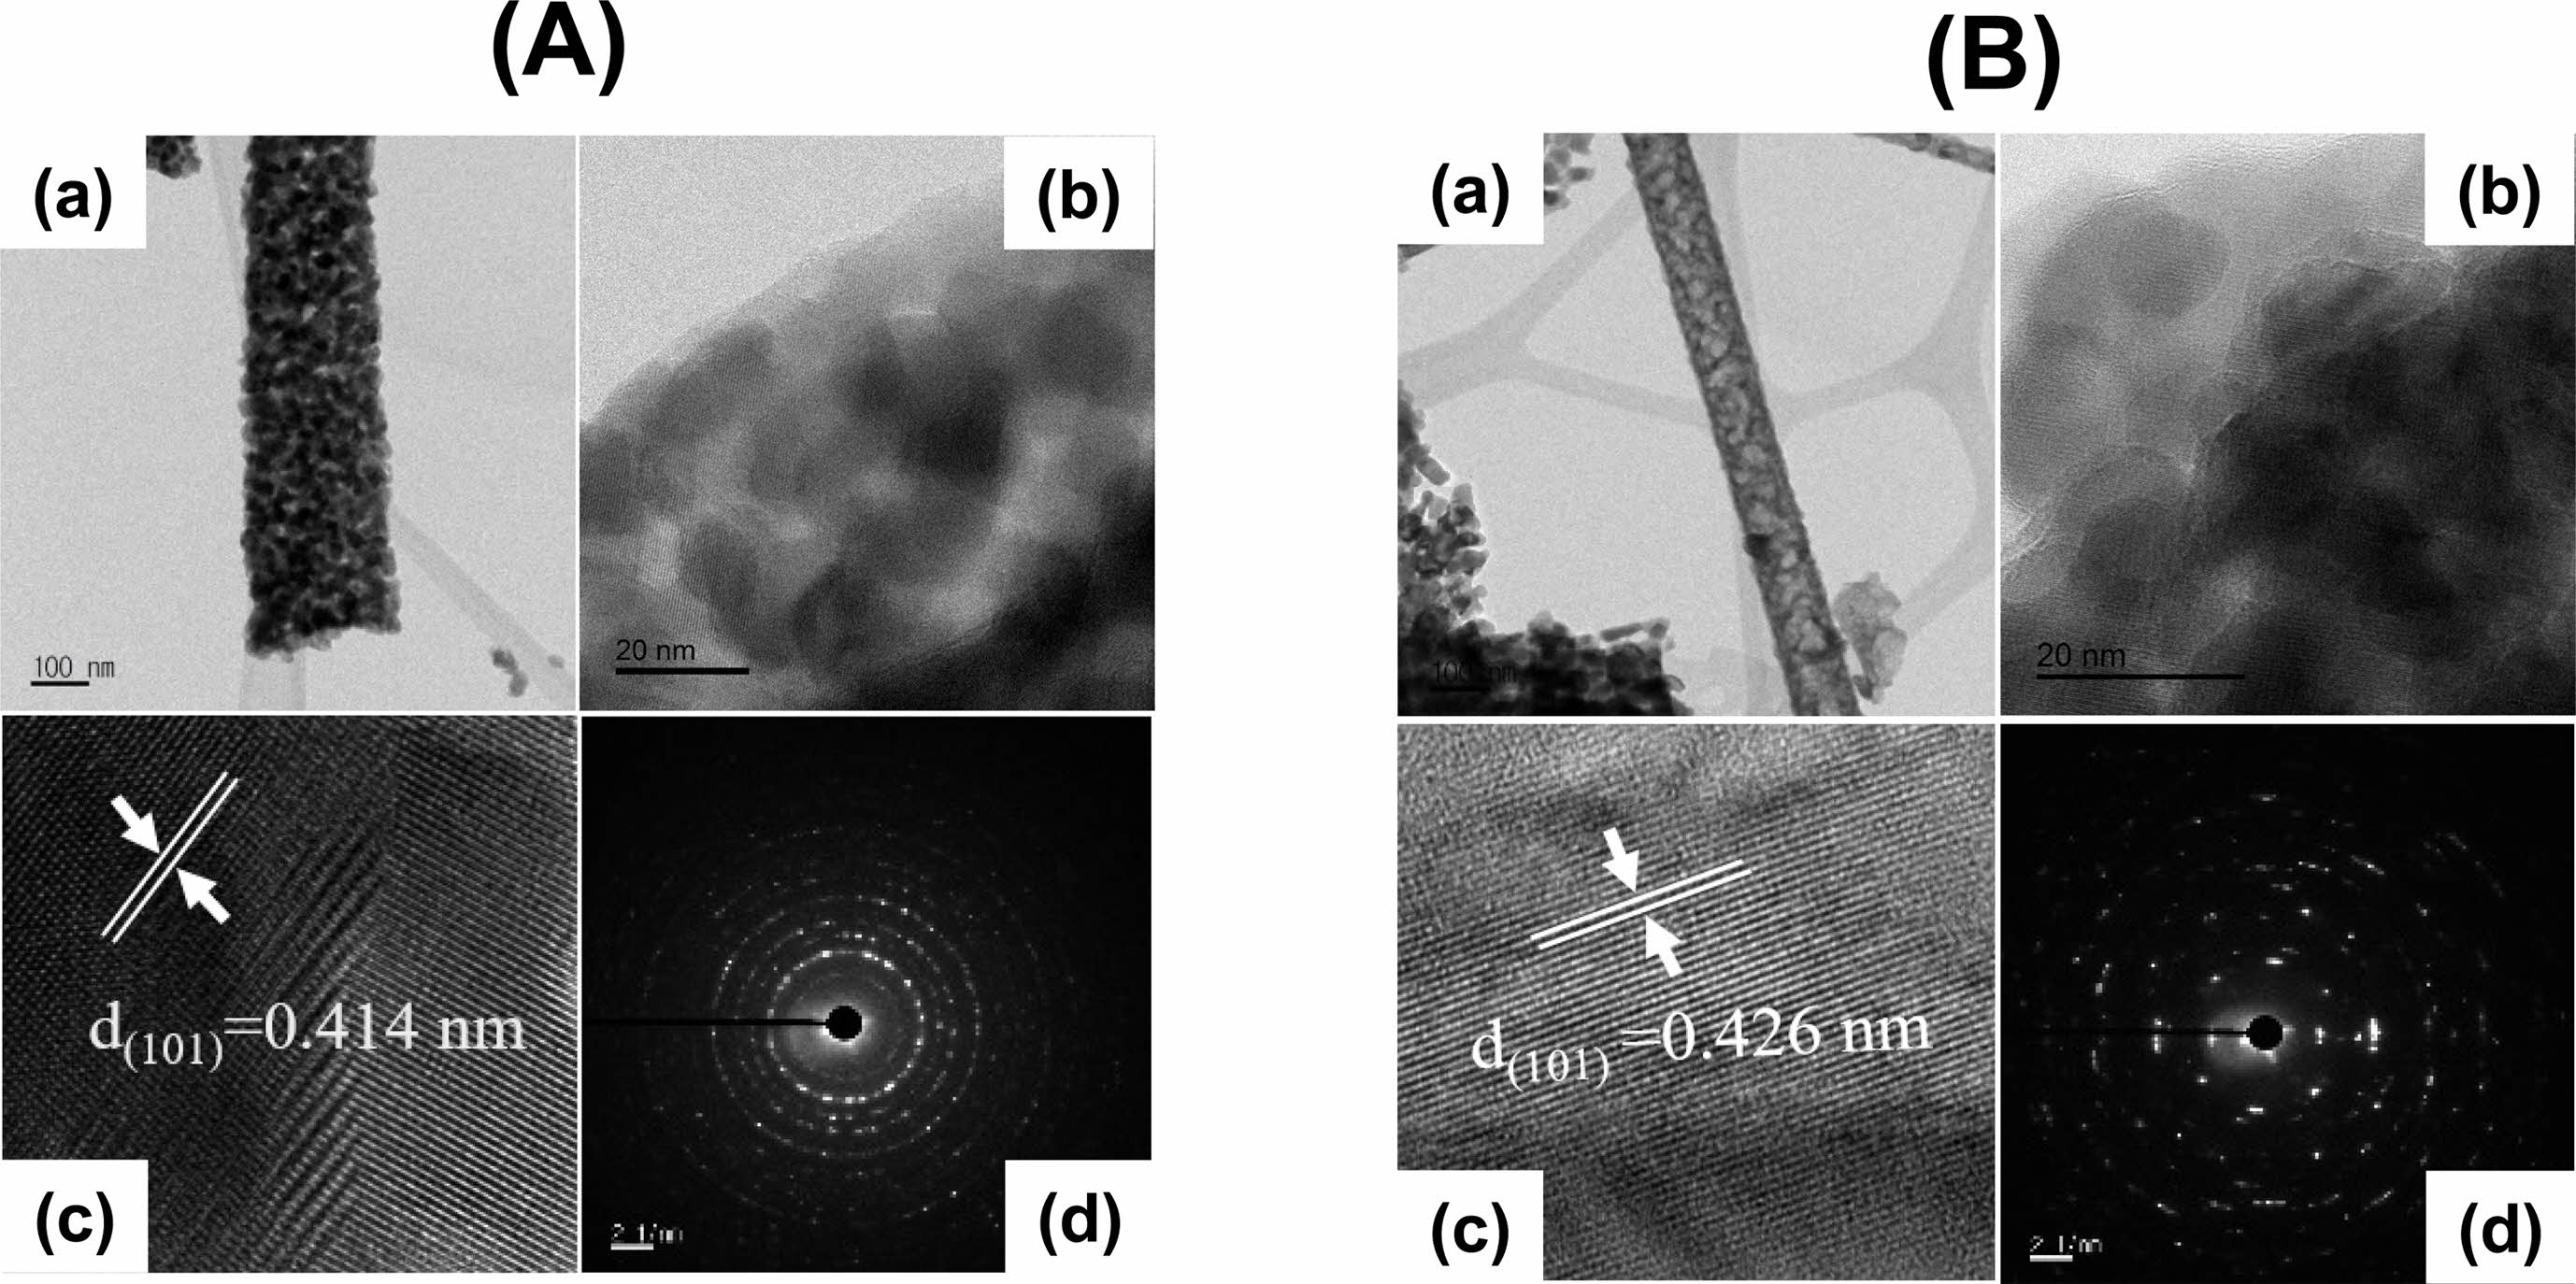
Figure 3(A) and (B) display typical TEM images of the LaMnO3 and LaMn0.5Fe0.5O3 nanofibers. It is evident from a close examination of TEM images of the LaMnO3 (Fig. 3(A)) and LaMn0.5Fe0.5O3 nanofibers (Fig. 3(B)) that a single nanofiber was composed of several nanoparticles. Further, it can be observed in Fig. 3A(b) and 3B(b) that the nanofibers are made up of homogeneously distributed nanoparticles of an average diameter of about 15 nm (Fig. 3A(b)) and 18 nm (Fig. 3B(b)), respectively. It can be noticed that the crystallite sizes calculated via Scherrer’s formula from XRD measurements are in good agreement with nanoparticulate sizes observed by TEM. As shown in Fig. 3A(c) and Fig. 3B(c), the interplanar distance of the (101) plane was 0.414 nm for pure LaMnO3 and 0.426 nm for LaMn0.5Fe0.5, respectively. The increase of interplanar spacings with Fe substituting is due to the difference in ionic radius between Mn3+ (0.58 Å) and Fe3+ ions (0.645 Å).
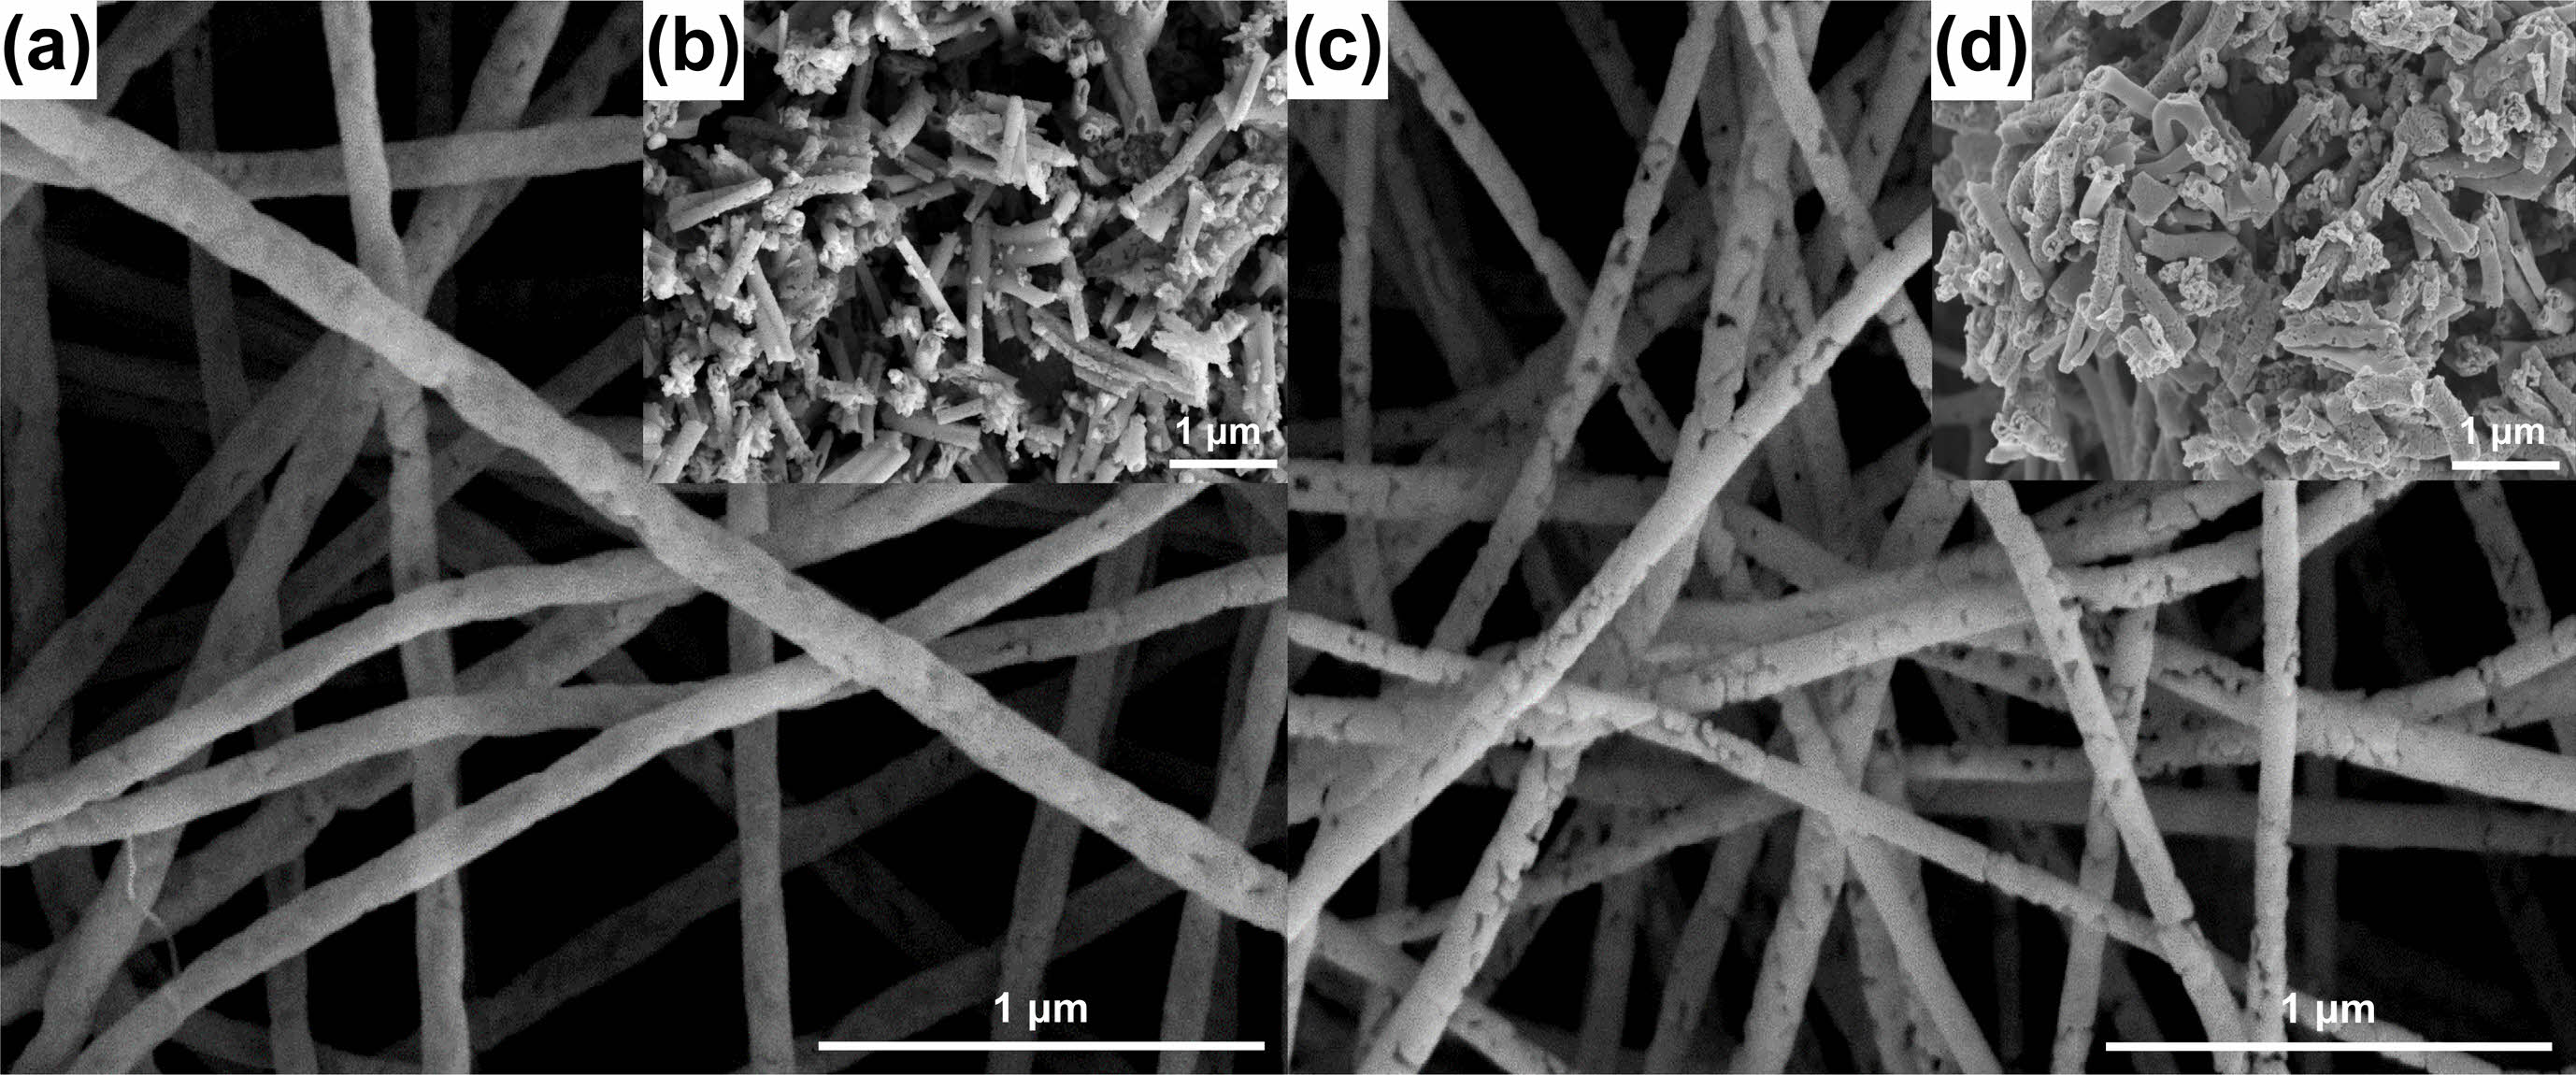
Figure 4(a) and (c) show FESEM images of the LaMnO3 and LaMn0.5Fe0.5O3 nanofibers. It was confirmed that their diameters are in the range of 100-150 nm. Additionally, the FESEM images of the LaMnO3 and LaMn0.5Fe0.5O3 nanofibers measured after the ball milling process are shown in Fig. 4(b) and (d). The length of the LaMnO3 and LaMn0.5Fe0.5O3 nanofibers was 0.5 to 1.5 μm. The ball milling process was conducted to homogeneously disperse the inorganic LaMnO3 and LaMn0.5Fe0.5O3 nanofibers in organic PAN.
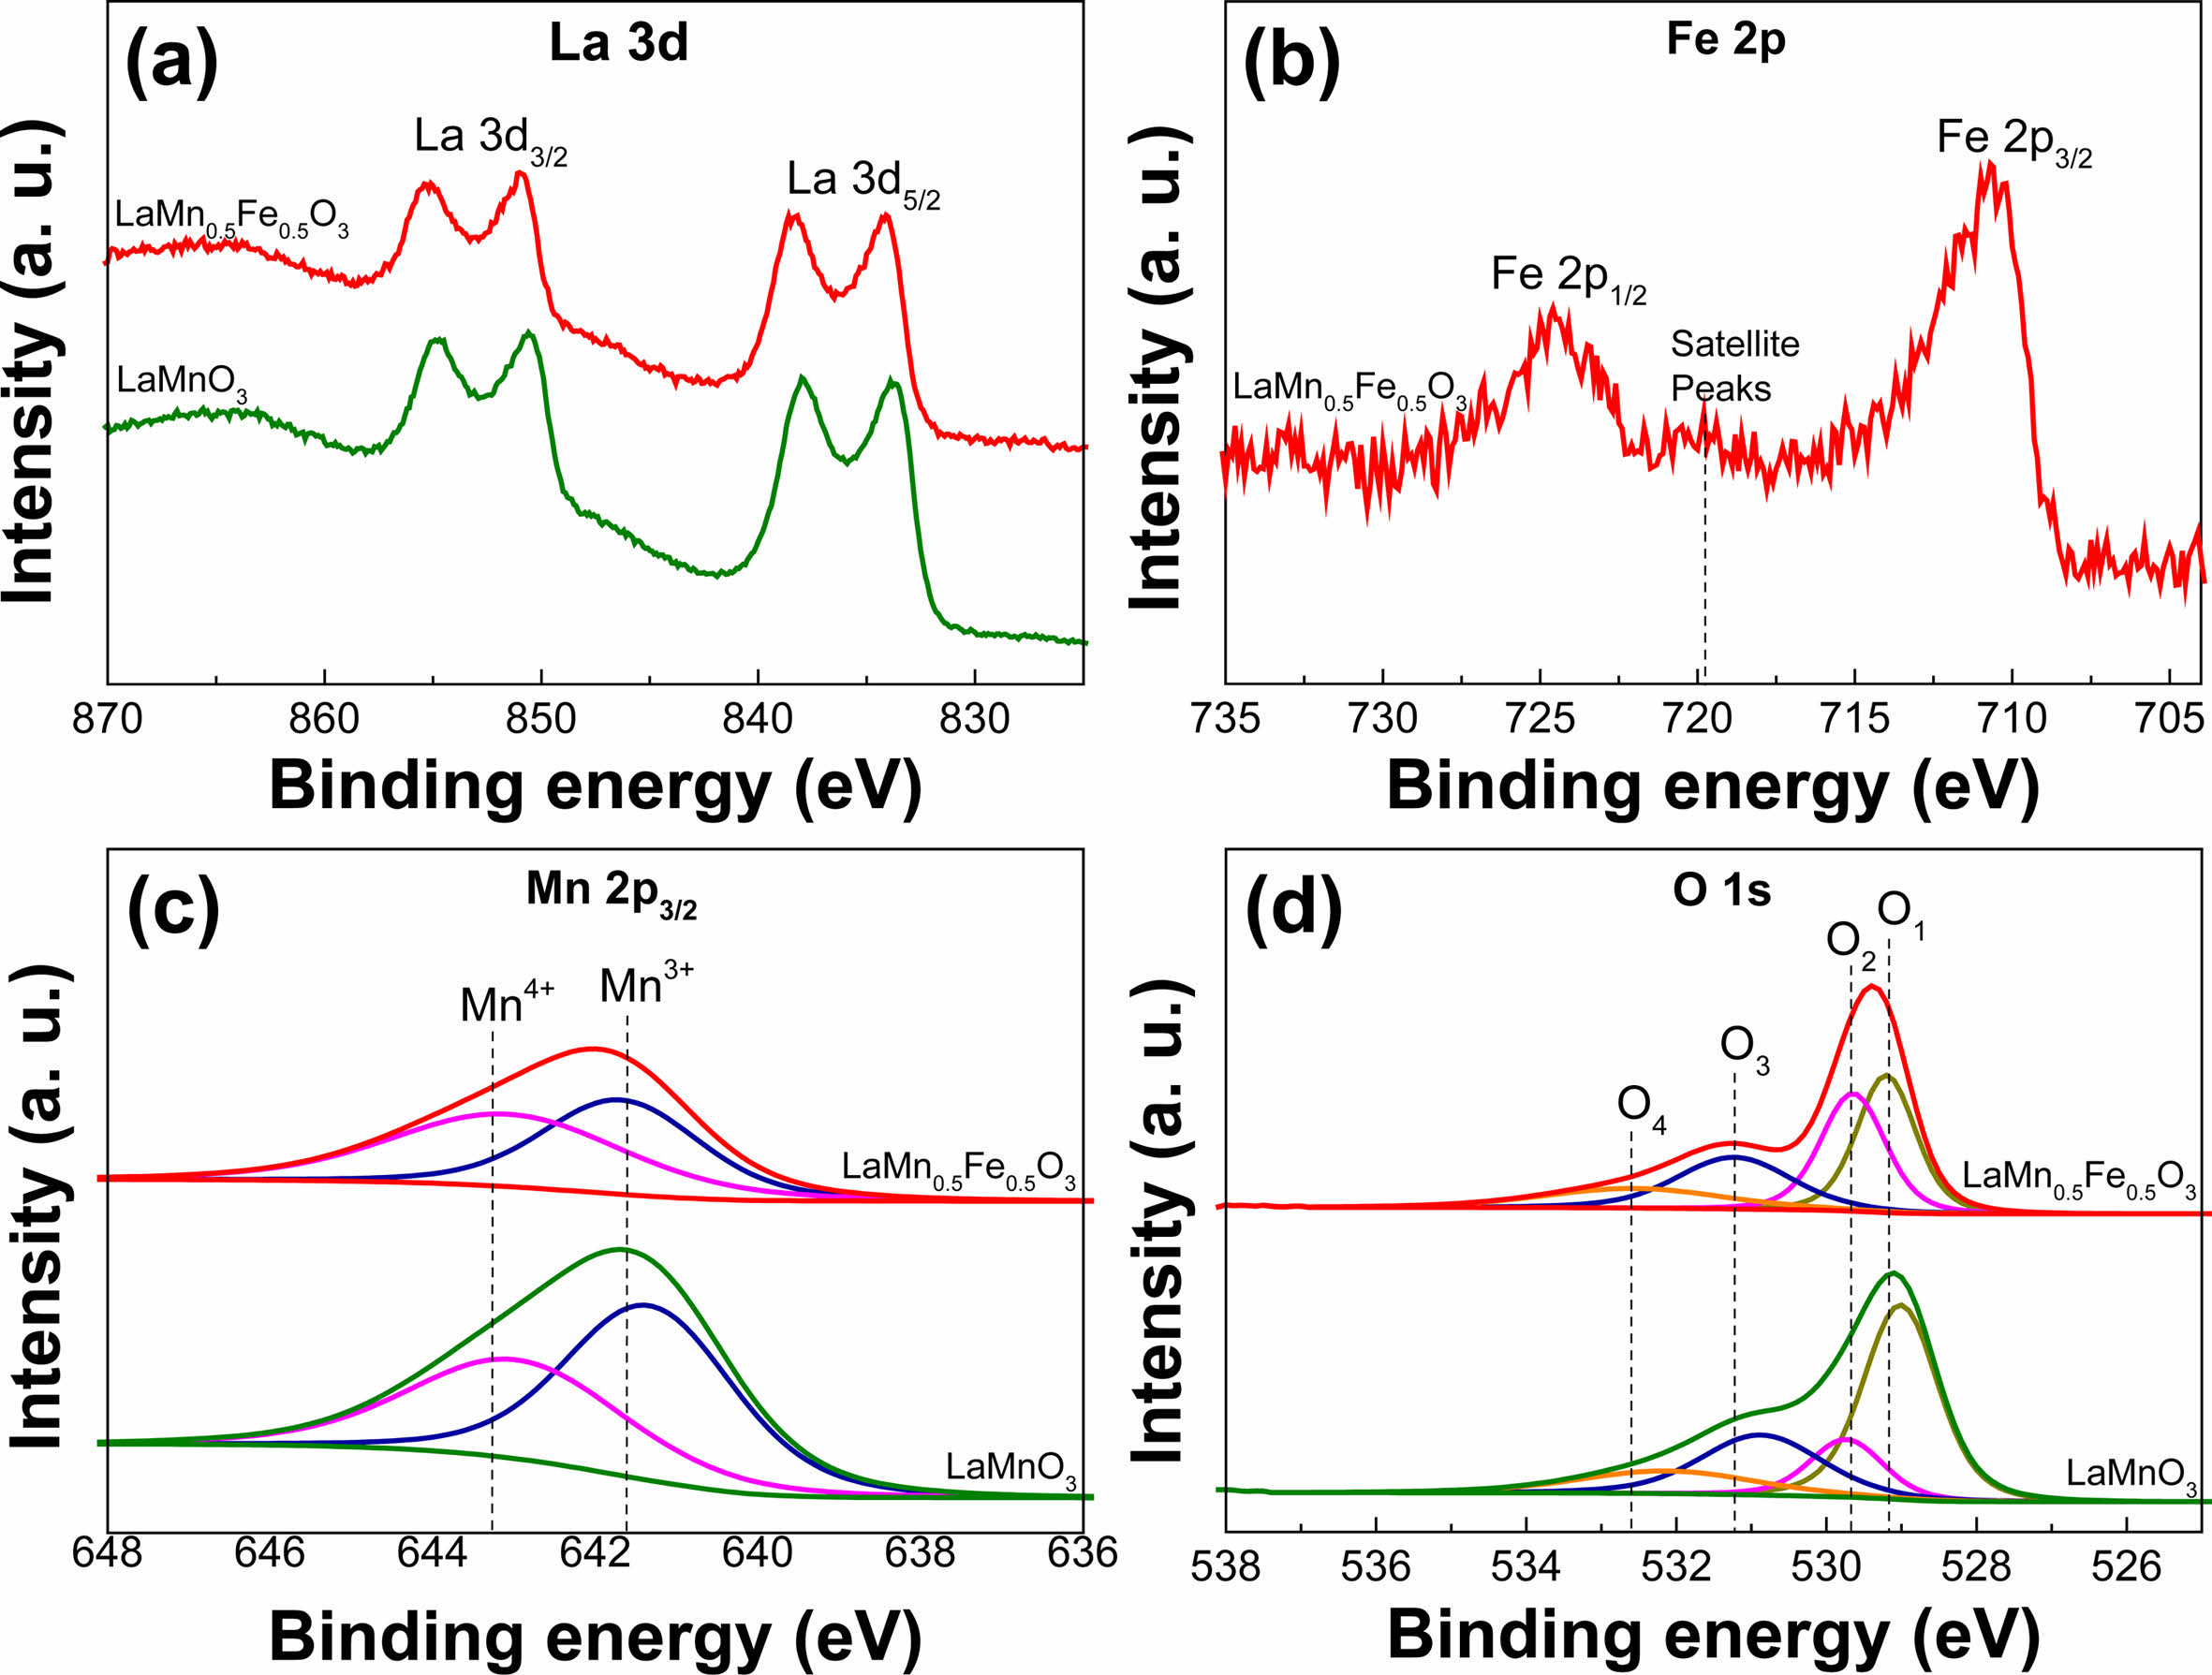
XPS analysis was conducted to confirm the surface composition and oxidation state of the metal ions in the LaMnO3 and LaMn0.5Fe0.5O3 nanofibers. Figure 5 shows the XPS analysis results of La 3d, Mn 2p, Fe 2p, and O 1s in the LaMnO3 and LaMn0.5Fe0.5O3 nanofibers. As shown in the XPS spectrum of La 3d (Fig. 5(a)), the La 3d5/2 and La 3d3/2 peaks have binding energies of 834.03 and 850.9 eV, respectively, and the binding energy difference between the peaks is 16.06 eV, which was confirmed to represent a typical +3 valence state of La [34-36]. Figure 5(b) exhibits the XPS analysis result of Fe 2p in the LaMn0.5Fe0.5O3 nanofibers substituted with 50 mole% Fe. The Fe 2p3/2 and Fe 2p1/2 peaks have a binding energy of 710.7 and 724.6 eV, respectively, and the binding energy difference between the peaks is 13.9 eV. Additionally, it observed that a satellite peak at 719.5 eV exists between the Fe 2p3/2 and Fe 2p1/2 peaks [37]. This satellite peak indicates that valence number of Fe is +3. Figure 5(c) shows the Gaussian-Lorentzian curve fitting result of the Mn 2p3/2 peak. Compared with the Mn 2p3/2 peak in the LaMnO3 nanofibers, the intensity of the Mn 2p3/2 peak in the LaMn0.5Fe0.5O3 nanofibers was lower, which is a result of the 50 mol% Fe3+ ions being substituted for the Mn3+ ions. The +3 and +4 valence peaks of Mn appear at 641.3-641.6 eV and 643.0-643.4 eV, respectively. The area ratio of Mn4+/Mn3+ in the curve-fitting result of the Mn2p3/2 peak of the LaMnO3 and LaMn0.5Fe0.5O3 nanofibers is 0.72 and 1.14, respectively, indicating that the amount of Mn4+ increased in the samples substituted with 50 mol% Fe. Figure 5d shows the curve-fitting result of the O 1s peak. Four peaks appear at a wide binding energy range of 529.2-532.6 eV, indicating various chemical bonding states of O 1s. The O1 peak is attributed to oxygen in the crystal lattice [38], such as that of La-O and Fe-O in the LaMnO3 and LaMn0.5Fe0.5O3 nanofibers. The O2 peaks correspond to oxygen defects, the O3 peak is related to the hydroxyl group, and the O4 peak is associated with the nitrate group [39, 40]. The area of the O2 peak in the LaMn0.5Fe0.5O3 nanofibers is larger than that of the O2 peak in the LaMnO3 nanofibers. This result indicates that Fe3+ substitution into LaMnO3 induces increasing of the amount of Mn4+ and causes the increase in the amount of adsorbed oxygen for having electronic compensation. These results agree well with the previously reported results of LaFeO3 doped with 15% Mn [24].
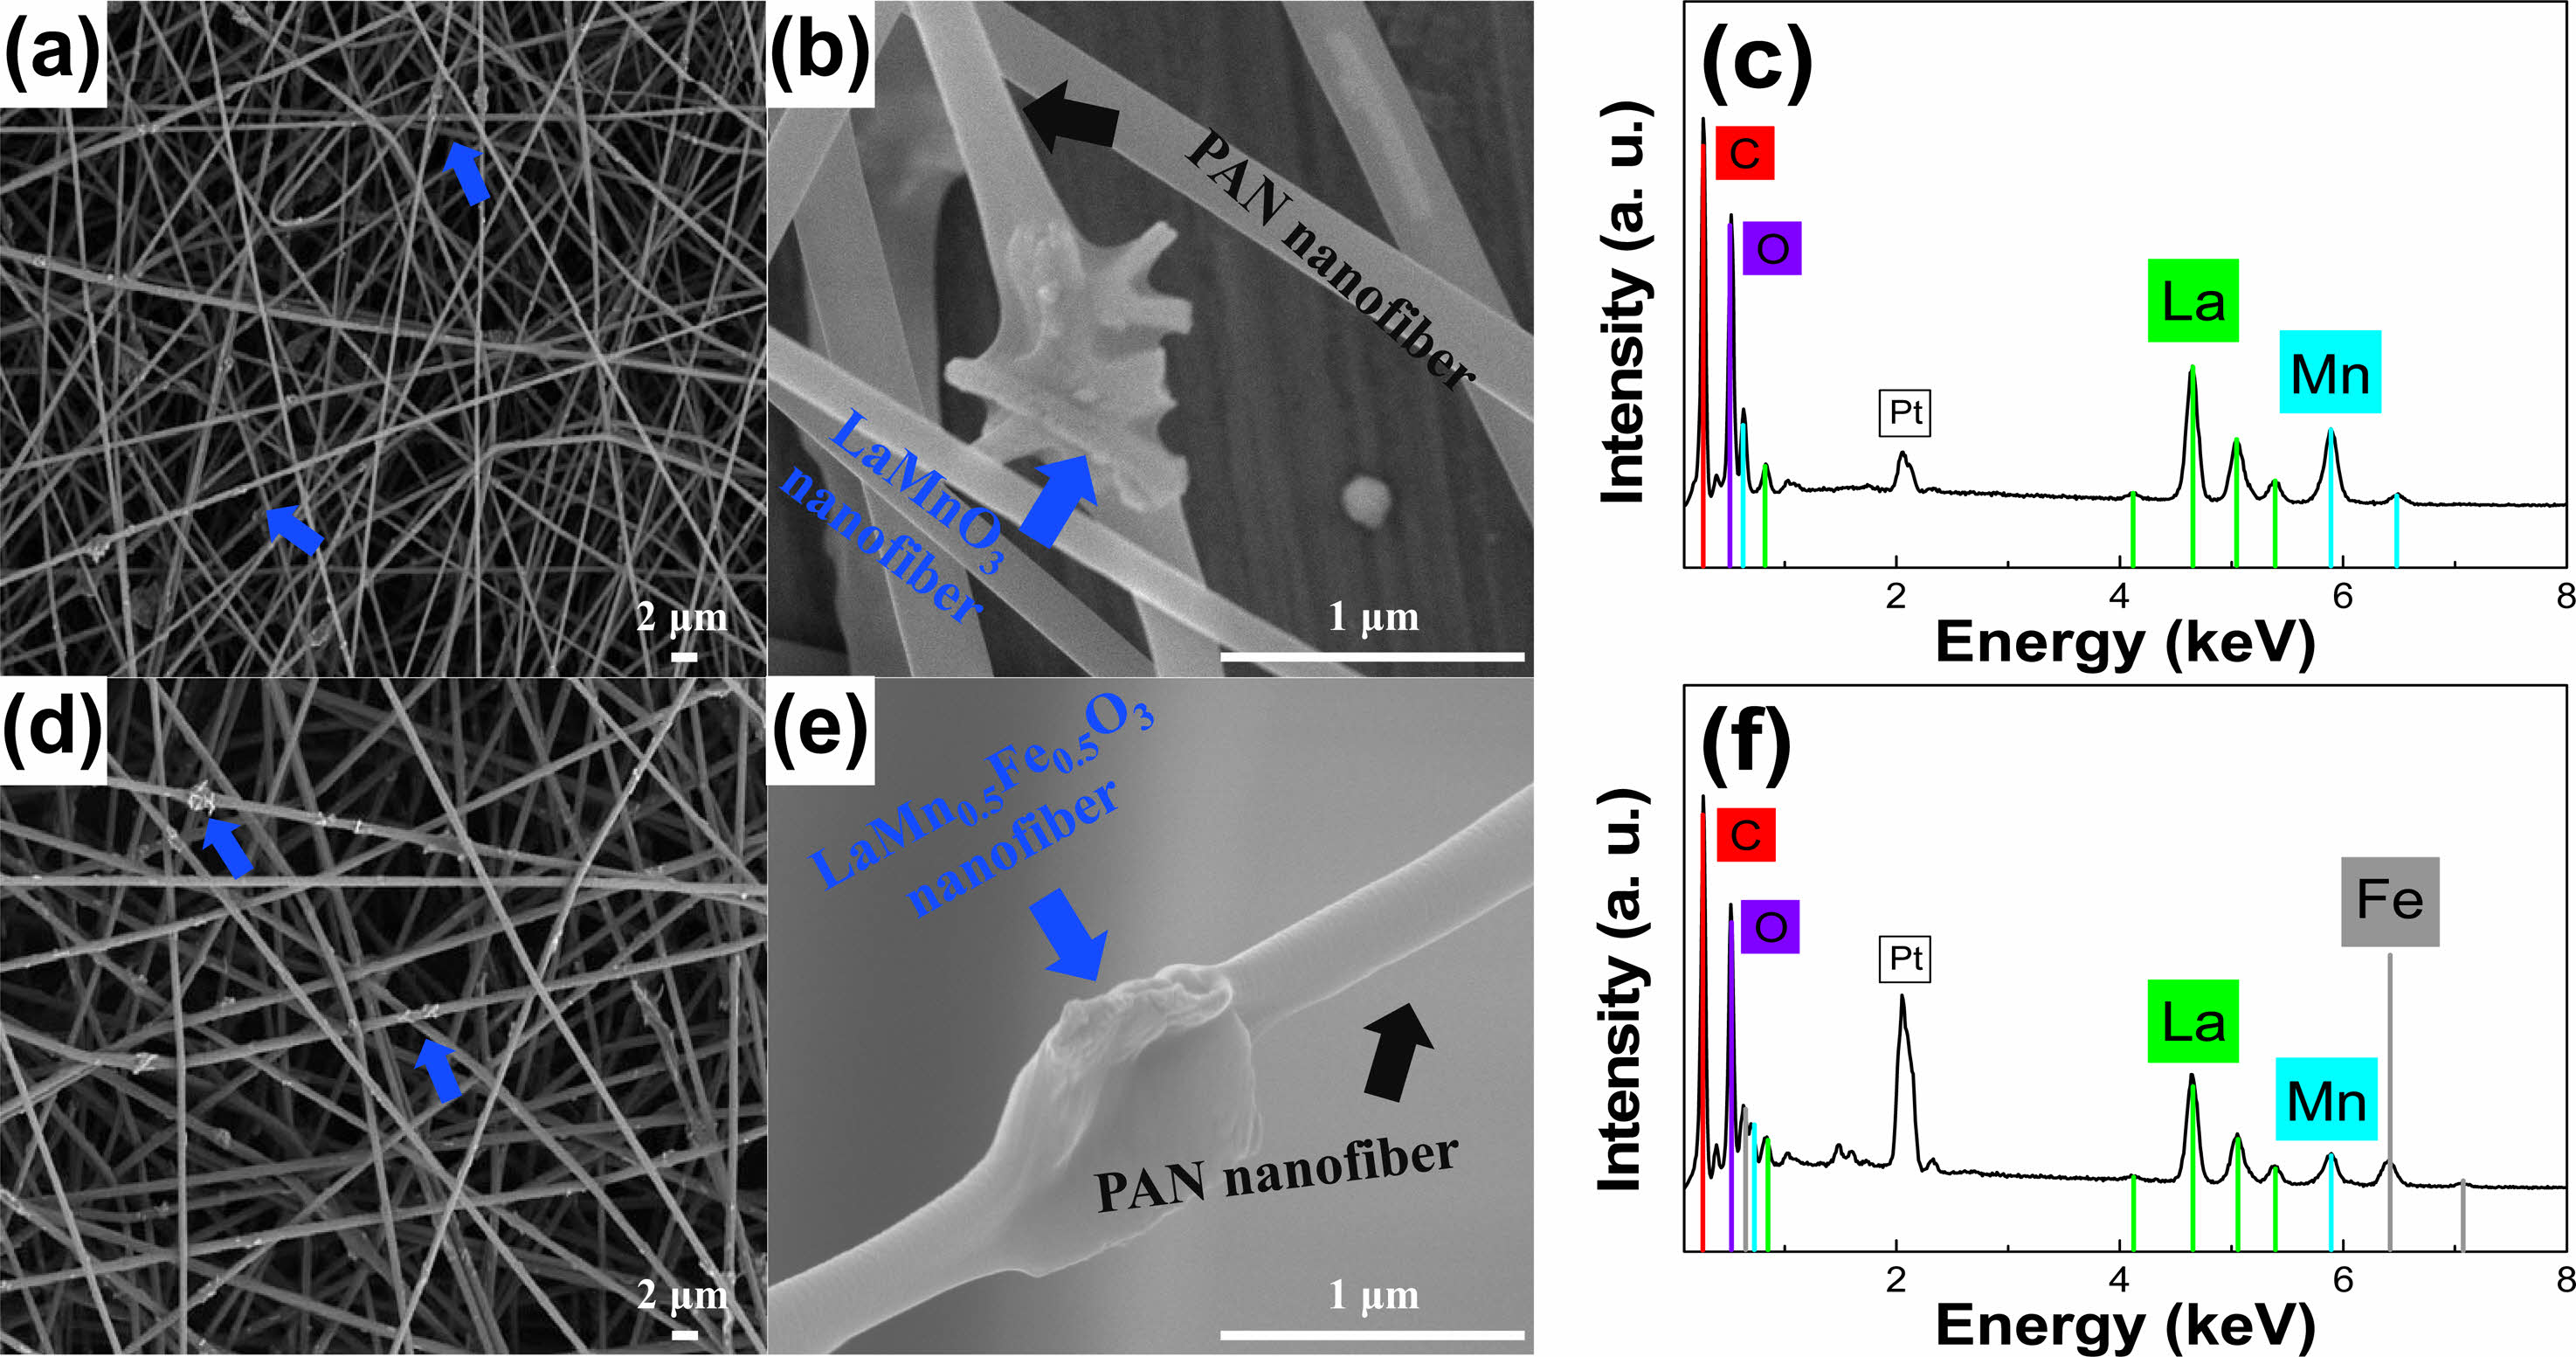
Figure 6(a)-(c) display SEM images and EDS spectra of the PAN/LaMnO3 nanofiber. The diameter of PAN is 300-400 nm, and the length of the LaMnO3 nanofibers is 0.5-1.0 µm. Additionally, La, Mn, and O were detected on the basis of EDS analysis results, as shown in Fig. 6(c). Figure 6(d)-(f) represent the SEM images and EDS spectra of the PAN/LaMn0.5Fe0.5O3 nanofibers. Moreover, La, Mn, Fe, and O were detected, and Mn and Fe were present in a ratio of 5:5 based on EDS analysis results. Pt was also seen from the coating materials for SEM measurements.
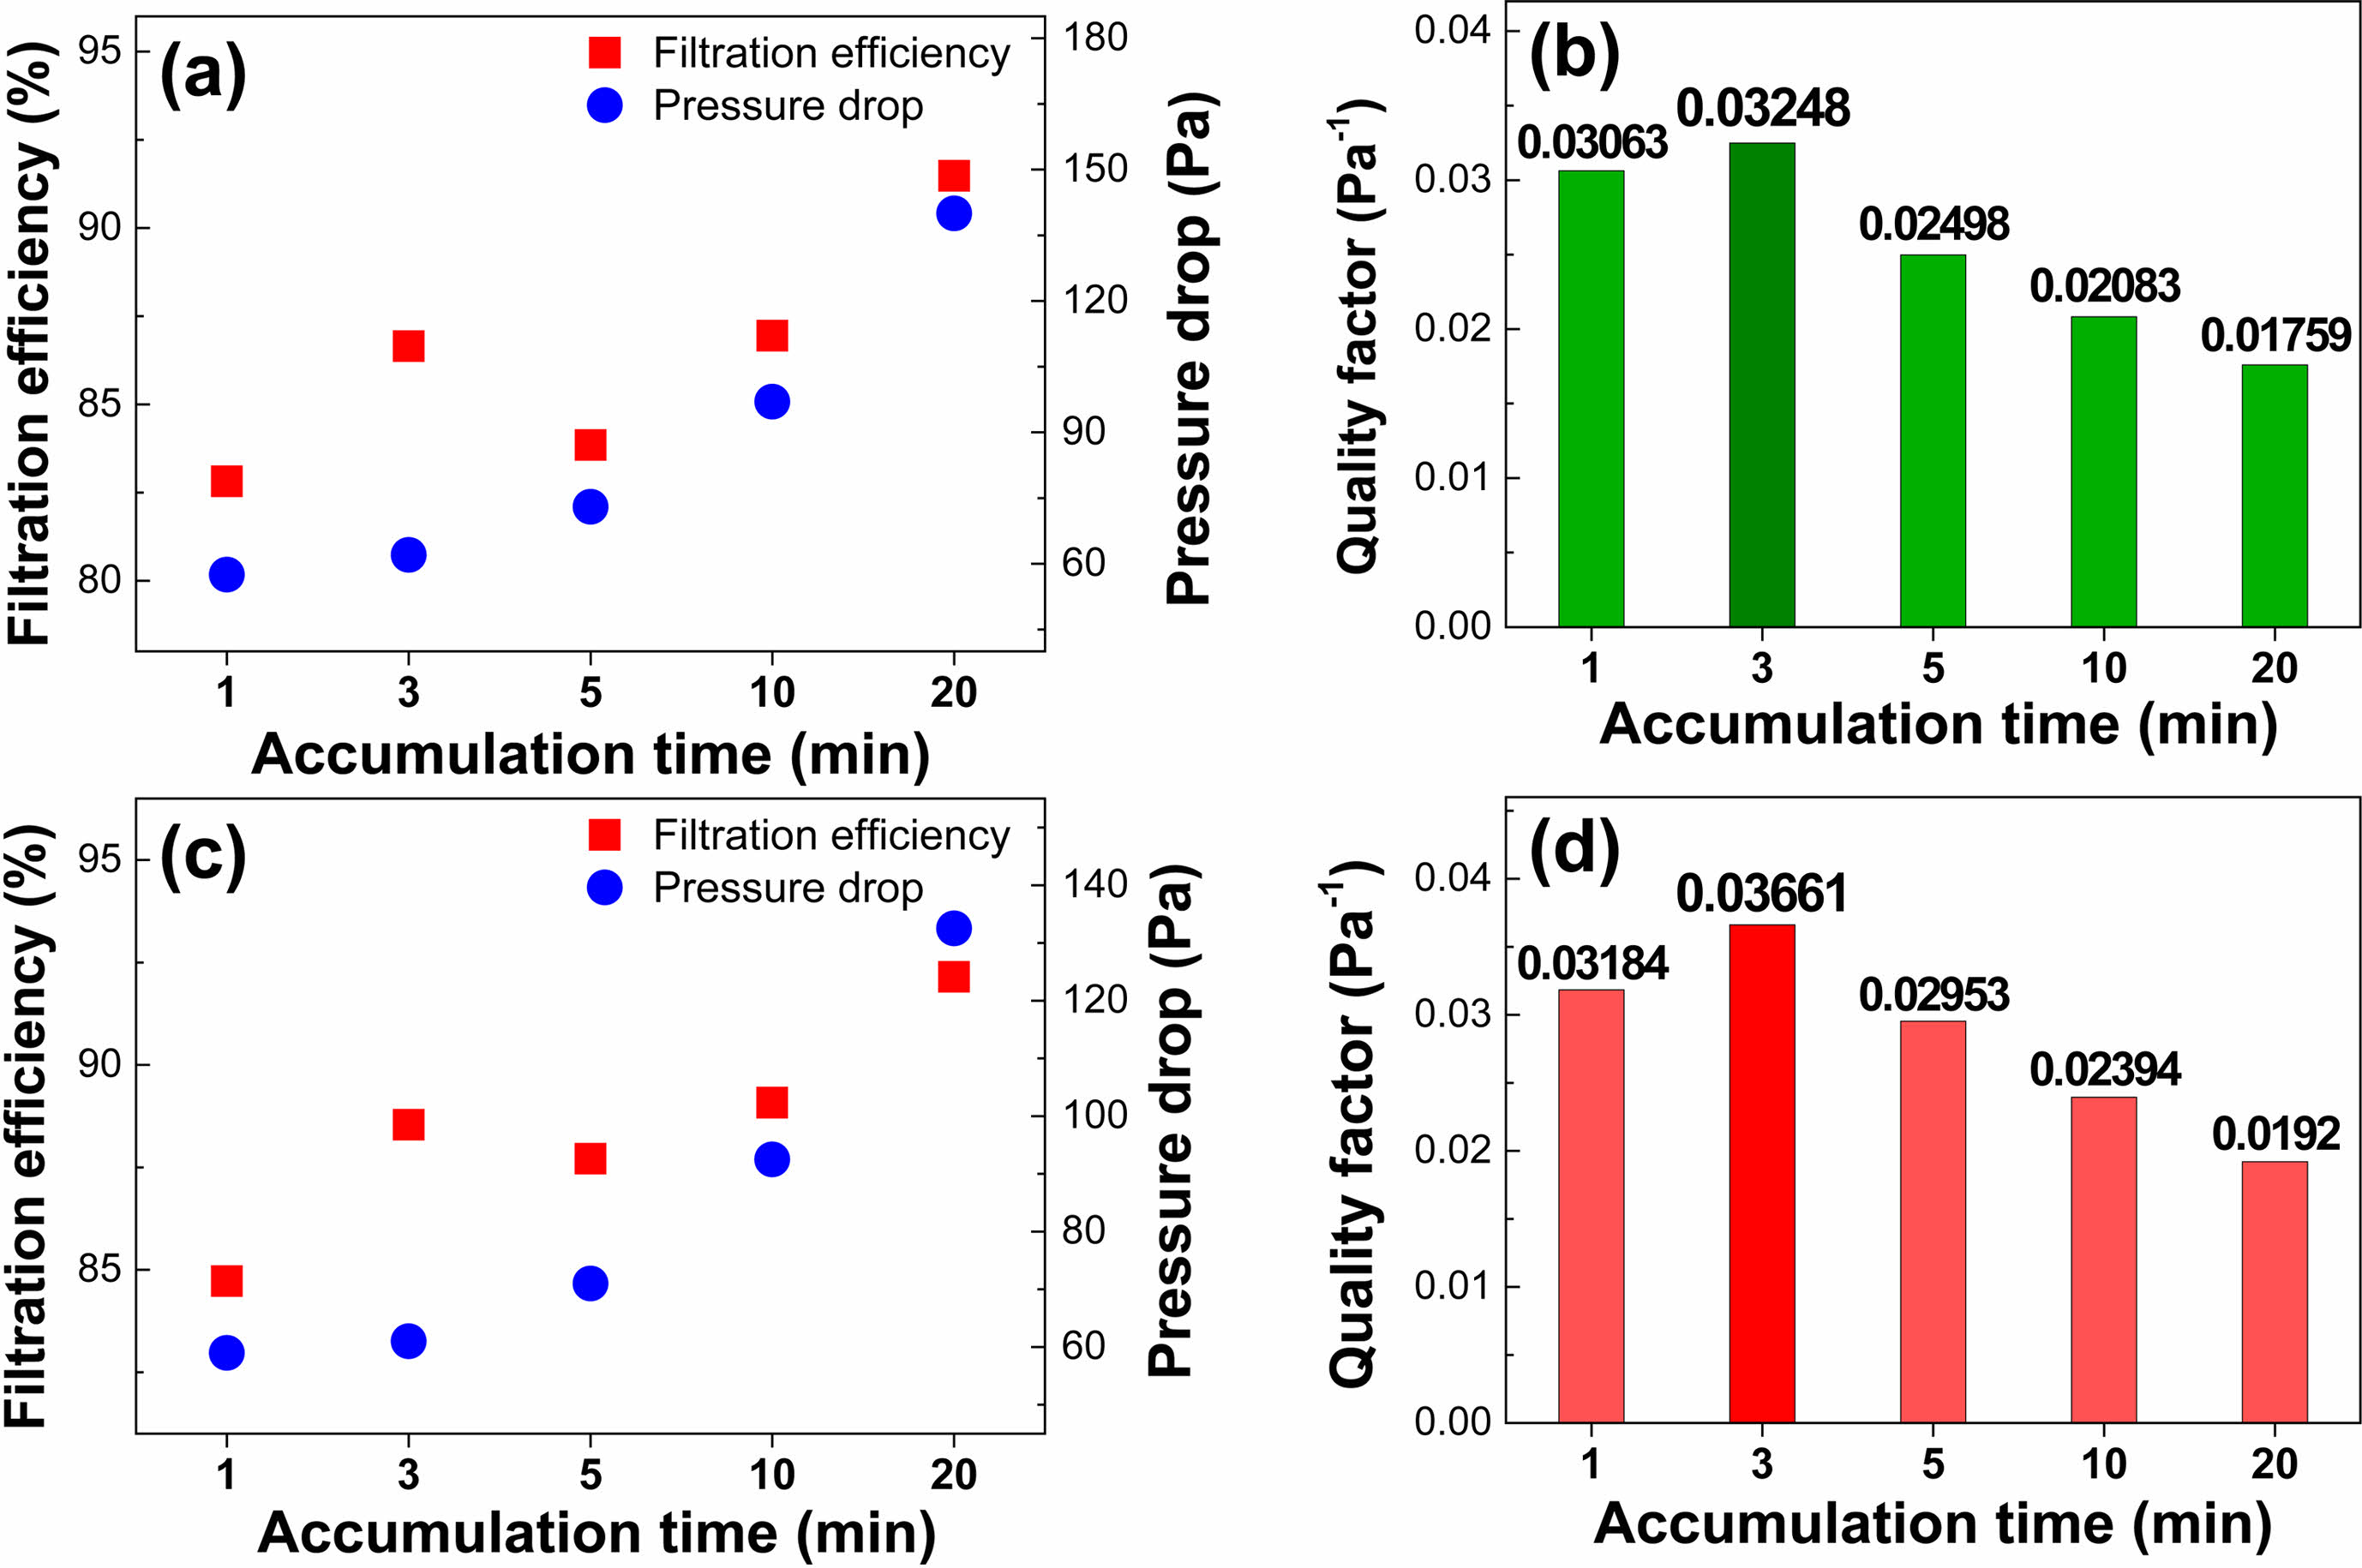
Filter performance was evaluated by measuring the filtration efficiency and pressure drop across the filters using handmade equipment. Furthermore, the filter quality factor (QF) was calculated using the following equation QF = −ln[1 − E (%)]/ΔP. Where E is filter efficiency, and ΔP is pressure drop. For higher QF values, finding out the optimal density of the PAN/LaMnO3 and PAN/LaMn0.5Fe0.5O3 nanofiber filter is essential. In this report, experiments were conducted to obtain optimized density values according to changes in accumulation time. The time was set at 0, 1, 3, 5, 10, and 20 min to determine the effect of the accumulation time on the filter performance. As shown in Fig. 7(a) and (b), when the accumulation time is 3 min, the PAN/LaMnO3 nanofibers filter showed the highest performance with filtration efficiency, pressure drop, and QF of 86.65%, 62 Pa, and 0.03248 Pa−1, respectively. Also, the PAN/LaMn0.5Fe0.5O3 nanofibers filter represented the highest QF when the accumulation time was 3 min, as shown in Fig. 7(c) and (d). Thus, the optimal accumulation time for filter performance was 3 min both the PAN/LaMnO3 and PAN/LaMn0.5Fe0.5O3 nanofiber filters.
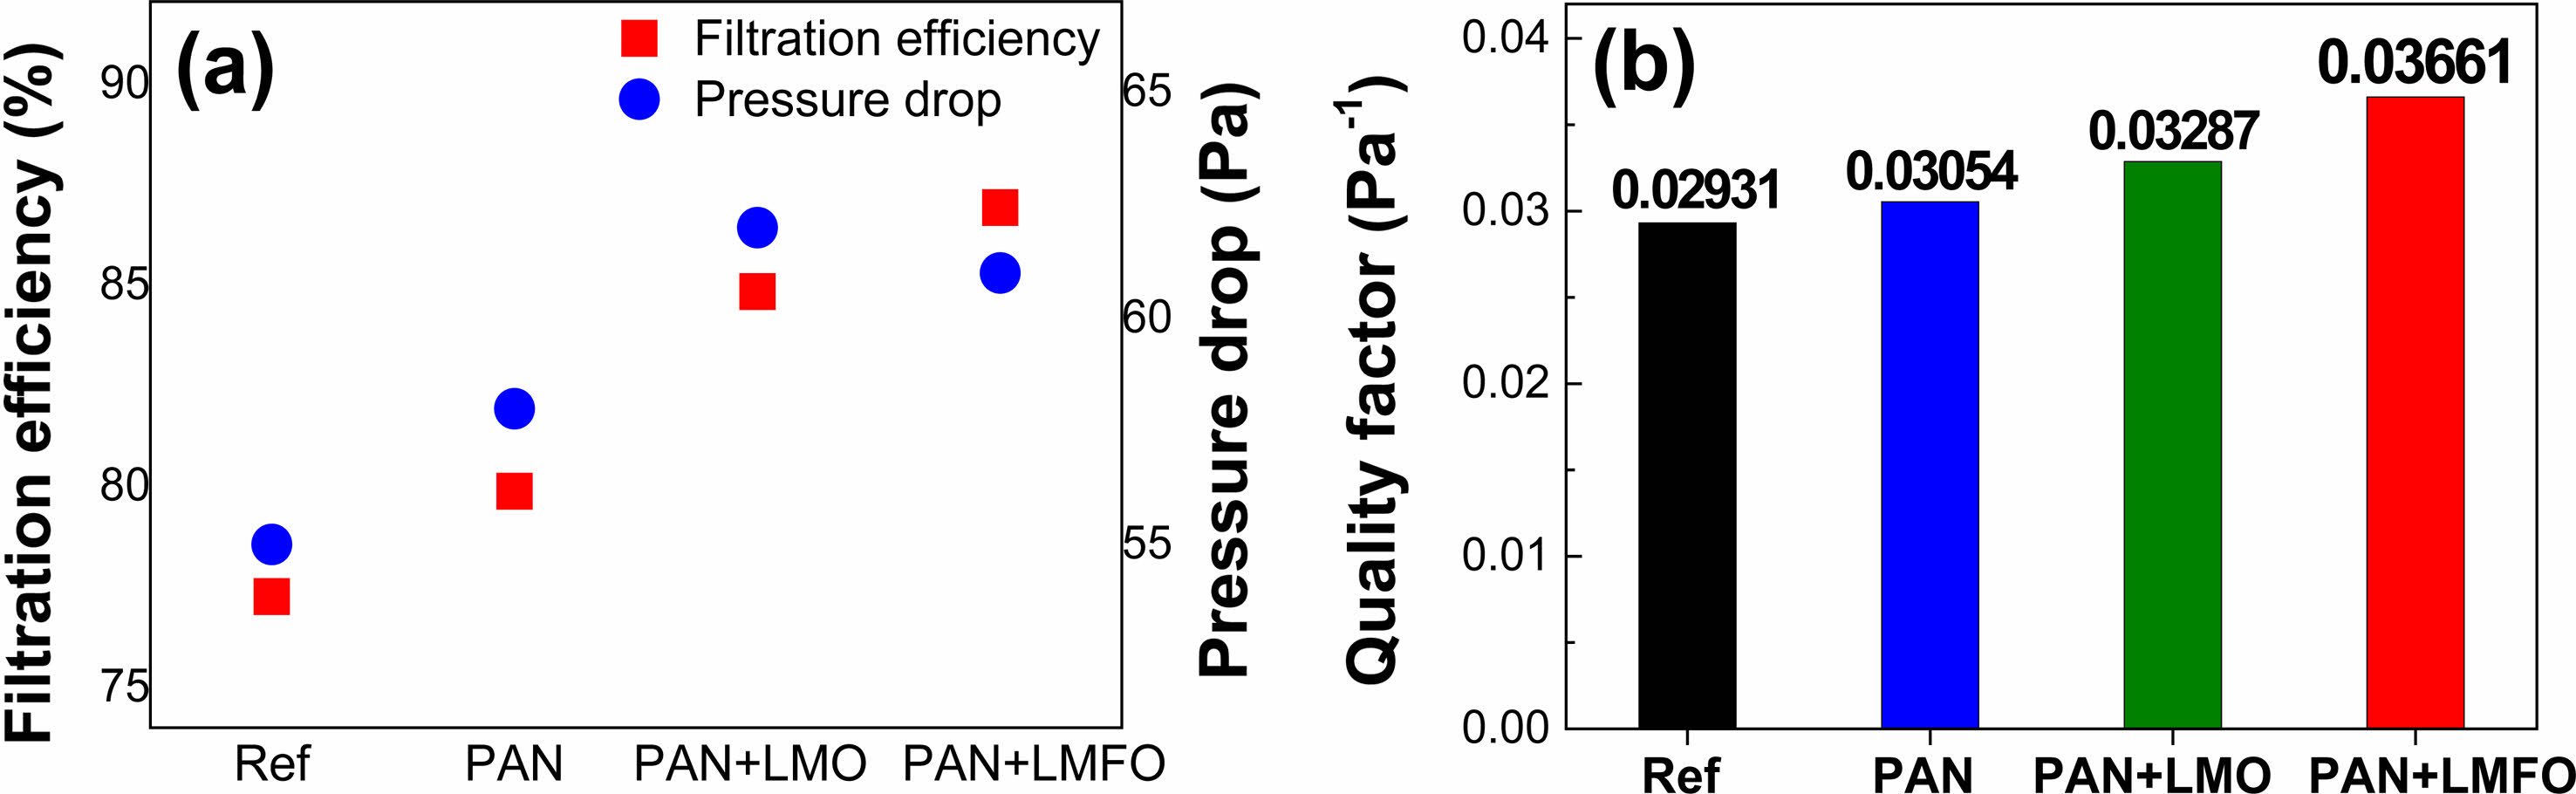
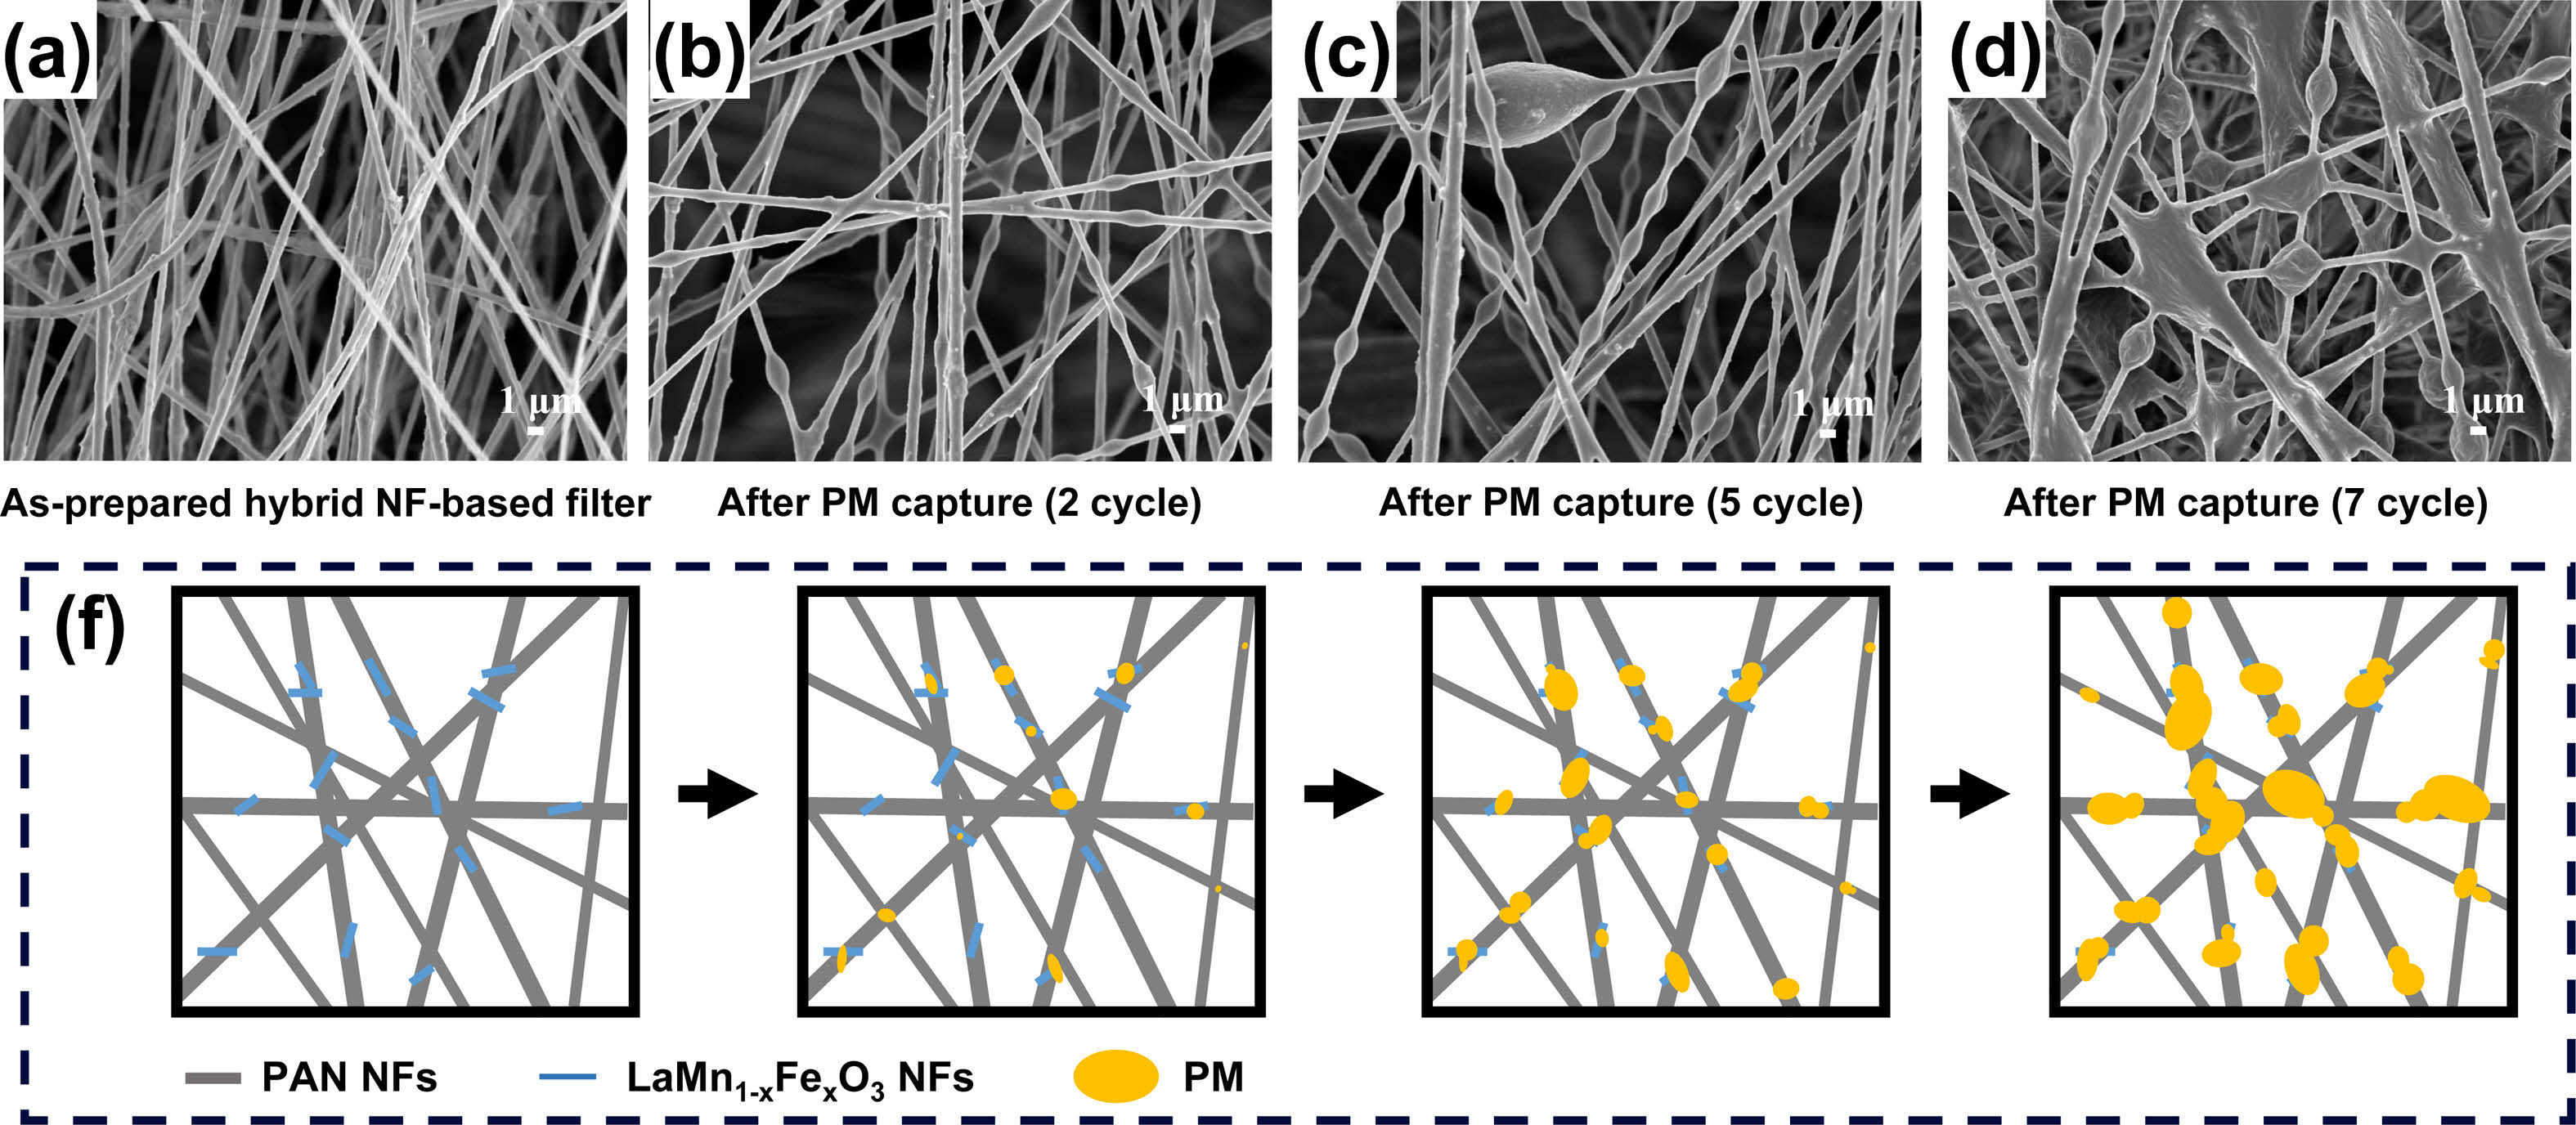
Figure 8(a) compares the filtration efficiency and pressure drop results of the reference, PAN, PAN/LaMnO3, and PAN/LaMn0.5Fe0.5O3 filters. Figure 8(b) displays the QF derived from the formula QF = −ln[1 − E (%)]/ΔP. The PAN/LaMnO3 and PAN/LaMn0.5Fe0.5O3 nanofiber filters showed a higher QF than the reference (H11 nonwoven fabric) and PAN-only filters. Compared to H11 nonwoven fabric, the QF increase rates of PAN, PAN/LaMnO3, and PAN/LaMn0.5Fe0.5O3 nanofiber filters were 4.1%, 12.4%, and 24.9%, respectively. The increased QF in PAN/LaMnO3, and PAN/LaMn0.5Fe0.5O3 nanofiber is estimated to be due to the adsorption of fine dust on the inorganic surface (LaMnO3 or LaMn0.5Fe0.5O3) with oxygen vacancies and the change of the electrostatic force on the surface of organic PAN. However, the detailed mechanism needs further in-depth. As mentioned in the XPS section, Fe substitution in LaMnO3 increased in the amount of oxygen vacancy. Therefore, the dispersion of LaMn0.5Fe0.5O3 nanofibers in PAN was very useful for improving filter performance. Figure 9(a)-(d) shows the SEM images of the PAN/LaMn0.5Fe0.5O3 nanofiber filters versus cycle time during fine dust filtration. Over time, the fine dust filtered by the PAN/LaMn0.5Fe0.5O3 nanofiber filters forms a large mass of particulate matter (PM). Also, Figure 9(f) displays the schematic of the captured PM on PAN/LaMn0.5Fe0.5O3 nanofibers filter at different cycles.
|
Fig. 3 TEM images at low and high magnification: (A) LaMnO3 nanofibers; (B) LaMn0.5Fe0.5O3 nanofibers. |
|
Fig. 4 SEM images: LaMnO3 nanofiber (a) before ball-milling and (b) after ball-milling; LaMn0.5Fe0.5O3 nanofiber (c) before ball-milling and (d) after ball-milling. |
|
Fig. 5 XPS spectra of the PAN/LaMnO3 and PAN/LaMn0.5Fe0.5O3 nanofibers (a) La 3d and (b) Fe 2p; curve fitting of (c) Mn 2p3/2 and (d) O 1s. |
|
Fig. 6 (a)-(b) SEM images of PAN/LaMnO3 and (c) its EDS spectrum; (d)-(e) SEM images of LaMn0.5Fe0.5O3 nanofibers nanofiber and (f) its EDS spectrum. |
|
Fig. 7 Filtration performance test by accumulation time: PAN/LaMnO3 nanofiber filter (a) Efficiency and Pressure drop (b) Quality factor; PAN/LaMn0.5Fe0.5O3 nanofibers filter (c) Efficiency and Pressure drop (d) Quality factor results. |
|
Fig. 8 (a) Efficiency and Pressure drop and (b) Quality factor results of reference (H11 nonwoven fabric), PAN, PAN/LaMnO3, and PAN/LaMn0.5Fe0.5O3 nanofibers filter. |
|
Fig. 9 a)-(d) FE-SEM image of PAN/LaMn0.5Fe0.5O3 filter with increasing PM capturing cycle, (f) Schematic of the captured PM surface on PAN/LaMn0.5Fe0.5O3 nanofibers filter at different cycles. |
In this study, an organic-inorganic hybrid filter of PAN/LaMnO3 and PAN/LaMn0.5Fe0.5O3 nanofiber was successfully synthesized by a two-step electrospinning method. The LaMnO3 and LaMn0.5Fe0.5O3 nanofibers have a single-phase orthorhombic crystal structure without forming secondary phases and impurities. The diameter of LaMnO3 and LaMn0.5Fe0.5O3 nanofibers ranged from 100 to 150 nm. Also, the LaMnO3 and LaMn0.5Fe0.5O3 nanofiber was found to have a one-dimensional structure in which nanoparticles of 15 nm and 18 nm were aggregated. According to the XPS analysis, in the case of LaMn0.5Fe0.5O3 nanofibers, the amount of oxygen defects increased due to Fe substitution of LaMnO3. As a result of the filter performance test, both PAN/LaMnO3 and PAN/LaMn0.5Fe0.5O3 showed the highest QF at 3 min. of electrospinning accumulation time. The PAN/LaMnO3 and PAN/LaMn0.5Fe0.5O3 nanofiber filters showed a higher QF than the reference (H11 nonwoven fabric) and PAN-only filters. Compared to the reference, QF increase rates of PAN, PAN/LaMnO3, and PAN/LaMn0.5Fe0.5O3 nanofiber filters were 4.1%, 12.4%, and 24.9%, respectively. The difference between the QF value of the LaMnO3 and LaMn0.5Fe0.5O3 nanofibers is estimated to be due to the rise in the release of negative ions. Therefore, the dispersion of LaMn0.5Fe0.5O3 nanofibers in PAN was very useful for improving filter performance.
This research was supported by Basic Science Research Program through the National Research Foundation of Korea (NRF) funded by the Ministry of Education (2018R1D1A3B07050056). This work was partially supported by the Technology Innovation Program (Advanced Technology Center Plus, 20018017) funded by the Ministry of Trade, Industry & Energy (MOTIE, Korea).
- 1. S.H. Mir, L.A. Nagahara, T. Thundat, P.M. Tabari, H. Furukawa, and A. Khosla, J. Electrochem. Soc. 165 (2018) B3137-B3156.
-

- 2. L. Zhang, Y. Gong, Q. Hu, L. Wang, J. Wu, and L. Yu, J. Phys. Chem. C 125 (2021) 1441-1446.
-
- 3. S. Singh, H. Chen, S. Shahrokhi, L.P. Wang, C.-H. Lin, X. Guan, A. Tricoli, Z.J. Xu, and T. Wu, ACS Energy Lett. 5 (2020) 1487-1497.
-
- 4. H. Zhao, N. Deng, W. Kang, and B. Cheng, Chem. Eng. J. 390 (2020) 124571.
-
- 5. X. Zhao, Y. Li, T. Hua, P. Jiang, X. Yin, J. Yu, and B. Ding, ACS Appl. Mater. Interfaces 9 (2017) 12054-12063.
-
- 6. T.-T. Li, W. Fan, X. Cen, Y. Wang, B.-C. Shiu, H.-T. Ren, H.-K. Peng, Q. Jiang, C.-W. Lou, and J.-H. Lin, Nanomaterials 10 (2020) 2025.
-
- 7. H. Zhang, J. Liu, X. Zhang, C. Huang, and X. Jin, RSC Adv. 8 (2018) 7932-7941.
-
- 8. M.A. Hassan, B.Y. Yeom, A. Wilkie, B. Pourdeyhimi, and S.A. Khan, J. Membr. Sci. 427(2013) 336-344.
-
- 9. R. Thakur, D. Das, and A. Das, Fibers Polym. 15 (2014) 1436-1443.
-
- 10. W. Jasper, J. Hinestroza, A. Mohan, J. Kim, B. Shiels, M. Gunay, D. Thompson, and R. Barker, J. Aerosol Sci. 37 (2006) 903-911.
-
- 11. H. Gao, Y. Yang, O. Akampumuza, J. Hou, H. Zhang, and X. Qin, Environ. Sci.: Nano 4 (2017) 864-875.
-
- 12. N. Wang, X. Wang, B. Ding, J. Yu, and G. Sun, J. Mater. Chem. 22 (2012) 1445-1452.
-
- 13. J. Xu, C. Liu, P.-C. Hsu, K. Liu, R. Zhang, Y. Liu, and Y. Cui, Nano Lett. 16 (2016) 1270-1275.
-
- 14. W. Sambaer, M. Zatloukal, and D. Kimmer, Chem. Eng. Sci. 82 (2012) 299-311.
-
- 15. J. Lee, and J. Kim, Polymer 12 (2020) 721.
-
- 16. H.-J. Kim, S.J. Park, C.S. Park, T.-H. Le, S.H. Lee, T.H. Ha, H.-I Kim, J. Kim, C.-S. Lee, H. Yoon, and O.S. Kwon, Chem. Eng. J. 339 (2018) 204-213.
-
- 17. X.L. Zhao, Y. Li, T. Hua, P. Jiang, X. Yin, J. Yu, and B. Ding, Acs Appl. Mater. Interfaces 9 (2017) 12054-12063.
-
- 18. X. Zhu, Z. Dai, K. Xu, Y. Zhao, and Q. Ke, Macromol. Mater. Eng. 304 (2019) 1900350.
-
- 19. D. Cho, A. Naydich, M.W. Frey, and Y.L. Joo, Polymer 54 (2013) 2364-2372.
-
- 20. J. Kim, S.C. Hong, G.N. Bae, and J.H. Jung, Environ. Sci. Technol. 51 (2017) 11967-11975.
-
- 21. M. Hu, L. Yin, H. Zhou, L. Wu, K. Yuan, B. Pan, Z. Zhong, and W. Xing, J. Mem. Sci. 605 (2020) 118094.
-
- 22. A.S. Nesaraj, S. Dheenadayalan, I.A. Raj, and R. Pattabiraman, J. Ceram. Process. Res. 13 (2012) 601-606.
-
- 23. W.Y. Lee, H.J. Yun, and J.-W. Yoon, J. Alloy. Compd. 583 (2014) 320-324.
-
- 24. J.-H. Jeong, C.-G. Song, K.-H. Kim, W. Sigmund, and J.-W. Yoon, J. Alloy. Compd. 749 (2018) 599-604.
-
- 25. T. Moon, W.-Y. Lee, C.-J. Choi, and J.-W. Yoon, Appl. Phys. Lett. 105 (2014) 153103.
-
- 26. G.M. Bak, C.-G. Song, and J.-W. Yoon, J. Ceram. Process. Res. 19 (2018) 253-256.
-
- 27. R. Sorita and T. Kawano, Sens. Actuator B 40 (1997) 29-32.
-
- 28. M. Shen, Z. Zhao, J. Chen, Y. Su, J. Wang, and X. Wang, J. Rare Earths 31 (2013) 119-123.
-
- 29. M. Al-Hasem, S. Akbar, and P. Morris, Sens. Actuator B 301 (2019) 126845.
-
- 30. J.W. Yoon, M.L. Grilli, E.D. Bartolomeo, R. Ploini, and E. Traversa, Sens. Actuator B 76 (2001) 483-488.
-
- 31. Z. Yang, Y. Zhen, Y. Feng, X. Jiang, Z. Qin, W. Yang, and Y. Qie, J. Colloid. Interface. Sci. 635 (2023) 598-610.
-
- 32. C. Liu, P.-C. Hsu, H.-W. Lee, M. Ye, G. Zheng, N. Liu, W. Li, and Y. Cui, Nat. Commun. 6 (2015) 6205.
-
- 33. C.-H. Hung, and W.W.-F. Leung, Sep. Purif. Technol. 79 (2011) 34-42.
-
- 34. E. Cao, Y. Yang, T. Cui, Y. Zhang, W. Hao, L. Sun, H. Peng, and X. Deng, Appl. Surf. Sci. 393 (2017) 134-143.
-
- 35. R.D. Kumar, R. Thangappan, and R. Jayavel, J. Phys. Chem. Solid. 101 (2017) 25-33.
-
- 36. K.M. Parida, K.H. Reddy, S. Martha, D.P. Das, and N. Biswal, Int. J. Hydrogen Energy 35 (2010) 12161-12168.
-
- 37. G. Dong, G. Tan, W. Liu, A. Xia, and H. Ren, J. Mater. Sci. Technol. 30 (2014) 365-370.
-
- 38. J.W. Yoon, E.D. Bartolomeo, and E. Traversa, J. Electroceram. 26 (2011) 28-31.
-
- 39. H. Su, L. Jing, K. Shi, C. Yao, and H. Fu, J. Nanopart. Res. 12 (2010) 967-974.
-
- 40. J.F. Moulder, W.F. Stikle, P.E. Sobol, K.D. Bomben, and J. Chastain, Handbook of X-ray Photoelectron Spectroscopy, Eden Prairie, MN, 1992.
 This Article
-
2023; 24(5): 827-834
Published on Oct 31, 2023
- 10.36410/jcpr.2023.24.5.827
- Received on Jul 4, 2023
- Revised on Aug 23, 2023
- Accepted on Sep 17, 2023
Services
- Abstract
introduction
experimental
results and discussion
conclusions
- Acknowledgements
- References
- Full Text PDF
Shared
Correspondence to
- Jong-Won Yoon
-
Department of Materials Science and Engineering, Dankook University, Cheonan-si 31116, Republic of Korea
Tel : +82-41-550-3536 Fax: +82-41-569-2240 - E-mail: jwyoon@dankook.ac.kr
Clean-Energy Research Institute(CRI), Hanyang University, 222, Wangsimni-ro, Seongdong-gu, Seoul, 04763, Korea
E-mail: jcpr@hanyang.ac.kr