


- Enhancing micromachining precision with novel electrolyte combinations: an investigation
Sudharsan Gunasekarana,*, Suresh Periyagounderb and Magibalan Subramaniamc
aAsst. Professor, Mechatronics Engineering, Sona College of Technology, Salem, India
bProfessor, Mechatronics Engineering, Sona College of Technology, Salem, India
cAssociate Professor, Mechanical Engineering, Nandha Engineering College, Erode, IndiaThis article is an open access article distributed under the terms of the Creative Commons Attribution Non-Commercial License (http://creativecommons.org/licenses/by-nc/4.0) which permits unrestricted non-commercial use, distribution, and reproduction in any medium, provided the original work is properly cited.
Electrochemical micromachining is a non-traditional machining process used for drilling at the micro level. The process is challenging to control due to its reliance on reaction parameters like over-cut, material removal rate, and taper. The removal rate of material (MRR) and overcut are key responses observed during the process. Recent studies have focused on investigating the effect of process parameters such as Electrolyte concentration, voltage, and duty cycle on electrochemical micromachining. Researchers have found that variations in the Electrolyte type, combination, and duty cycle can significantly impact material removal rate and overcut. In this work, the combination of novel electrolyte and the optimal temperature was maintained to carry out the experiments. The removal rate of material and overcut are critical responses observed during the process in which electrolyte concentration has shown to impact these responses significantly. SEM (Scanning Electron Microscope) images have been used to analyze the resulting drill surfaces, providing valuable insights into the microstructure and morphology of the drilled holes
Keywords: EMM, L9 orthogonal array, RSM, SEM, SS316L
The opposite process of electrochemical coating is electrochemical treatment, which is a regulated anodic dissolution process at an atomic level. Various studies of electrochemical micromachining, including hole drilling in grade 2 titanium metal, SS316L stainless steel, and CA173 copper alloy, are eliminated with closed control loops and high-frequency voltage pulses. Studies of the effect of various parameters include using precision electrochemical micromachining to develop narrow-gap electrodes. A survey of electrochemical microfabrication of electrolyte flow rate, electrolyte concentration, and feed rate, electrochemical treatment of wire inner channels, Taguchi L9 orthogonal matrix [1, 2].
Metals with exceptional qualities are difficult to mill using typical cutting procedures; hence machining materials remain crucial, even though certain unconventional machining technologies are electrical; Flow machining and electrochemical inclining, on the other hand, can inexpensively handle difficult-to-machine materials, but their processing efficiency is still restricted. The machining boundary was contained in a hermetic container into which a regulated dielectric fluid was injected. During machining, heat and debris are forced out via the channel, resulting in a nonstationary output caused by the flushing dielectric's hydrodynamic and cooling action. The metal is removed via the managed dissolution of the anode, which follows the Faradays law of electrolysis [3]. The electrolysis mechanism at the cathode releases hydroxyl ions, which mix using metal ions from the anode to produce insoluble metal hydroxide.
Hocheny proposed [4] a comparative study on single-hole machining with regulated eight channels, which showed improved outputs through reduced fluctuation in electrolyte flow rate. Ali emulated guidelines with equations for arbitrating applicable conditions to achieve sound quality holes for reducing cooling turbine blades by identifying defects that occurred in STED.
Mehdi Taj Dari [5] predicted the analysis of radio overhead in which four parameters will light concentration old days initial machining gap and two feet rates are considered for the development of the model in which voltage and electric concentration have a significant effect on radio water it is also found that the increase in the voltage and the upper concentration increases the radio load that while increasing tune feed rate decreases the radio load the baffler discussed, it’s the foundation on NaNO3 air Force solution to 25 degrees Celsius where L16 mixed orthogonal array (OA) was used.
Ayyappan investigated [6] Machining characteristics using dichromate mixed aqueous NaCl on 20MnCr5 alloy steel in which observations to find its material removal rate and surface roughness in this paper 20 experiments were conducted base down voltage electrolyte concentration and electrode gap the obtained values or justified you sing fisher test to fix the mathematical model. The genetic algorithm obtained a parametric influence on MRR and Surface roughness the result confirms an increase in MRR of up to 14% due to the addition of 5-gram potassium dichromate.
J.R. Gamage [7] categorized hybrid machining, green lubrication, dry-cutting, and energy-efficient machining processes. Non-conventional machining domain for clean, green, and safe environment improved safe, less environment towards Eco-friendly electrical discharge machining. Galang Factorial design experiment [8] on AISI D2 steel using parameters such as electrolyte, voltage, and IEG to maximize material removal performance and discovered that 0.153 g/min was the best MRR and electrolytes density rates first in the impact MRR.
Yuhang Zhang [9] flow and striation disintegration, resulting in deteriorating machining accuracy and poor machining stability. Hole shaping process symmetric electrolytes model of ECM high-speed electrode machining gap, electrolytes temperature, flow rate inner and outer diameter initial gap machining depth wt% NaNO3 [10] 35C 6 L/h 0.6, 1.0 mm SS 304 stainless steel 0.3 mm 3 mm. Galang adopted [8] Taguchi and grey relational analysis study EN-31 steel. Using Taguchi L27 OA electrolytes concentration, voltage. Parameter affecting MRR and overcut and surface roughness.
Mehdi Tajdari [5] Artificial neural and co-active neuro-fuzzy inference system model average relative error of nearly 5%. Parameters on radial overcut Developed CANFIS model. Ali A investigated stainless steel for minimizing surface roughness Taguchi approach was used, which is enough experiments for developing mathematical modelling. Design experts are utilized in the analysis undermining the SN ratio.
Jerin A investigated [11] mission ability on stainless steel 12X 18 H 10T for surface finish. The process parameters include machining gap discharge, giving more preferences to add money rent, and an electrolyte concentration at three levels. Taguchi L9 was utilized in the investigation; it is essential for the ECM for the machining of the stainless steel for intricated shapes workpiece dimension chosen was a diameter 16 mm under 32 mm thick, resulting in a higher surface finish, and it was found that the was most prompting factor on the surface quality. S. Hinduja extensively worked [12] on the Modelling of ECM, which discusses several factors such as fluid flow, gas evolution, heat generation, and residual transport. This paper had a primary interest in determining the current density distribution in further hydrogen bubble generation between cathode and anode are discussed which results in incomplete electrolyte electrical conductivity ions transportation was also discussed, which is best on electrolyte velocity distribution that is flow rate. To find the current efficiency, the function of current density, pulse time, and electrolyte concentration must be considered for passivating electrolyte example NaCl.
S. Ayyappan performed a study on [6] 20MnCr5 alloy steel where hydrogen peroxide mix Sodium chloride was used as an electrolyte in which predominant parameters were chosen who find the influences on material removal rate under surface roughness. Experiments were conducted to find the electrical conductance mathematical model developed by ESO DF optimizer. Using H2O2 mainly increases the oxygen during the chemical reaction with 25 volts with an operating concentration of 160 grams per liter, improving the material removal rate. Milan Kumar Das investigated [13] machining on EN 31 steel for reduced surface irregularity and the highest material removal rate. The development of a second-order equation from RSM was used in the ABC algorithm. Four factors and three under three levels were considered in this experiment done surface morphology was studied using scanning electron microscopy the result shows favorable agreement with experimental values in which FCC design with 31 experiments was connected.
Based on the careful review, it was demonstrated that knowing the machining variables for sophisticated tool shapes is extremely difficult. As a result, it is necessary to comprehend the parameters associated with the conductivity of electrolytes. Once it is determined, it is simple to construct the process, which is a key issue with intricate forms. Again, the electrolyte conductivity analysis in ECM, which is the focus of this work, maybe thoroughly investigated, and mathematical or computer models closely related to real-world processes.
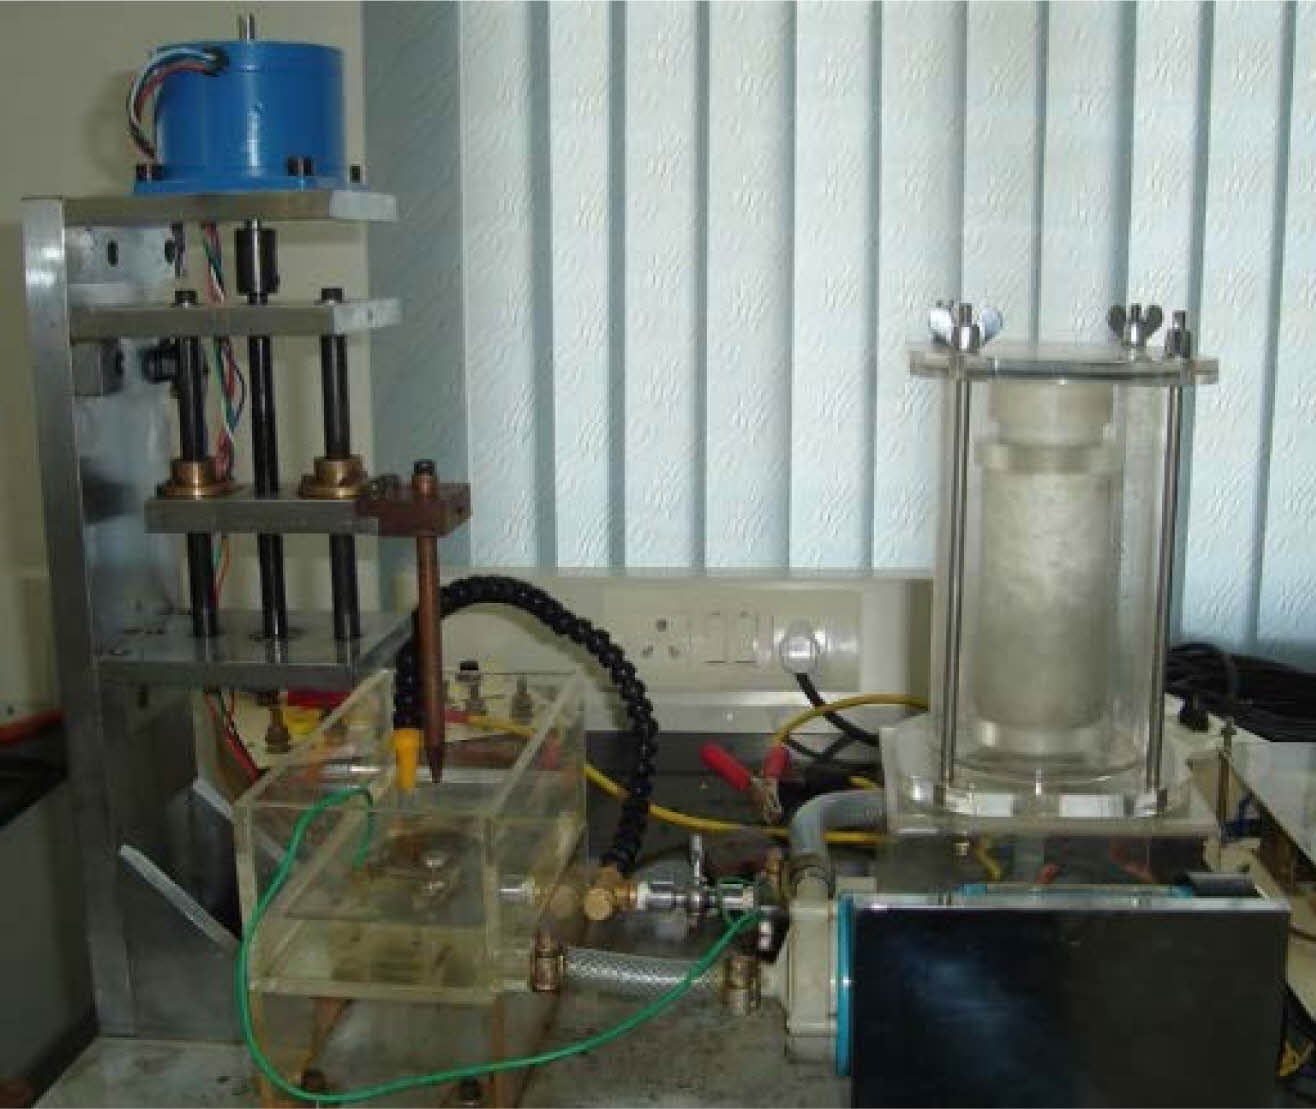
The machining set-up of various subcomponents which include a work holding platform, tool feeding device (stepper motor), control system & Pulse rectifier (power supply), as flourished in Fig. 1.
Work Holding Platform
It comprises two rectangular platforms holding the workpiece while the machining operation is performed; the work-holding platform is immersed in the electrolyte chamber. The machining chamber is located toward the bottom of the setup, directly below the tool-holding device. The area holds recirculated electrolytes delivered by a magnetic pump.
Tool Feeding System
This device is activated by the stepper motor's rotational movement of 1.8/Step with torque 3 Kg-cm. The stepper motor is connected to the central screw rod. The feeding block moves when the stepper meter moves the screw and nut arrangement, where the maximum tool movement is 75 mm. A microprocessor unit [14] sends signals to the stepper motor, allowing the tool to move forward and backward.
Selection of Electrolytes
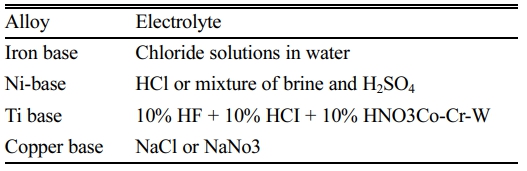
Current passes through the medium (electrolyte) in electrochemical machining. An ideal electrolyte must be highly conductive, low viscous, high in specific heat, chemically stable, non-corrosive, and non-toxic. Electrolyte conductivity is affected by salt concentration, dissolved gases, and temperature. The various electrolytes used for different materials are shown the Table 1.
The electrolyte consists of an aqueous, neutral solution with sodium chloride (NaCl), where a decomposition chemical reaction occurs. When an ionic solid dissolves in water, the reliable dissociates (splits) into cations & anions. When a potential variation is applied during the workpiece (anode) and the tool (cathode), positive ions move to the bottom of the tool, and negative ions are directed toward the workpiece [15].
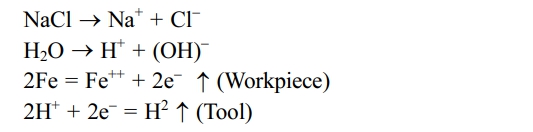
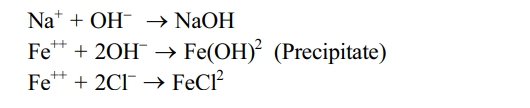
As an outcome, electrons from the tool are exalted by hydrogen ions, while within the electrolyte synthesis type reaction occurs, resulting in precipitate formation, which is removed during filtration [6].
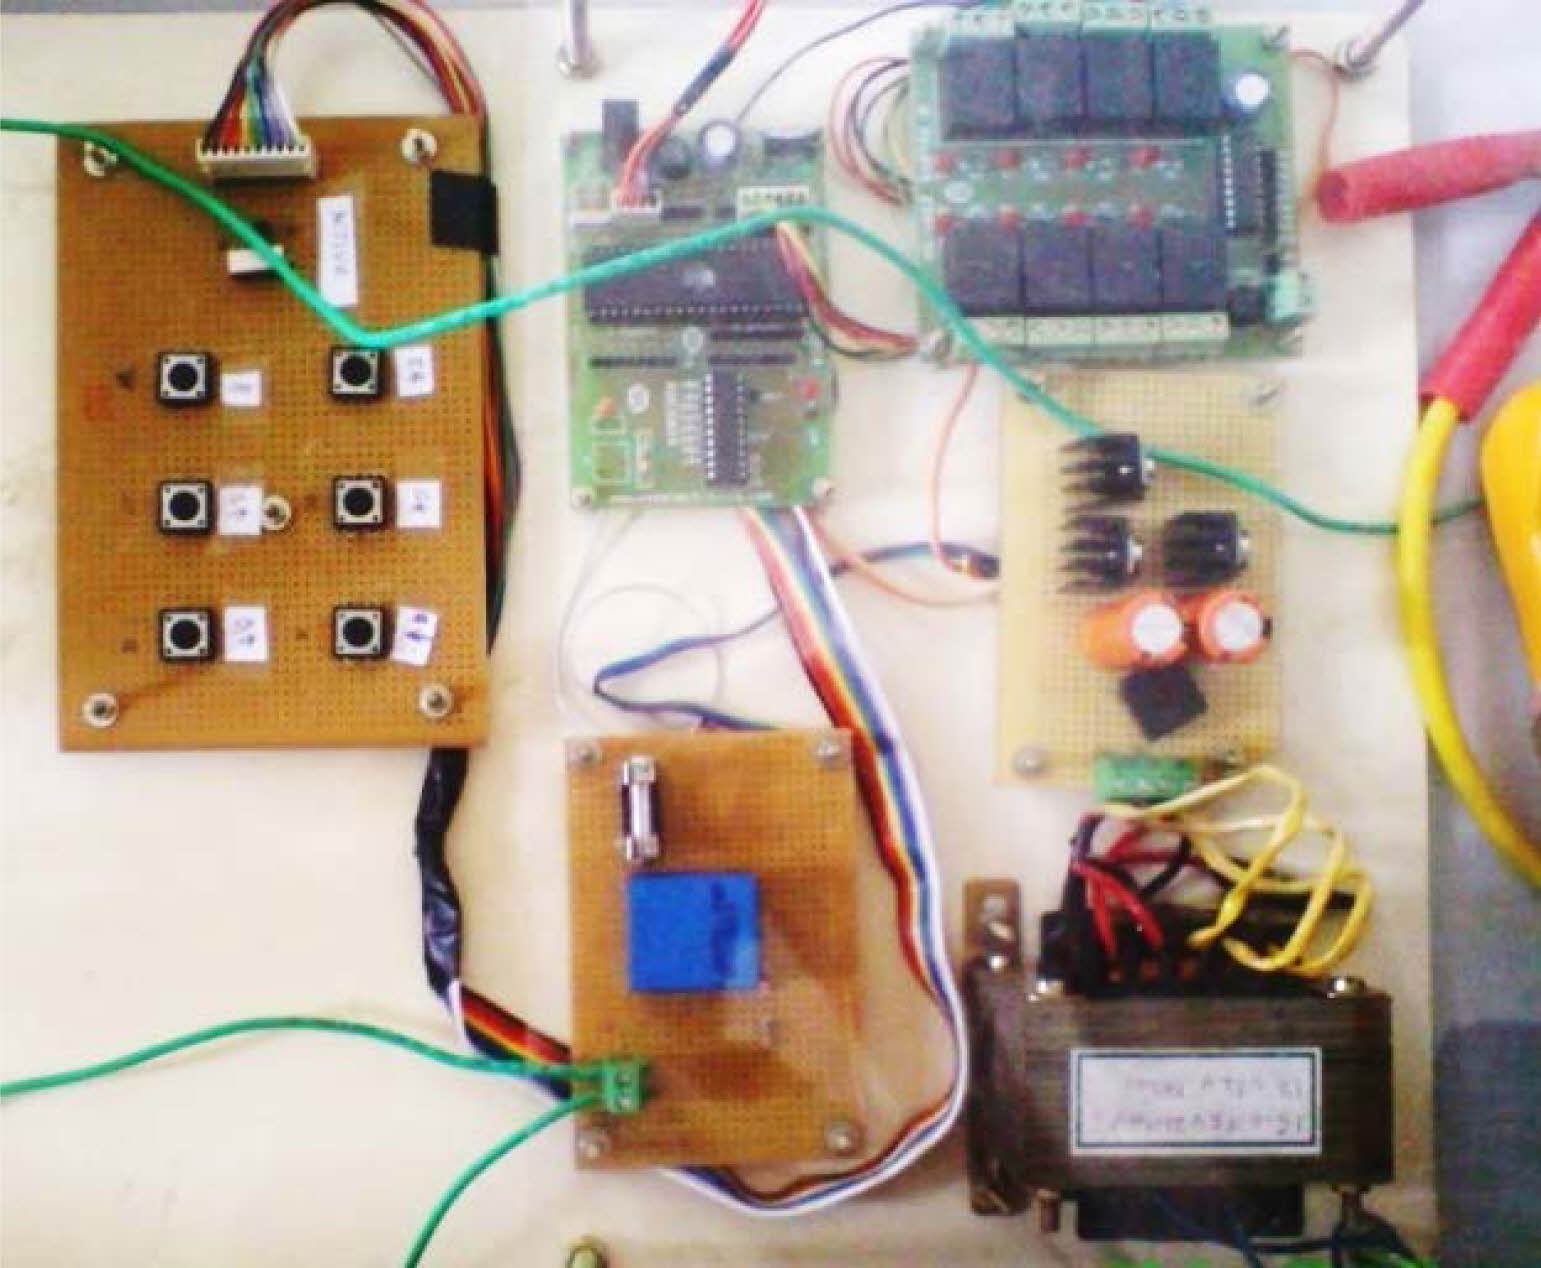
Control System
The signal applied amongst the cathode, and the anode Fig. 2 is detected using the electrical conduction technique of keeping gap separating applied between the tool electrodes. The workpiece may be seen using the electrical conduction technique of maintaining the electrode gap separation between the tool workpiece and the electrode. It monitors the current and verifies the tool electrode's capacitive coupling monitoring the current and verifying the capacitive coupling of the tool electrode with the work using an ammeter. The number of passes is counted and used to regulate the tool electrode feeding afterwards.
Electrolyte Flow System
The electrolyte is circulated at the working zone with moderate velocity pushes the removed material during machining with a capacity of 16-18 lit/min. The electrolyte is then filtered to eliminate any contaminants. A magnetic pump pumps the electrolyte solution across the cutting gap. The electrolyte travels through them at a set pressure without changing the tool or workpiece location. The removed substance is dissolved in the electrolyte. Then, the polluted electrolyte is purified using a filter of 5 Micron cartridges and re-circulates to the chamber with dimensions of 190 × 130 ×135 mm, holding a liters capacity.
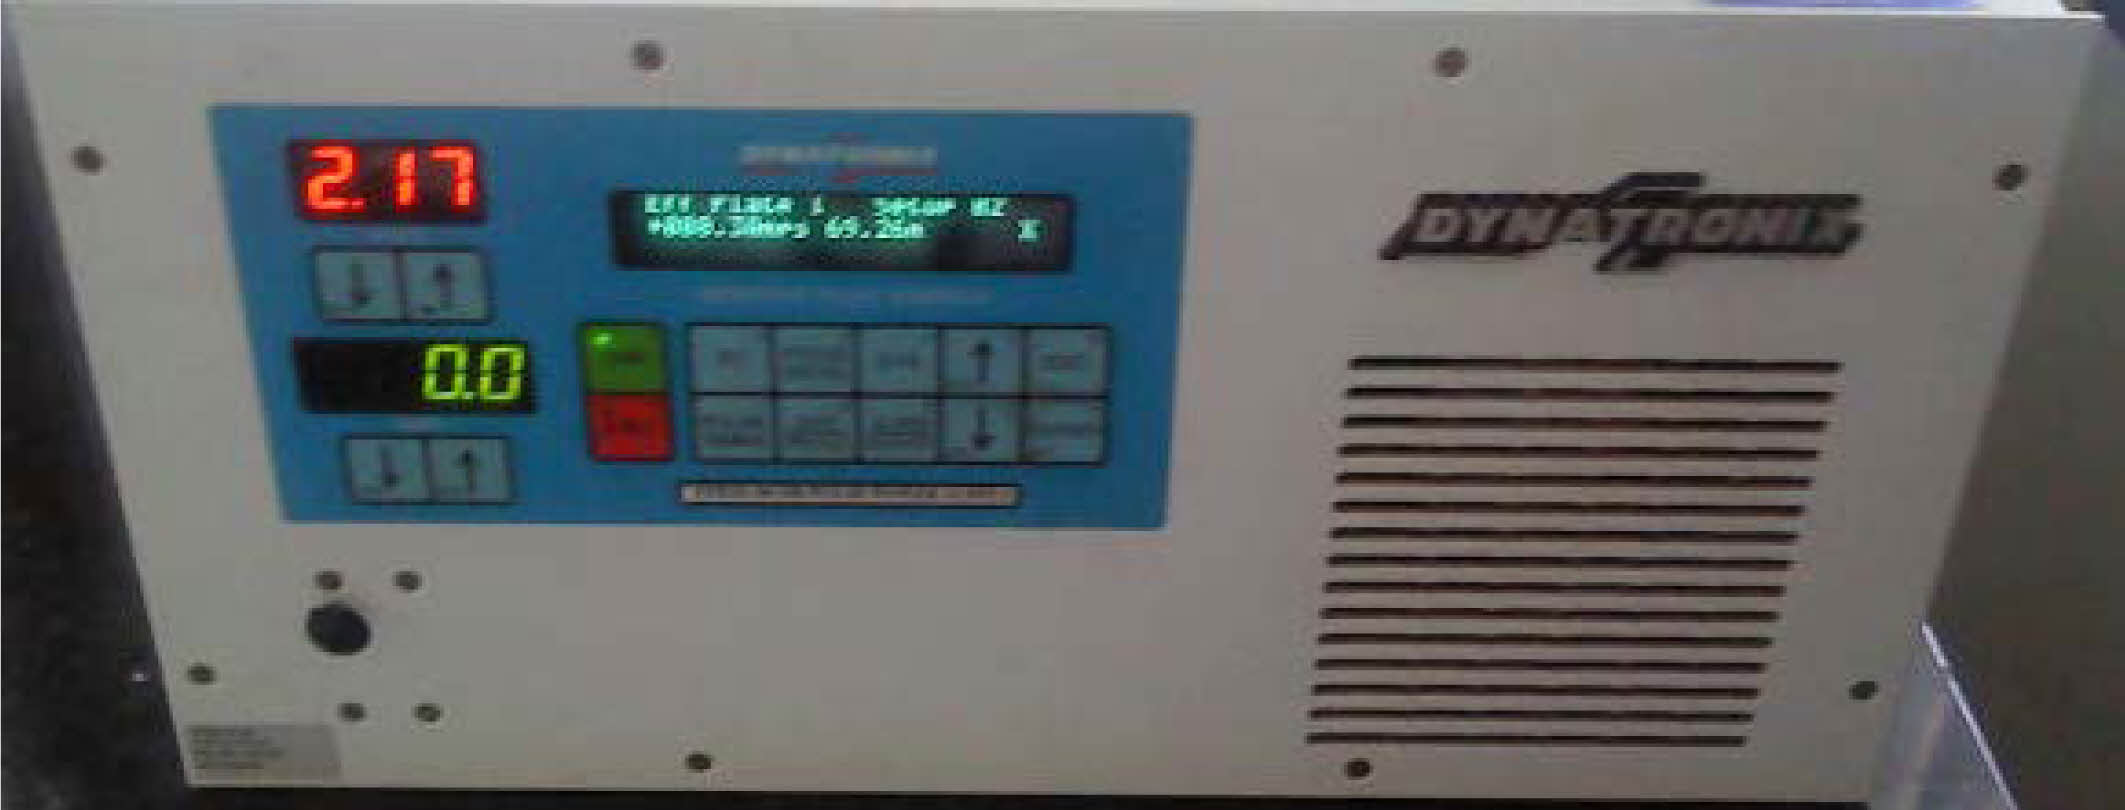
Power Supply System
The EMM power supply has a voltage range of 0-20 V and a current rating of 30A average and 100A peak. A step-down transformer and a silicon-controlled rectifier (Dynatronix) unit convert Fig. 3 the 220 V, single-phase AC power supply from the main power line to low-voltage pulsed DC power. A DC pulsed power source created the required pulse power for the micromachining process. Applying direct current through an electrolyte solution causes a redox reaction, whereas applying alternating current only causes conduction.
Taguchi method
The Taguchi method designs the experiments with 19 runs with three parameters used to measure two responses. The Taguchi approach entails decreasing variance in a process through robust experiment design. The method's overall goal is to supply a high-quality product cheaply to the maker. Taguchi created a strategy for designing experiments to study how distinct factors impact the mean and variation of a process performance characteristic that indicates how well the process works. As the factorial design does, the Taguchi approach evaluates pairs of possibilities rather than all potential combinations. This enables collecting the required data to show which factors impact product quality.
Design of Experiments
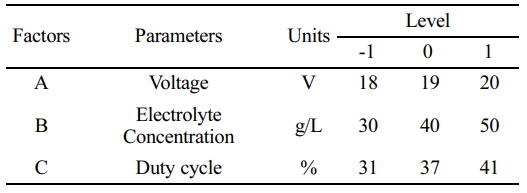
The relational method of RSM and Taguchi [15] are combined in the parametric investigation. In this instance, the control variables employed are voltage, duty cycle, and Electrolyte concentration. Table 1 brings up the detailed parameter crossed over with others to obtain the necessary combinations for experimentation. The workpiece and tool must be in contact in this situation, making it challenging to regulate the melt zone. It is evident that when the applied current increases, the diameter and dissolution rate grow. This is mainly because the electrode spacing and electrolytic current are considered, and the by products are removed with the electrolyte, which affects the tool diameter.
MRR Trend
The material elimination charge (MRR) measures how much raw cloth is eliminated simultaneously as machining. The critical issue of ECM is its impact on the substance’s disintegration rate. MRR has a nonlinear growing tendency due to TON fluctuations and the inter gap of electrodes (IEG), which is not constant with Faraday's electrolysis. The dissolution performance drops with lower voltages and TON stages discussed in equation (1).
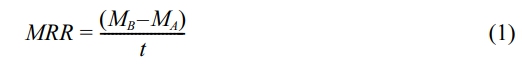
Where, MB is the previous weight of the workpiece,
MA is the weight after machining, and t is the machining duration.
The passage of electric current influences the corrosion rate of the workpiece. It grows in a straight line with the current. This effect is caused by the high current flowing in the gap between the tool and workpiece.
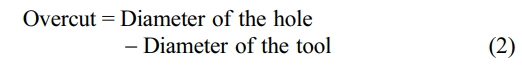
Overcut trend
The results of the Overcut phenomenon, which is a material eliminated during the electrolysis procedure, remove material inside and around the electrode using a non-contact chemical process. This causes an increase in the micropore diameter, known as an overcut, which raises the current in TON and lowers the value. TOFF grows with tool diameter as speed decreases, causing the hole diameter to converge in equation (2).
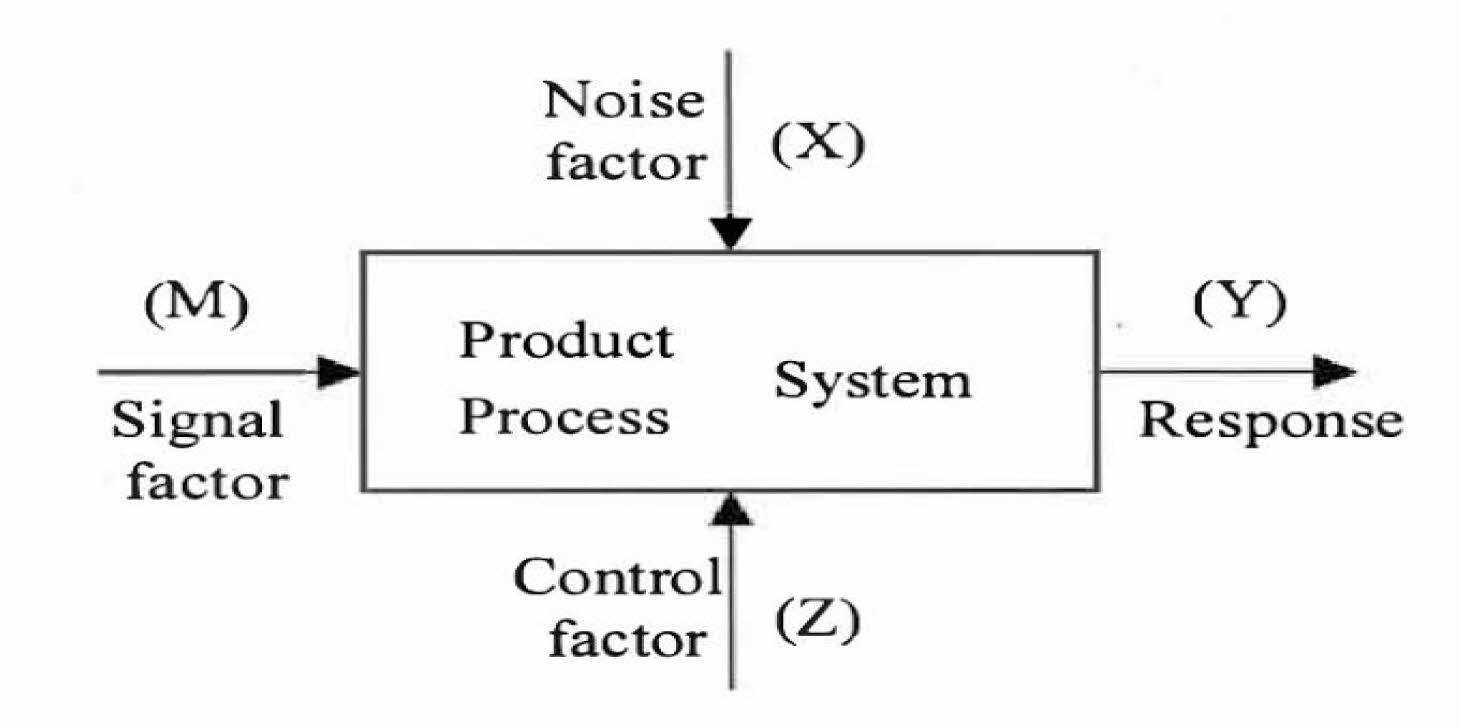
Numerous control factors influence (Z) the different trends, which becomes the response (Y) shown in Fig. 4.
Tool Material
ECM tool material should be electrically, thermally conductive, and corrosion resistant. We used copper (CW004A or ASTM C11040) as an electrode (cathode) in this experiment because of its good conductivity of electricity and uniform current density Table 2. Because the erosion process outward from the electrode always generates a cavity more prominent than the electrode, the electrode is frequently smaller than the intended cavity. The electrode produces a cavity larger than the electrode and must be confined to get the appropriate hole dimension.
Workpiece
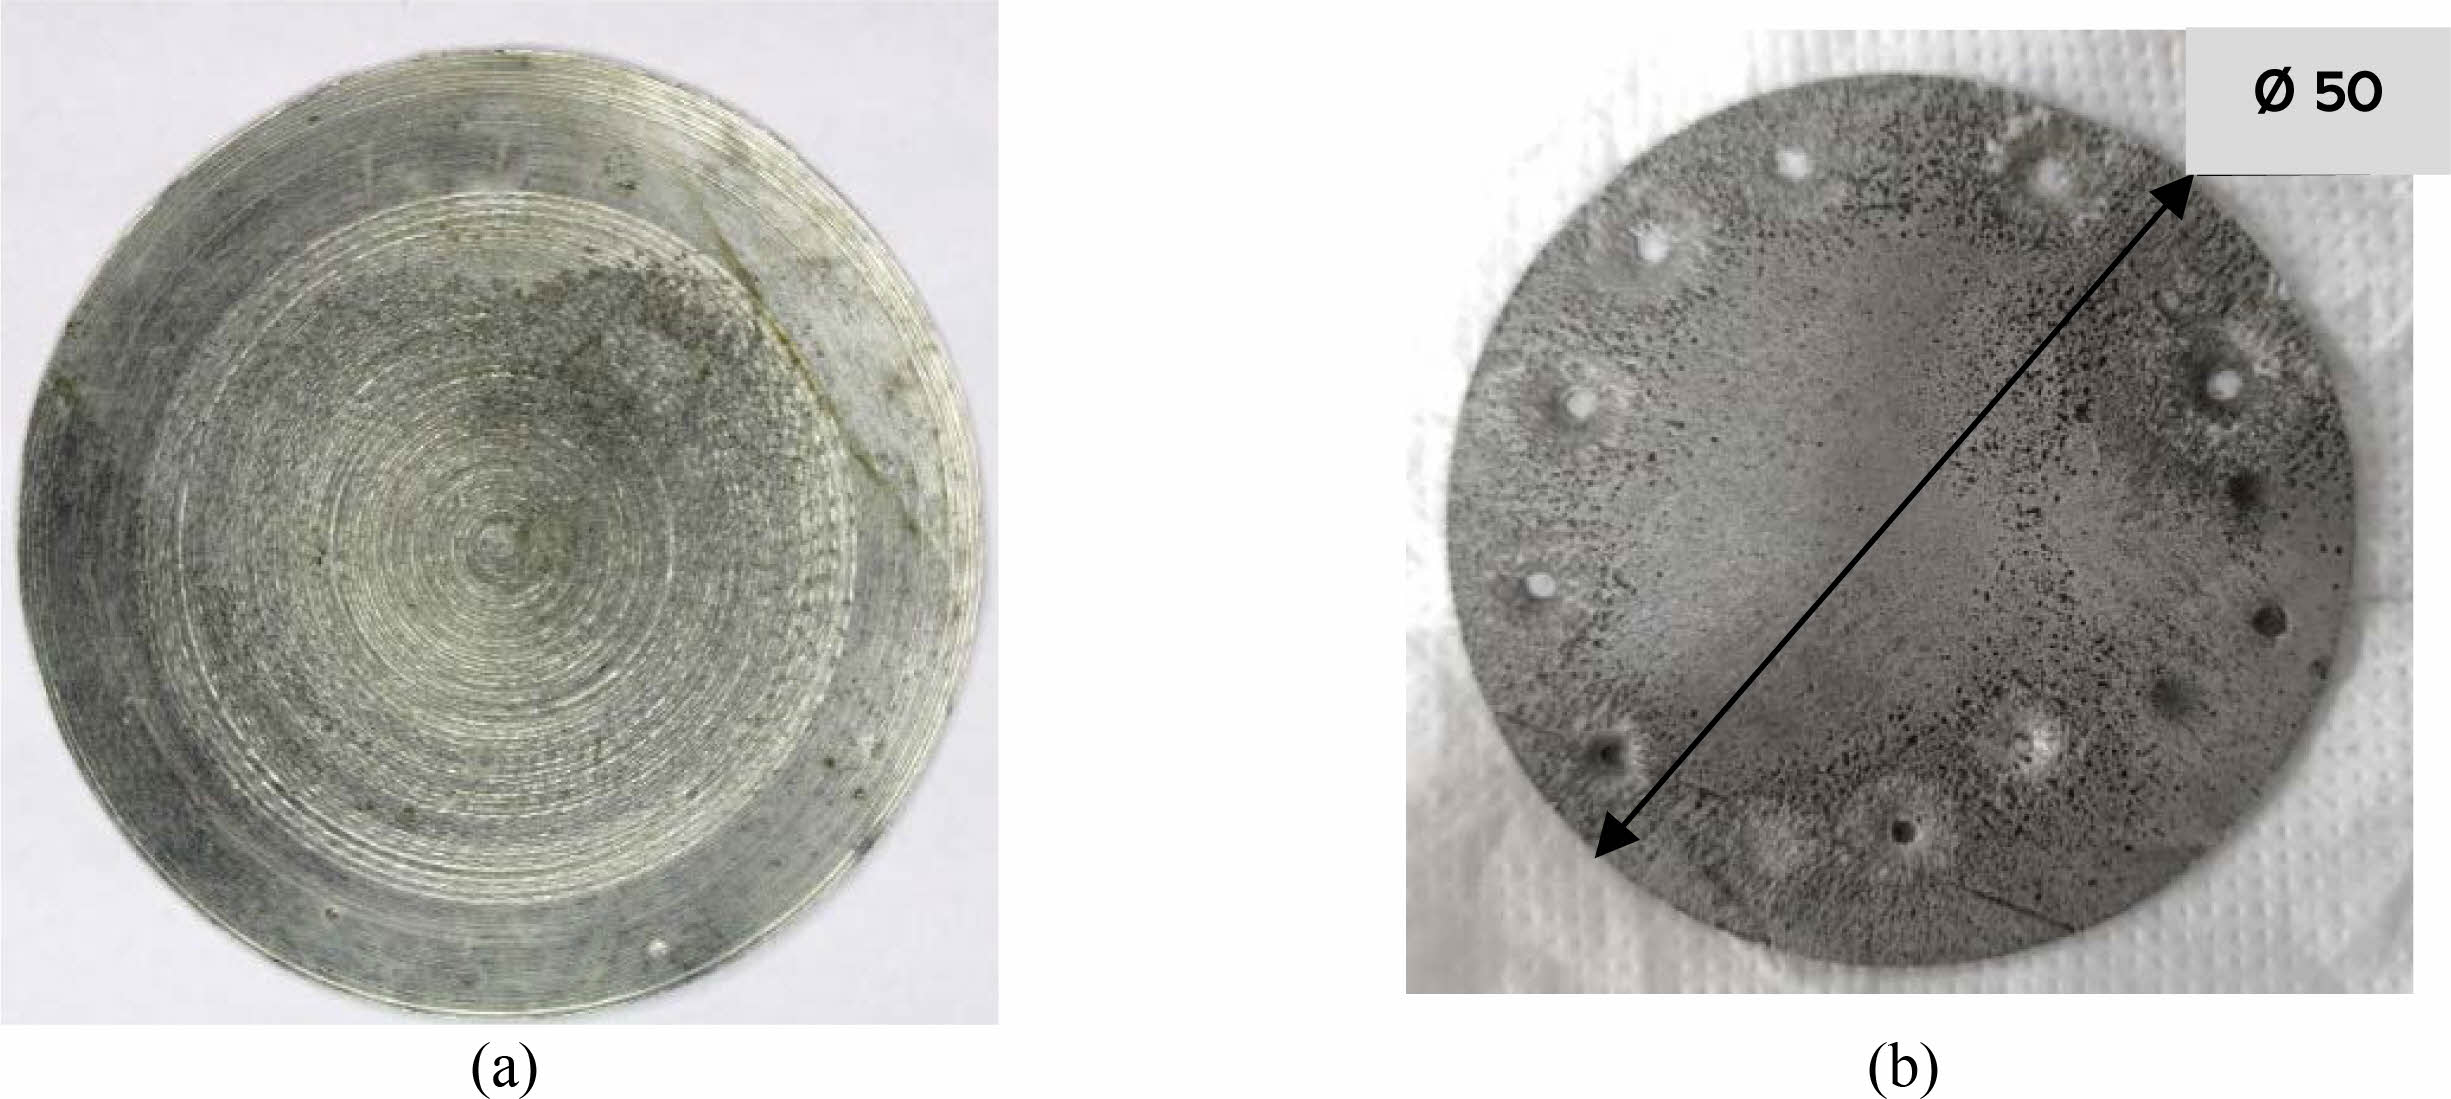
During electrochemical machining, the tool electrode and the workpiece are submerged in a conductive electrolyte. A continuous voltage is provided between two electrodes, with the workpiece Fig. 5 acting as the anode (positive electrode);
The workpiece must be an electrical conductor, it is nearly exclusively confined to metal. It is an austenitic chromium-nickel stainless steel resistant to corrosion Table 3 its low carbon concentration, less prone to carbide precipitation. The workpiece is 1 mm thick and 50 mm in diameter with a melting range of 2500 °F, a specific heat of 0.5 kJ/kg*K, Magnetic permeability ≤ 1.02 Oersteds, and Electric resistivity of 74 microhm-cm.
Applied potential causes a direct current (DC) to flow between the electrodes, causing the anode material to dissolve. An anode workpiece manufactured of SS316L is employed in this experiment Table 4.
Preparation of Brine solution
Preparing brine solution in the ECM process significantly impacts the material removal rate. Brine solution combined sodium chloride with distilled water to create a homogenous liquid. The solvent can dissolve solute in the tank using a stirring system; out of 16 runs trials, the concentration was taken as 30 gm/lit, 40 gm/lit, and 50 gm/lit.
The Design summary of the study type for achieving the optimized parameter Voltage (A), Electrolyte concentration (B), and Duty cycle (C) through Response surface methodology contains 16 Runs through which 2-factor interaction (AB, BC, & CA) terms sequential sum of squares polynomial (2FI) design model is adapted to reach the responses Material Removal rate (Y1) and Overcut (Y2). A small p-value indicates that adding interaction terms has improved the model in Table 5.
|
Fig. 1 Machining setup of micro-ECM. |
|
Fig. 2 Control System |
|
Fig. 3 Pulse Rectifier |
|
Fig. 4 Parameter diagram of the process. |
|
Fig. 5 Workpiece [Anode] (a) Before machining, (b) After machining. |


In quality engineering, the property’s higher values reflect superior machining performance, referred to as "Higher is Better." By analysing the minimal variance, the S/N ratio (signal to noise) might be an appropriate representation for determining the relevant parameter. The equation for calculating the S/N ratio is presented in equation (3).
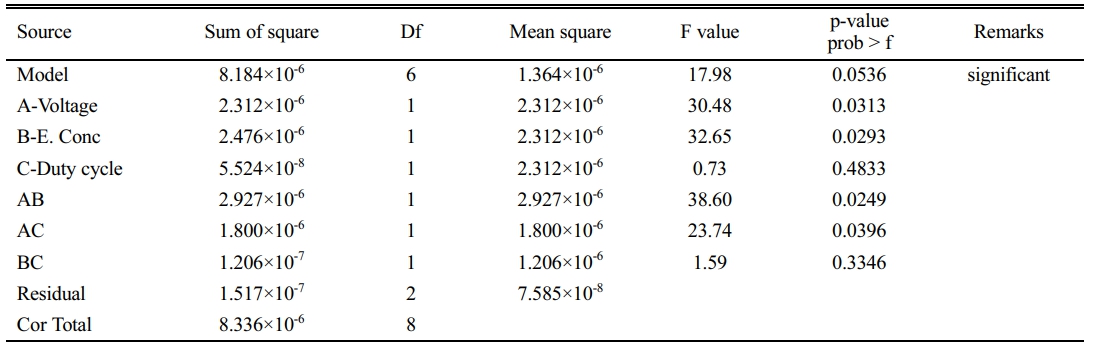
By applying these equations, S/N ratio of machining performance for each experiment can be calculated Table 6. As part of the Material removal analysis, the Fit Summary collects important information that will be utilized to determine the best starting point for the finished model. The model(s) implies Mean and sequential sums of squares for two-factor interactions with P-values less than 0.03, a statistical measure in a regression model that determines the proportion of variance R-Squared and adjusted R-Squared value is 95%.
The Model F-value of 0.05362 indicates that the model is statistically significant. A "Model F-value" of this magnitude is only 3.82% likely to arise due to noise. Values of "Prob > F" less than 0.0500 suggest that model terms are significant. In this scenario, R-Squared 0.9871, Mean 144.78, Adj R-Squared 0.9484, and C.V.% 5.03 are relevant to model terms. A ratio larger than four is preferred, whereas 14.340 indicates a sufficient signal, and the Final equation in Terms of Coded Factors is produced for MRR as equation (4).

The lower the value, the better the editing performance, as overcutting is called "lower is better." The signal-to-noise ratio (S/N) can effectively represent an essential parameter by evaluating the minimum variance in equation (5). The formula for calculating the S/N ratio is “lower is better” Table 7.

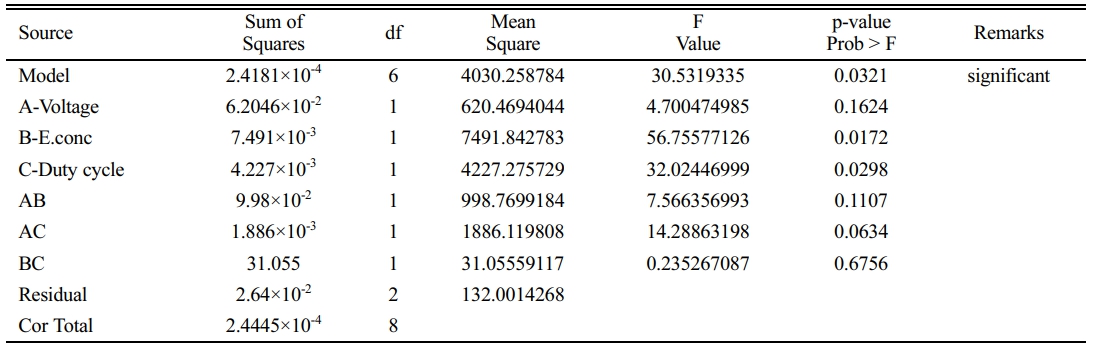
The model(s) suggests Mean sum of squares and Sequential sum of squares for the 2-factor interaction in which the P-value is in the acceptable range below 0.05, a statistical measure in a regression model that determines the proportion of variance R-Squared and adjusted R-Squared value is 99%.
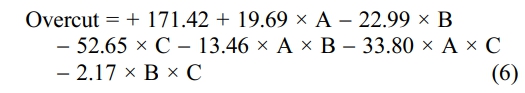
The model has an F-value of 0.03021, indicating that it is significant. A "Model F-value" of this magnitude is only 3.21% likely to arise due to noise. Model terms are important when "Prob > F" is less than 0.0500. B and C are crucial model terms in this situation. Model reduction may enhance your model if there are numerous inconsequential model terms (not including those necessary to support hierarchy). Standard Deviation 11.49, R-Squared 0.9892, Mean 144.78, Adj R-Squared 0.9568, and CV% 7.94 "Adeq Precision" assesses the signal-to-noise ratio. A ratio larger than 4 is preferred, whereas 17.776 gives an appropriate signal. Overcut equation by Coded Factors shown in equation (6).
A system’s performance can be enhanced using optimization techniques that modify its parameters. Optimization [16, 17] ranges from small-scale applications like circuit development and machine coding to highest-level applications like algorithm design. Optimization must be carried out until the end of the process to avoid errors due to premature computing. RSM investigates the links between several explanatory factors and one or more response variables. The approach was invented in 1951 by George E. P. Box and K. B. Wilson. The primary principle behind RSM is to employ a series of prepared tests to find an optimal answer. To do this, Box and Wilson propose utilizing a second-degree polynomial model. They recognize that this model is an approximation, but they utilise it because it is simple to predict and implement, even little is established.
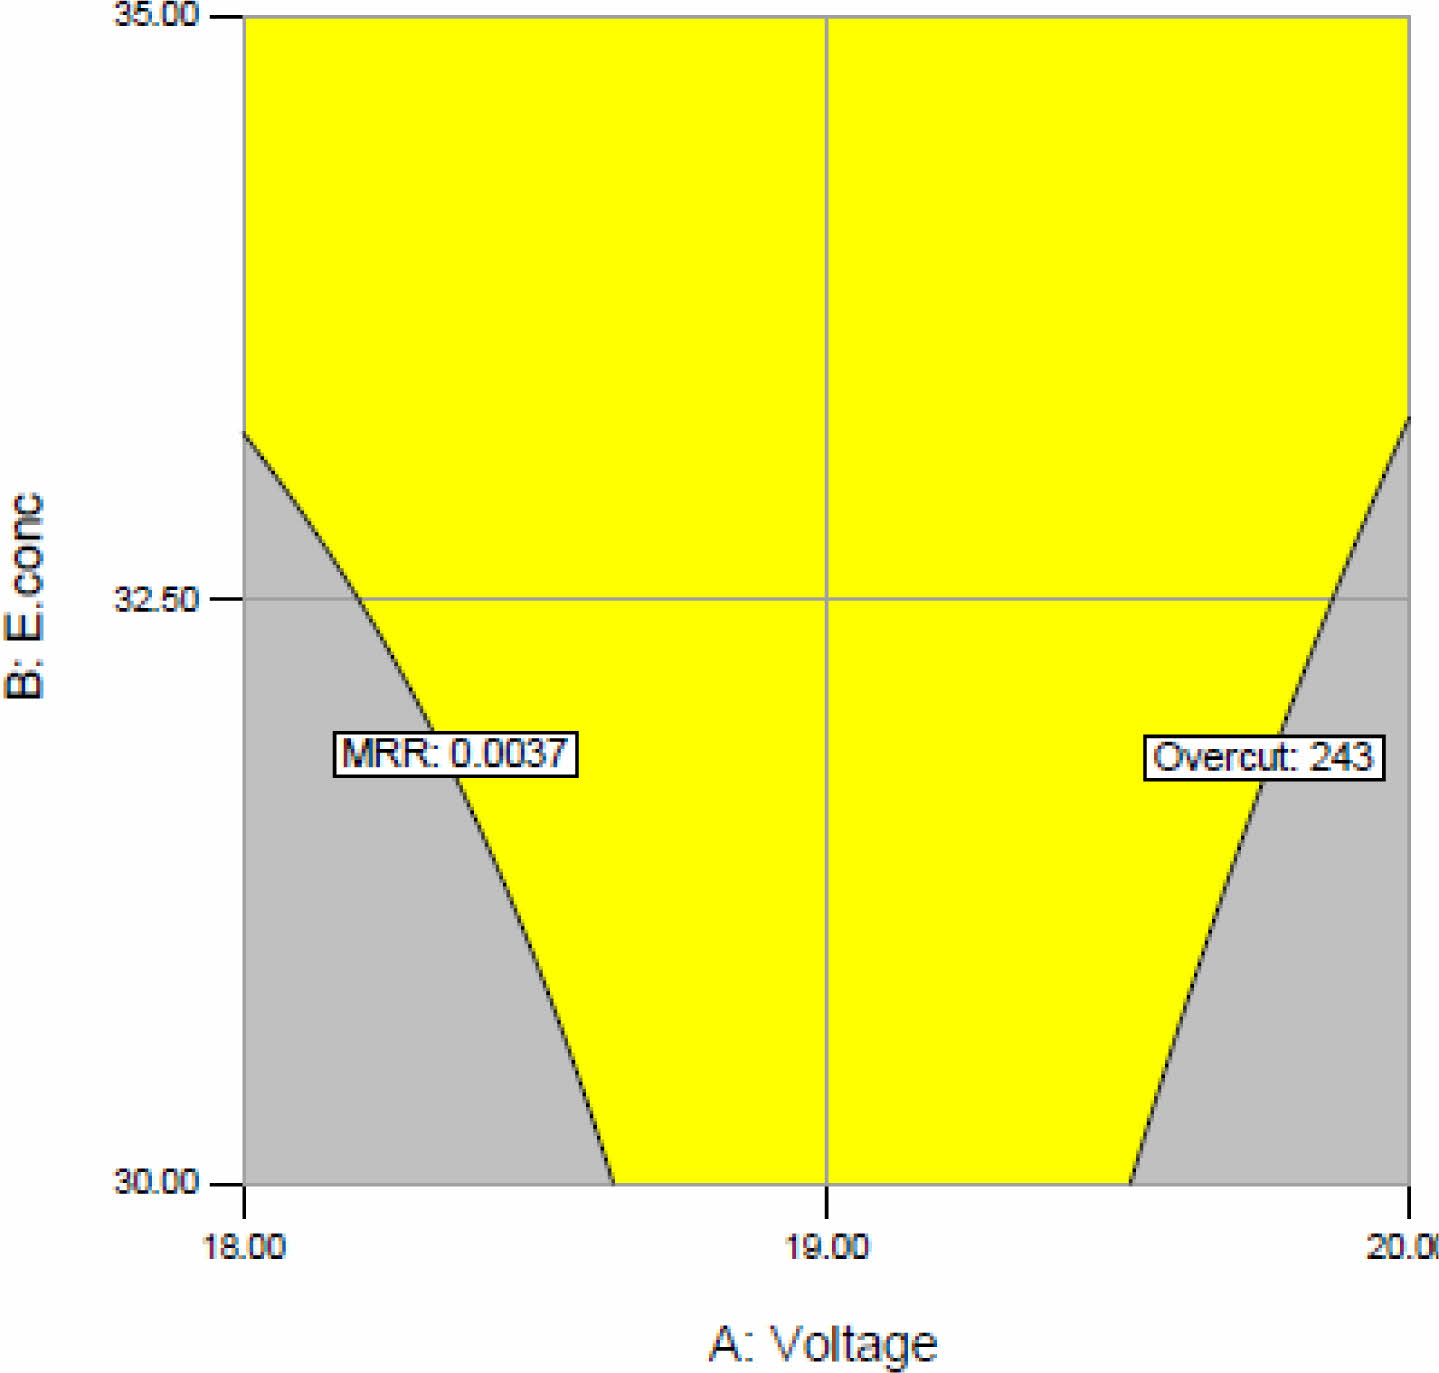
Determination of the optimum condition of machining parameters in the electrochemical process. Based on the RSM technique and desirability function, optimized conditions for machining efficiency for MRR (maximize) 0.0037 < x < 0.0069 and overcut (minimize) 68 < y < 243 are predicted based on the desirability function of 0.95, based on the predicted model of optimum conditions experiments are conducted for confirmation of desirability function, and the results are affirmative. Through RSM tool 16 solutions were found for optimum machining among these, the highest desirability number for MRR and overcut was 0.951. Setting minimum or maximum limits for each response to create an overlay to highlight the area of machining operability. By overlay plot MRR and overcut are predicted with factor duty cycle 41%, and a graph is plotted for voltage and electrolyte concentration shown in Fig. 6, which also suggests a similar value found in the numerical method.
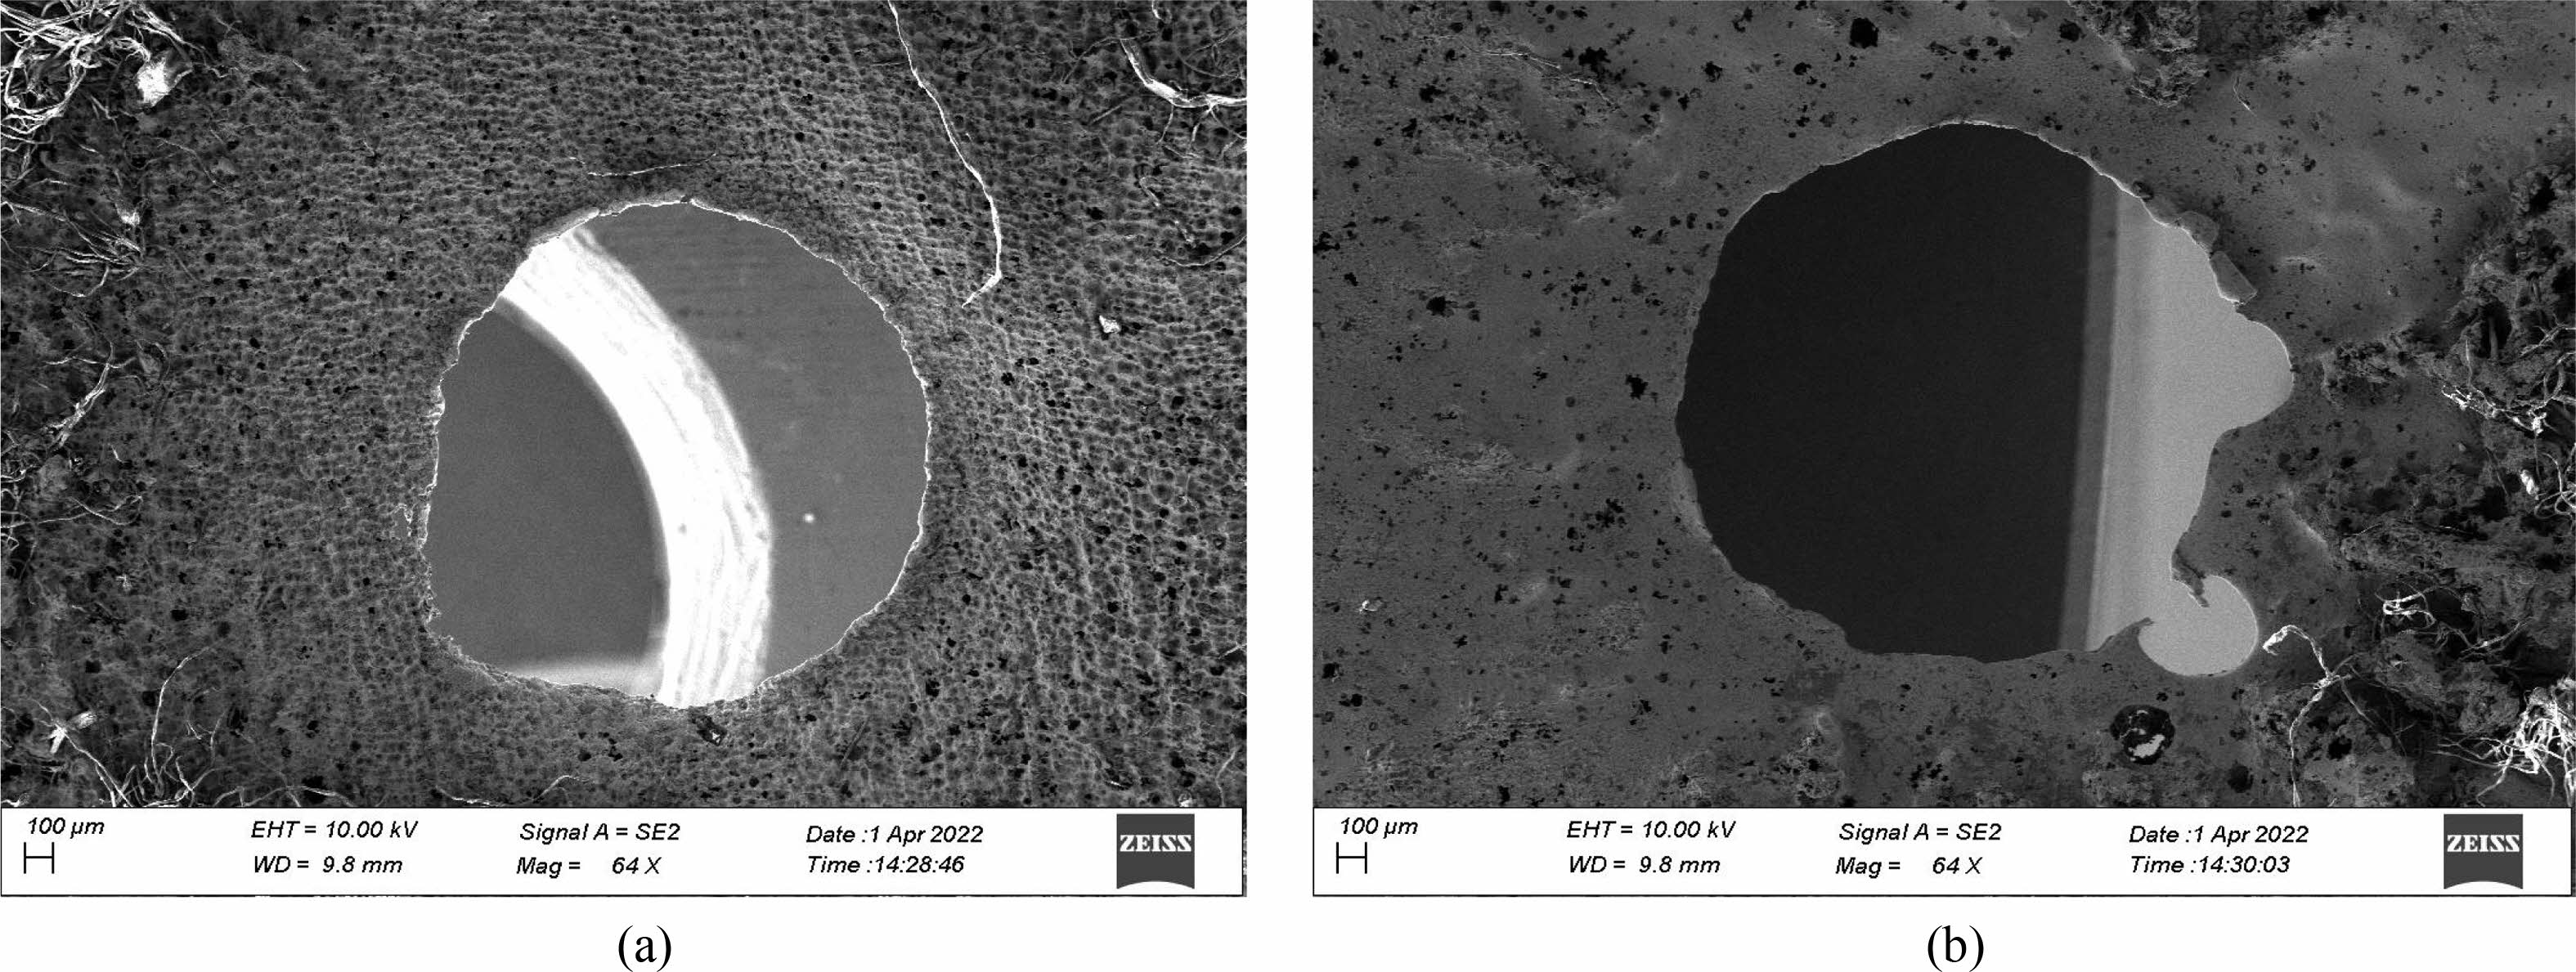
Fig. 7(a) and 7(b) shows SEM microscopic image [17] of two holes processed on stainless steel of 300 µm thick, using a 358µ diameter stainless steel tool for the parametric condition. i.e., 19 V, 60 Hz frequency, 50 g/L of electrolyte concentration [18, 19].
The parameters such as voltage of 19 V, Frequency 60 Hz and electrolyte concentration of 50 gm/lit has been used to machine hole shown above. Fig. 8(a). the SEM micrograph of two holes machined on a stainless steel of 300 µm thick, using a 358 µm diameter stainless steel tool for the parametric condition. i.e., 20 V, 50 Hz frequency, 40 g/L of electrolyte concentration. The parameters such as voltage of 20 V, Frequency 50 Hz and electrolyte concentration of 40 g/L has been used to machine hole shown below.
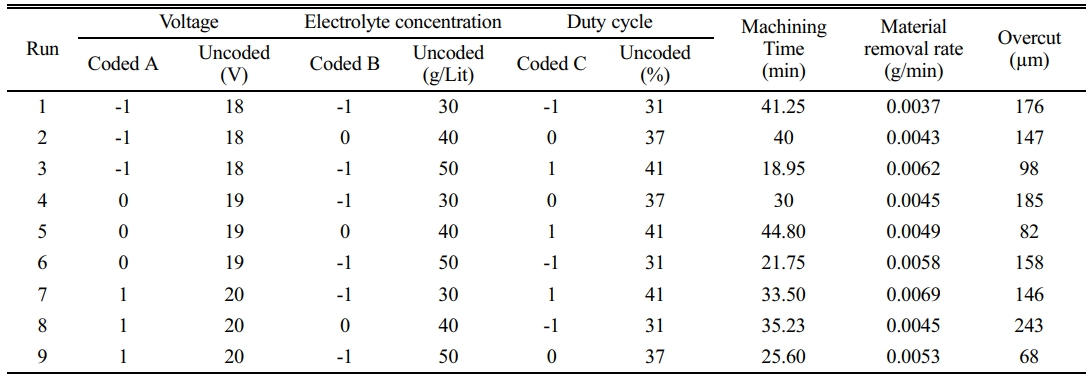
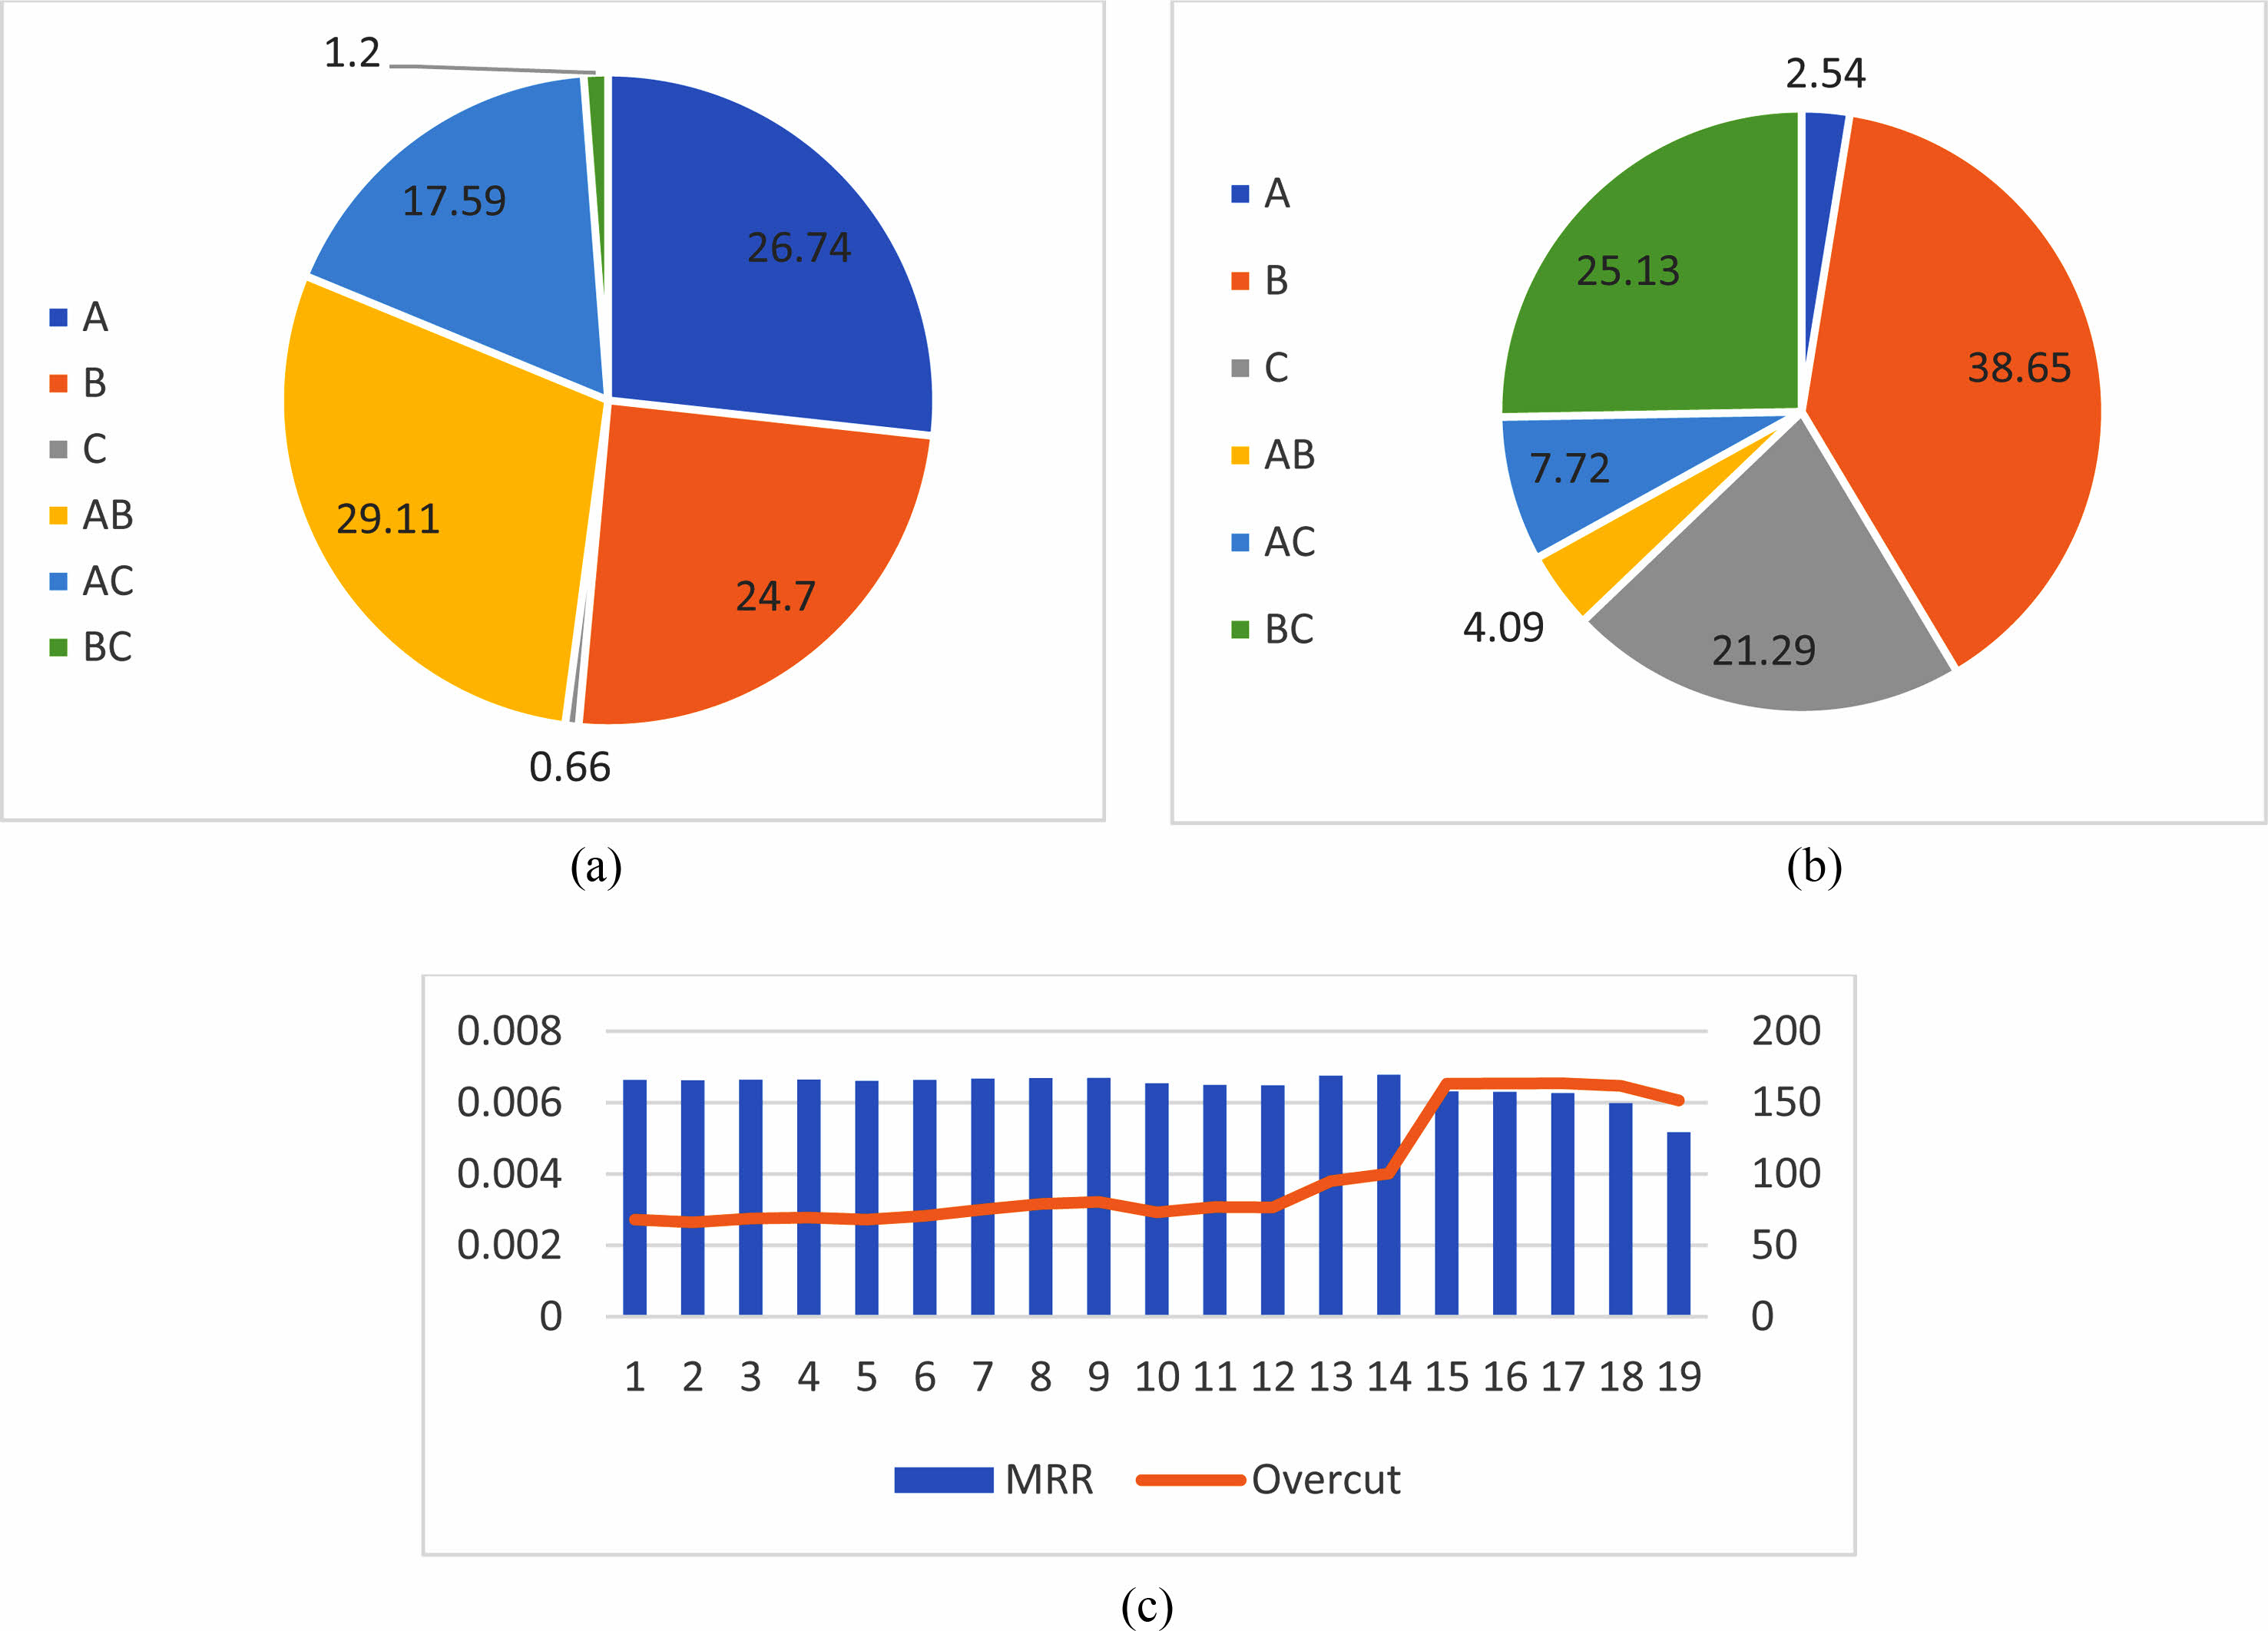
Based on the percentage contribution it is evident the factors A and B had influence on MRR Fig. 8(a) while Factors B and C had most influence on Overcut Fig. 8(b). By various trials conducted run 13 and 14 shows MRR above 0.006 g/min Fig. 8(c). From the machining parameters, it is achieved that with 20 V, 40 g/L, and 41% Duty cycle maximum MRR could be obtained. Based on the Prediction, 0.0066 g/min MRR, and 67.9999 µm overcut are obtained.
|
Fig. 6 Overlay graph of MRR and overcut with C: Duty cycle 34%. |
|
Fig. 7 (a) SEM micrograph of the hole (19 V, 50 g/L, 31%, 0.0058 g/min, 158 µm overcut). (b) SEM micrograph of the hole (20 V, 40 g/L, 31%, 0.0045 g/min, 243 µm overcut). |
|
Fig. 8 (a) Percentage contribution on MRR. (b) Percentage contribution on Overcut. (c) Response on various Runs |
Experiments were performed according to the Taguchi method using operation settings. Various experiments were performed by varying the control parameters such as electrolyte concentration, voltage, and duty cycle, and the workpiece weight and hole dimension measurements were used to calculate the MRR and overcut. Computed analysis of variance, the percentage contributions of the machining parameters for obtaining maximum MRR and Overcut were found. It is expected that the remaining percentage contributions are made by other factors such as electrolyte flow rate, type of electrode tool, tool feed rate, inter electrode gap.
The factor voltage (A) shows the intensifying trend for the material removal, but the electrolyte concentration (B) and voltage show even-increasing contribution towards material removal. The duty cycle (C) has less impact, while on the cross over with voltage shows improved contribution on material removal rate.
The factor Electrolyte concentration (B) shows the deepening trend for the overcut, second Duty cycle (C) shows contribution towards overcut. The observation voltage (A) has a reduced amount of effect over overcut.
As optimal condition to achieve maximum MRR and minimum Overcut 20 V, 40 g/L, and 41% Duty cycle is obtained through RSM.
Comparing the SEM micrographs, it is evident the overcut has been considerably reduced by the chosen electrolyte which may be appropriate for machining.
Authors would like to thank the Department of Mechanical Engineering, Sona college of Technology, Anna University, Salem, for facilitating the resources.
- 1. M.K. Külekcý, Mater Technol. 47[1] (2013) 105-109.
- 2. R. Santhanakrishnana, V.S. Thangarasu, R. Aravind and V. Ramachandiran, J. Ceram. Process. Res. 24[1] (2023) 174-181.
-

- 3. M.V.A. Ramakrishna and S.V. Rao, Mater Today: Proc. 46[2] (2021) 934-939.
-
- 4. H. Hocheng, Y.H. Sun, S.C. Lin, and P.S. Kao, J .Mater. Proc. Tech. 140[1] (2003) 264-268.
-
- 5. M. Tajdari and S. Chavoshi, Cent. Eur. J. Eng. 3[3] (2013) 466-474.
-
- 6. S. Ayyappan and K. Sivakumar, Int. J. Adv. Manuf. Technol. 82[9] (2016) 2053-2064.
-
- 7. J.R. Gamage and A.K.M. DeSilva, Procedia CIRP. 26 (2015) 385-390.
-
- 8. G.S. Prayogo and N. Lusi, IOP Conf. Ser.: Mater. Sci. Eng. 494 (2019) 012055.
-
- 9. Y. Zhang, N. Qu, X. Fang, and X. Wang, J. Manuf. Process. 37 (2019) 488-495.
-
- 10. N. Rajan, R. Thanigaivelan, and K.G. Muthurajan, J. New Mater. Electrochem. 21[4] (2018) 239-242.
-
- 11. A. Jerin and K. Karunakaran, Mater Today Proc. 81[2] (2023) 443-448.
-
- 12. S. Hinduja and M. Kunieda, CIRP Annals. 62[2] (2013) 775-797.
-
- 13. M.K. Das, K. Kumar, T.Kr. Barman and P. Sahoo, Procedia Mater Sci. 6 (2014) 741-751.
-
- 14. B. Bhattacharyya, J. Munda and J. Mater Process Technol. 140 (2003) 287-291.
-
- 15. K.M. Senthilkumar, A. Sivakumar, Shivajic. Rohokale Milind, S.K. Tamangd, and M. Giriraj, J. Ceram. Process. Res. 23[2] (2022) 233-236.
-
- 16. S. Rajaa, K. Vignesh, M. Ravikumar, and R. Sanjeevi, J. Ceram. Process. Res. 24[1] (2023) 153-157.
-
- 17. N. Ravikumara, R. Vijayanb, and R. Viswanathan, J. Ceram. Process. Res. 24[1] (2023) 142-152.
-
- 18. P. Singh, A. Pramanik, A.K. Basak, C. Prakash, and V. Mishra, Int. J. Adv. Manuf. Technol. 106 (2020) 2133-2166.
-
- 19. R. Thirumalai, S. Karthick, and M. Giriraj, J. Ceram. Process. Res. 23[2] (2022) 221-227.
-
 This Article
-
2023; 24(4): 705-713
Published on Aug 31, 2023
- 10.36410/jcpr.2023.24.4.705
- Received on May 11, 2023
- Revised on Jul 1, 2023
- Accepted on Jul 6, 2023
Services
- Abstract
introduction
experimental procedures
results and discussion
conclusion
- Acknowledgements
- References
- Full Text PDF
Shared
Correspondence to
- Sudharsan Gunasekaran
-
Asst. Professor, Mechatronics Engineering, Sona College of Technology, Salem, India
Tel : +91 9363308848 - E-mail: sansudhar@hotmail.com
Clean-Energy Research Institute(CRI), Hanyang University, 222, Wangsimni-ro, Seongdong-gu, Seoul, 04763, Korea
E-mail: jcpr@hanyang.ac.kr