


- Safety, health and environmental (SHE) risk assessment and strategies to create a sustainable safety culture in ceramic and HVAC industries
Sunil Arjun Bhaleraoa, D. Senthilkumara,* and Narendren Nairb
aDepartment of Mechanical Engineering, Sona College of Technology, Salem, Tamilnadu, India
bVoltas Ltd, Mumbai, IndiaThis article is an open access article distributed under the terms of the Creative Commons Attribution Non-Commercial License (http://creativecommons.org/licenses/by-nc/4.0) which permits unrestricted non-commercial use, distribution, and reproduction in any medium, provided the original work is properly cited.
This article incorporates the various diversified challenges faced by industries which results in major incidents. These incidents impact the performance and brand image of the organization in the competitive market. To understand the challenges one of Asia’s biggest ceramic industry has been selected, existing safety culture was analysed and based on that a 3 phase action plan was devised to bring cultural shift. First phase consisted of immediate action plan to bring the current situation under control, the second phase was intermediate action plan to establish the safety management systems and the third phase was a long term action plan to implement the cultural tools and sustain them. With this a practical approach to resolve safety, health and environment (SHE) challenges helped the organization to change the culture which resulted in improvement of major parameters like training man-hours, reporting & closure of observations, reporting of Near Miss and Audits. It also helped in reduction of lagging parameters like LTIs, LTIFR and AIFR
Keywords: Health and environment, Risk assessment, Safety, Safety culture, Safety management, Sustainability
Consistent efforts in improvising the SHE culture have been taken on agenda by the diversified industries and some industries who are dealing with diversified and significant risks. As a philosophy, “Safety is not an absence of risks or achieving zero incidents/accidents, but it’s a presence of capabilities in an organization”. In a case study, a general framework for management tasks and objectives of safety, health and environment (SHE) were integrated in the process industries of seven European Union member states [1]. However, no clear conclusions were found in an integrated system due to large diversified industries, as a challenge. Many such models were developed for integrated SHE management system [2-6], based on ISO 9001 for quality; ISO 14001 for environment; ISO 45001 for occupational health and safety. The interdependency and work environment complexity of various parts of the organization made the SHE management very complex and critical [7].
Heidari et al. [8] has performed an identification of risk assessment of the high-risk and hazardous sectors of petroleum industry. Identified proper long term strategies from the past accidents and implemented to reduce the accidents. From the study most important influential factors are management, human and hardware. The assessment showed 20 risk factors are crucial out of identified 60 factors. Hoivik et al. [9] has studied the SHE culture insight in Norwegian Petroleum Company. The understanding of SHE culture challenges were perceived differently by employees with and without leadership because of behavior, competence, collaboration, procedures and the physical environment. The organizational learning has an impact on the implementation of SHE regulation in petroleum industries. The organizational learning has been studied in two different petroleum industries using institutional theory virus metaphor and found different learning performance [10]. The difference in learning was mainly because of the difference in histories, complexity, organizational behavior and strategy between the industries. Gintautas et al. [11] applied analytic hierarchy process methodology to assess the safety risk involved in railway based infrastructures. Further Oz et al. [12] proposed certain safety related perspectives for operating power supply units in railway industry. Briz and Grunt [13] applied quantitative risk assessment method for investigating the root cause of accidental events in process industries. Specific attention was given with regards to fire hazard initiated by leaks.
The offshore wind industry is continuously emphasizing the importance of improving the SHE plans. The offshore wind industry is still struggling to develop a common SHE standard to accomplish the vision of zero accident [14]. The gaps in information sharing and accident reporting systems and blame culture are the cause for the lack of SHE management. Development of strong cooperation, coordination and communication among the stakeholders and knowledge sharing mechanisms are vital strategies for developing a common SHE management system. The SHE management implementation challenges in offshore wind industry have been studied by Albrechtsen [15]. In this study an overview of hazards, accidents and vulnerabilities were taken as the key parameter for analysis. Some of the organizational abilities for safe operation have been proposed and it ensures holistic safety management in a life cycle perspective. The SHE risk assessment for floating wind turbine in offshore was studied at various level of the project life cycle [16]. Dedicated techniques were used for health, safety and environment separately. Although many approaches have been developed for safe operation of offshore industries, the harsh environmental conditions, new types of challenges, and risks continue to emerge. These continuous emerging challenges are cause for accidents in offshore industries [17]. Liu et al. [18] studied the safety culture of aircraft thrusters, marine engine with thermal barrier coating and found the prolong service life of the coatings.
Active failures in construction field may lead to an accident; however, there are less visible failures on the organizational side. More latent weaknesses that should be given equal attention to prevent accidents and injuries. This study focuses the factors that are responsible for SHE knowledge transfer [19]. Project leaders and safety professionals serve as a responsible for all employees however the entire work force is responsible for safety. The construction SHE regulatory framework of Nigeria was studied [20] based on contextual domains. The main external context domains factors are dysfunctional and fragmented health and safety (H&S) regulatory environments. The factors like reactive culture and no follow-up culture are the indirect factors. From the study the external context domains were understood poorly. During early phases of project management in Norway construction the harmful factors to health and safety were identified. Main challenging aspects to health and safety in the early phases of construction projects are lack of competence, lack of prioritization, and lack of consequence. Suggestions were given to these educational institutions, construction clients and public authorities to play their respective role to improve the situation. Dang and He [21] studied the safety culture in glass – ceramic industry. The mechanical performance of the glass – ceramic is tested. Kalaiyarasan et al. [22] reported the impact of microplastic on environment in process industries.
The lack of an integrated assessment approach on SHE management of municipalities’ activities of megacities has been studied [23]. The existence of large number of SHE performance indicators for cities and countries gives difficulty for making comparison. Because of various limitation and complexity, there is a need of data synchronization to control number of the variables [24]. This made a better integration of decision making process. The complexity of the SHE performance indicators are reduced by Exploratory Factor Analysis method. Fewer than six SHE theme 62 indicators were studied in 20 factors and found that the best theme is health environment theme. To sustain business in today’s scenario SHE is a key aspect in which management commitments is more important and is also required to effectively develop more capabilities with respect to SHE in an organization. Management’s commitment should demonstrate visibly the implementation aspects of SHE action plans, it should be a visible demonstration of care for everyone who is working for and on behalf of an organization [25]. SHE management can be seen as business management or one of the key aspects of business excellence. Al-Mughanam and Tirth [26] has performed a quality assessment for nanofluids that make them for suitability to various industrial application.
Ceramic industries in INDIA started to develop in the mid of nineteenth century and the challenges at that time were different and diversified after the 1984 major incident of Bopal, India (MIC) in which about 1,00 000 of humans were affected. Post this incident the governing and monitoring authorities became stringent on SHE. After the Chernobyl accident (Reactor design flaws and human error) during the year 1986, many organizations started to give priority to SHE for sustainable business. After 1990’s with liberalization, globalization and Privatization companies in developing countries started focusing on SHE management to establish the SHE culture. Post year 2000, organizations started considering SHE as business value to sustain.
In light of this, the aim of this paper is to transform SHE culture from reactive to dependent, dependent to independent, independent to interdependent (Du Ponte Bradley Curve) by analyzing the challenges and prepare action plan or a strategy for one of the critical and diversified industry like ceramic industry, which is full of challenges. The prime objective of this research paper is to identify the major challenges in ceramic industries and propose practical approach and strategy for SHE cultural transformation for business sustainability.
Ceramicindustryis very diversified industry as it consists of manufacturing of room ACs, commercial ACs, installations of these units at customer places, its service maintenance and operations of the same by large number of technicians at customer locations. It also involves more of unskilled and semiskilled workers who work under contractors and sub-contractors. ceramicindustry is a seasonal industry, so during the peak time of summer there arises huge requirement of trained and experienced technicians and operators, which many a time difficult due to shortage of trained and experienced man power in this sector (Phigy, 2020). Considering the nature of activities ceramicindustry has so many workplace challenges and hazards which include the following:
Challenges
• Unskilled workforce- which is ever changing
• Equipment’s & materials availability & arrival –as most of the activities are in remote areas
• Space constrains & SIMOPS activities, as other contractors are also working in the limited space
• Operation & maintenance or service with old equipment’s
• Road safety as travel on daily basis for services and maintenance mostly on bikes
• Time frame for activity completion or FastTrack projects
• Hazards
• Fall of material or person
• Electrical
• Fire
• Chemical Releases
• Rotating Equipment’s
• Manual handling
• Lifting equipment’s
• Hazards in manufacturing units
• Hazards in Services, operation and maintenance and retrofit work
• Hazards at Installation of equipment’s at customer project sites
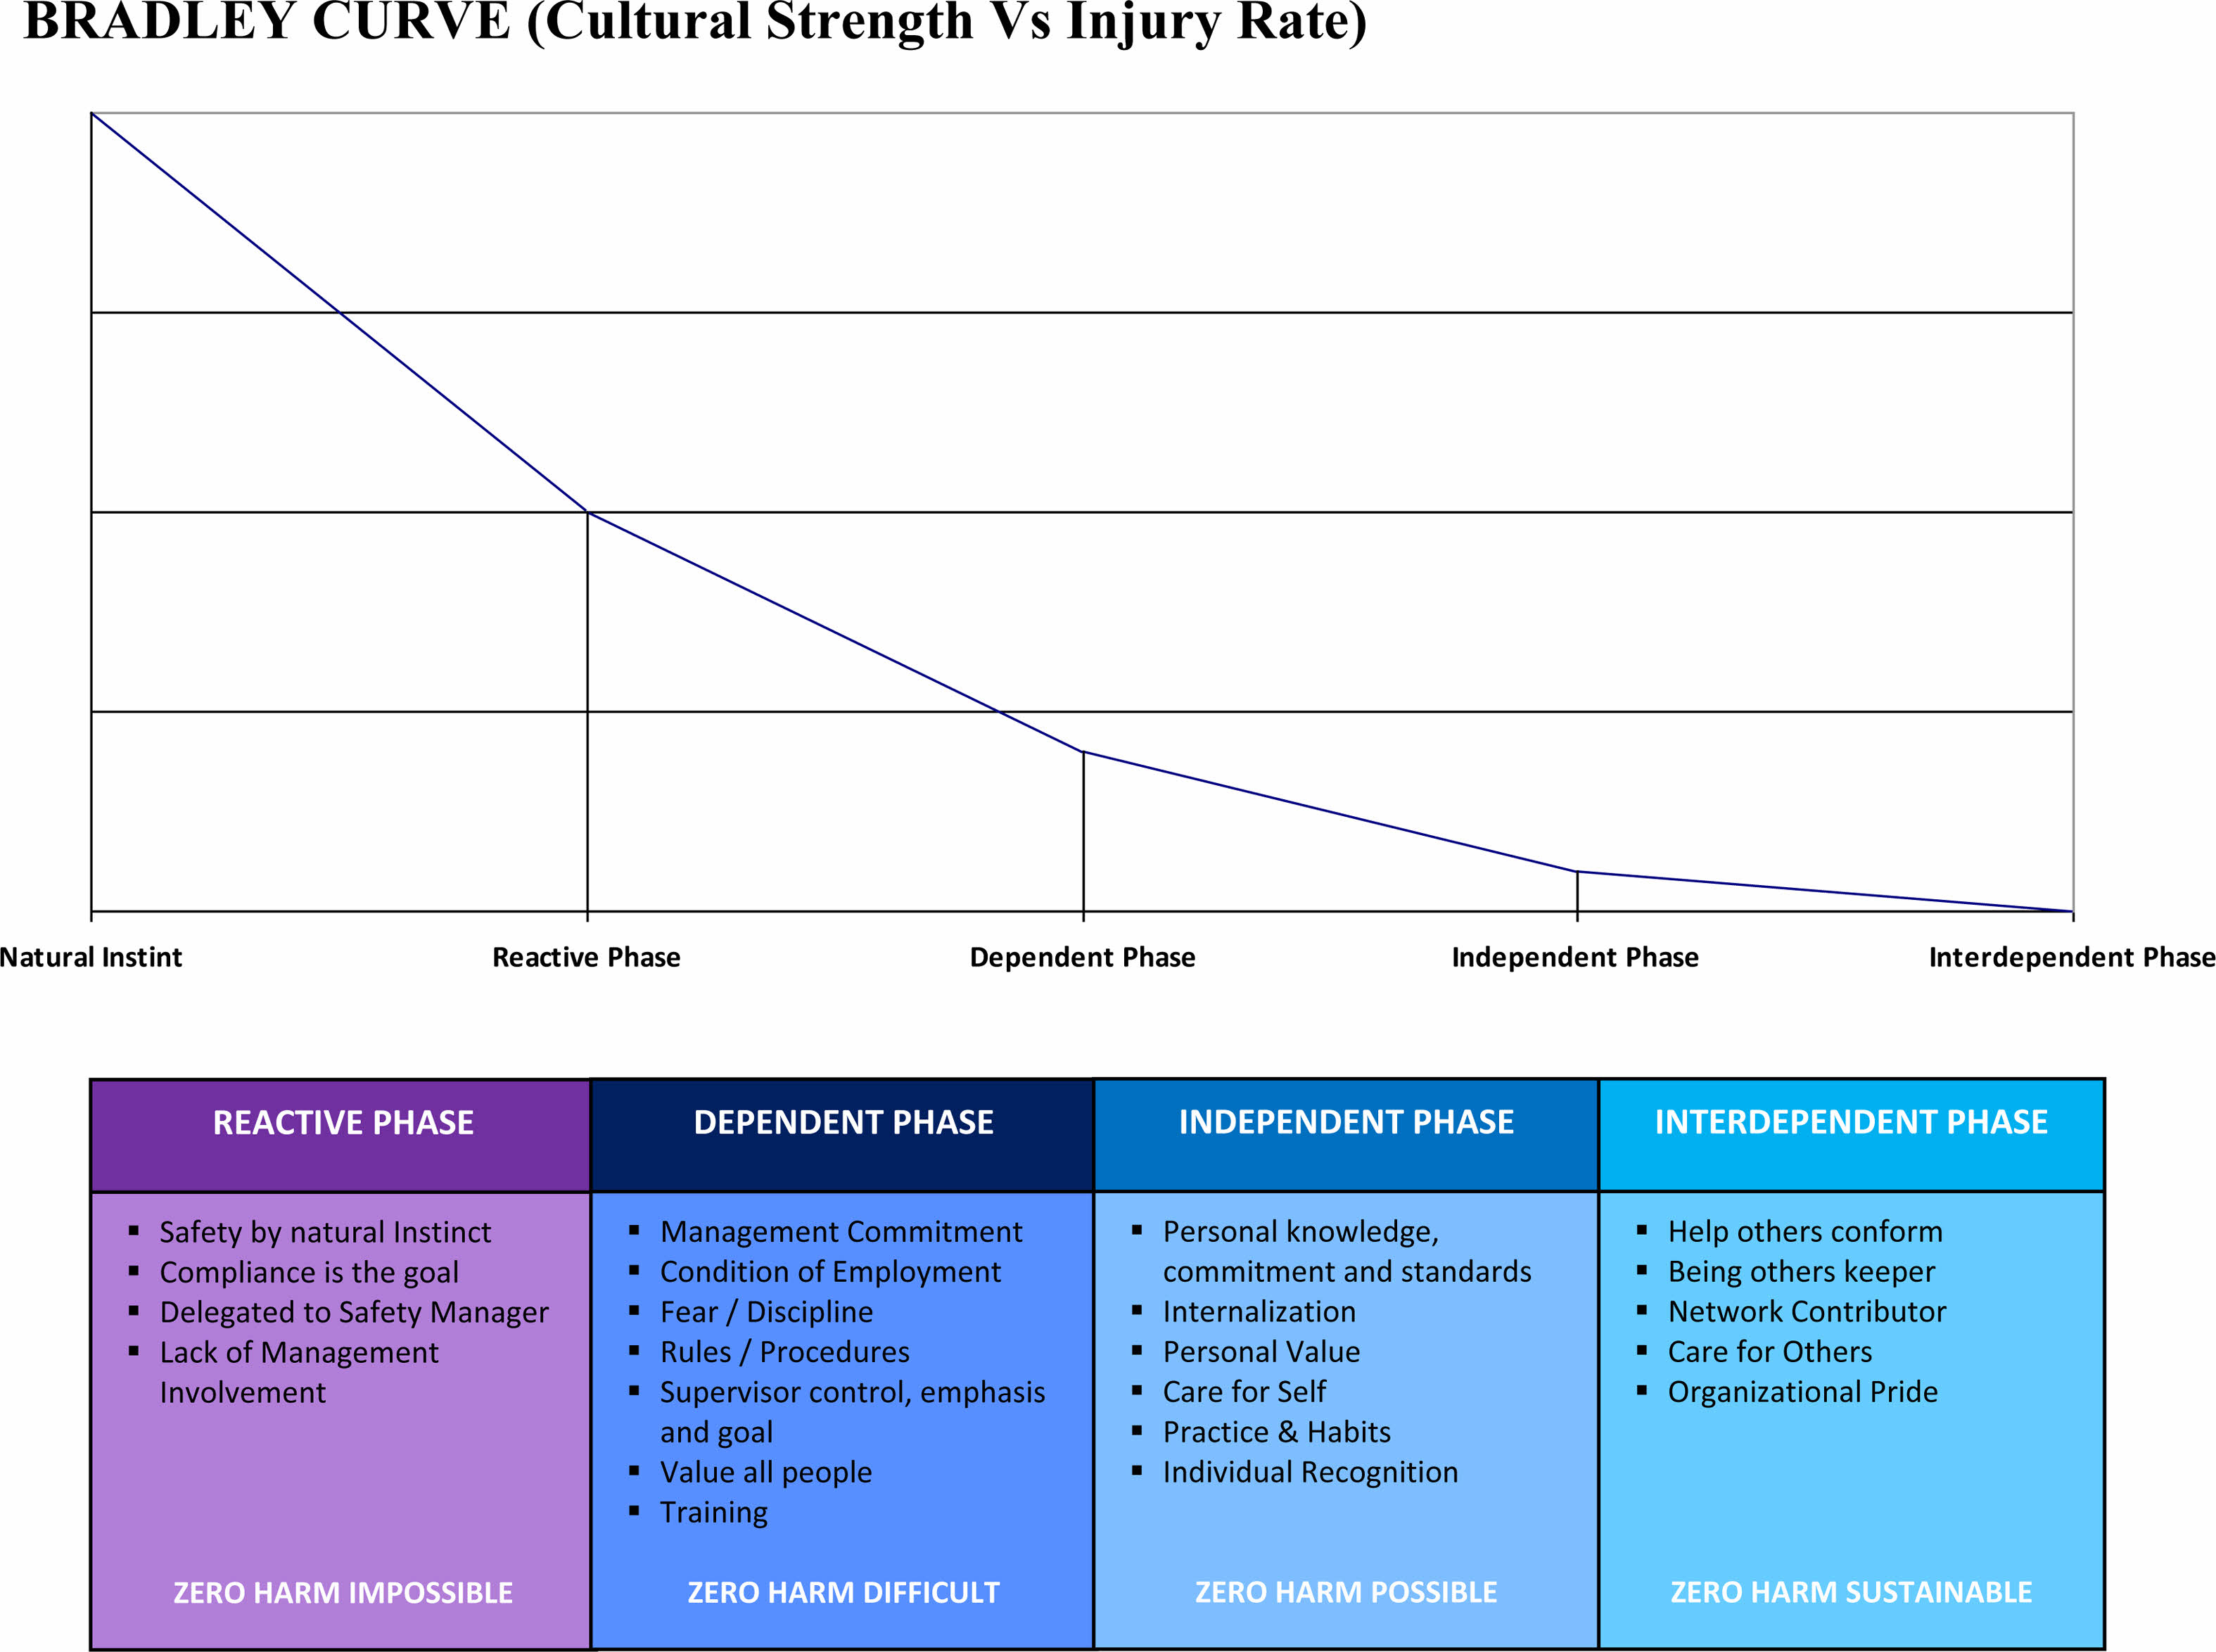
For this research work, Asia’s largest ceramicindustryis selected for study in which three phase action plan/strategy was implemented successfully. In this industry before implementing the three phase action plan the SHE culture in this industry was in reactive phase. Referring by Bradley curve (Fig. 1) as a part of strategy to overcome challenges referring to Bradley curve, it illustrates the relationship between accidents and corporate culture. Ultimately it also provides the way to evaluate the SHE culture and highlights potential ways to improve further. The recommended strategy in a sequence of PDCA cycle would be;
• To conduct a safety culture survey for the organization.
• To identify the gaps and gray areas in safety management & safety culture.
• To identify the right safety management and cultural tools.
• To develop structured safety management documentation suited for organization.
• To train all the stakeholders in their safety roles and responsibilities.
• To digitize the safety management processes for uniformity across the organization.
• To set Objective & Targets at organization level, department level and individual KPI level.
• To monitor the effectiveness of all the initiatives and tools deployed.
The Bradley curve (Fig. 1) [27] is divided into four phases in the journey of cultural transformation:
1. Reactive phase – Reactive occupational safety based on instinct. Employees do not take responsibility for occupational safety. As a result, safety is mainly a matter of chance and accidents are seen as an inevitable part of day-to-day work.
2. Dependent phase – Dependent occupational safety based on rules and supervision. Employees regard occupational safety as rules set by the management. Meanwhile, management assumes that the accident rate will fall if employees simply follow the rules. This leadership style involves exerting pressure on employees.
3. Independent phase – Independent occupational safety based on employees’ self-responsibility. Employees regard occupational safety personally. They take responsibility for themselves and understand the underlying significance of occupational safety measures.
4. Interdependent phase – Shared responsibility achieved by perceiving occupational health and safety as a common value. Occupational safety is an integral part of a company’s DNA. Employees are responsible for themselves and others. They do not accept low standards or risks. They investigate unsafe behaviour and understand that the only way to achieve improvements and a zero-accident record is by working as a team.
To move from reactive to dependent phase a structured strategy/action plan is derived and divided into 3 phases:
(a) Immediate action plan
(b) Intermediate action plan
(c) Long term action plan
Immediate action plan
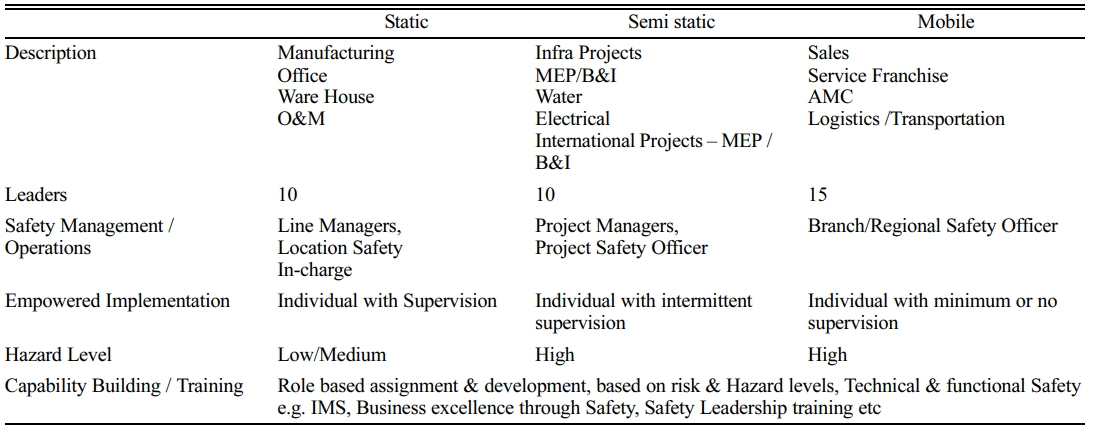
The accident data analysis of previous five years is collected for research and further investigation. For the ease of implementation of action plan entire workforce was divided into three categories as static, semi static and mobile workforce (Table 1). Based on these three categories the safety KPI’s were set for senior management who were identified and trained as a safety leader. Further, Table 1 describes the three categories and its categorization based on operations, safety management, hazard, empowerment and capability development requirements. This categorization was used to develop a training matrix requirement for them based on which the training contents for mandatory trainings, the animation of the contents was done and contents were posted on a company software which had individual dashboard on their training requirements based on their roles and showed the exact status of trainings undertaken vs training pending.
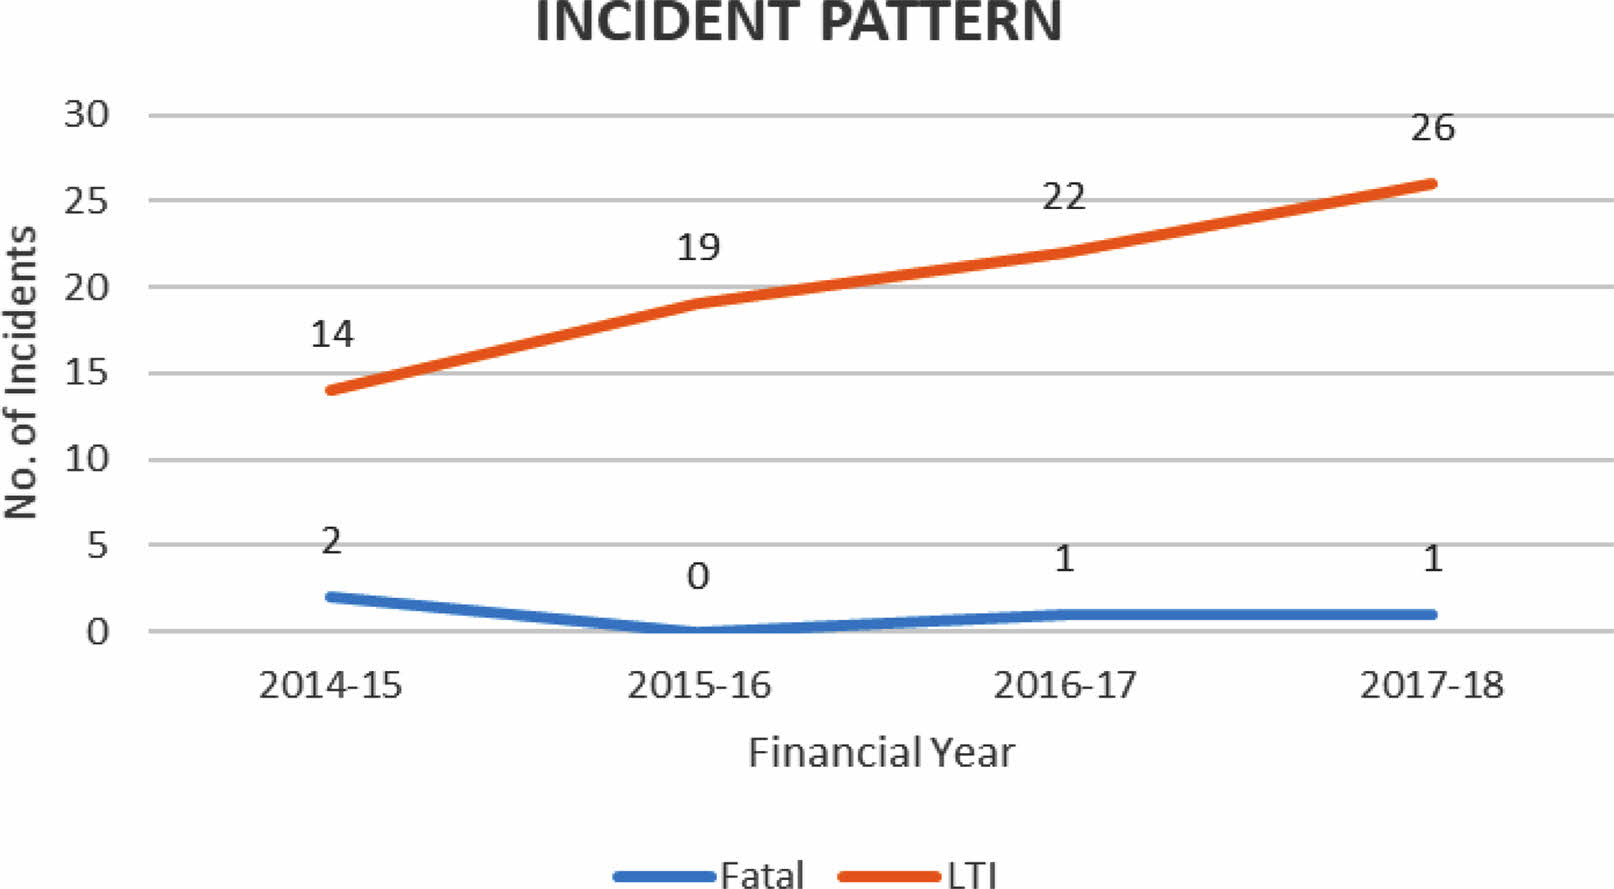
Fig. 2 shows that from year 2014-2015 to 2017-2018 there was no focus on the safety management system and hence the number of fatal and LTI were on increasing trend. In the year 2014-15 the number of LTI reported were 14 which increased to 26 by the year 2017-18 whereby the company management realized the losses made due to the incidents were hindering the profitability of the company and the focus of the company was shifting to the firefighting kind of operations to control these incidents.
Factors that have significant impact on the behavior of the employees or workers
• Family background, friends and environment in which they nurtured or grown.
• Personal faiths, believes or religion and castes which they belongs and follow the culture.
• Education and environment in which they grown.
• Conditions like development of the area, roads, education facilities, welfare measures, basic amenities in which they are living.
• Political conditions or leadership of the region.
• After joining in the organization, Health and safety culture of their organization.
• Years of the employee experience and background training and awareness.
• Peer groups pressure, they will encourage good practices or not.
• Committed management and Management support (Are the top management following the safety and health requirements or not?)
• Personal influences and work pressure off the job hours can affect the individual's attitude.
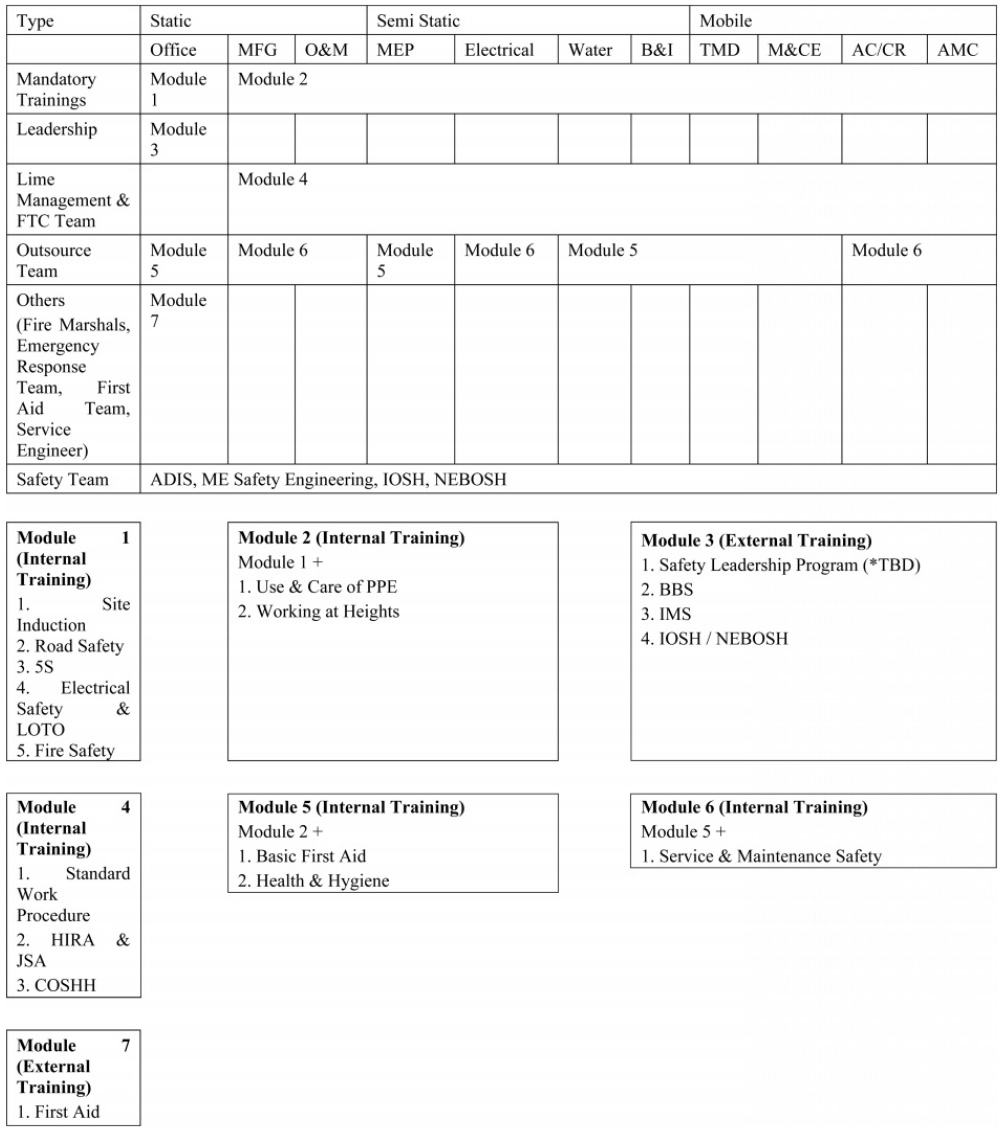
Lead parameters like observation reporting, near miss reporting, training hours, audits, appreciations were also very lower and there we observed felt leadership, less participation of employees, contractor, lack of communication, motivation and trainings. So after audits and first safety perception survey, it was observed the organization was in reactive phase of the Bradley curve. This phase of action plan was to immediately get implemented the actions to control the injury rate and to increase participation level of everyone in the organization to keep safe workplace and to move towards creation of safety culture. So we have identified the supporting leaders from all departments/businesses and imparted leadership trainings to them. In this phase there was a focus on learning the best practices of benchmarking and competitive companies. During visit to these companies we had discussion with senior leaders, consultants, experts and trainers. Proper SHE policy, guidelines like Rewards, recognition and Consequence management, Standardization of manuals, MSRA, PTW system formats & checklist has been devised and communicated to everyone in various languages understood by worker category. All senior most management representatives have been sensitized with SHE trainings and have been given annual safety KPIs. Senior managers from various departments and business as a safety leaders were also imparted trainings on sensitization and business excellence through safety leadership. Targeted objectives of lead and lag parameters as part of KPIs for everyone has been set. Also developed animated videos for trainings with evaluation system for all types of workforce in 9 local languages, digital learning platform was created and used by everyone. As mentioned earlier for ease of training and allocating the responsibilities, entire workforce have been categorized (Contractor, permanent & Non-permanent employees) into three categories as – Mobile, Static and Semi static. The employee training plan for static, semi-static and mobile employees is depicted in Table 2. for reference.
Immediate action plan was formulated to bring the situation immediately under control as the incidents were showing increasing trend. For critical business like CERAMIC INDUSTRIES, MEP/INFRA, while working with petty business partners with more of unskilled, semiskilled man power, implementing SHE action plan and its monitoring is possible with only digitized solutions.
Digitalization
So our main focus was to develop web based and mobile based platforms like portal for reporting of observations, incidents using QR code, development of animated videos in multiple languages, technician tracking, audits, and MIS software. Safety perception survey with employees was conducted to understand the status where we stood with respect to safety culture.
Safety perception survey
As this was the first survey for safety in the organization, participation level was very low to a value of 326 responses which was equivalent to only 4% of total employee. The participation from different locations and departments was very poor. But whatever responses we received that was also good start to understand the areas for improvements. An inputs given by each of employees were considered and implemented in a stipulated time frame.
Launching of road safety campaign for a year
Based on more incidents with respect to road safety, a dedicated annual campaign was launched in which active participation from top to worker’s category we observed. Various competitions were conducted for all including family members and best participants were rewarded by the management. Trainings, communication, videos, messages from management were few key features of this campaign, its effective measured with decreased incidents related to travel safety.
Communications-Top down and vice a versa
We observed that there were big issues of managements participation in the SHE planning, implementation, and monitoring. Without managements active participation it’s not possible to change the safety culture in the organization. So we started it with their sensitization and make them to understand where we are and where we want to go ahead. For all kinds of SHE communications uniformly we launched mascot. We also authorized everyone in the organization to stop unsafe work for which we have formulated “Authority to stop work policy” and communicated to everyone in all the requisite local languages. With this managements participation started increasing through occasions like, training programs, safety committee meetings, world environment day, national safety day, world tobacco day, world heart day, world aids day, road safety week and various annual campaigns like road safety and working at height campaign. Another task we had was preparation and standardization of documents like policies, manuals, formats, checklists, MSRA, at corporate level and all business level.
Monitoring mechanism
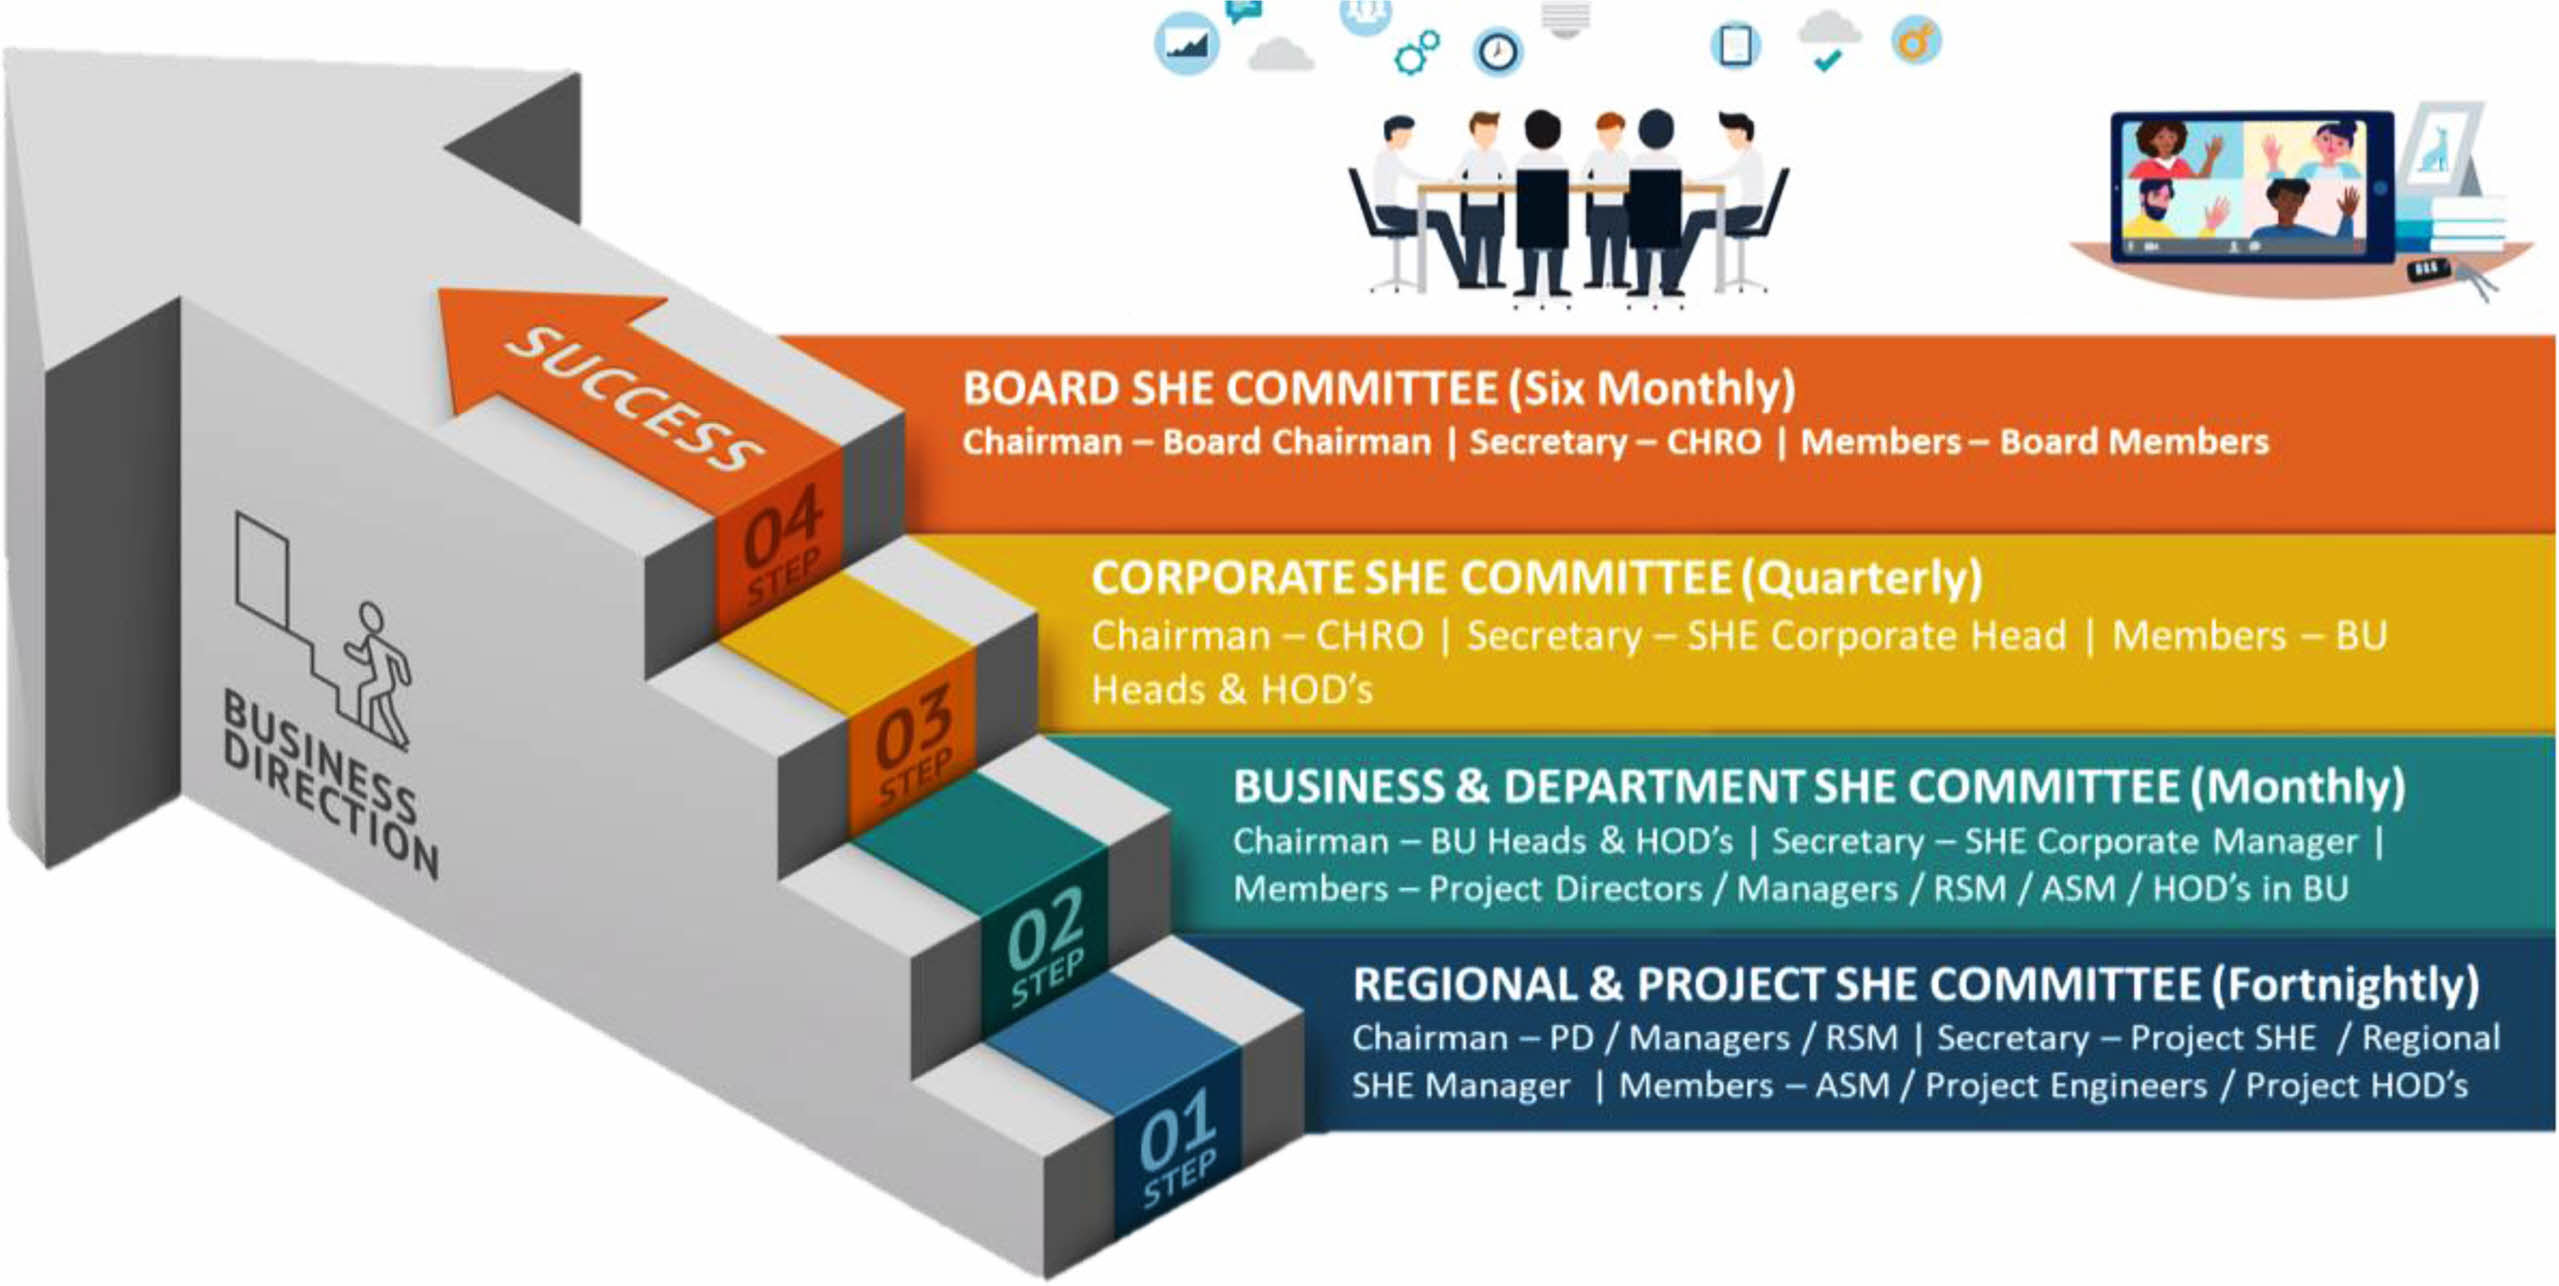
For monitoring the implementation and outcomes 4 level SHE committees were formed from board level to project level with clear identification of roles and responsibilities of committee at all levels. Board SHE committee is chaired by one of the director and represented by all core management group members and SHE head, which meets twice in a year. Corporate SHE committee meets on quarterly basis represented by business heads, vertical heads and HODs of all department. Business or department SHE committee meets on monthly basis represented by business heads, safety and senior leaders of business and departments. Project level committee, meets on monthly basis and is represented by project director, manager, site team, workers and safety department (Fig. 3).
Intermediate action plan
This is a second phase which was very crucial and many strategies of this phase were properly planned and timely executed. In this phase with consistent implementation of first phase action plans, main focus was on digitization, business partner’s competency development (Contractor Safety Management), implementation of Integrated Management System, development of model sites based on 20 criteria’s, digitalization and development of Digitized Safety Excellence Centre. When there are challenges of working with more of unskilled and unstable workforce digitalization is the only solution to monitor, measure and analyse all safety aspects. Digitization includes reporting of observations, near misses, and other incidents using QR code by anyone employee, worker or visitor/guest with proper escalation matrix. Mandatory registration of business partners or contractors and workers on CSM/Vendor Management portal with data of records of skill, trainings, experience, qualifications etc. After successful induction and training QR code is issued as authorization and for monitoring purpose in the workplaces. Digitized Emergency Command Centre at corporate level was also developed to support the required work location in case if it is needed in emergency
(A) Digitization includes reporting of observations, near misses, and other incidents using QR code by anyone employee, worker or visitor/guest with proper escalation matrix. Mandatory registration of business partners or contractors and workers on CSM/Vendor Management portal with data of records of skill, trainings, experience, qualifications etc. After successful induction and training QR code is issued as authorization and for monitoring purpose in the workplaces. Digitized Emergency Command Centre at corporate level was also developed to support the required work location in case if it’s needed in emergency.
(B) Digitized Safety Excellence Center
Development of digitized safety excellence center was an innovation during this phase. The idea was to achieve a targeted learning among all the staff and workers which would enhance their skills and competency on execution of their tasks safely. In normal course of training program, we never measured the learning index of person, but using this SEC we were able to measure the learning index of each staff and worker in each aspects of safety competency requirement for any hazardous activity.
This digitized safety excellence center was developed to have integration of
1. Contractor registration and pre-qualification
Where each contractor is required to register himself with his qualification data and last three-year safety performance data. These data are evaluated and authenticated to reach to a contractor rating system which authorizes them to be eligible for specific type of work.
2. Worker registration and medical fitness
The qualifying contractor is then required to register all his staff and workmen with their personal details, government ID proof and medical fitness certificate. This again is authenticated to allow workers to have access to SEC.
3. Equipment or Hand tools registration and safe for operation
The contractor is required to register all his equipment that he is likely to use at any location. The equipment is assigned with a unique identification number and are attached to specific inspection and third party certificate which declares it to be safe for use. Each equipment is assigned with a QR code attached to its UID and these QR codes are pasted on the equipment which helps the entry of only safe equipment at the location.
4. Legal compliance status
Each contractor is required to declare the compliance to the legal requirements as per company policy. He is required to upload the required documents, licenses, certificates, etc which are authenticated. The contractor and the company gets an alert before expiry of any legal requirements.
5. Slot Booking for staff and workers
The eligible contractors have access to the training center and he can nominate his staff and workers for the scheduled trainings online. Once they are confirmed, each participant gets a login ID and password to have access to the SEC.
6. Pre Evaluation of Learning Index - Along with the login ID and password, each candidate gets a link that takes them to a predefined question to check their current learning index on the topic of the training, which also becomes a pre-qualification requirement to be nominated for the program.
7. During Training Evaluation of Learning Index
During the training, evaluation is done on each topic of the training which helps to understand the learning gained form the program by the candidate.
8. Post Evaluation of Learning Index
Post completion of entire training, candidate again has to be through the pre-defined questions (same as that in pre-qualification) to check the learning index post completion of the training program.
9. Acrophobia Test for Work at Height
Those who are required to work at height are required to undergo an acrophobia test which consist digitized monitoring of health parameters when a person walks on the acrophobia setup. The monitoring and its calculations help to declare if the person is fit to work at height or not.
10. Passport Generation
Once the person has undergone all the aspect of the training a ‘Safety Passport’ is generated which has complete details of the staff or worker along with the learning index in each of the aspects of the training and overall learning index. This passport also has details of violations or achievement of the individuals. The passport is converted to a QR code and can be pasted on helmet or ID card which helps in access control for authorized entries only.
11. Access Control through QR code
The QR codes assigned to individuals and equipment helps to bring an access control system through its scanning by the security. This also helps the company in resource planning based on the live data.
12. Monthly Performance Monitoring & Enhancement
The monthly performance of the contractors and his staff and workers is tracked through this software which helps to monitor the progress made by contractor in safety management and to attach it to their running bills. Hence their bills may get processed only if they comply to all the requirements of the safety management system.
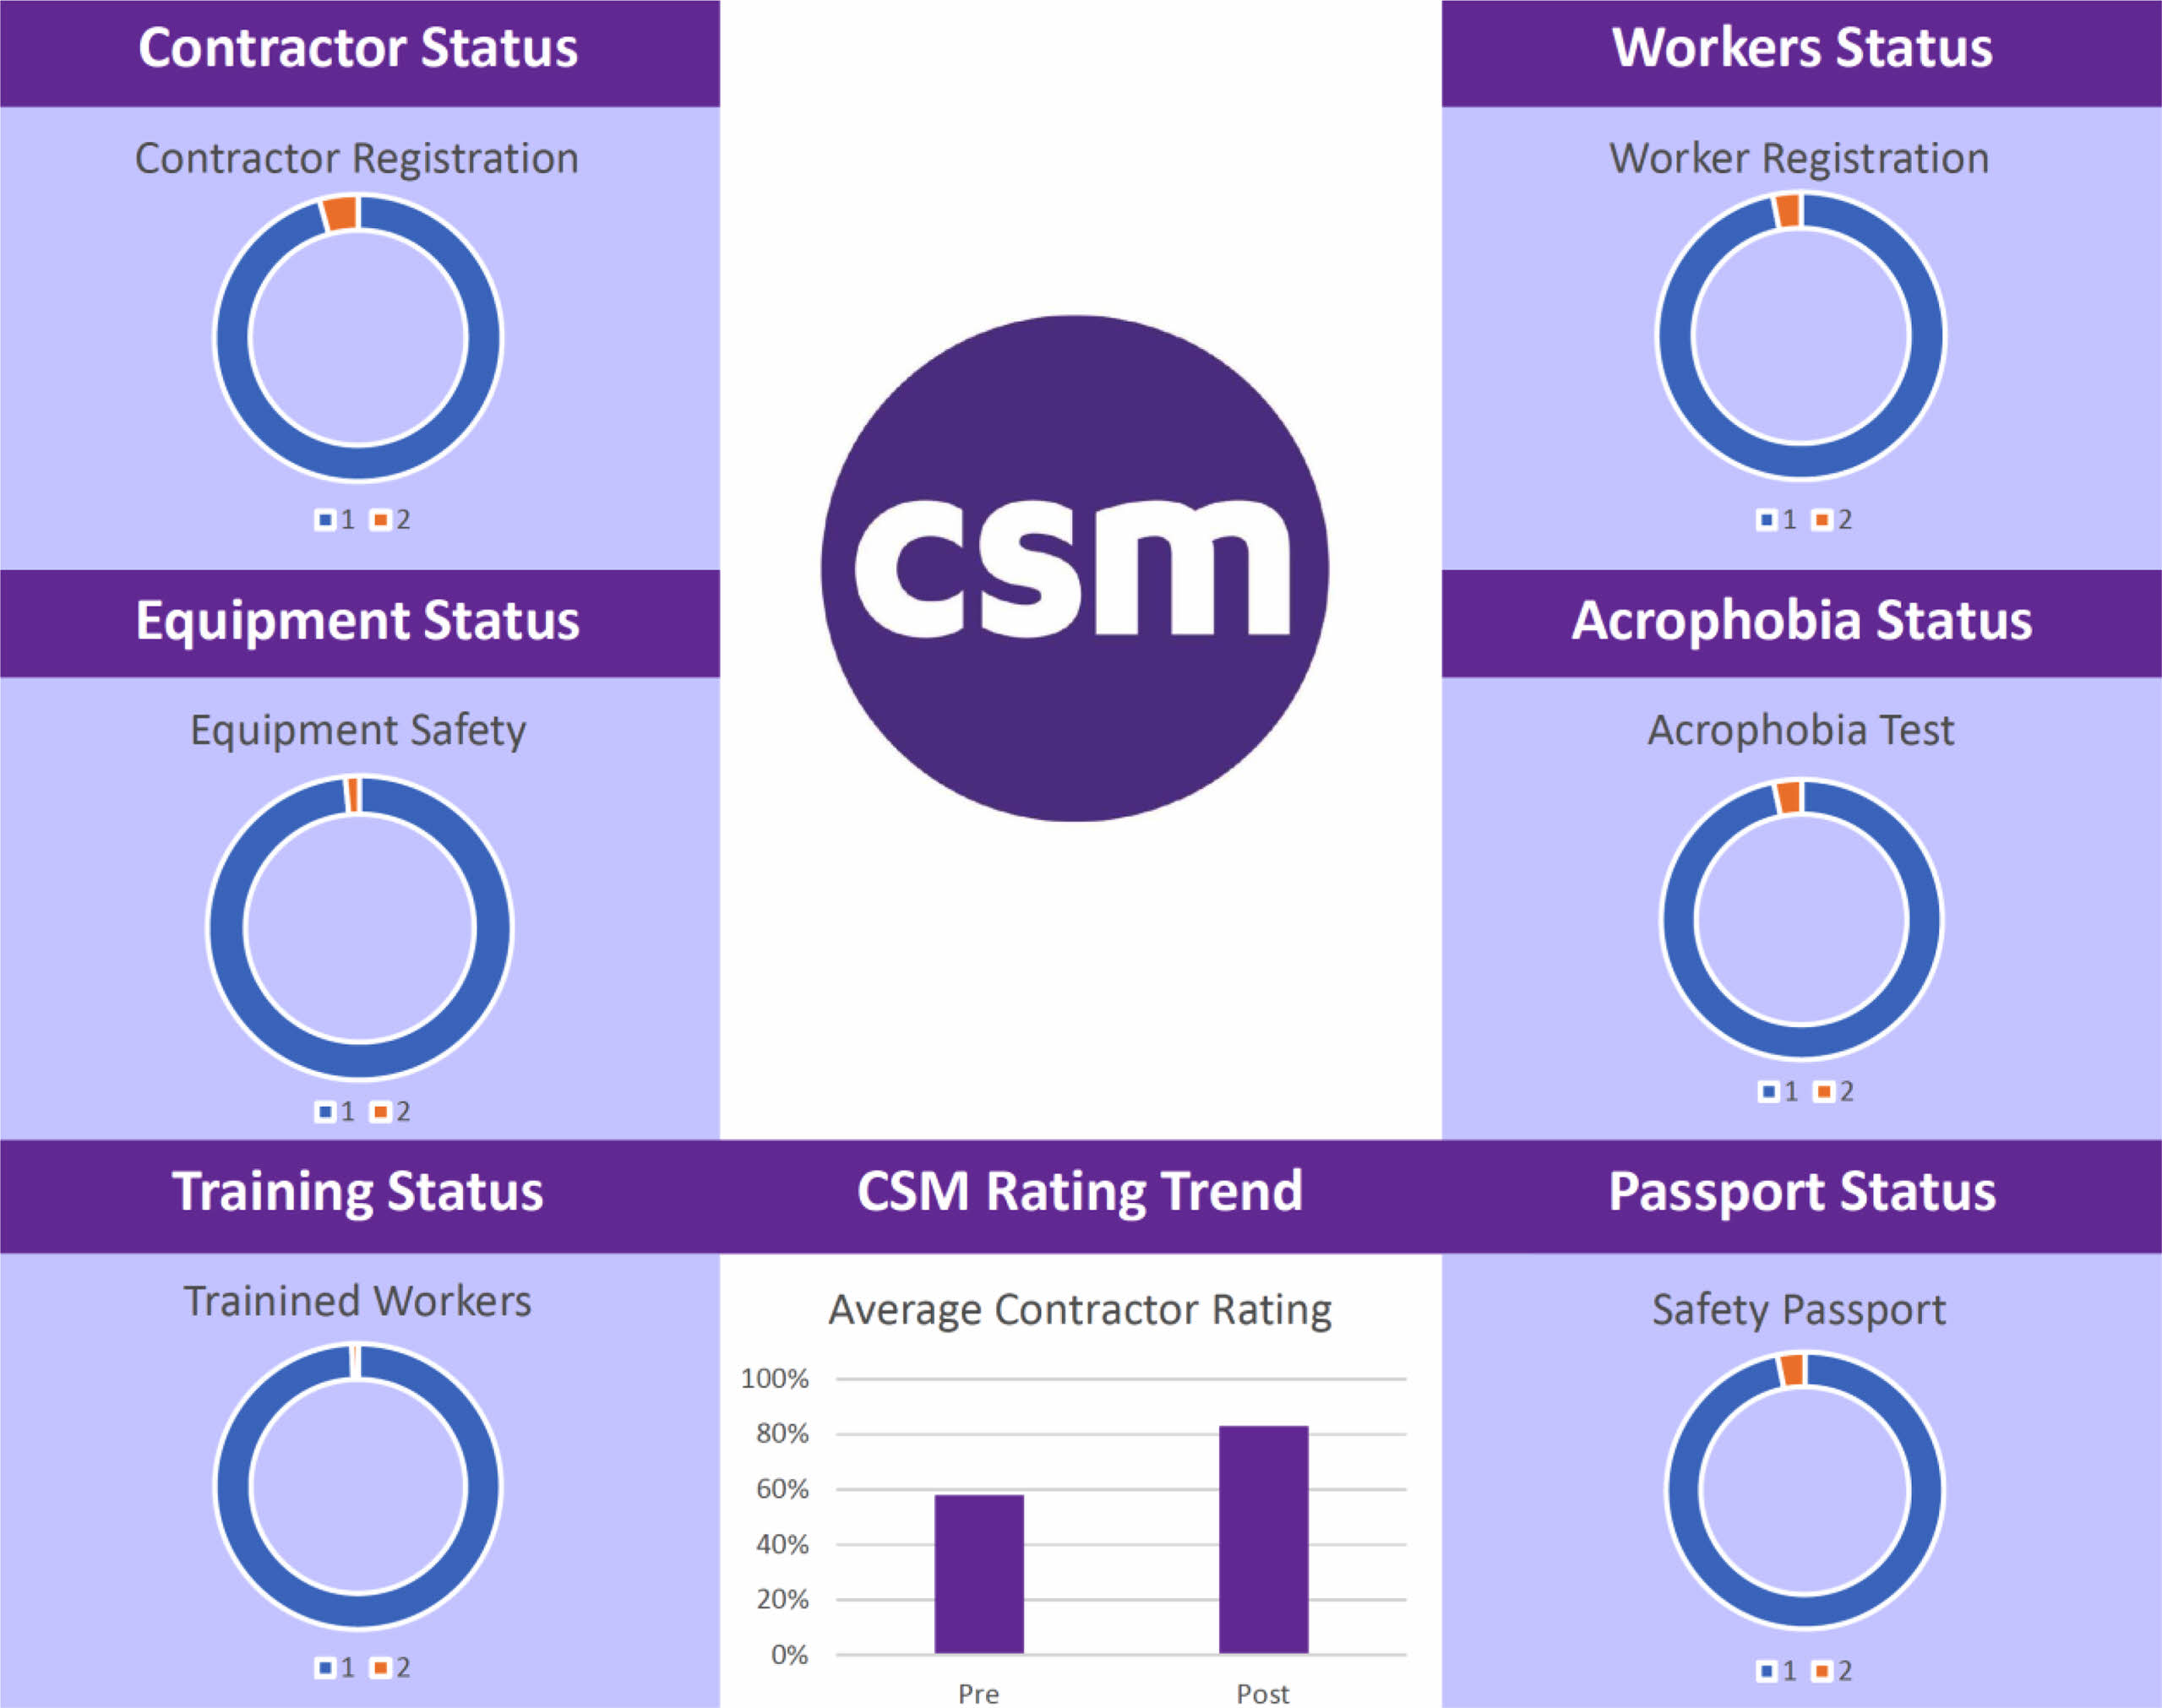
Thus with one initiative the company was in position to control overall contractor safety management across the organization, which helped to align the contractors towards the company business goals. Below are the details of the extent to which this one program made an impact on the company culture. Fig. 4 shows that with the implementation of CSM software integrated with the safety excellence center, equipment safety, legal compliances and contractor billing process, the impact was seen not only on the compliances but also on the overall rating of the contractors which shows an improvement of the contractor competency on the safety management compliances required at the workplaces.
Further to enhance the skills of the contractors to the required level a Business Partner SHE Conclavewas organized across the organization in 5 regions i.e. East, South, North, West and Central zone. All the business partners in those regions were invited in person to attend a two day SHE conclave where they went through a very different, SHE program which made then to think and align their business goals with the company goals. The two-day program included following components;
1. Sensitization on why safety should be integral part of the contractor’s business.
2. Workshop on learning out of engaging exercises.
3. Understanding of CSM platform.
4. Good Practice Sharing by Business Partners and the managers of the organization.
5. Opportunity for contractors to interact with Top Management of the company.
6. Recognition of the top performing business partners.
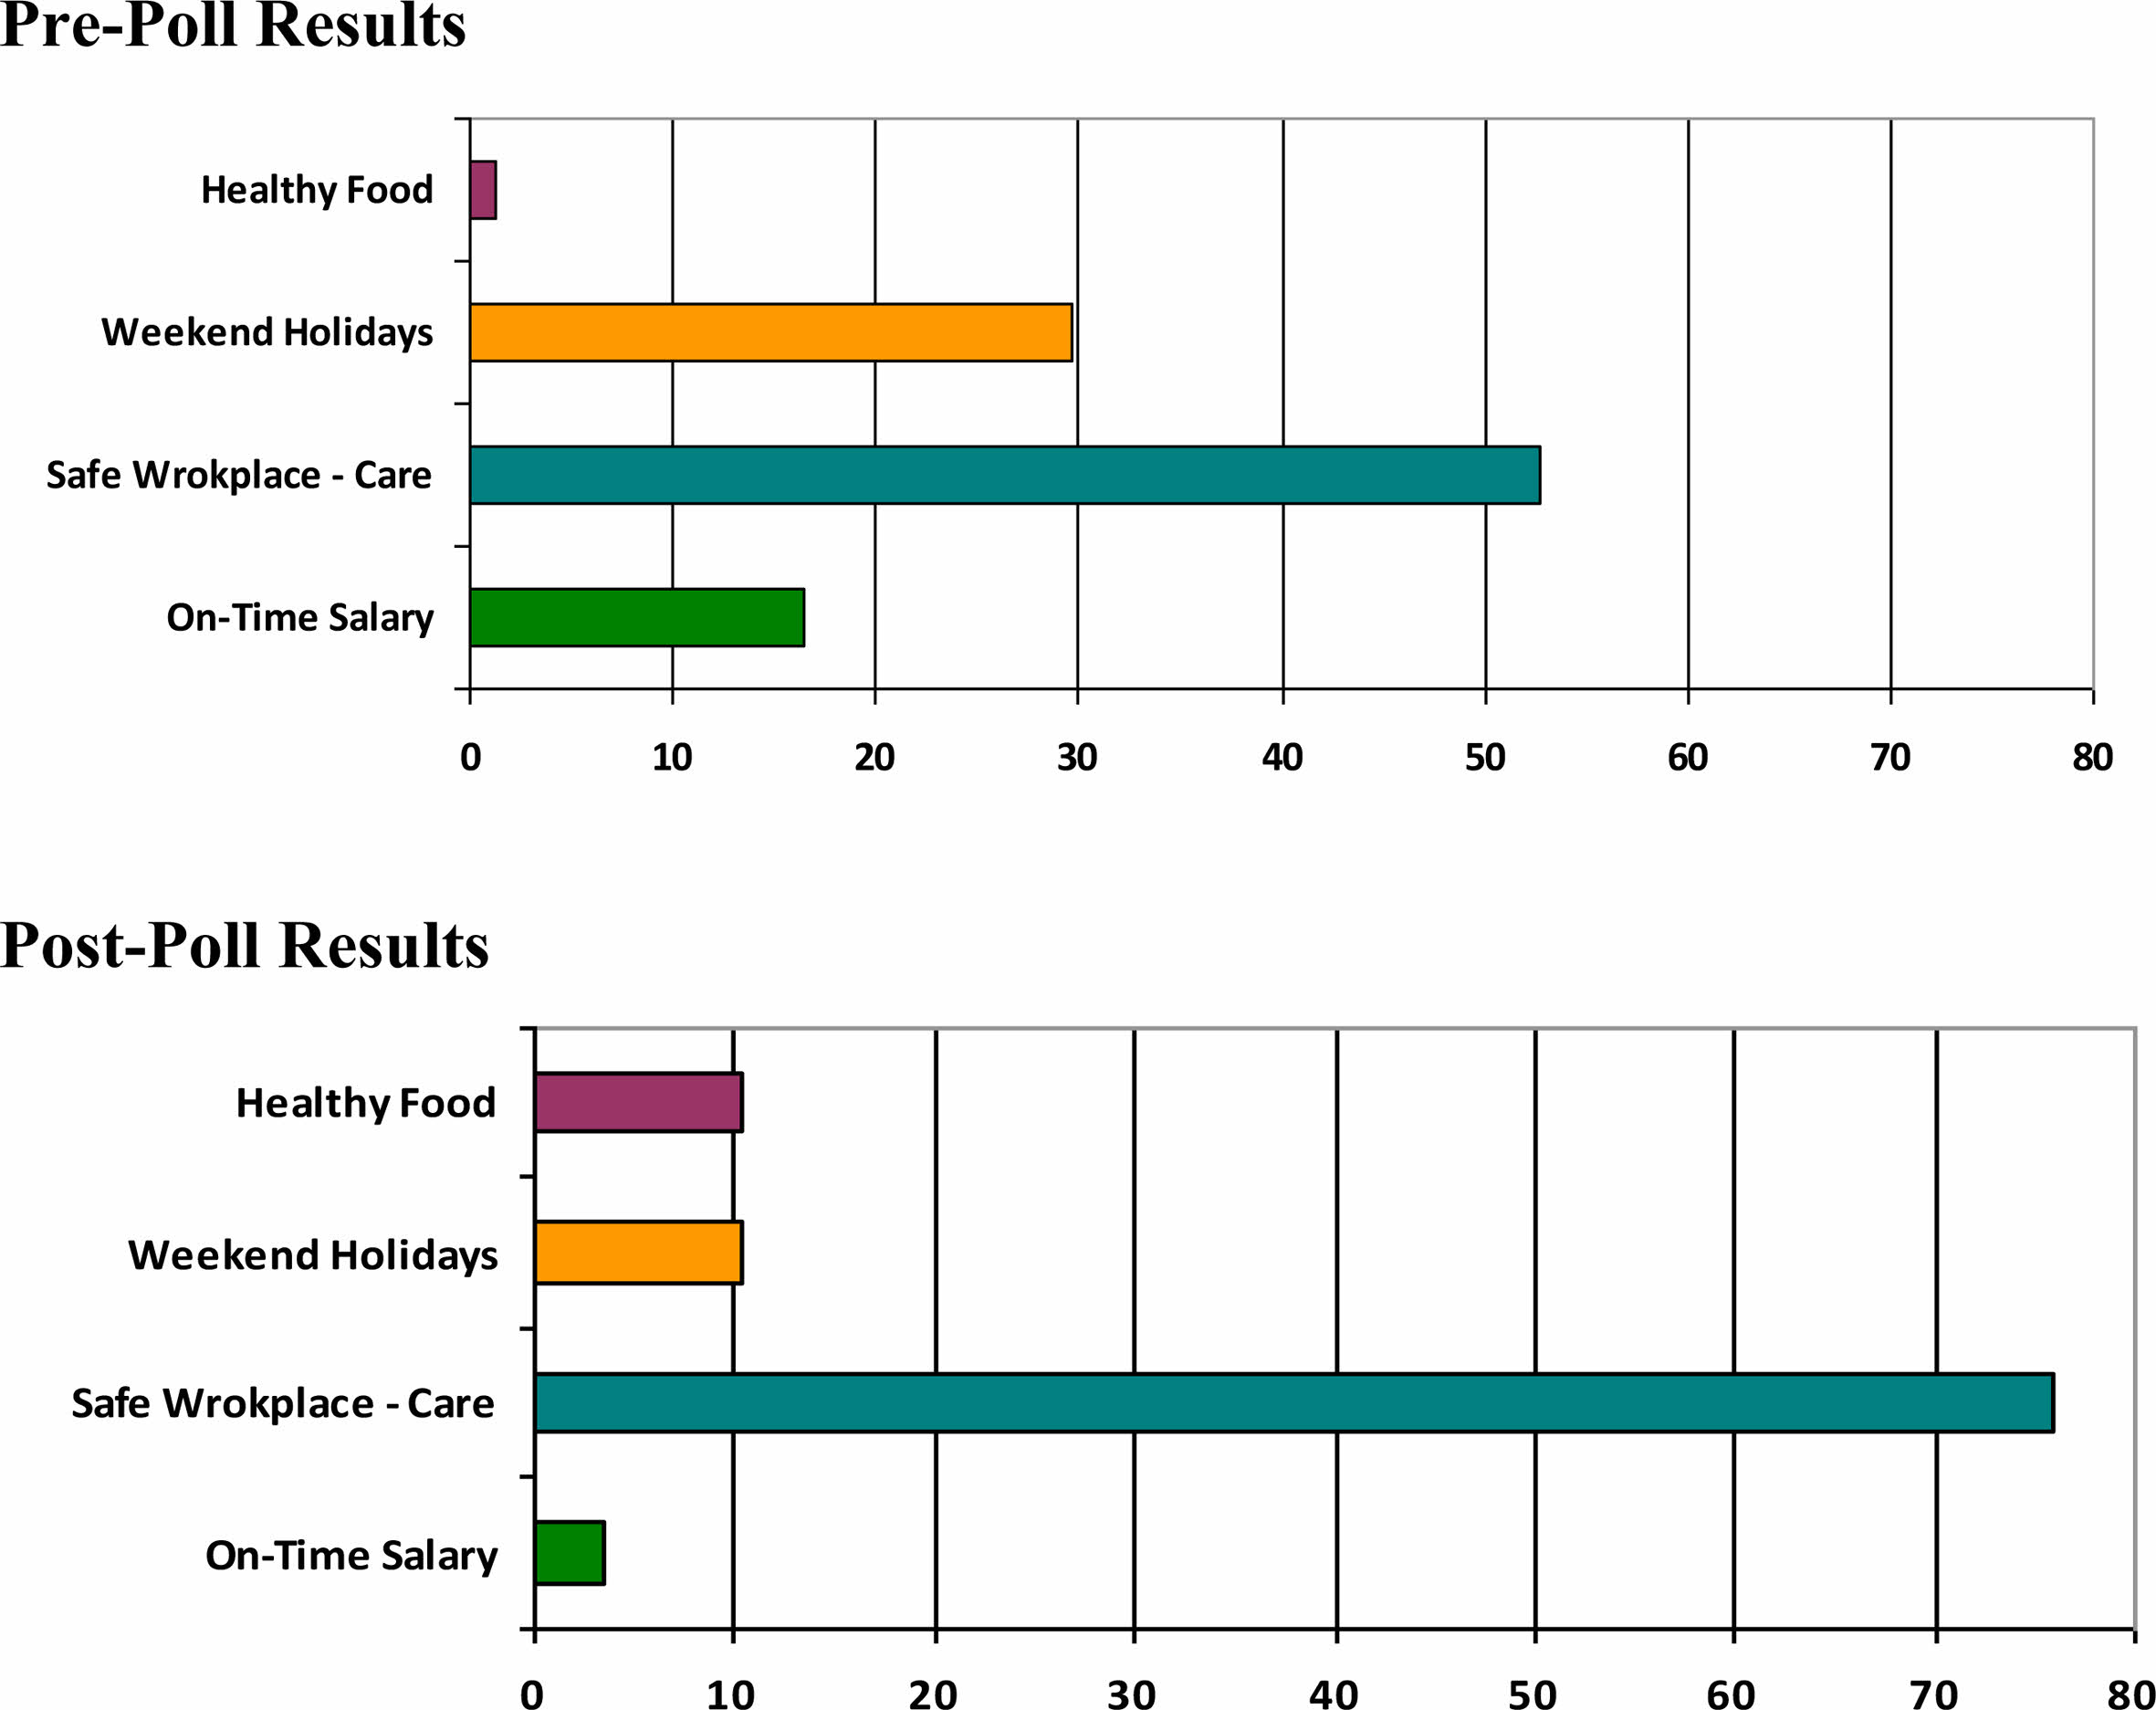
Based on the SHE Conclaves in these 5 zones the impacts were measured in terms onsite pre and post polls at the venue of the programs and on the improvements made by the contractor post 1 month of the program as presented below (Fig. 5). Fig. 5 shows the improvement seen in the mindset of all the participants after going through the two sessions of internal and external trainers. This reflects the impact of such program which brought the employees and contractors on the same platform when it comes to safety management at workplace.
Poll Question : What according to you is most important to make your company employee friendly
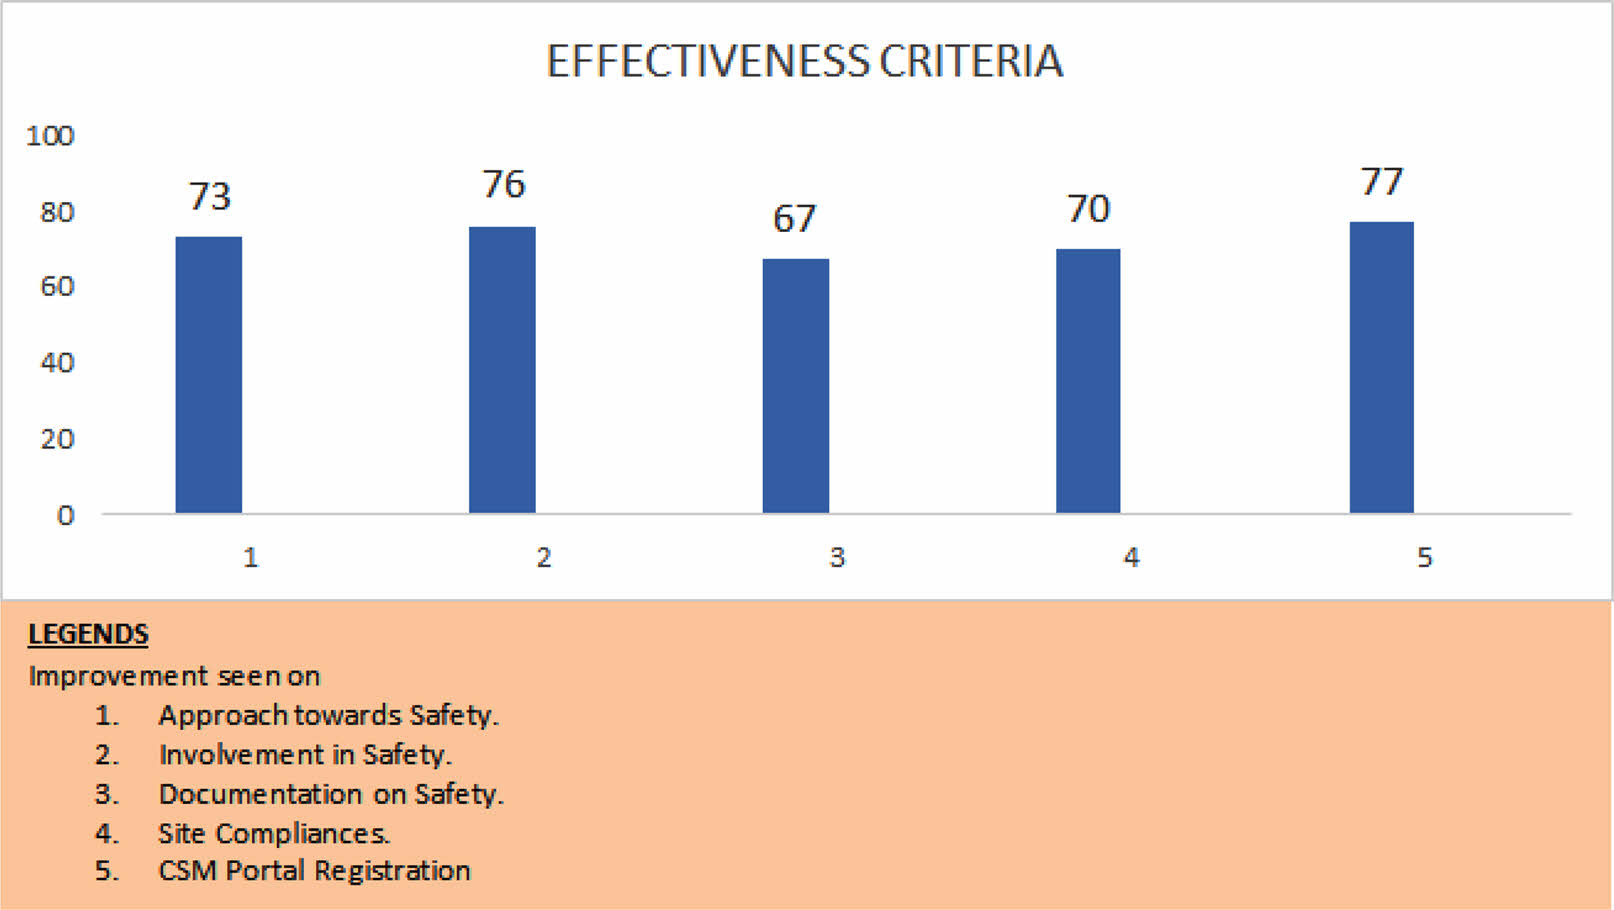
Fig. 6 represents the improvement or engagement of the contractors in safety management of workplaces post this two-day program. The review was done one-month post program to understand the impact that this program has brought to improve the vision and behavior of the contractors on improved safety compliances for achieving the business goals.
|
Fig. 1 Bradley curve. |
|
Fig. 2 LTI Incident pattern while in reactive phase |
|
Fig. 3 Four Level SHE Committees. |
|
Fig. 4 Contractor Safety Management Dashboard. |
|
Fig. 5 Pre and Post Polls at the business partner’s conclave. |
|
Fig. 6 Post 1-month effectiveness of the event. |
Safety perception survey or safety culture survey was taken up among the employees. The survey involved framing of the questionnaire with categorization that intends to give the desired outcomes. These questions were converted to digital platform and links were shared with all the employees from HR team with note from the MD & CEO. The link took employees to a questionnaire platform where they were asked to respond based on their perception or thinking, from the multi choice answers.
The survey outcomes were then analyzed for individual responses and categories wise to understand the variation in perception on safety management and their attitude on safety. This analysis helped in understanding the maturity level of safety management within the organization and to identify and select the right safety tools to impact them and bring cultural transformation.
The overall cultural strength was calculated based on the survey responses by all the employees who participated in the survey which gave a clear idea on where the organization stands and where it need to be driven to achieve the intended goal.
With the help of safety perception survey, audits and injury rate, the actual scenario and culture within the organization was evaluated, which gave a clear direction to form a practicably implementable strategy. This ultimately helped in improving the safety performance of the organization. The safety performance of the organization with leading and lagging parameters, and the improvements attained is shown in the form of below graphs.
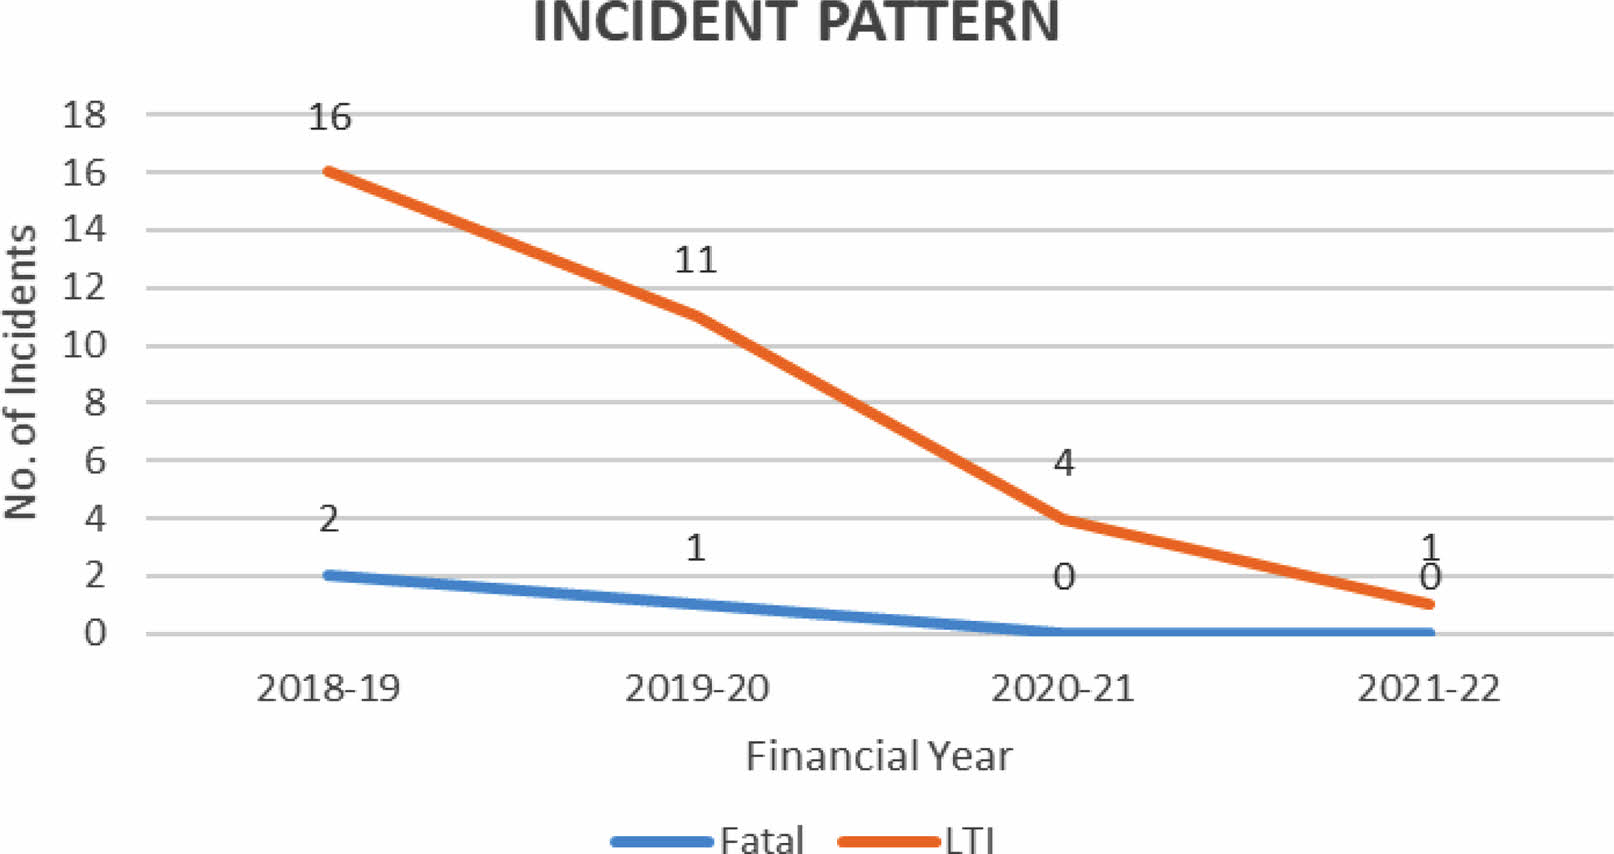
Fig. 7 depicts the incident pattern which indicates a drastic improvement in the form of decreased number of major accidents in the company. The company had 2 fatal incidents and 16 LTI incidents in 2018-19 where most of the energies or focus of the company was towards firefighting exercises to control these incidents, to investigate these incidents, and to correct the situation. These incident were reduced to 1 fatal and 11 LTI incidents in the year 2019-2020 and further to 0 fatal and 4 LTI incidents in the year 2020-2021 and finally got reduced to 0fatal and 1LTI in year 2021-2022. Thus gradually the incidents decreased which helped the company to shift their focus from firefighting exercises to the proactive thinking on innovative ways of the business growth.
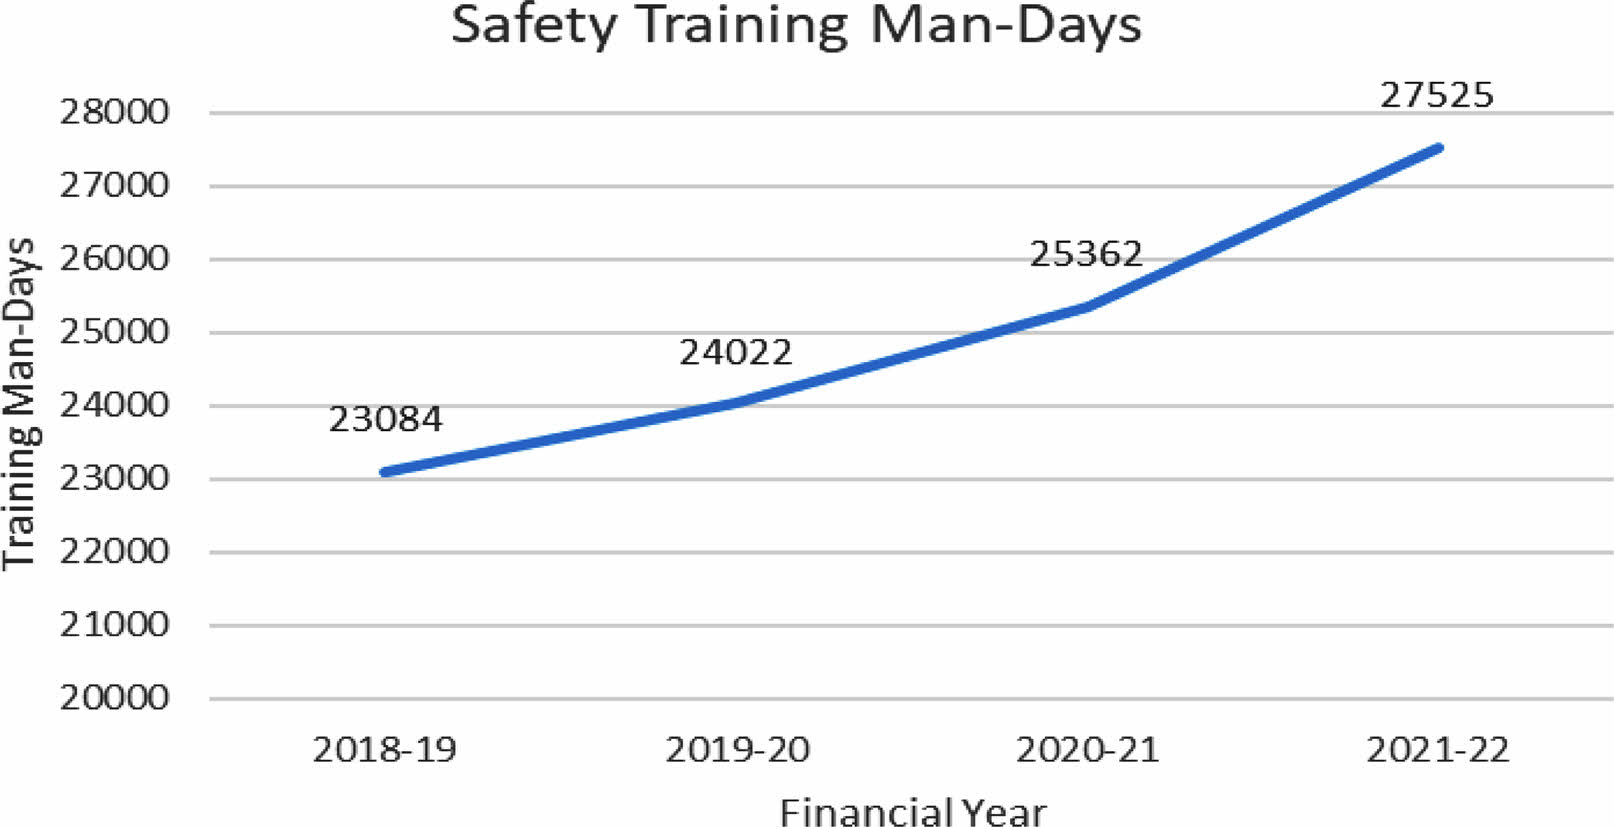
The man-days spent on safety training shows a drastic improvement in the form of increasing number of man-days spent on safety training within the company (Fig. 8). This reflects the company’s focus towards building up a safety competency among all the staff and stakeholders. The training man-day spent increased from 23084 in the year 2018-19 to 27525 in the year 2021-22.
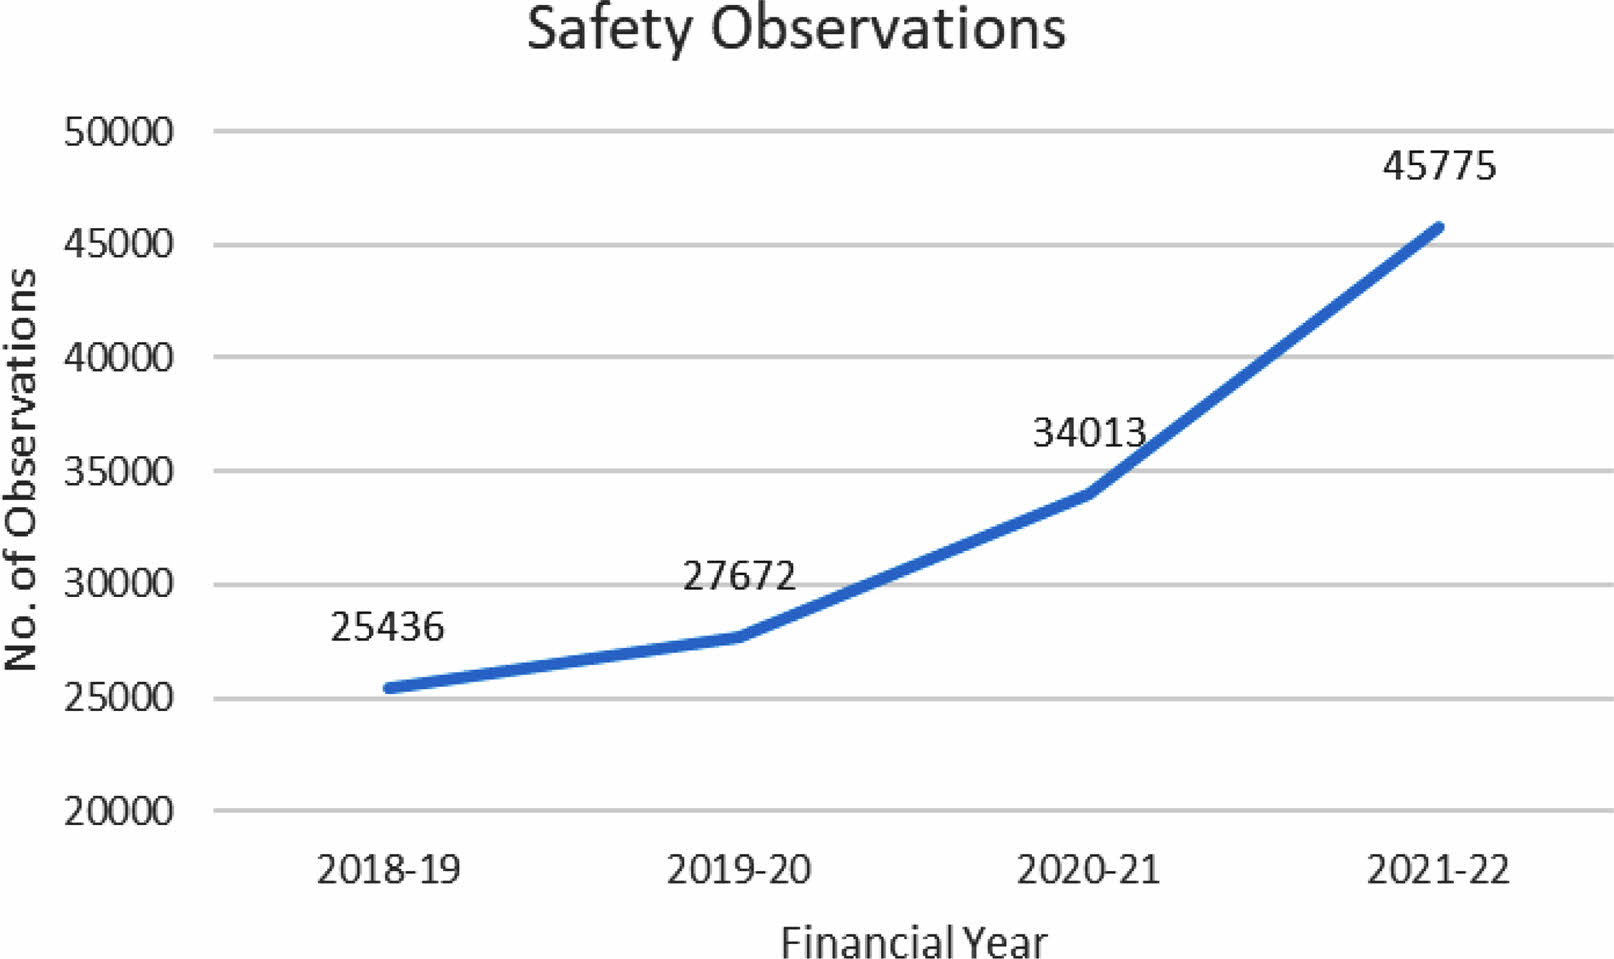
The safety observations and its closure shows a drastic improvement with increased number of observations across the company. The company had a limited observation been made on the safety related unsafe acts and unsafe conditions. Since they went unnoticed, these observations turned out to be incidents which hindered their growth profile. As the number of observations and their compliance started increasing, the workplaces started converting to the safe workplaces which ultimately helped in reduced incidents in the company. The number of observations almost was twice in the year 2021-2022 from that of the year 2018-2019 (Fig. 9).
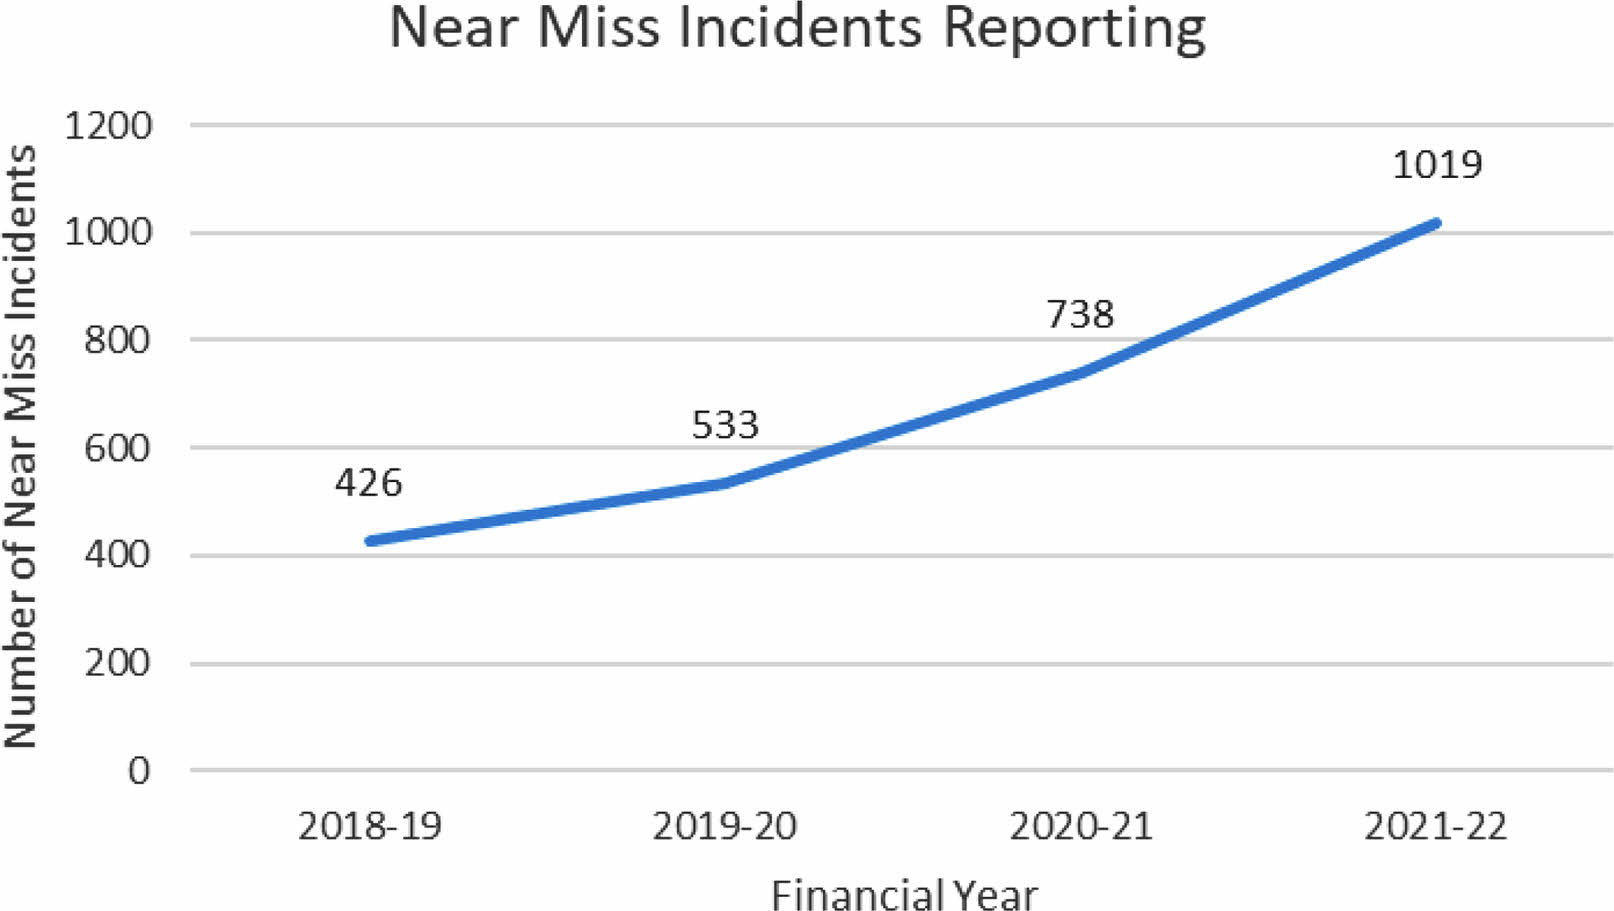
The reporting of near miss incidents showed a drastic improvement in the form of improved number of qualitative near miss incidents which were investigated thoroughly to work on root causes and to horizontally deploy the corrective actions across the organization. The graph indicates that the company has considered the near miss as an indicator of the potential for major incidents in the company. Hence those reporting the incidents were rewarded and the lessons learned from these near miss incidents were share across the company for the horizontal deployment. This helped the company to not only reduce the incidents in one location but at the same time also helped the other locations across the company to reduce the incidents out of learnings shared. If we talk about the figures than the capturing of near miss incidents has increased from 426 in 2018-19 to 1019 in the year 2021-2022 (Fig. 10).
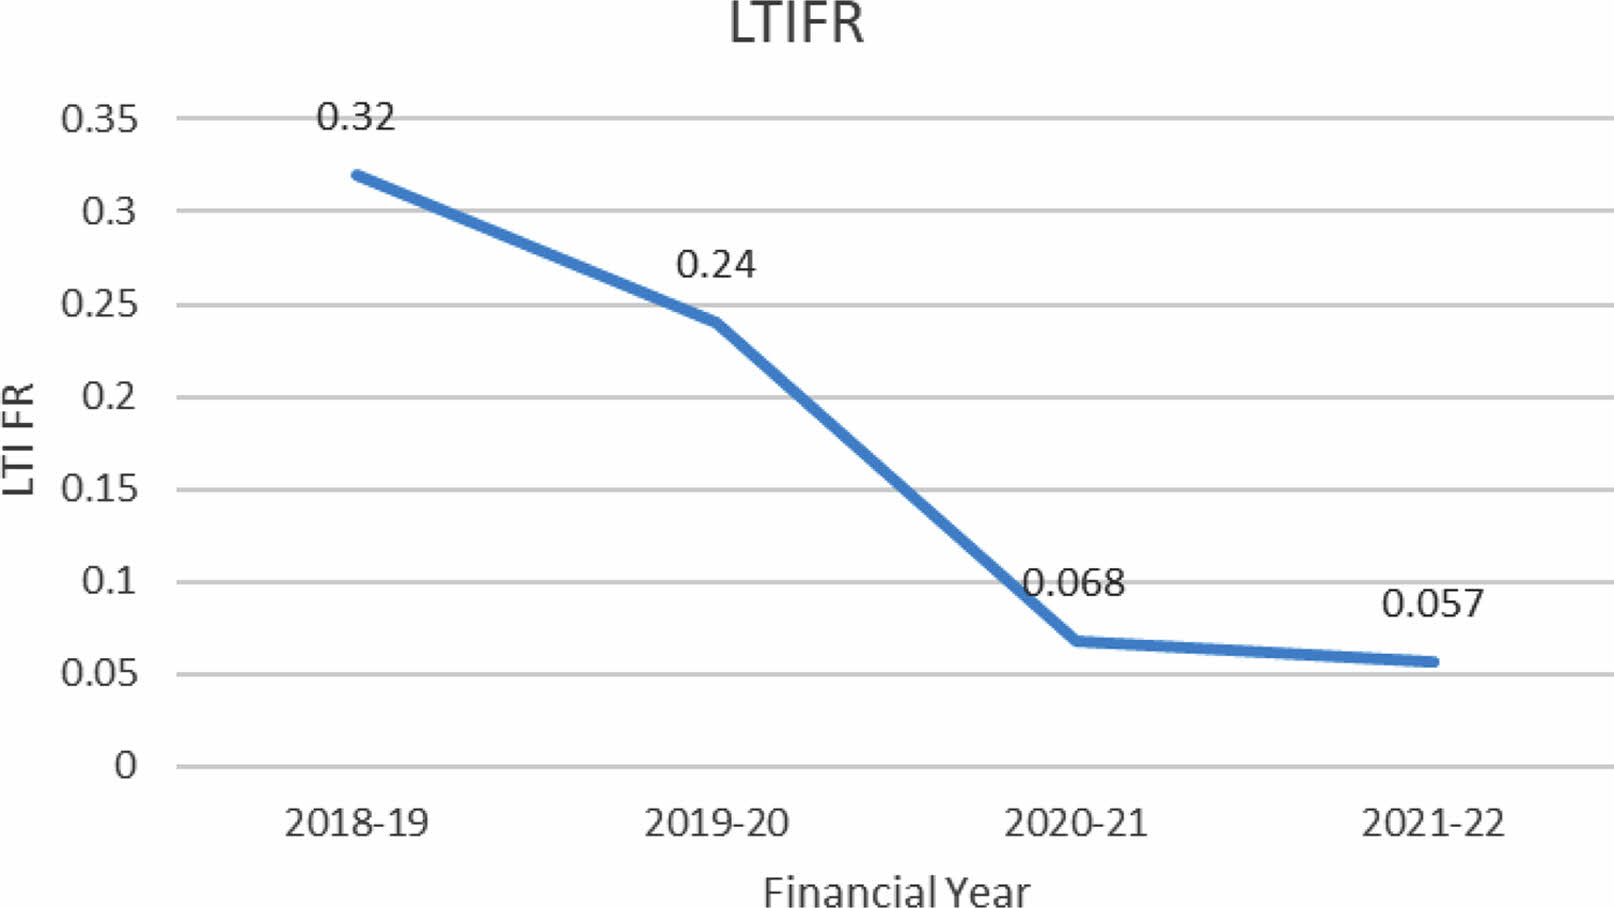
The loss time incident frequency rate (LTIFR) showed a drastic improvement with decreasing trend across the organization (Fig. 11). The LTIFR is a frequency rate of LTI incidents per million man hours worked. The graph indicates that in the year 2018-19 the LTIFR was 0.32 which reduced to 0.24 in the year 2019-2020 and further to 0.068 in the year 2020-2021. This was again sustained at the value of 0.057 in the year 2021-2022 hence indicating that the incident frequency rate has reduced to a reasonably acceptable value that has stabilized in the organization.
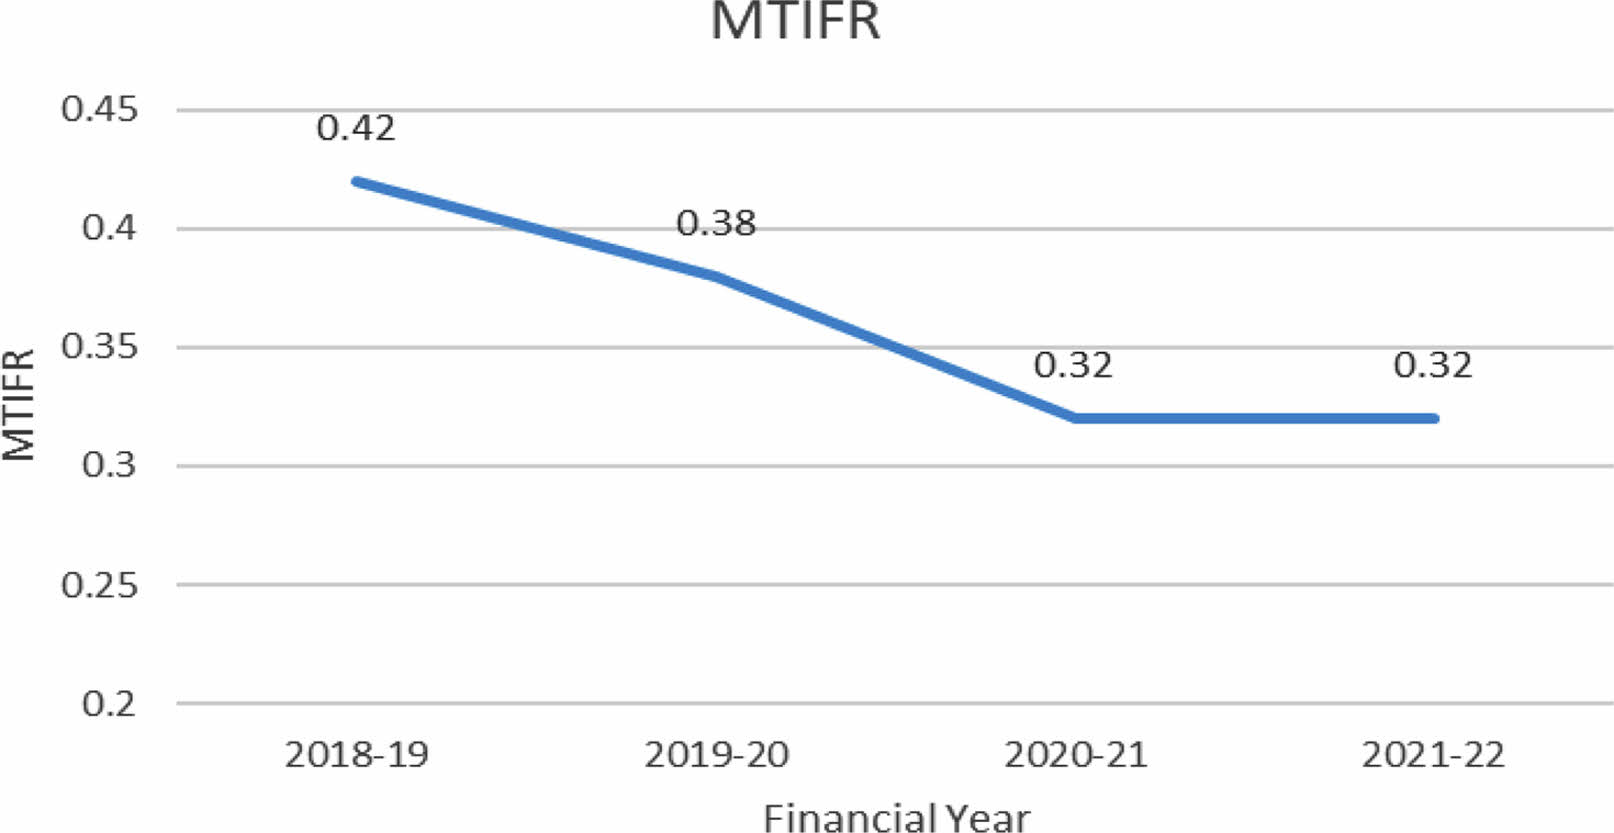
The medical treatment incident frequency (MTIFR) showed a drastic improvement with it getting almost at a stability rate (Fig. 12). MTIFR again is a frequency rate of medical treatment cases per million man-hours worked. Here again the graph indicates that the frequency rate has stabilized to an optimum benchmarking level and that the company focus should be to maintain it and further focus should shift to controlling the first aid and near miss.
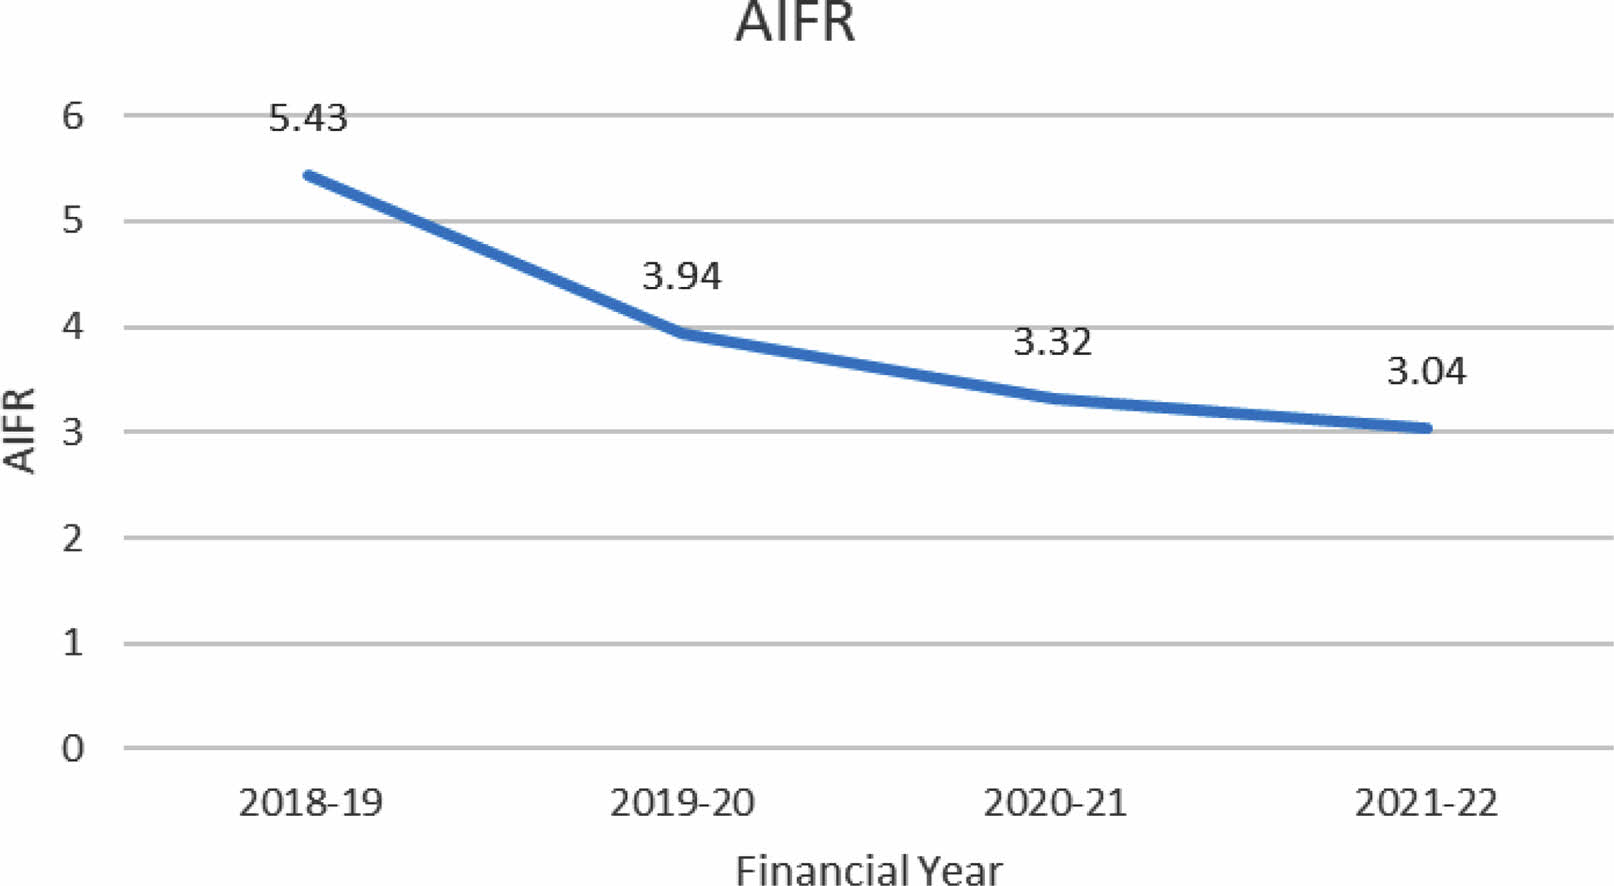
All incident frequency rate (AIFR) showed a drastic improvement with it coming to a value close to 3 (Fig. 13). AIFR accounts to inclusion of all the incidents including the LTI, MTI, First Aid, Near Misses. Here comparing this graph with that of LTIFR and MTIFR indicates that both LTI and MTI incidents have reduced to optimum benchmarking level and now the focus should be on controlling the first aid cases and near miss incidents which shall further help to drive AIFR to a benchmarking and sustainable reduction level.
The safety perception survey or safety culture survey indicated the current stage of organization on cultural transformation phase (reactive, dependent, independent, interdependent). During the survey conducted in 2019, very few employees participated in the survey and the outcome showed that the organization is in reactive phase of culture where safety is being implemented forcefully or is enforced. This enforcement of safety management does not reduce the injury rate completely because the employees follow it fearfully at locations where they are monitored but may not follow it where monitoring or safety officers are not deputed. Hence, though there is reduction in injury rate but it is only marginal.
Various initiatives were taken up in organization as briefed in the paper, and then again, safety perception survey or culture survey was taken up in 2021 to understand the progress made in cultural transformation journey and the impact brought in by the initiatives taken up from 2019 to 2021. The survey showed that the cultural strength has shifted to an independent phase of safety culture where employees have started participating and taking leads in safety responsibilities. They understand their safety responsibilities and work towards safety of their workplaces.
In most industries, safety management is implemented based on the experience of the safety professionals in the organization. With the help of this research work, an industry specific tools were implemented that suited the maturity level of the organization, where were the need of an hour to bring cultural transformation. The safety perception survey or culture survey helped in understanding the maturity level and then deciding on correct tools to be deployed at different levels to uplift the safety standard of the organization.
|
Fig. 7 Number of LTI incidents per year. |
|
Fig. 8 Safety training man days. |
|
Fig. 9 Number of safety observations against financial year. |
|
Fig. 10 Near miss incidents reporting per year. |
|
Fig. 11 LTIFR per year |
|
Fig. 12 MTIFR per year |
|
Fig. 13 Injury Frequency Rate/year. |
There are many management systems available, but referring to present management systems industries who are in to critical and risky activities should develop their own customised and practical management system to bring the cultural transformation in the organization. So after stringent implementation of management system and looking towards the outputs of each initiatives and then analysing the improvements made in the safety performance of the organization, it is revealed that if proper tools are used for identification of gaps, if proper tools are used to strategize a practicable action plan, if proper tools are used for implementation of action plan and if proper tools are used to monitor the effectiveness of the action plan, it would definitely help in improving the effectiveness of the safety management of the organization and transform the cultural phases from reactive to dependent and then dependent to independent. Using the management system lead and lag parameters changes drastically and the reactive SHE culture has been transformed to dependent and from dependent to independent phase.
- 1. N.J. Duijm, C. Fiévez, M. Gerbec, U. Hauptmanns, and M. Konstandinidou, Saf. Sci. 46[6] (2008) 908-920.
-

- 2. M.F. Rebelo, G. Santos, and R. Silva, The TQM Journal 26[2] (2014) 143-159.
-
- 3. J.G. Sanz-Calcedo, A.G. González, O. López, D.R. Salgado, I. Cambero, and J.M. Herrera, Procedia Eng. 132 (2015) 140-145.
-
- 4. S. Väyrynen, Int. J. Qual. Res. 9[2] (2015) 231-242.
- 5. M. Koivupalo, M. Sulasalmi, P. Rodrigo, and S. Väyrynen, Saf. Sci. 74 (2015) 128-139.
-
- 6. I. Mohammadfam, M. Kamalinia, M. Momeni, R. Golmohammadi, Y. Hamidi, and A. Soltanian, J. Cleaner Prod. 127 (2016) 119-133.
-
- 7. V. Hajipour, H. Amouzegar, A. Gharaei, M.S.G. Abarghoei, and S. Ghajari, Saf. Sci. 133 (2021) 104993.
-
- 8. P. Amir-Heidari, R. Maknoon, B. Taheri, and M. Bazyari, J. Loss Prev. Process Ind. 44 (2016) 405-413.
-
- 9. D. Høivik, B.E. Moen, K. Mearns, and K. Haukelid, Saf. Sci. 47[7] (2009) 992-1001.
-
- 10. T. Kongsvik, G. Gjøsund, and K.M. Vikland, Saf. Sci. 81 (2016) 81-89.
-
- 11. G. Bureika, L. Liudvinavičius, G. Vaičiūnas, and G. Bekintis, Eksploatacja i Niezawodność 15[4] (2013).
- 12. M.A. Oz, O.T. Kaymakci, and A. Koyun, Eksploatacja i Niezawodność 19[1] (2017).
-
- 13. R. BRiš, and O. GRunt, Eksploatacja i Niezawodność 17[4] (2015) 582-590.
-
- 14. D. Ahsan, S. Pedersen, M.R.B. Nielsen, and J. Ovesen, Renewable Energy 136 (2019) 691-700.
-
- 15. E. Albrechtsen, Energy Procedia 24 (2012) 313-321.
-
- 16. R. Proskovics, G. Hutton, R. Torr, and M.N. Scheu, Energy Procedia 94 (2016) 45-52.
-
- 17. T. Baalisampang, R. Abbassi, V. Garaniya, F. Khan, and M. Dadashzadeh, Process Saf. Env. Prot. 128 (2019) 259-272.
-
- 18. J. Liu, Z. Lu, Y. Zhou, J. Zhang, and G. Lyu, J. Ceram. Process. Res. 24[2] (2023) 285-307.
-
- 19. M. Duryan, H. Smyth, A. Roberts, S. Rowlinson, and F. Sherratt, Accid. Anal. Prev. 139 (2020) 105496.
-
- 20. N. Umeokafor, A. Windapo, and K. Evangelinos, Saf. Sci. 118 (2019) 379-388.
-
- 21. W. Dang and H.Y. He, J. Ceram. Process. Res. 21[1] (2020) 69-74.
-
- 22. G. Kalaiyarasan, S.C. Yi, and B.I. Sang, J. Ceram. Process. Res. 23[6] (2022) 934-945.
-
- 23. M. Mapar, M.J. Jafari, N. Mansouri, R. Arjmandi, R. Azizinezhad, and T.B. Ramos, Sustainable Cities Soc. 60 (2020) 102164.
-
- 24. A. Gasparatos, M. El-Haram, and M. Horner, Environ. Impact Assess. Rev. 28[4-5] (2008) 286-311.
-
- 25. R.M. Choudhry, D. Fang, and S. Mohamed, Saf. Sci. 45[10] (2007) 993-1012.
-
- 26. T. Al-Mughanam and V. Tirth, J. Ceram. Process. Res. 24[2] (2023) 359-366.
-
- 27. H. Kim, T.S. Jeong, and T.S. Kim, J. Ceram. Process. Res. 23[2] (2022) 132-136.
-
- 28. M. Jasiulewicz-Kaczmarek, K. Szwedzka, and M. Szczuka, Procedia Manuf. 3 (2015) 4876-4883.
-
 This Article
-
2023; 24(4): 662-674
Published on Aug 31, 2023
- 10.36410/jcpr.2023.24.4.662
- Received on Apr 17, 2023
- Revised on May 12, 2023
- Accepted on Jun 12, 2023
Services
- Abstract
introduction
challenges in ceramic industry
material & methods
results and discussion
conclusions
- References
- Full Text PDF
Shared
Correspondence to
- D. Senthilkumar
-
Department of Mechanical Engineering, Sona College of Technology, Salem, Tamilnadu, India
Tel : +91 427 4099999 - E-mail: dskumar33@gmail.com
Clean-Energy Research Institute(CRI), Hanyang University, 222, Wangsimni-ro, Seongdong-gu, Seoul, 04763, Korea
E-mail: jcpr@hanyang.ac.kr