


- Study of microstructural and mechanical properties of Aluminium LM14 hybridized with reinforcement of Nanoparticles of Titanium Diboride and Alumina
C. Sailajaa,*, K.T. Thilaghamb, K.T. Anandc, P. Ganeshand, Sathish Kannane, A.H. Seikhf and A. Ghoshg
aDepartment of Mechanical Engineering, Bangalore College of Engineering and Technology, Bangalore, Karnataka 560099, India
bDepartment of Metallurgical Engineering, Government College of Engineering, Salem, Tamil Nadu 636011, India
cDepartment of Mechanical Engineering, Panimalar Polytechnic College, Chennai, Tamil Nadu 600029, India
dDepartment of Mechanical Engineering, Sri Eshwar College of Engineering, Coimbatore 641202, Tamil Nadu, India
eDepartment of VLSI Microelectronics, Saveetha School of Engineering, Saveetha Institute of Medical and Technical Sciences, Chennai - 602105, Tamilnadu, India
fMechanical Engineering Department, College of Engineering, King Saud University, Riyadh 11421, Saudi Arabia
gDepartment of Applied Science, University of Quebec at Chicoutimi, Saguenay, QC G7H 2B1, CanadaThis article is an open access article distributed under the terms of the Creative Commons Attribution Non-Commercial License (http://creativecommons.org/licenses/by-nc/4.0) which permits unrestricted non-commercial use, distribution, and reproduction in any medium, provided the original work is properly cited.
The reinforcing impact of TiB2 nanoparticles (TiB2np) and alumina nanoparticles (Al2O3np) in an aluminum (LM14) alloy base matrix composite was studied. Stir casting was used to create the hybrid aluminum matrix-based nanocomposites (AMNC) specimens. When nanoparticles are mixed into a matrix, the resulting material is stronger than LM14 aluminum alloy. The results of the EDAX and SEM studies clearly illustrate the distribution of reinforcing particle sizes. Compression and density tests on AMNC specimens are contrasted with those on LM14 aluminum alloy tests. The increase in their mechanical characteristics is influenced by the proportion of reinforcements in the matrix phase. Nanocomposites based on an aluminum matrix outperform the metal in terms of compressive strength, density, and abrasion resistance
Keywords: Stir casting, Wear resistance, Reinforcements, TiB2 nanoparticles, Compression strength, Nano alumina particles
Aluminum alloy is extensively used in aviation and automation owing to its high specific strength, less thermal coefficient of expansion, and highest corrosion resistance RSM method to examine the mechanical and tribological properties of a functionally graded aluminium hybrid composite [1]. The impact of AlN particles on the AA6351 aluminium alloy's microstructure, mechanical, and tribological behavior. The mechanical impacts of nanofillers and experiences with nanocomposite are discussed in [2]. Mechanical characteristics and tribological behavior in AA5754/AA5083 joint by adding B4C ceramics utilizing PFSSP [3]. Increased durability is achieved by incorporating alumina and TiB2 reinforcements into the aluminum alloy primary matrix [4]. Using a Taguchi Grey Relational Approach, the aging, coating temperature, and reinforcement ratio on the biosilica toughened in-situ Al-TiB2 metal matrix composite was optimized and examined how alumina and graphene affected the Al-7075 hybrid composite's mechanical and tribological behavior [5]. AMNC is preferred over aluminum due to its higher specific strength and resistance to wear and investigated the tribological behavior of a liquid metallurgy-produced composite made of aluminum, nano magnesium, and aluminium nitride [6]. This is made possible by adding a strengthening ingredient to the aluminum matrix AA7075 metal matrix composites' performance was assessed together with its microstructure using the RSM approach [7]. In this present study, aluminum LM14/alumina and titanium diboride composites were fabricated by the stir-casting technique to investigate the stir-cast AA6351/Si3N4 composites' microstructural and tribological properties [8]. SEM and EDAX analyses are conducted to verify the particle distributions and effects of hierarchical micro structuring on boron carbide composite toughness [9]. Compression and density measurements are examples of mechanical tests that reveal how increasing the reinforcing percentage in the matrix phase modifies properties like density and compression strength and examined the uniaxial and triaxial compressive characteristics of metal matrix syntactic foams [10, 11]. AMNC (Aluminum Matrix Nanocomposite) and aluminum alloy have some significant differences in their properties. AMNC has a higher strength-to-weight ratio than aluminum alloy, meaning it can withstand greater loads before deformation. It also has improved hardness and wear resistance compared to aluminum alloy, making it more durable in high-stress applications. AMNC also has better thermal stability, meaning it can maintain its mechanical properties at higher temperatures than aluminum alloy. This makes AMNC suitable for use in high-temperature environments. Another difference is that AMNC has lower thermal expansion than aluminum alloy. This means it is less likely to experience thermal distortion or warping when subjected to changes in temperature.
The use of aluminum alloy is preferred in aviation and automation due to its high specific strength, low thermal coefficient of expansion, and high corrosion resistance.
Nanoparticles of alumina and titanium diboride were added to the aluminum (LM14) alloy base matrix using stir casting to create hybrid aluminum matrix-based nanocomposite (AMNC) specimens.
The mechanical tests used in the study included compression and density tests, which were used to compare the properties of AMNC specimens with those of LM14 aluminum alloy.
For Al-SiC-Y2O3 hybrid nanocomposites, an experimental investigation to optimize the Electric Discharge Machining (EDM) parameters. The best parameters, including Current (I), Pulse on Time (PTon), and Pulse off Time (PToff), were determined using Grey Relational Analysis (GRA), and their effects on material removal (MR) and surface roughness were examined [12]. The manufacturing and improvement of dry turning of LM25 Aluminium Metal Matrix Composites (AMMCs) with reinforcement of 10% micro and nano Al2O3 ceramic particles were explored [13]. They used the Grey Relational Analysis (GRA) and Principal Component Analysis (PCA) techniques to obtain the best outcomes since the manufacturing process has a direct influence on the product's correctness. Al(OH)3 starting powders were transformed into high-quality uniax homogenous particles of nano-sized aluminum nitride (AlN) powder using the dynamic carbothermal reduction and nitridation (DCRN) process [14]. They used a modified rotary-type tube furnace with atmospheric control to carry out the carbothermal reduction process, continually rolling Al2O3 balls over the reactants. [14] With a focus on the use of several nano-materials on fiber textiles, including semiconductor materials like TiO2 and ZnO, as well as other metal nanoparticle materials like Au, Ag, Cu, and nano-clay, the use of TiO2 and noble metal nanoparticles in telematerials. They conducted in-depth research on the photocatalytic principle, modification method, fixing technique, and use of TiO2 in fiber textiles [15]. Ceramic composite materials use the chemical interaction between boron carbide (B4C) and titanium diboride (TiO2) during hot pressing. These materials have a boron carbide (B4C) matrix and a titanium diboride (TiB2) secondary phase. They employed a temperature of 1850 °C, a pressure of 35 MPa, and a vacuum environment for 60 min. They discovered that the addition of TiO2 had a favorable impact on the densification of B4C-TiB2 ceramic composites as well as the amount of TiB2 secondary phase [16]. 
Selection of Materials
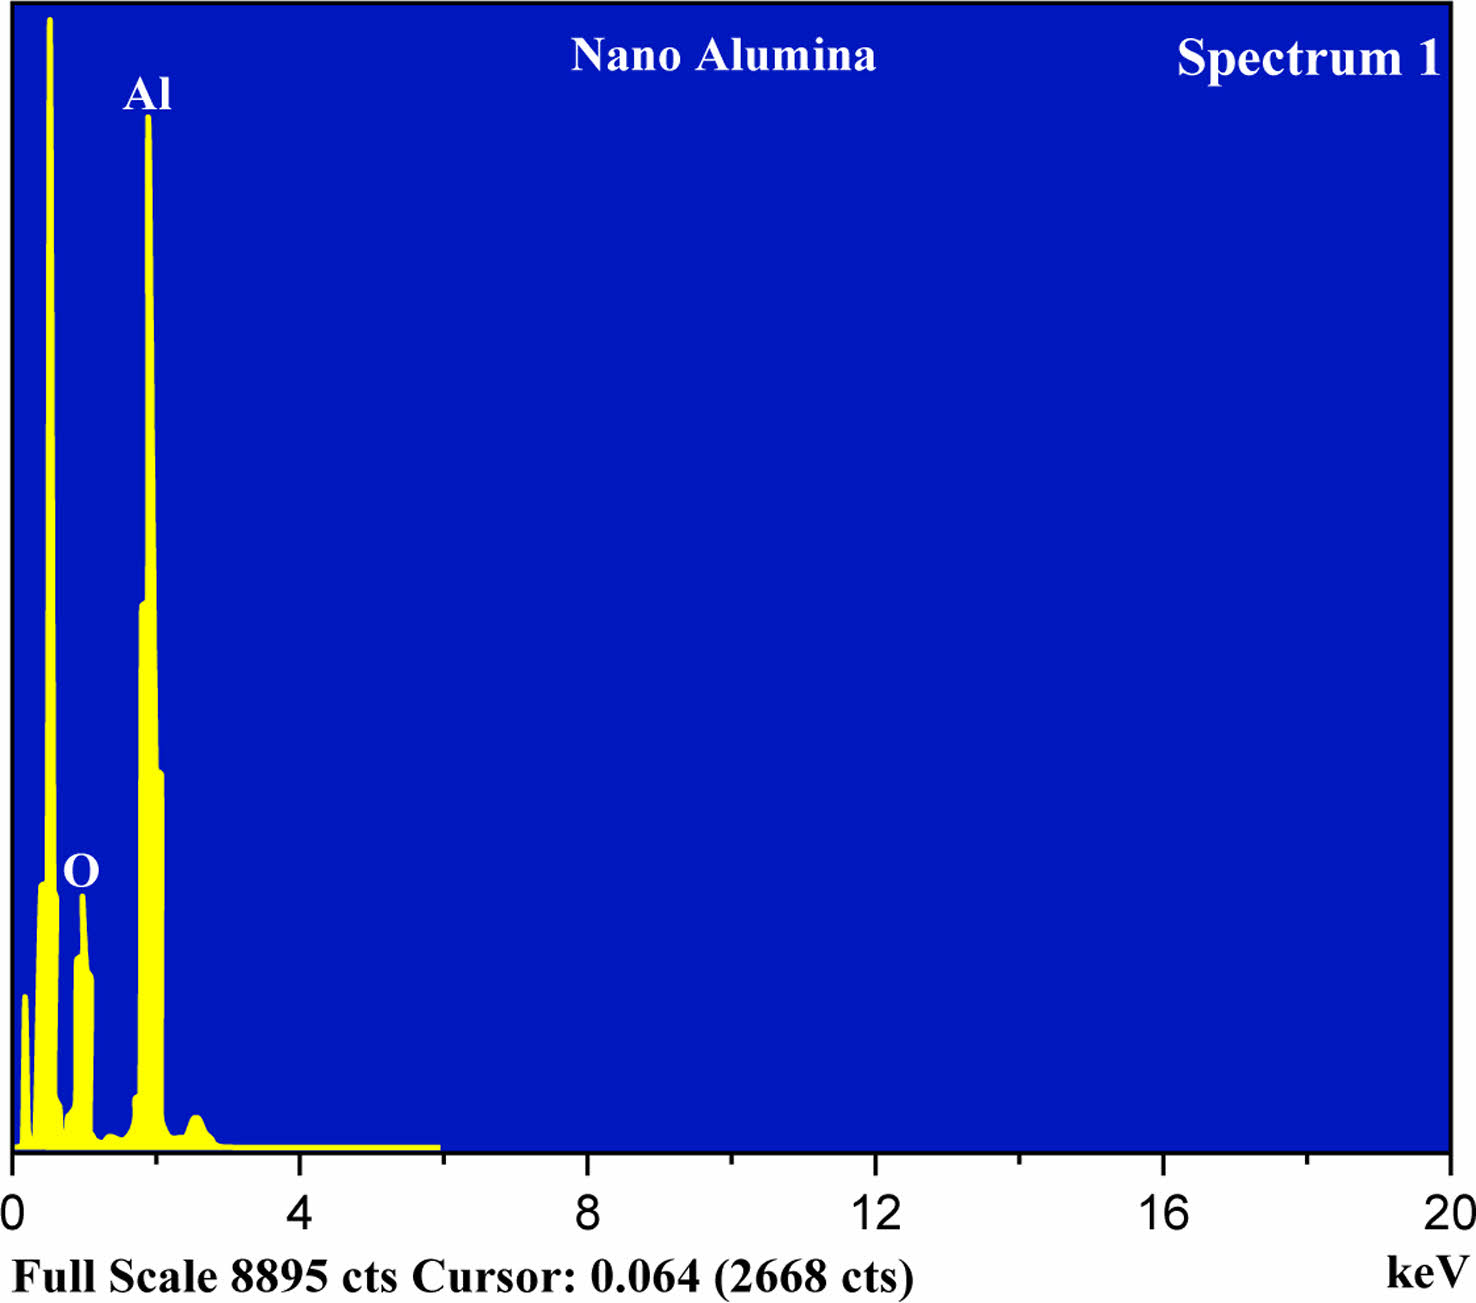
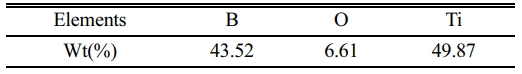
The LM14 aluminum is used to produce the AMNC specimen's matrix elements [23], The chemical composition of the aluminum ingot is listed in Table 1. AMNC samples can be fabricated with nanoparticles of alumina and TiB2 reinforcements The atomic composition of nano alumina and TiB2nano powder is determined using energy dispersive x-ray spectroscopy (EDAX) [24, 25]. The percentages of titanium, boride, Aluminium, and oxygen by weight in nanoparticles are shown in Table 2 and Table 3.
The chemical composition of the nano alumina powder was 53.28% aluminum and 46.72% oxygen, while the nano TiB2 powder consisted of 43.52% boride, 6.61% oxygen, and 49.87% titanium.
Preparation of Composite Specimen
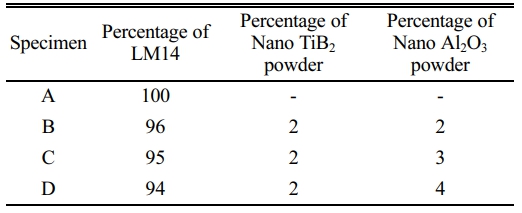
Table 4 details the relative weights of the alumina and TiB2 reinforcing materials used in the stir-casting process. Four stirrer blades of mild steel and a furnace make up the experimental setup. The 500 g of this metal matrix, made entirely of the weight fraction of LM14 aluminum ingot, is added to the furnace [26]. For the final mixing procedure, the furnace's temperature should be kept at 750 °C. By removing all of the air from the crucible, the degassers prevent the mixture's heat from dissipating too quickly into the surrounding air. The cylindrical die is filled with molten metals. Additionally, 2.5 wt.% of Al2O3 nanoparticles are retained within the furnace at the same temperature together with the 2.5 wt.% of TiB2 nanoparticles. The same processes are used to create specimens B, C, and D with an ultimate mixing temperature of 750 °C. Fig. 1 and Fig. 2 show the EDAX test results of nano-Al2O3 and TiB2.
The mixture's temperature can be maintained at a constant level by venting the crucible of unwanted gases and limiting heat loss. The aluminum alloy pieces are then fully melted in the furnace. The crucible of the furnace is stirred at the same time the material is poured into the required depth [27]. To ensure even distribution throughout the aluminum alloy matrix, the additive strengthening of nanoparticles of TiB2 and alumina is automatically stirred for 10 min at 750 rpm. Melted metal is poured into a die of the desired size, creating a cylindrical billet with dimensions of 20 mm in diameter and 300 mm in length.
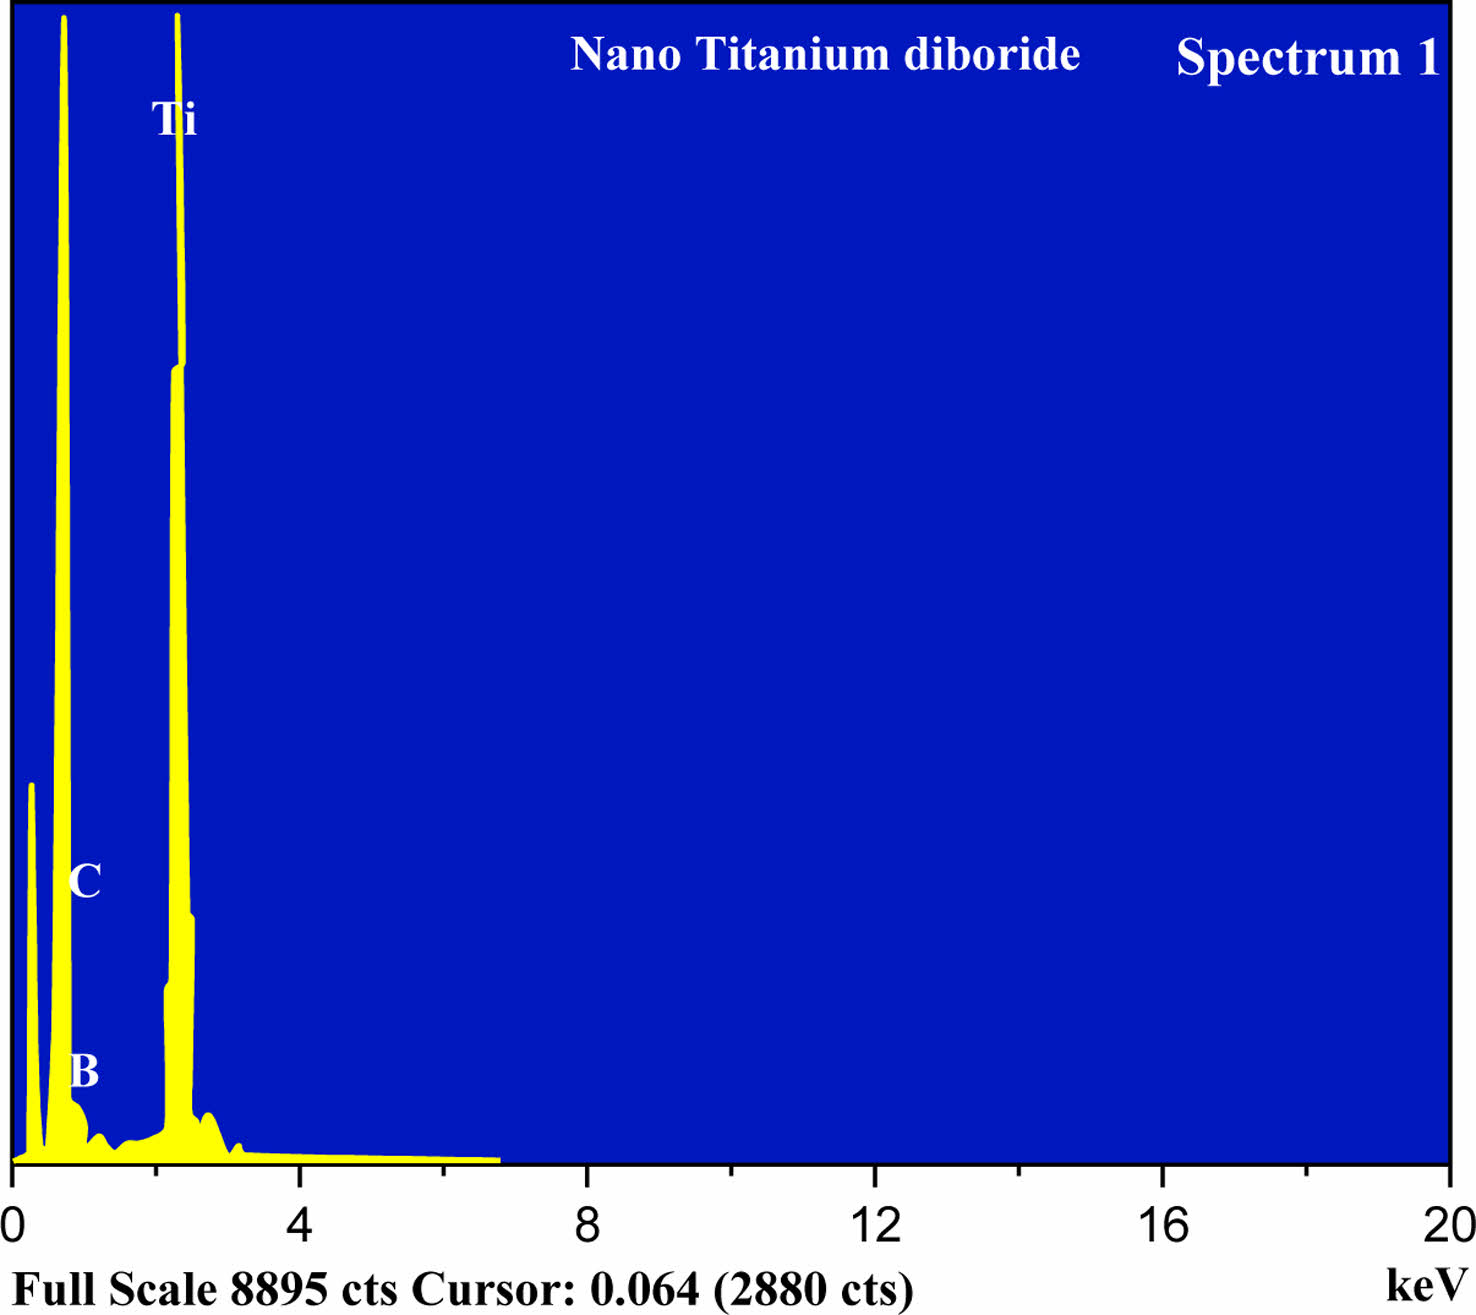
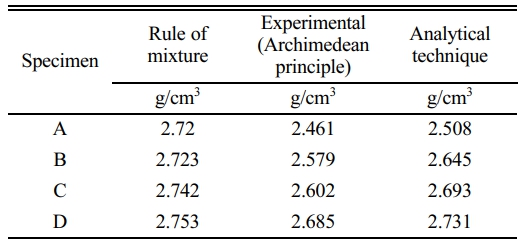
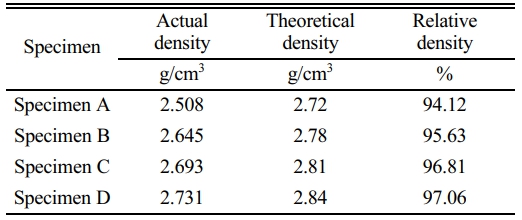
Archimedean principle for measuring actual density
According to Archimedes' principle, any item immersed in a fluid will experience a buoyant force acting upwards equal to the weight of the displaced fluid. Each of the four procedures (A to D) involves liquid water. To illustrate that the buoyant force exerted on a body is equivalent to the weightage evacuated in liquid, we can utilize the Archimedean principle through make an educated judgment about the actual density value of specimens A to D. Table 5 shows the findings from the density experiments. Fig. 3 shows the schematic of the density test.
Pure and AMNC specimen densities are indicated in Table 5. Improved density values were achieved for LM14 aluminum composite specimens A to D by increasing the proportions of nanoAl2O3 and TiB2 in the LM14 using the rule of mixture technique, the Archimedean principle, an analytic approach.
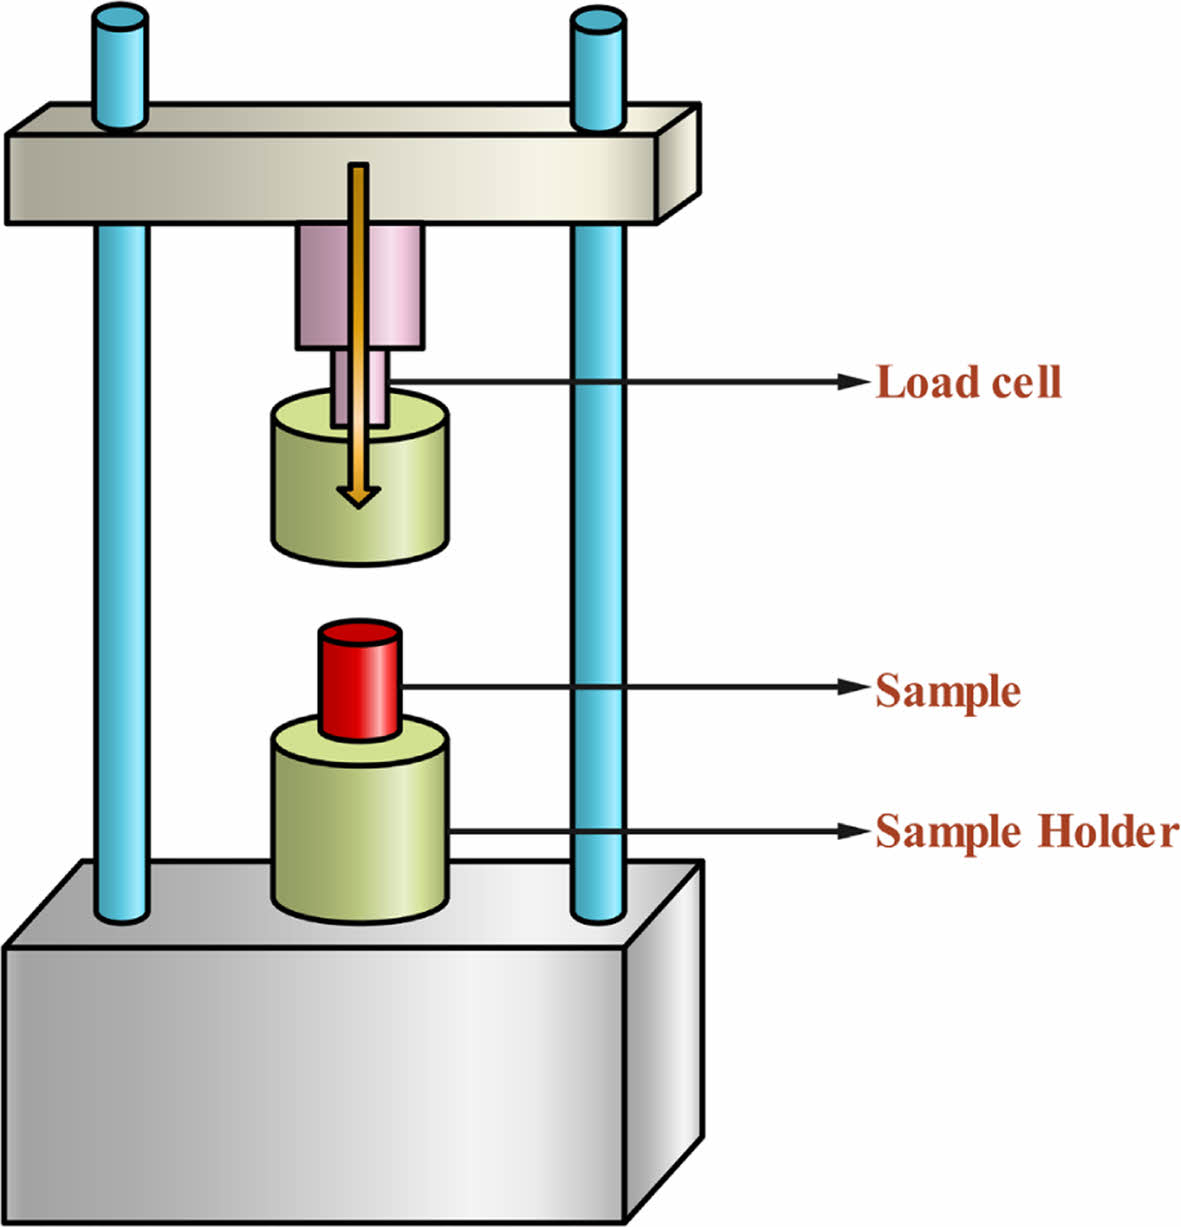
Compression test
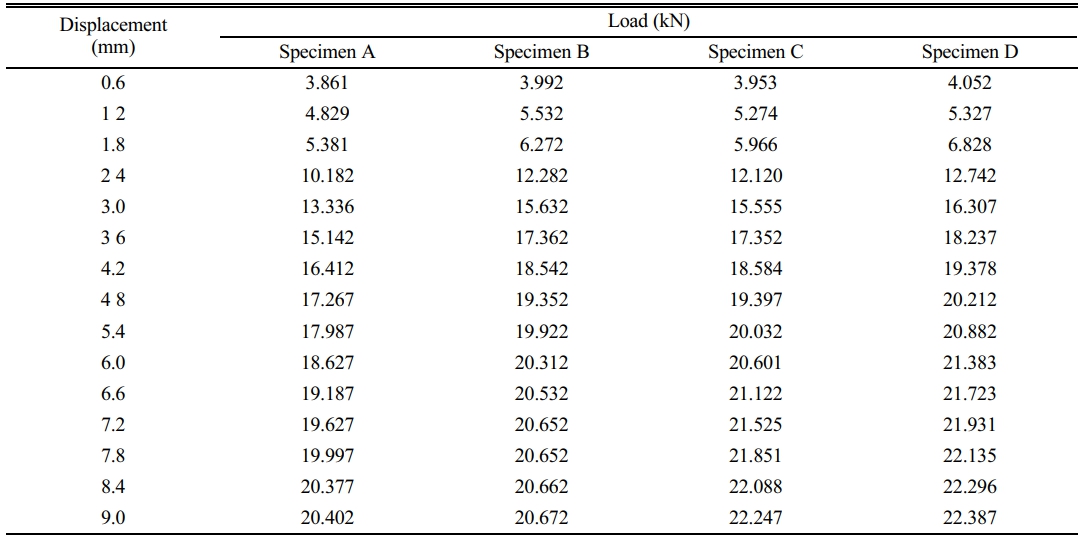
The resistance of a substance to pressures that cause it to contract is its compressive strength. By charting, stress against deformation was calculated. While some materials deform permanently when loaded to the point of breaking, others fracture near the limit of their compressive strength [28]. A universal testing device is frequently used to determine compressive strength. Fig. 4 shows the computer-controlled compressive testing machine. The specimen is 20 mm in length and 10 mm in diameter. The specimen is ground employing grit paper to prevent a tapered surface. They are positioned underneath the expire, and the degree of interaction was examined. The specimen is subjected to compressive stresses until a fracture develops. Table 6 displays the variations in displacement for samples A to D as a load function. The linear variable displacement transducer in the compression testing apparatus may automatically detect displacement changes and communicate this information to the connected computer. The compression test software then produces values. The stress value on the graph, as illustrated in Fig. 5, is automatically derived from the displacement value.
The purpose of grinding the specimen with grit paper is to create a smooth and flat surface on the specimen. This is necessary to ensure accurate and consistent measurements during mechanical tests such as compression testing. A smooth and flat surface allows for better contact between the specimen and the testing apparatus, reducing the potential for errors due to uneven or inconsistent pressure points. It also helps to remove any surface irregularities or imperfections that may affect the mechanical properties being measured.
The displacement of the specimen during the compression test is typically measured using an extensometer. An extensometer is a device that attaches to the specimen and measures changes in its length as the load is applied. The extensometer can provide both axial and transverse displacement data.
The axial displacement is measured along the vertical axis of the specimen and is used to determine the deformation behavior of the material, including its elastic modulus, yield strength, and ultimate strength. The transverse displacement is measured perpendicular to the axial direction and is used to assess the material's shear behavior.
The extensometer is typically calibrated before the test to ensure that accurate displacement measurements are obtained. The data collected from the extensometer can be used to plot stress-strain curves, which provide valuable information about the mechanical properties of the material being tested.
|
Fig. 1 Testing for nano-Al2O3 powder using EDAX |
|
Fig. 2 EDAX test for nanoTiB2. |
|
Fig. 3 Archimedean principle-based density test. |
|
Fig. 4 Compression testing equipment with computer control. |
|
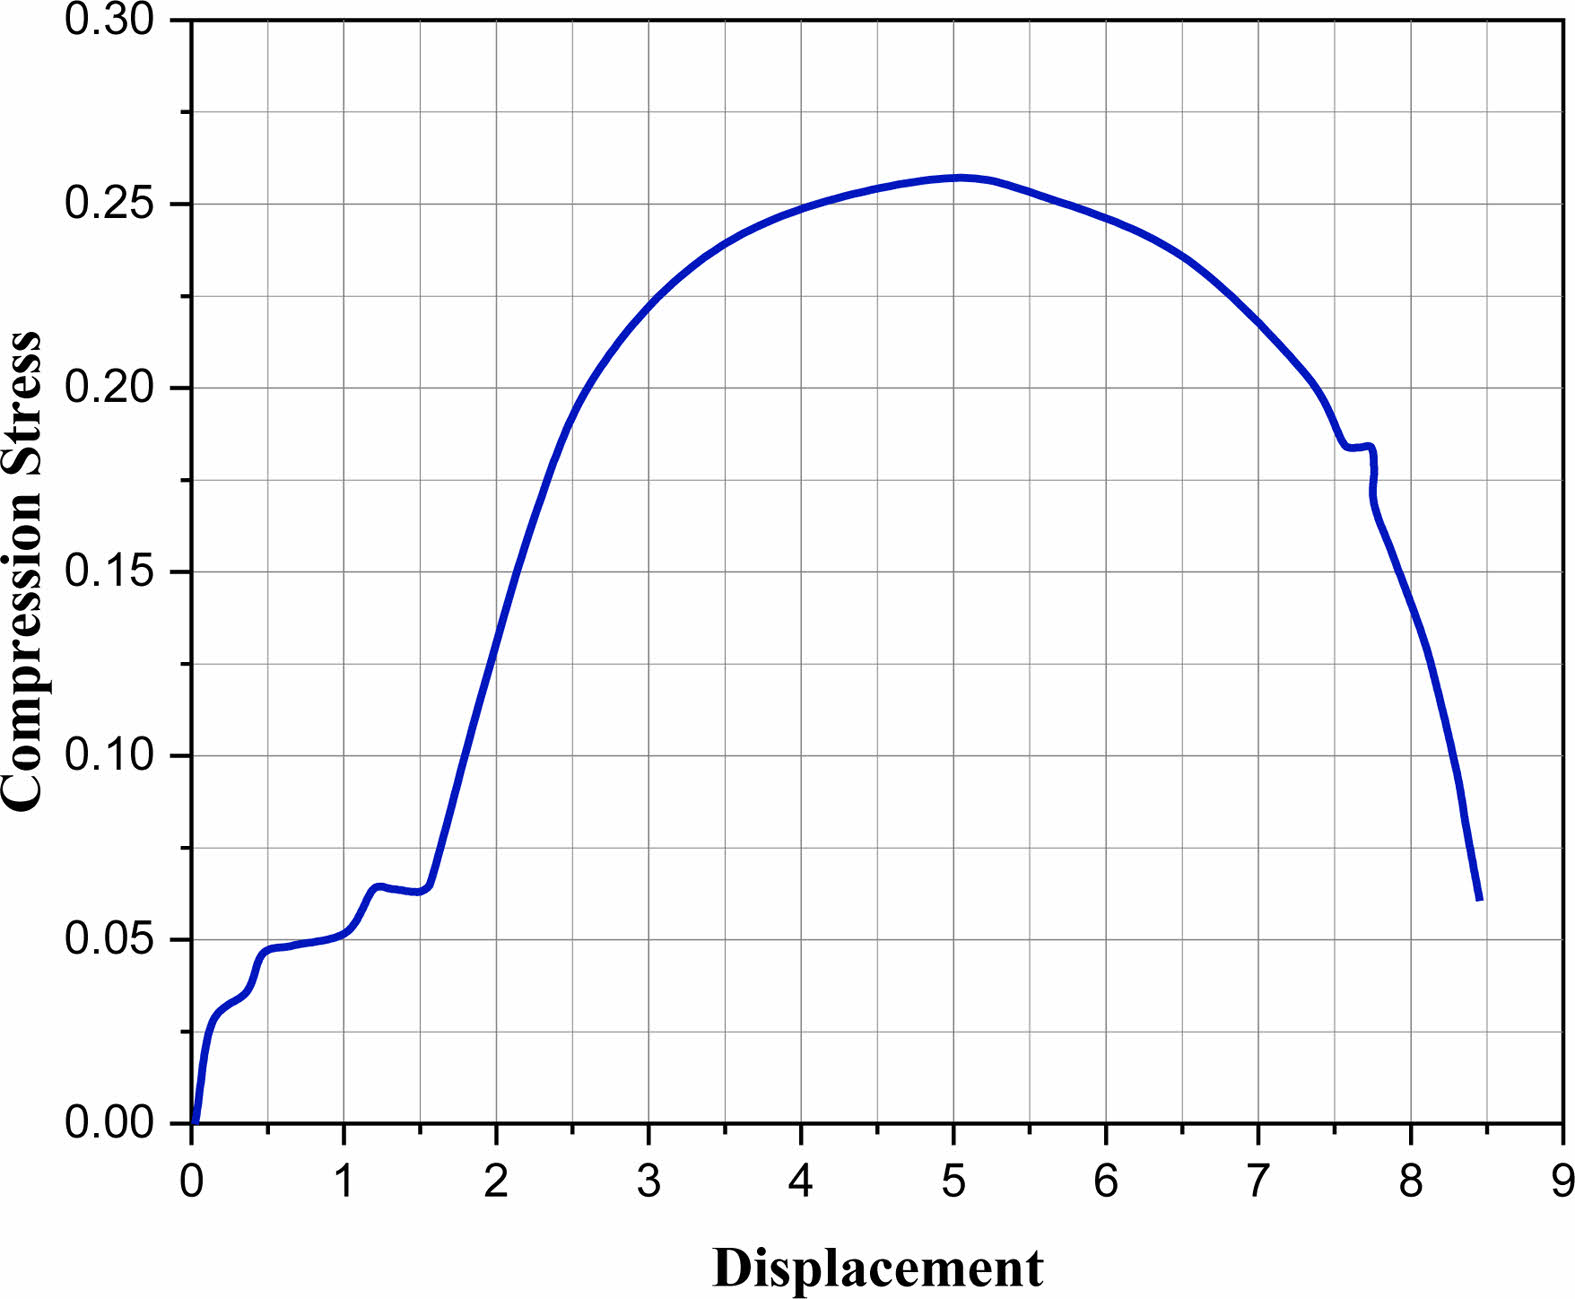
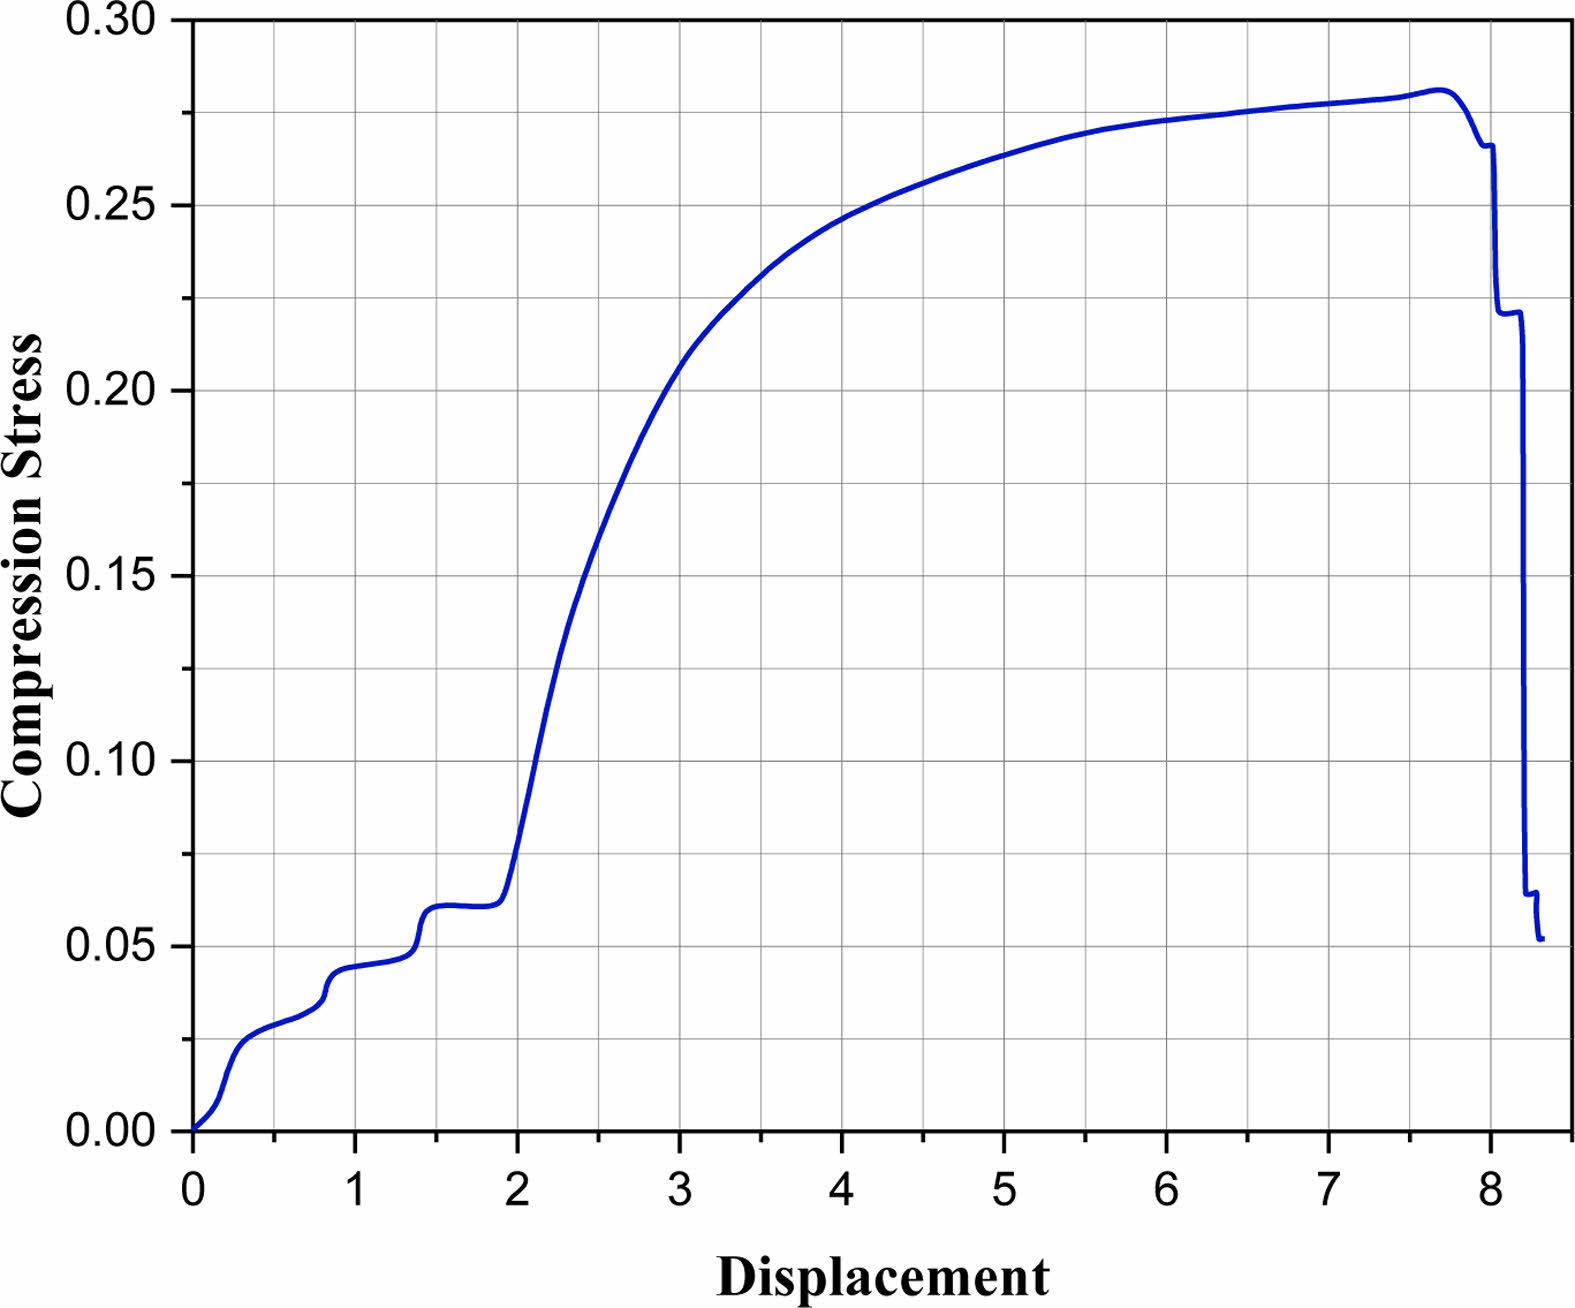
Fig. 5 Value of compression stress in pure specimen A with relation to the change in load-displacement. |


Density measurement analysis
Table 7 debits the results of relative density measurement. When the nanoparticles of TiB2 and Al2O3 composition change, the density continues to rise. Calculations are made to determine the relative and actual densities. The specimen's porosity will decrease as the relative density rises.
Relative density and porosity are inversely related, with higher density indicating lower porosity.
Analysis of Compressive Stress
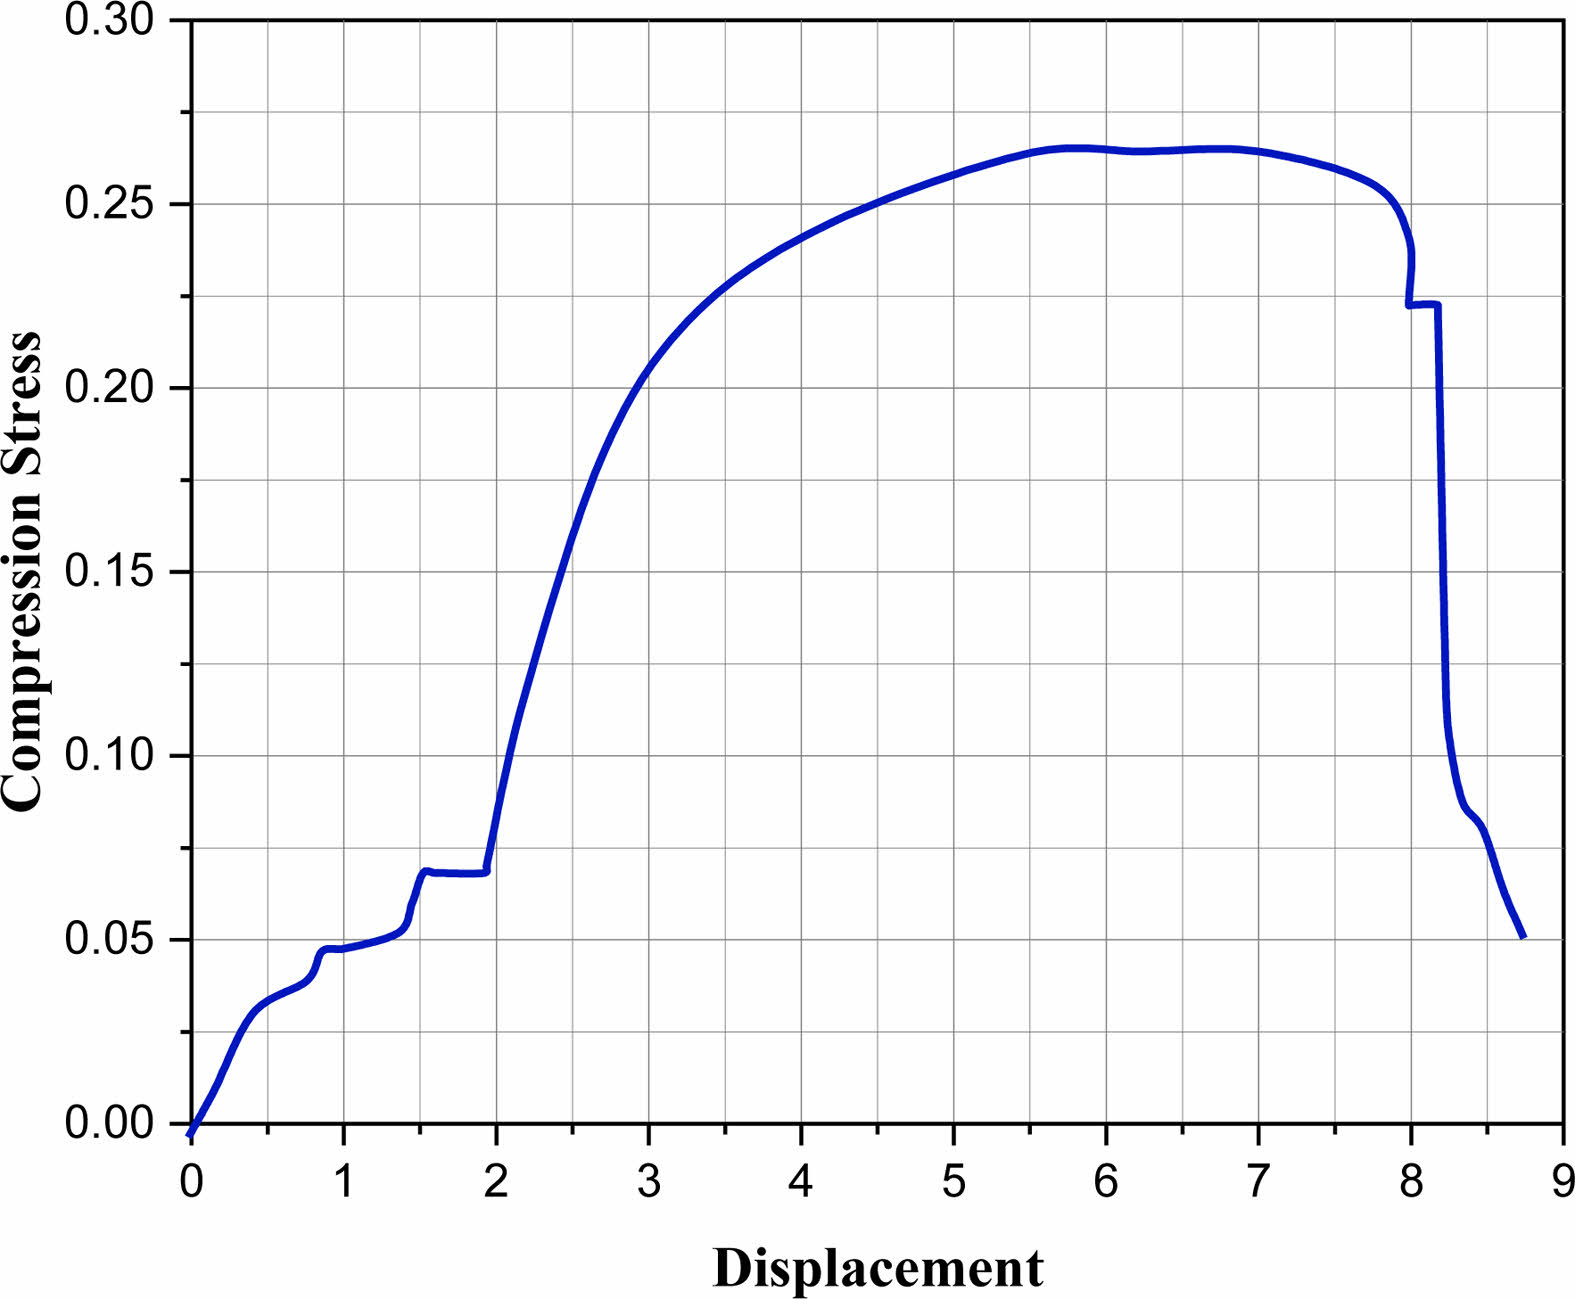
A pure sample of A was subjected to a compression test, the results of which are shown in Fig. 5. A peak load of 13.9 kN, resulting in a change in sample displacement of 4.840 mm, is sufficient to fracture materials at their compressive strength limit. Sample A experiences deformation under a load of 4.23 KN. Once the ultimate stress of 0.256 KN/sq.mm is applied to specimen A, the maximal displacement of 8.450 mm arises. Fig. 5 shows what happens when you use the ultimate force, displacement, and stress to sample A. Under the conditions described, cracks appear in Sample A.
The compressive strength limit is the maximum stress that a material can withstand under compression before it fails or breaks. It is usually expressed in units of force per unit area, such as pounds per square inch (psi) or megapascals (MPa). The compressive strength limit varies depending on the type of material and its composition, and it is an important factor in determining the material's suitability for specific applications.
Cracks appeared in Sample A at a load and displacement of 23.35 kN and 0.26 mm, respectively.
Figure 6 depicts the results of the compressive test performed on aluminum metal matrix nanocomposites specimen B. At a peak load of 19.65 kN, the sample displacement changes by 6.165 mm, indicating that the compressive strength limit has been reached. At a stress of 3.155 kilonewtons, specimen B begins to deform. The final stress on sample B is 0.255 KN/sq.mm, and the maximum displacement is 8.75 mm. Fig. 6 shows the maximum allowable displacement, load, and ultimate stress applied to specimen B before it breaks.
Figure 7 displays the results of a compression test performed on an AMNC specimen C. Materials shatter at their compressive strength limit when there is a change in a specimen of 7.65 mm at the maximum load of 21.245 KN. The C specimen also undergoes deformation due to applied stress of 3.955 KN. The maximum subsequent deviation of sample C is 8.725 mm at the stress of 0.275 KN/sq.mm. Breakage occurs in sample C when applied stress, displacement, and load are all at their limits.
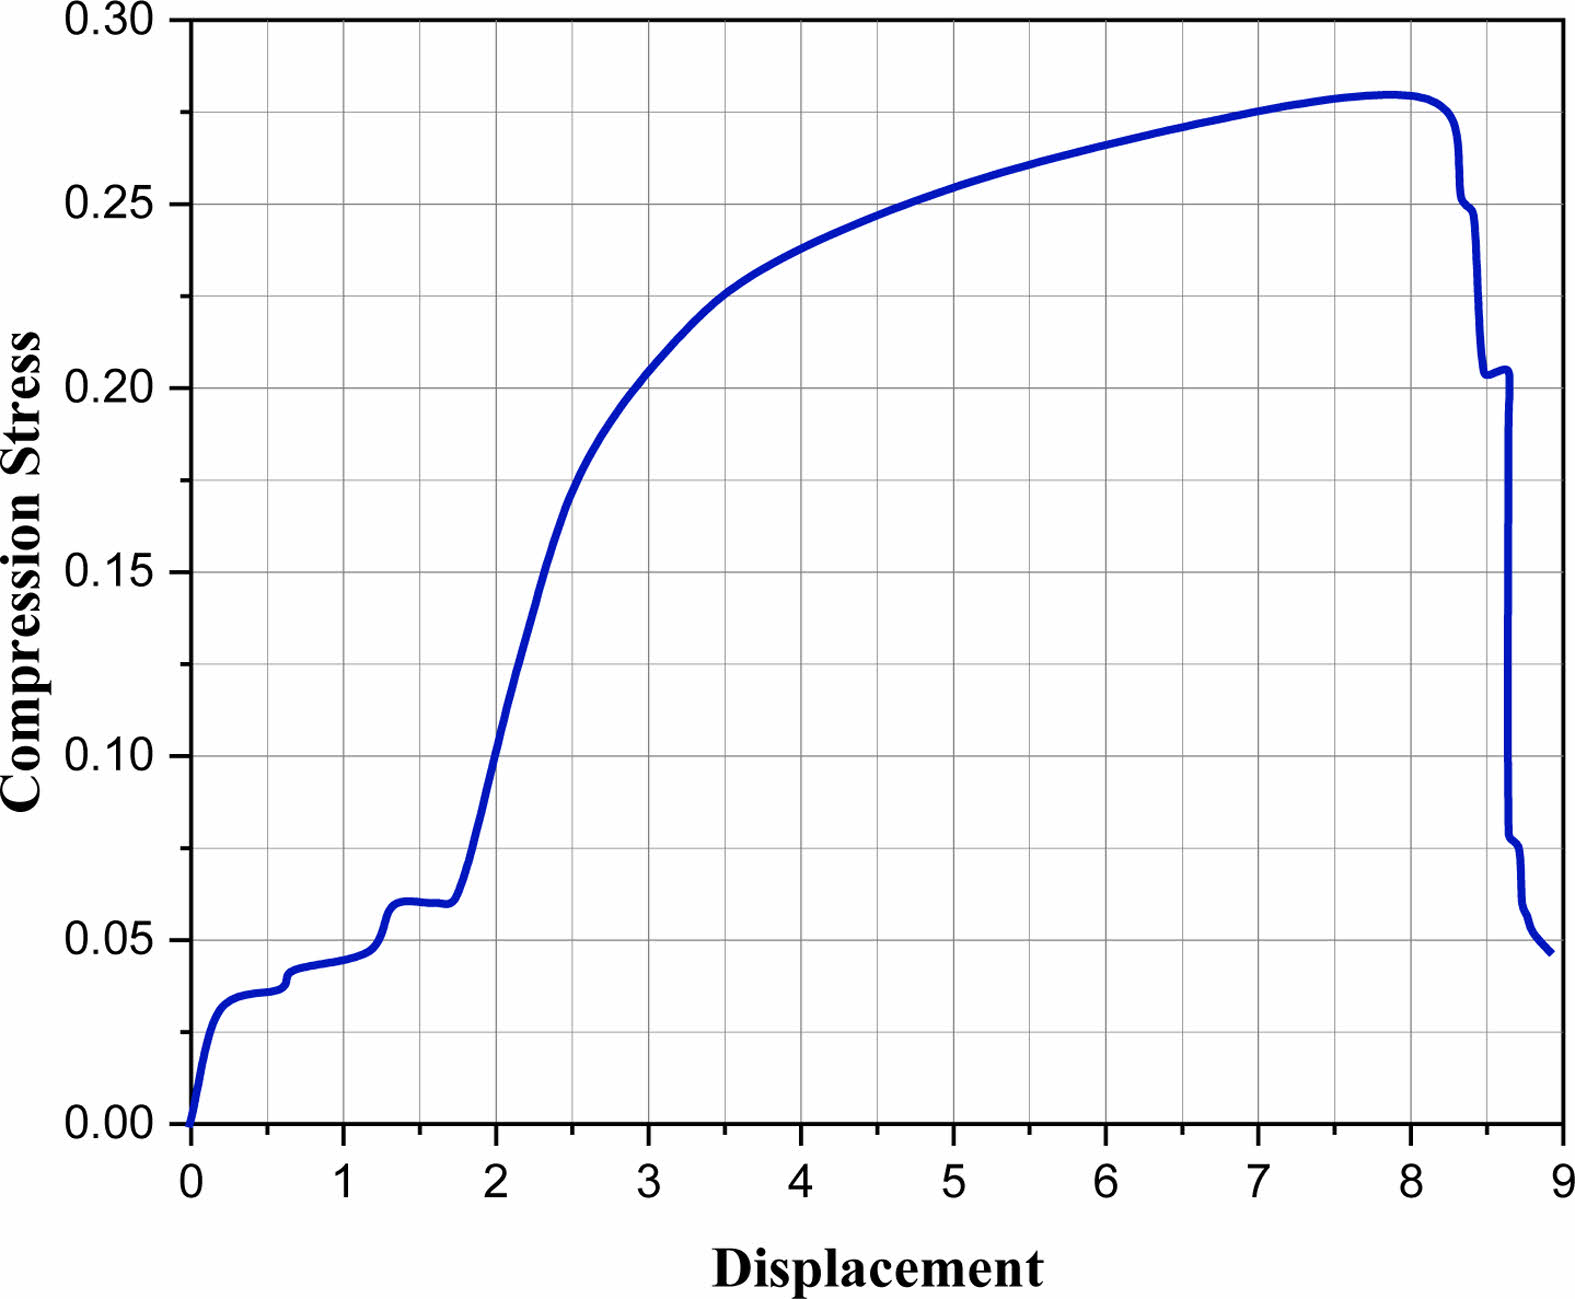
Test results for AMNC sample D's compression are displayed in Fig. 8. At peak stress of 21.385 KN, the material cracked at its compressive strength limit (in this example, a displacement of 7.45 mm in the specimen). Sample D is deformed at a force of 3.6034 kN. A maximum 8.265 mm deviation is seen in sample D when the ultimate stress is 0.277 KN/sq.mm. On display in Fig. 8 are the failure load, maximum displacement, and final stress experienced by specimen D.
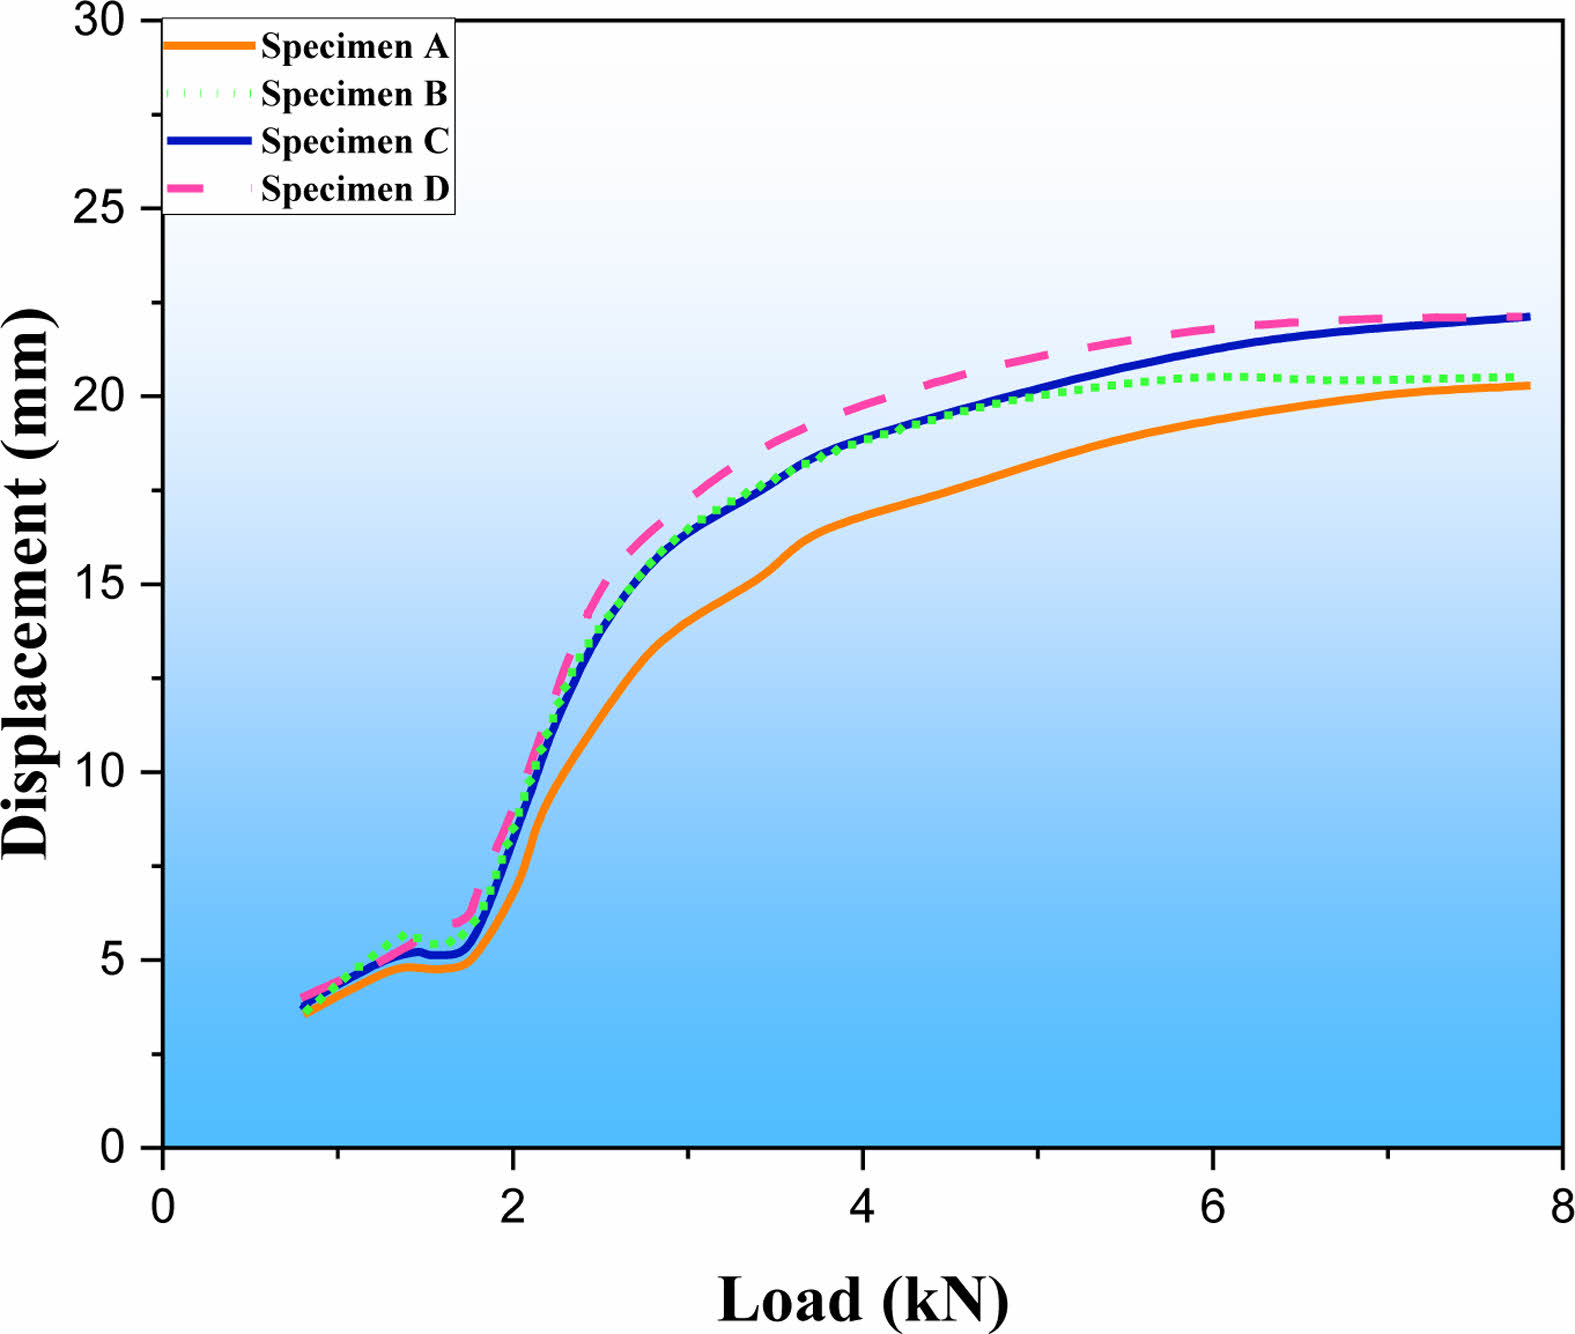
Figure 9 depicts how the specimen's displacement changed as the load was changed. Here, the maximum load-to-displacement ratio for sample A is 20.2 mm at 8.3 KN. Like specimens A, B, and C, specimen D is subject to a range of loads, with a maximum of 19.65 KN, 21.245 KN, and 21.385 KN, and a displacement range of 7.5 mm. The specimen's increasing tendency to alter load with subjected disintegration may be seen in their continuously increasing dislocation from A to D. In comparison to the other three AMNC samples, sample D exhibits a maximum applied load and a higher displacement overall.
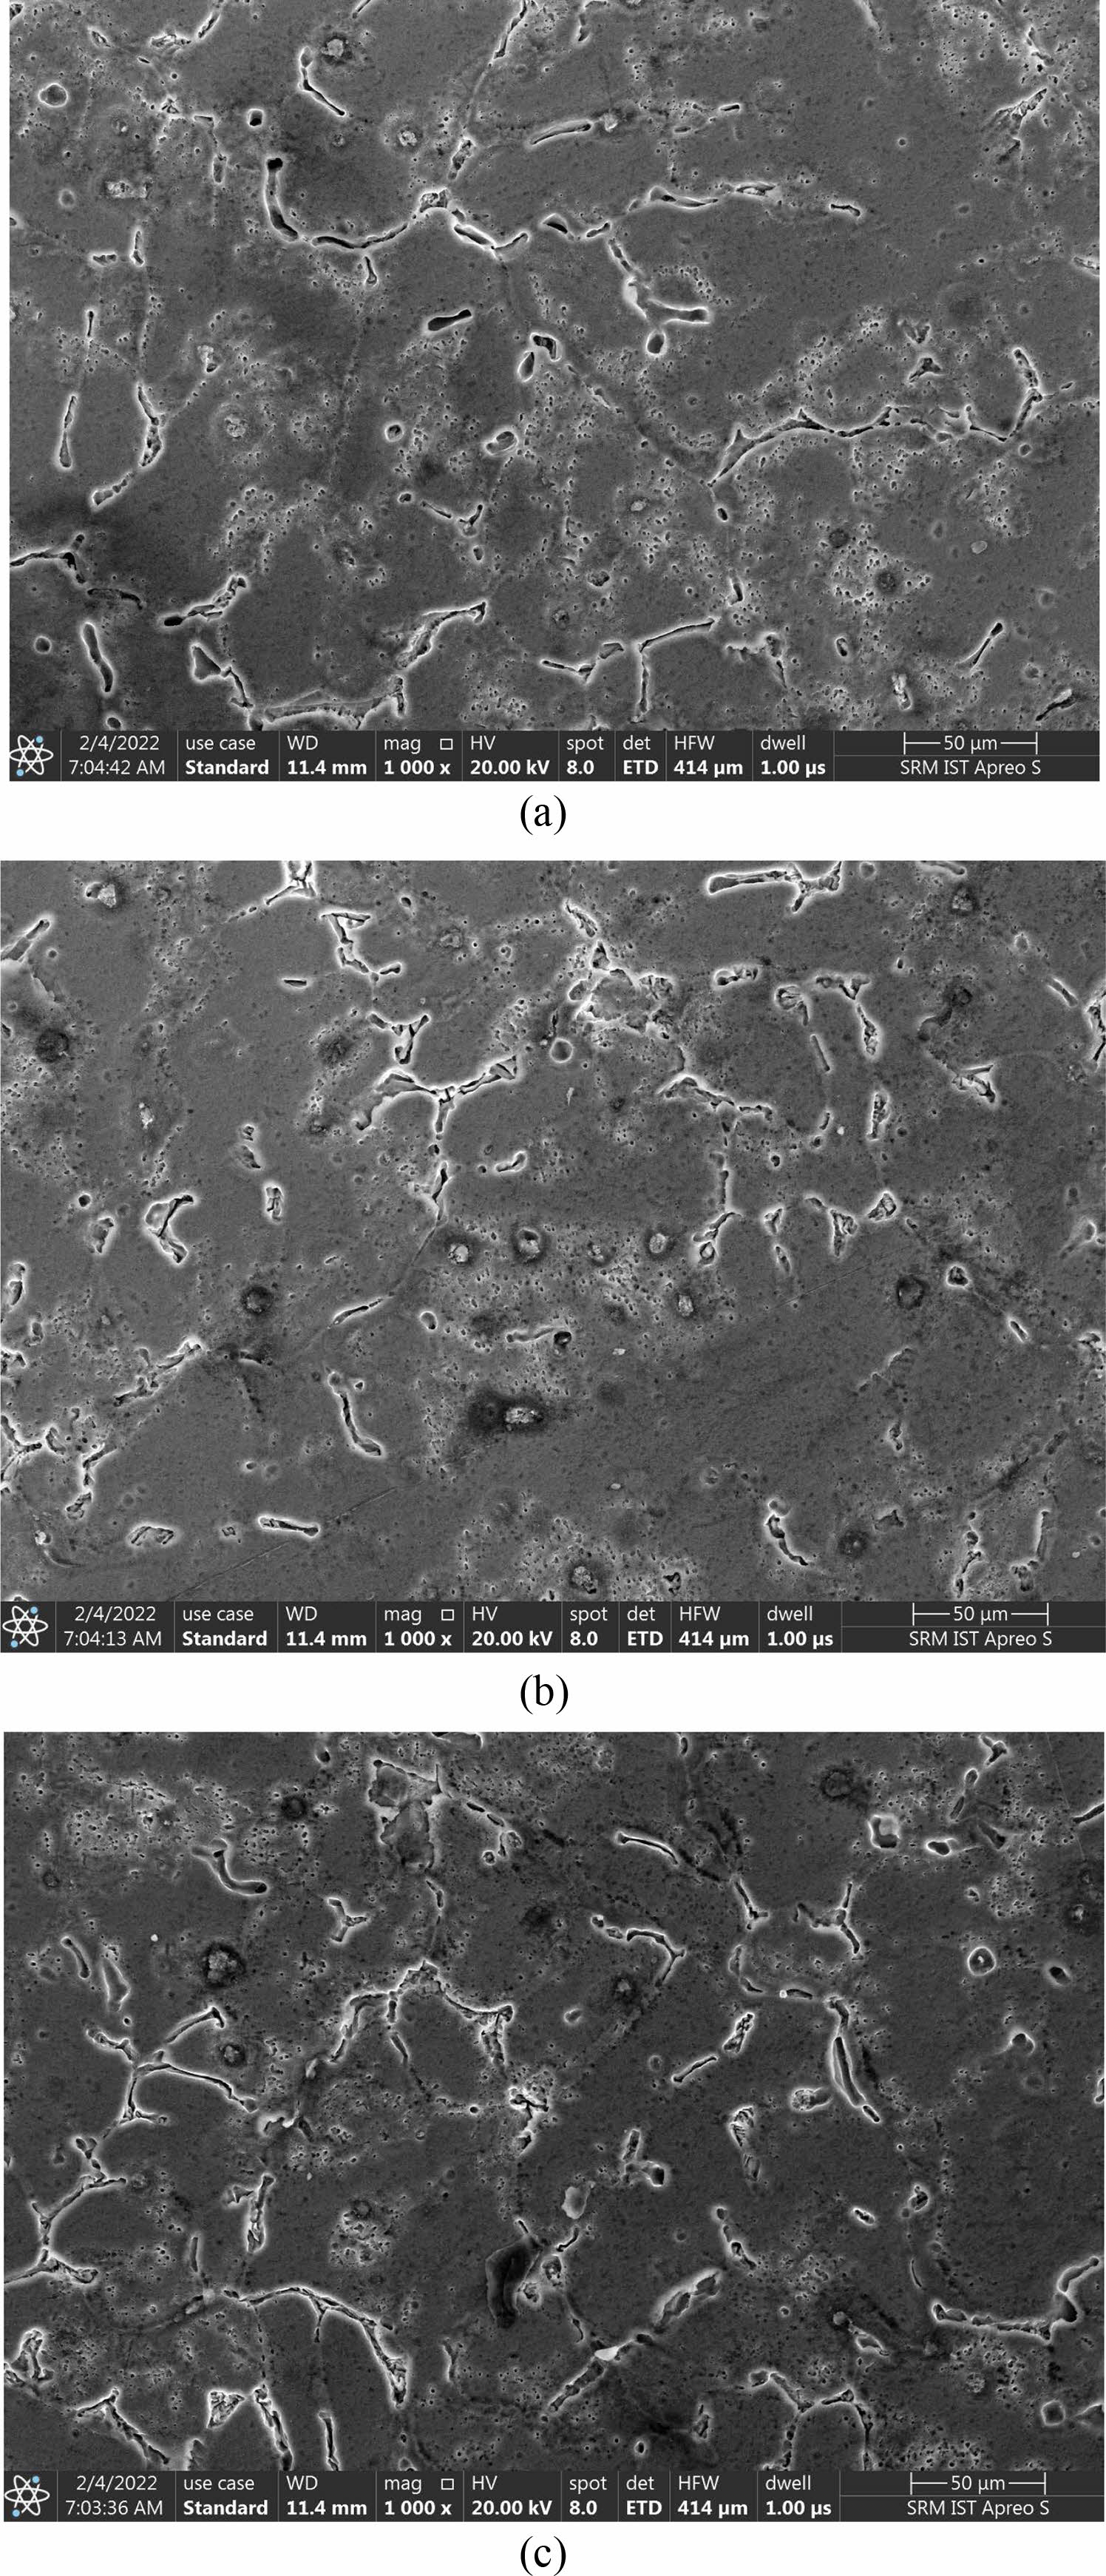
SEM analysis
Inspection with a scanning electron microscope reveals the arrangement of nanocrystalline aluminum alloy particles and the distribution of nanoparticles reinforcement in the base metal matrix of Aluminium composite material (specimens A to D) [29]. Titanium diboride is represented by the brighter particles, while aluminum is shown by the darker particles. Some porous particles can also be seen in the A specimen. Fig. 10(a) exhibits a substantial amount of porosity, while titanium di boride is present as smaller white-colored particles. Due to a gas blow of atmospheric air happening in sample B, the porosity is higher. In contrast, Sample C in Fig. 10(b) has a fractured surface with numerous microcracks and porous spots, which can be attributed to subpar composite fabrication and inappropriate stirring. Several pieces of Literature were studied in this research [30, 31].
Figure 10(b) displays sample C's microstructure. In contrast to samples, fewer debonding particles are visible. The microstructure of sample D is depicted in Fig. 10(c) demonstrates that compared to specimens A, B, and C, sample D has lower porosity due to the presence of titanium diboride in the smaller white color section of sample D.
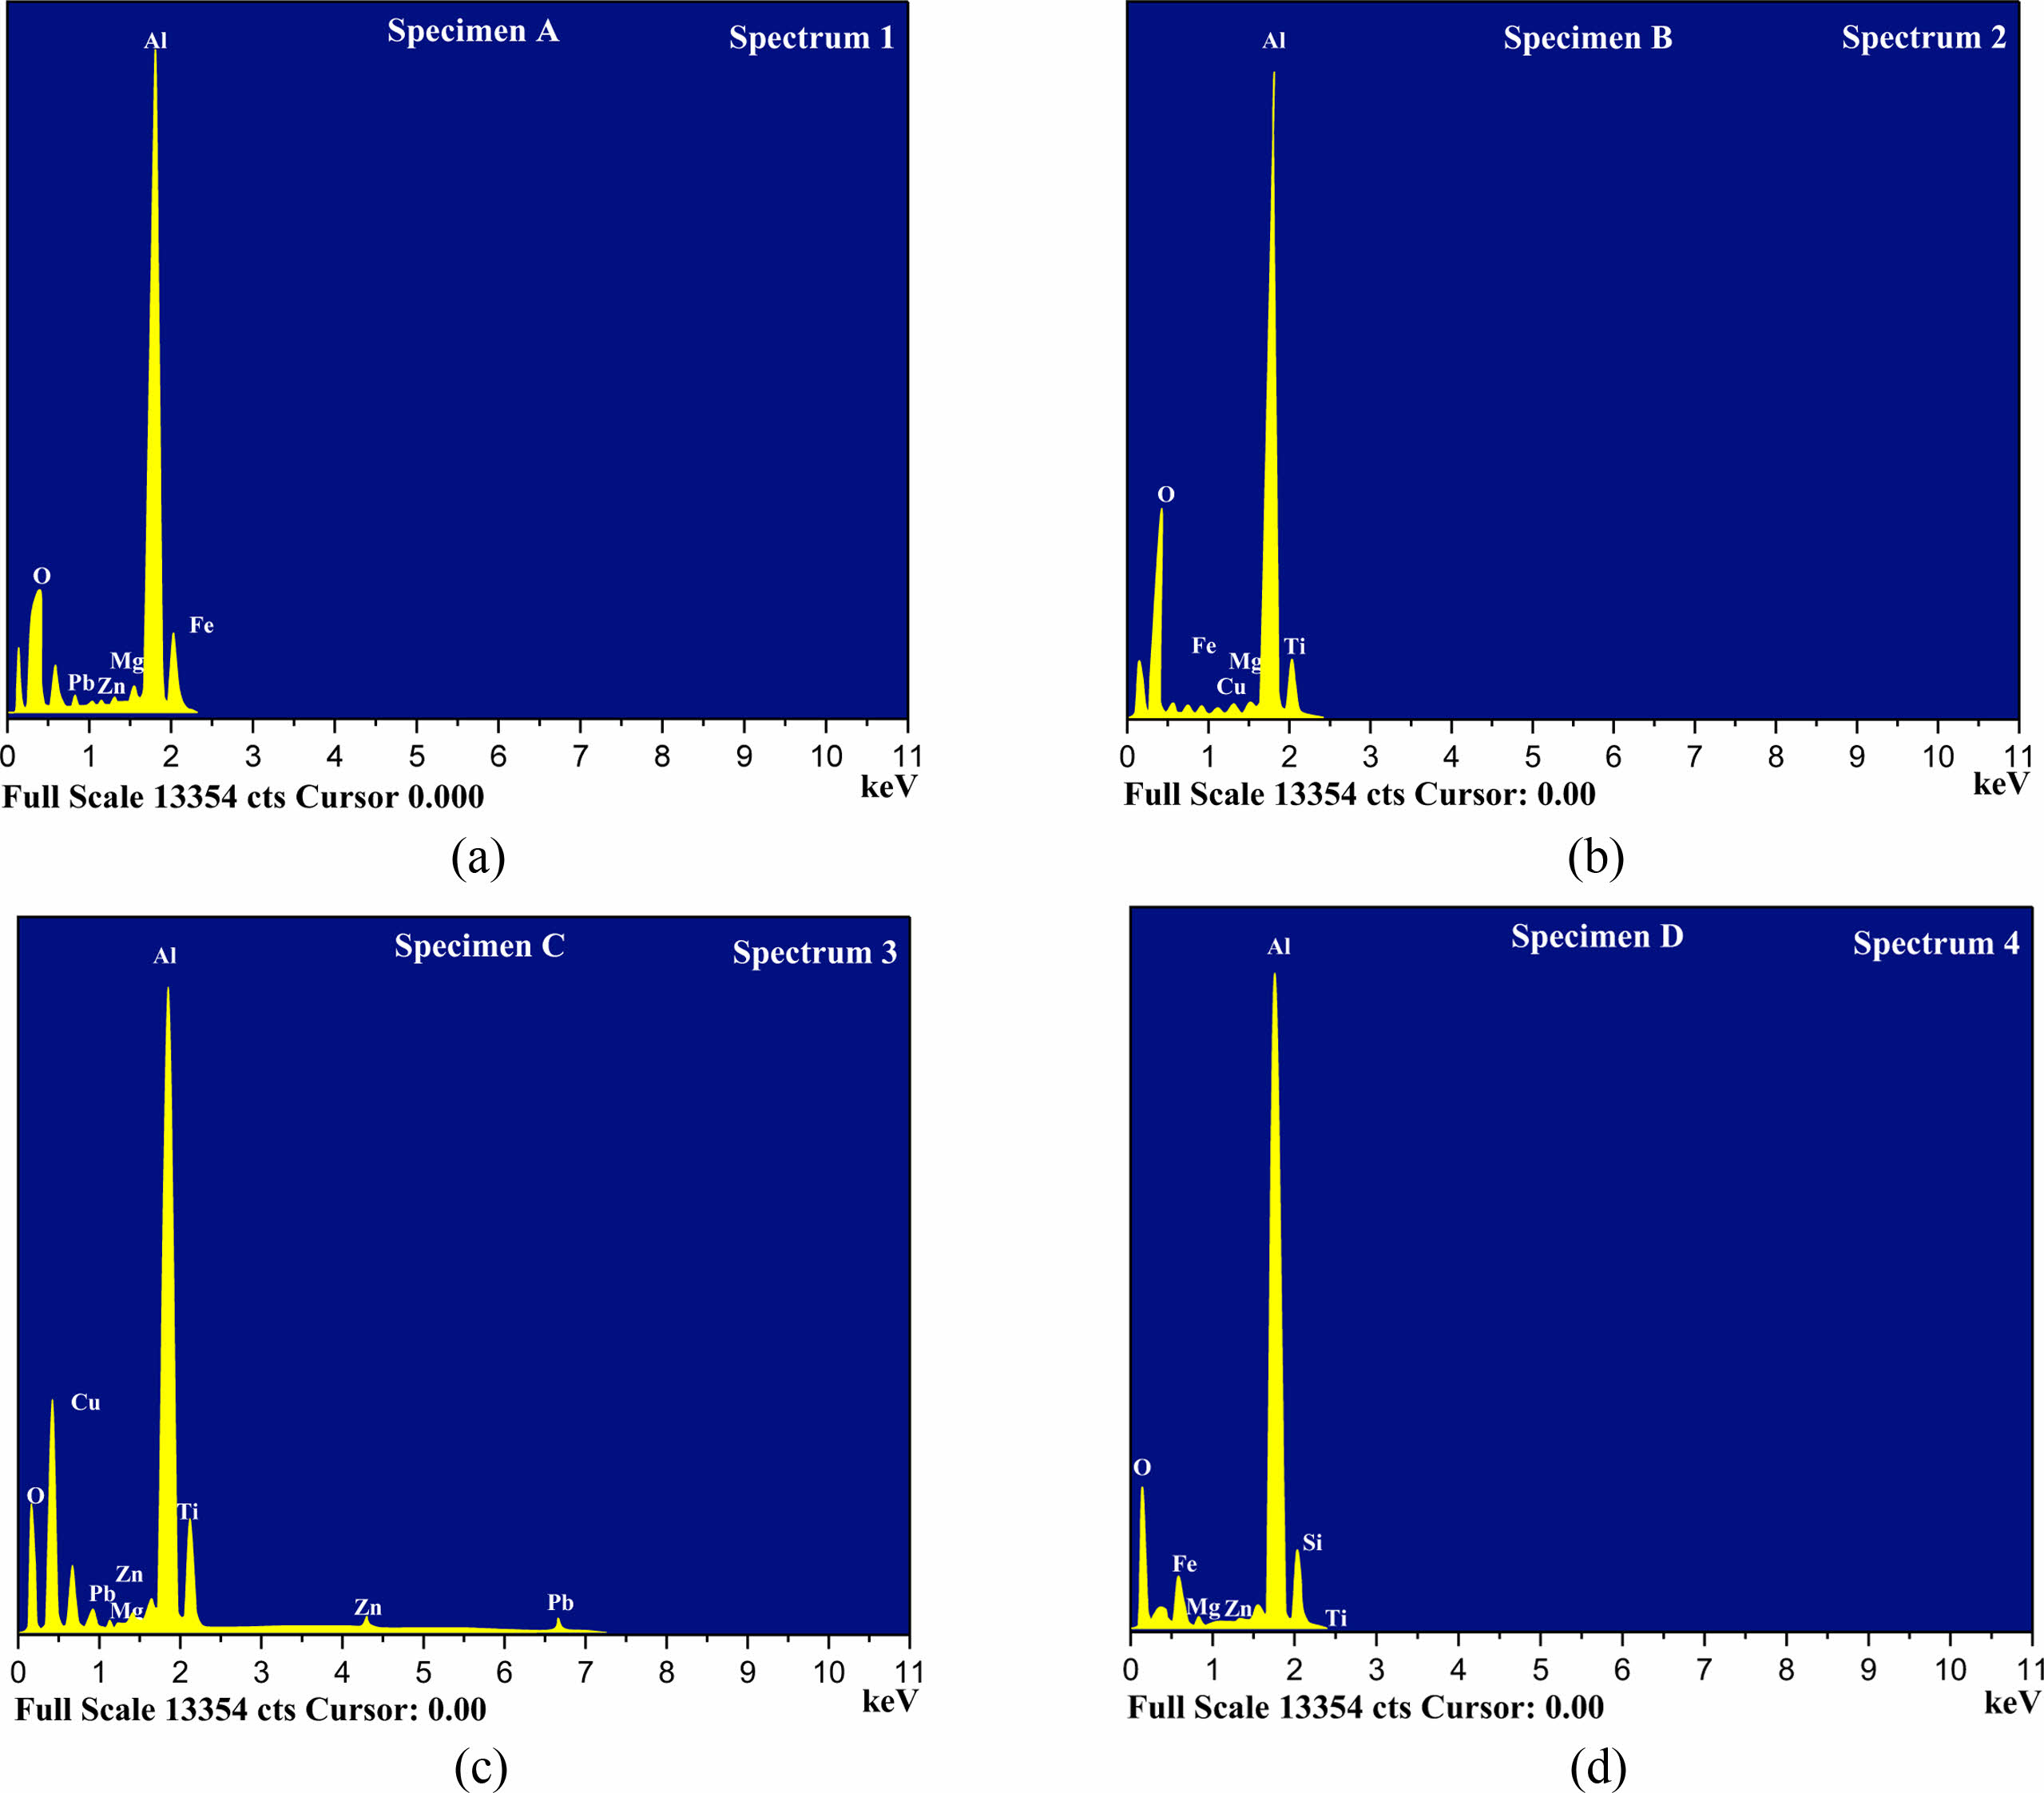
Particle dispersion for various specimens through EDAX analysis
The EDAX is used to determine the quantitative compositions and elemental analyses of the manufactured specimens A to D.
Table 8 shows that the manufactured sample A, shown in Fig. 11(a) as a rectangle at a size of 10 m, contains 78.06% aluminum by weight, 7.42% oxygen, 0.27% Lead, 1.42% iron, and 12.18% silicon. An SEM view of AMNC sample B's distribution of reinforcement particles is shown in Fig. 11(b). The EDAX determines the manufactured sample B's quantitative compositions and elemental analyses. According to Table 9, the Al makes up 83.03% of the total weight of the fabricated sample B, which is depicted in Fig. 11(b), together with 3.19% oxygen, 0.35% iron, 0.21% zinc, and 12.92% titanium.
Figure 11(c) and Fig. 11(d) show an EDAX determines the quantitative components and elemental analyses of the synthetic sample C and D. Table 10 details the primary composition of the constructed sample C, which is 83.3% aluminum, 4.16% oxygen, 0.29% magnesium, 11.54% copper, 0.14% Iron, and 13.17% titanium.
The EDAX determines the quantitative compositions and elemental analyses of the manufactured samples. Table 11 reveals that the produced sample D, depicted in Fig. 11(d), contains a majority of 77.15 wt.% of aluminum and 0.59 wt.% titanium, 7.12 wt.% Oxygen, 0.61 wt.% Magnesium, 14.16 wt.% copper, 0.13 wt.% Zinc and 0.34 wt.% of Lead.
|
Fig. 6 Evaluation of load-displacement and compressive stress related to specimen B. |
|
Fig. 7 Value of compression stress for AMNC specimen C with relation to change in load-displacement. |
|
Fig. 8 Value of compression stress for AMNC specimen D with relation to change in load-displacement. |
|
Fig. 9 Load and Displacement curve for various specimens. |
|
Fig. 10 Scanning Electron Microscope image of specimens (a) B, (b) C, and (c) D. |
|
Fig. 11 Evaluation and particle dispersion of specimens (a) A, (b) B, (c) C, and (d) D. |


1. Extensive research is conducted on the porosity of Al alloy specimen A, as well as the hybrid nanocomposites of specimens B, C, and D. Density increases in specimens B, C, and D as compared to the pure specimen because more reinforcing materials were added to LM14 composite.
2. Different loads of 19.65 KN, 21.245 KN, and 21.385 KN cause a 7.5 mm shift in specimen A to D. Specimens A, B, C, and D had a higher tendency for breaking load with a progressive change in displacement. Compared to the other three AMNC samples, Sample D has a maximum displacement due to the substantial applied load.
3. Analyzing AMNC specimen D in light of AMNC specimens B and C yields a maximal displacement of 8.265 mm and maximal stress of 0.277 KN/sq.mm.
No participation of humans takes place in this implementation process
No violation of Human and Animal Rights is involved.
No funding is involved in this work.
Conflict of Interest is not applicable in this work.
There is no authorship contribution
The authors would like to acknowledge the Researchers Supporting Project number (RSP2023R373), King Saud University, Riyadh, Saudi Arabia.
- 1. M. Sam and N. Radhika, Mater. Res. Express 6[9] (2019) 096595.
-

- 2. V. Mohanavel and M. Ravichandran, Mater. Res. Express 6[10] (2019) 106557.
-
- 3. S. Liu, S. Zhang, R. V. Vignesh, O. O. Ojo, S. Mehrez, V. Mohanavel, and M. Paidar, Vacuum. 207 (2023) 111542.
-
- 4. S. Hanish Anand, N. Venkateshwaran, J. V Sai Prasanna Kumar, D. Kumar, C. Ramesh Kumar, and T. Maridurai, Silicon. 14[8] (2022) 4337-4347.
-
- 5. P. Harish, S. Siddiq, V. Mohan Srikanth, S.B.K. Reddy, and K.Ch. Kishore Kumar, Applied Eng. Letters: J. Eng. Applied Sci. 4[3] (2019) 79-87.
-
- 6. D. Srinivasan, M. Meignanamoorthy, A. Gacem, M. Vinayagam, T. Sathish, M. Ravichandran, S. Suresh Kumar, M.H. Abdellattif, and H. Lenin Allasi, J. of Nanomater. 2022 (2022) 12.
-
- 7. K. Raja, V.S. Chandra Sekar, V. Vignesh Kumar, T. Ramkumar, and P. Ganeshan, Arab. J. Sci. Eng. 45 (2020) 9481-9495.
-
- 8. V. Mohanavel, K.S. Ashraff Ali, S. Prasath, T. Sathish, and M. Ravichandran, J. of Mater. Res. Technol. 9[6] (2020) 14662-14672.
-
- 9. J. Dai, J. Singh, and N. Yamamoto, AIAA Scitech. 2020 (2020) 1-12.
-
- 10. A. Szlancsik and I. Norbert Orbulov, Mater. Sci. Eng. 827 (2021) 142081.
-
- 11. P. Švec, Z. Gábrišová, and A. Brusilová, J. Ceram. Process. Res. 20[1] (2019) 113-120.
-
- 12. P.P. Shantharaman, V. Anandakrishnan, S. Sathish, and M. Ravichandran, J. Ceram. Process. Res. 23[5] (2022) 589-594.
-
- 13. A. Srinivasan, R. Prabu, S. Ramesh, and R. Viswanathan, J. Ceram. Process. Res. 23[6] (2022) 783-793.
-
- 14. N. Canikoğlu, J. Ceram. Process. Res. 22[3] (2021) 258-263.
-
- 15. R. Huang and X. Yang, J. Ceram. Process. Res. 23[2] (2022) 213-220.
-
- 16. V. Jurwall, A.K. Sharma, A. Pandey, A. Goyal, S.K. Joshi, L.R. Gupta, and K. Kumar Saxena, Adv. Mater. Process. Technol. (2023) 1-9.
-
- 17. E. Daskalakis, A. Jha, A. Scott, and A. Hassanpour, Annual Meeting & Exhibition Supplemental Proceedings (2022) 49-59.
-
- 18. P. Anitha and M. Srinivas Rao, J. Process Mech. Eng. 236[5] (2022) 2071-2081.
-
- 19. F. Rubino, G. Rotella, M. Perrella, P. Carlone, and T.S. Sudarshan, J. of Mater. Eng. Perform. 32 (2023) 4391-4403.
-
- 20. A.K. Rajamanickam and V.C. Uvaraja, Mater. Res. Express. 9[7] (2022) 075001.
-
- 21. Z. Shao, X. Jiang, R. Shu, Z. Wu, Z. Huang, H. Deng, Q. Qin and M. Zhu, J. of Alloys and Compounds 909 (2022) 164804.
-
- 22. H. Aydin and B. Elmusa, J. Aust. Ceram. Soc. 57[3] (2021) 731-741.
-
- 23. R. Niranjan, N. Rajendrakumar, and R. Saravanan, Mater. Today: Proc. 24 (2020) 1210-1216.
-
- 24. C.F. Feng and L. Froyen, Mater. Letters. 32[Issue 4] (1997) 275-279.
-
- 25. M. Kolev, L. Drenchev, and V. Petkov, Metals. 11[11] (2021) 1692.
-
- 26. M. Farooq and S. Jalal, Adv. in Mater. Sci. Eng. 2021 (2021) 15.
-
- 27. K. Shivalingaiah, V. Nagarajaiah, C.P. Selvan, S.T. Kariappa, N.G. Chandrashekarappa, A. Lakshmikanthan, M.P.G. Chandrashekarappa, and E. Linul, Metals. 12[8] (2022) 1297.
-
- 28. F. Bonollo, B. Molinas, I. Tangerini, and A. Zambon, Mater. Sci. Technol. 10[6] (1994) 558-564.
-
- 29. D. Kim, H.J. Chang, and H. Choi, Appl. Microsc. 50[4] (2020).
-
- 30. M. Lokeshwari, P. Vidya Sagar, K. Dilip Kumar, D. Thirupathy, Ram Subbiah, P. Ganeshan, A.H. Seikh, S.M.A.K. Mohammed, and David Christopher, J. of Nanomater. 2022 (2022) 9.
-
- 31. R. Ishwarya Komalnu, P. Ganeshan, and C. Chanakyan, Adv. Mater. Sci. Eng. 2022 (2022) 7.
-
 This Article
-
2023; 24(4): 617-625
Published on Aug 31, 2023
- 10.36410/jcpr.2023.24.4.617
- Received on Feb 14, 2023
- Revised on Mar 25, 2023
- Accepted on Mar 28, 2023
Services
- Abstract
introduction
experimentation
results and discussions
conclusions
- Ethics Approval and Consent to Participate
- Human and Animal Rights
- Funding
- Conflict of Interest
- Author Contributions
- Acknowledgements
- References
- Full Text PDF
Shared
Correspondence to
- C. Sailaja
-
Department of Mechanical Engineering, Bangalore College of Engineering and Technology, Bangalore, Karnataka 560099, India
Tel : +918148465479 - E-mail: sailajac3434@gmail.com
Clean-Energy Research Institute(CRI), Hanyang University, 222, Wangsimni-ro, Seongdong-gu, Seoul, 04763, Korea
E-mail: jcpr@hanyang.ac.kr