


- Effect of the aging voltage on the electrical properties in a LTO battery capacitor
Won-Su Lee, Jong-Kyu Lee and Jung-Rag Yoon*
R&D Center, SAMWHA CAPACITOR, Yongin, South Korea
This article is an open access article distributed under the terms of the Creative Commons Attribution Non-Commercial License (http://creativecommons.org/licenses/by-nc/4.0) which permits unrestricted non-commercial use, distribution, and reproduction in any medium, provided the original work is properly cited.
LTO presents the “zero-strain” volume structure and the higher lithiation/delithiation working voltage (about 1.55 V vs. Li+/Li). To improve the LTO battery, formation of artificial SEI layer is one of the strategies. We applied the charging voltage 2.7 V, 3.4 V, 3.5 V, and 3.6 V, on the aging step. We reveal that SEI layer is formed higher than 3.4 V in LCO/NCM//Li4Ti5O12 batteries. As this layer makes lithium physisorption (physical adsorption), and capacity, resistance is increased. As changing the aging voltage, electrochemical properties are changed. It indicates that applied aging charge voltage affects the electrical performance of battery capacitor
Keywords: Li-ion battery, Battery capacitor, Li4Ti5O12, Aging voltage
With the radical advancements in technology of portable electronic devices, electronic vehicles, and large-scale energy storage systems, safe energy containers with energy and power densities are getting progressively important [1-3]. Among the various energy storage devices, lithium-ion batteries (LIBs) are one of the most promising choices because of their good energy densities and long lifespans [4, 5]. However, to meet the needs of large-scale energy storage, LIBs require further developments in large capacity, high rate performance, safety, and durability of electrode [6]. The development of anode material is one approach to advancing secondary rechargeable batteries. Graphite is the commercial material for anode, which is applied to LIBs currently. Due to its unsatisfied high rate capability, it is hard that graphite satisfies the increasing demands of developing markets [7]. Therefore, it is urgent for the next-generation of LIBs to develop new anode materials with good cycling and rate performance and high power density.
To achieve a quantum leap in the specific power density of lithium-ion batteries and good cycle life, Li4Ti5O12 (LTO) is a suitable material among various anodes. LTO presents a “zero-strain” volume structure and the higher lithiation/delithiation working voltage (about 1.55 V vs. Li+/Li) [8, 9], which prevent the formation and pulverization of the solid electrolyte interphase layer and volume change [10]. These characteristics contribute to more durability and safety [11]. Due to these attractive characteristics, LTO has been studied intensively as a promising anode material, particularly for battery energy storage system (BESS), or high-power batteries for electric vehicles (EV) [12, 13].
In spite of these attractive features of LTO, it has the low theoretical capacity (175 mAh g-1), poor electronic conductivity (10-13 Scm-1), and inferior intrinsic Li ion diffusion coefficient [14]. To overcome these disadvantages, there are several strategies, such as structure control [15], and heteroatom doping [16]. However, the elaborate structural design, complex manufacturing process, and pricey process have inhibited their commercialization. Another approach is formation of artificial SEI layer [17]. This approach is widely known to be influenced by the impressed voltage, current, temperature and the kinds of solvent and addictive used [13, 18]. By forming the artificial SEI layer on the surface of LTO, it could cause several positive effects, which are improvement of the cycling and high rate performance.
Herein, we report the effect of the aging voltage on the electrical properties in a battery capacitor of which anode is consist of LTO. By changing the applied voltage at the charging step of aging, we formed the artificial SEI layer, and enhance the capacity
Electrode manufacturing and cell fabrication
The positive electrode was prepared by mixing a powder mixture of Li[Ni1/3Co1/3Mn1/3]O2 (Umicore, Belgium) and LiCoO2 (Cosmo AM&T, Korea) as the active material, a conductive agent (Super P, Timcal, Switzerland), and a binder (polyvinylidene fluoride, ARKEMA, France) in a weight ratio of 87:6.5:6.5 (wt%). The measured active and conductive materials were mixed with solvent NMP (N-methyl pyrrolidinone) to prepare a slurry. The slurry was then coated on both sides of an Al foil current collector using a tape casting method to a thickness of 120 μm and pressed to a thickness of 100 μm with a roll press.
The negative electrode was prepared using Li4Ti5O12 (Posco ESM, Korea) as the active material, and employing the same conductive agent and binder as used in the positive electrode. The slurry for the negative electrode was prepared with the same mixing ratio as the positive electrode, and coated on both sides of an Al foil current collector using a tape casting method to a thickness of 160 μm. It was then pressed to a thickness of 130 μm with a roll press.
The cell was manufactured in a product standard of 22 mm in diameter and 45 mm in length. A jelly roll was made using the prepared electrode and a separator, and vacuum dried at 145 °C for 48 hours. The dried jelly roll was immersed in 1.0 M LiPF6 + EC:DEC: DMC=1:1:1 electrolyte for 2 hours, and then assembled in a dry room.
Material characterization and electrochemical measurements
Field emission scanning microscopy (FE-SEM, Hitachi S-4800) analysis was performed for the particle shape of the positive electrode and negative electrode active materials, and crystallinity was confirmed using X-ray diffraction (XRD). The formation and galvanostatic discharge-charge testing were performed using a battery cycle tester (Arbin Instruments). The formation protocol is as follows; (1) charge at 0.5C until the potential reaches 2.7 V (as reference), 3.4 V, 3.5 V, 3.6 V respectively; (2) discharge at 0.5C until the potential reaches 1.5 V; (3) repeat 3 times. The cycle performance test was performed at 1.5 V-2.7 V at 1C. The rate capabilities were determined at current rates of 1C, 2C, 3C, 4C, 5C, 10C and five discharge/charge cycles were performed at each current rate. Electrochemical impedance spectroscopy (EIS) was performed using a modulab (solartron analytical) workstation in the 100 kHz to 0.001 Hz frequency range and an applied-voltage amplitude 10 mV. Cyclic voltammetry was performed using Iviumstat.h (Ivium technologies) at 0.5 mVs-1.
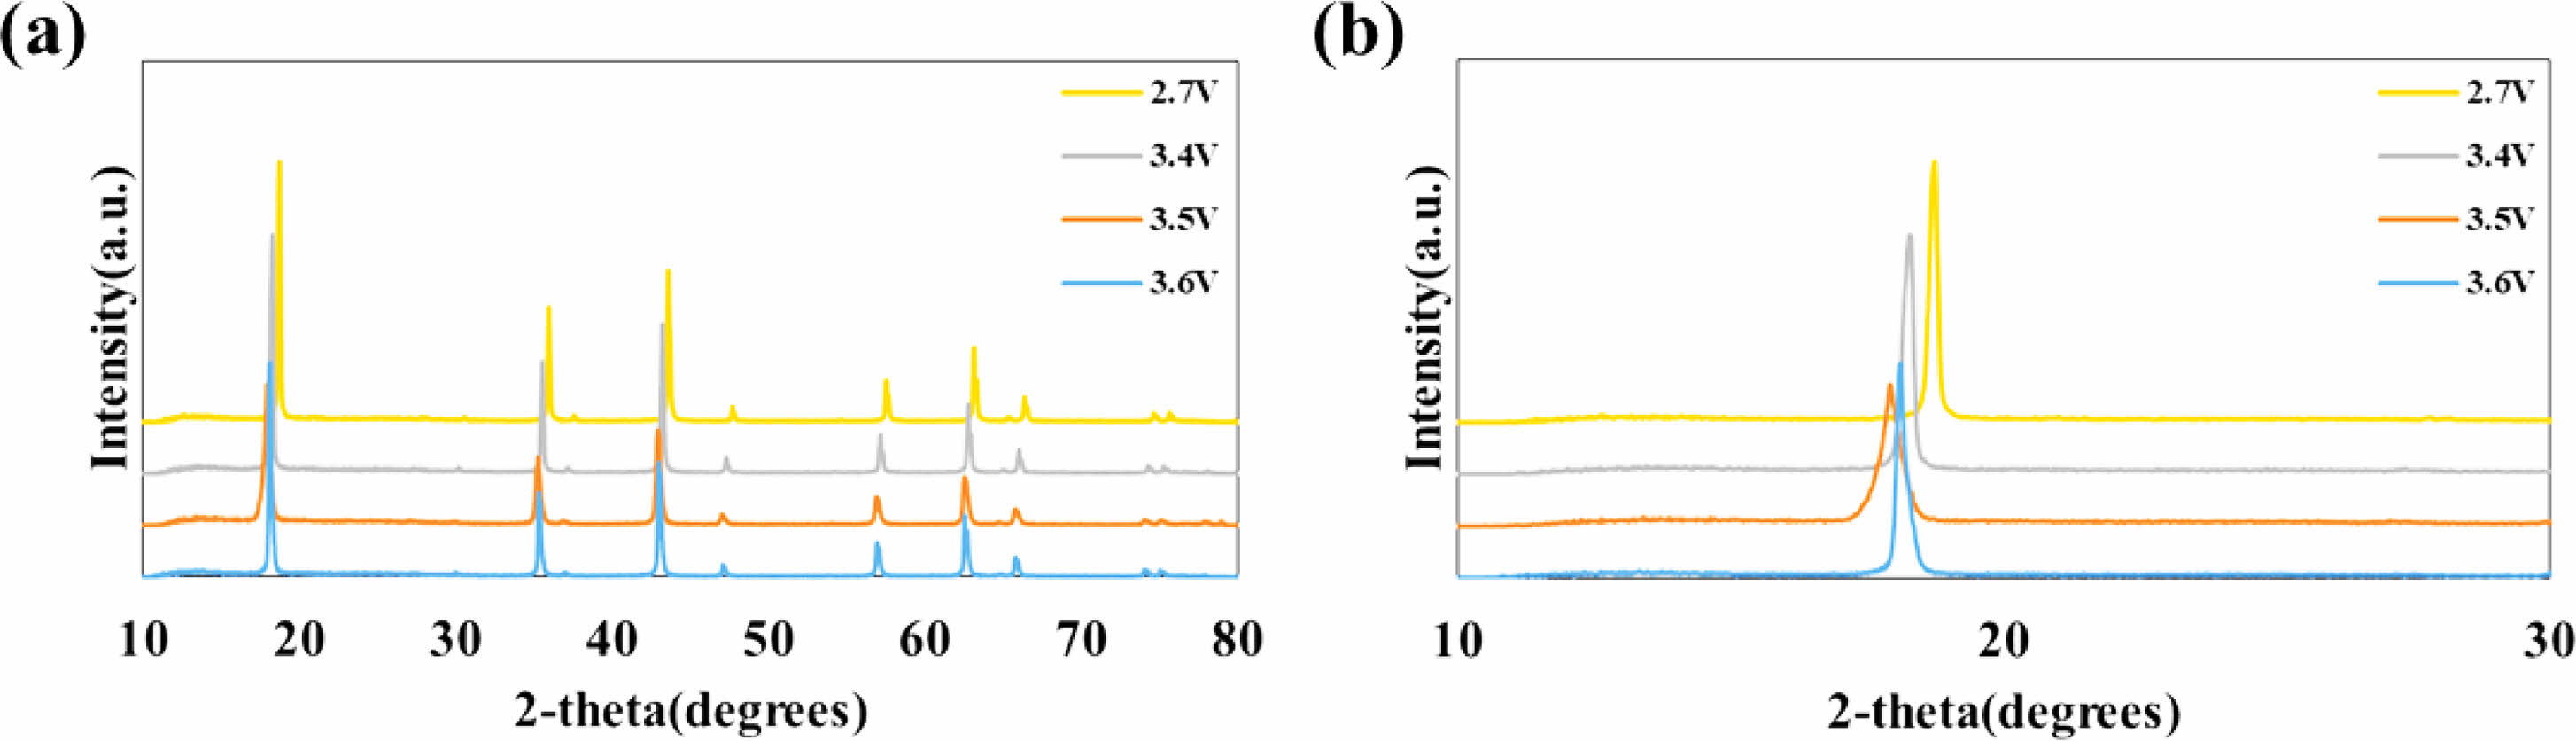
Figure 1(a) and (b) show the X-ray diffraction (XRD) patterns of the anode electrodes charged to 2.7 V, 3.4 V, 3.5 V, and 3.6 V, respectively. The LTO peaks for all anode electrodes were observed at 18.4° (111), 35.6° (311), 57.3° (400), and 62.8° (333) [19]. However, the peaks for the electrodes charged at 3.4 V, 3.5 V, and 3.6 V were broader compared to those charged at 2.7 V, indicating that the LTO surface was covered by an amorphous subsurface layer as a result of applying a high voltage during the aging step. Moreover, the electrodes charged at 3.4 V, 3.5 V, and 3.6 V exhibited smaller 2-theta values than those charged at 2.7 V, suggesting that their interplanar distances were larger than that of the 2.7 V electrode.
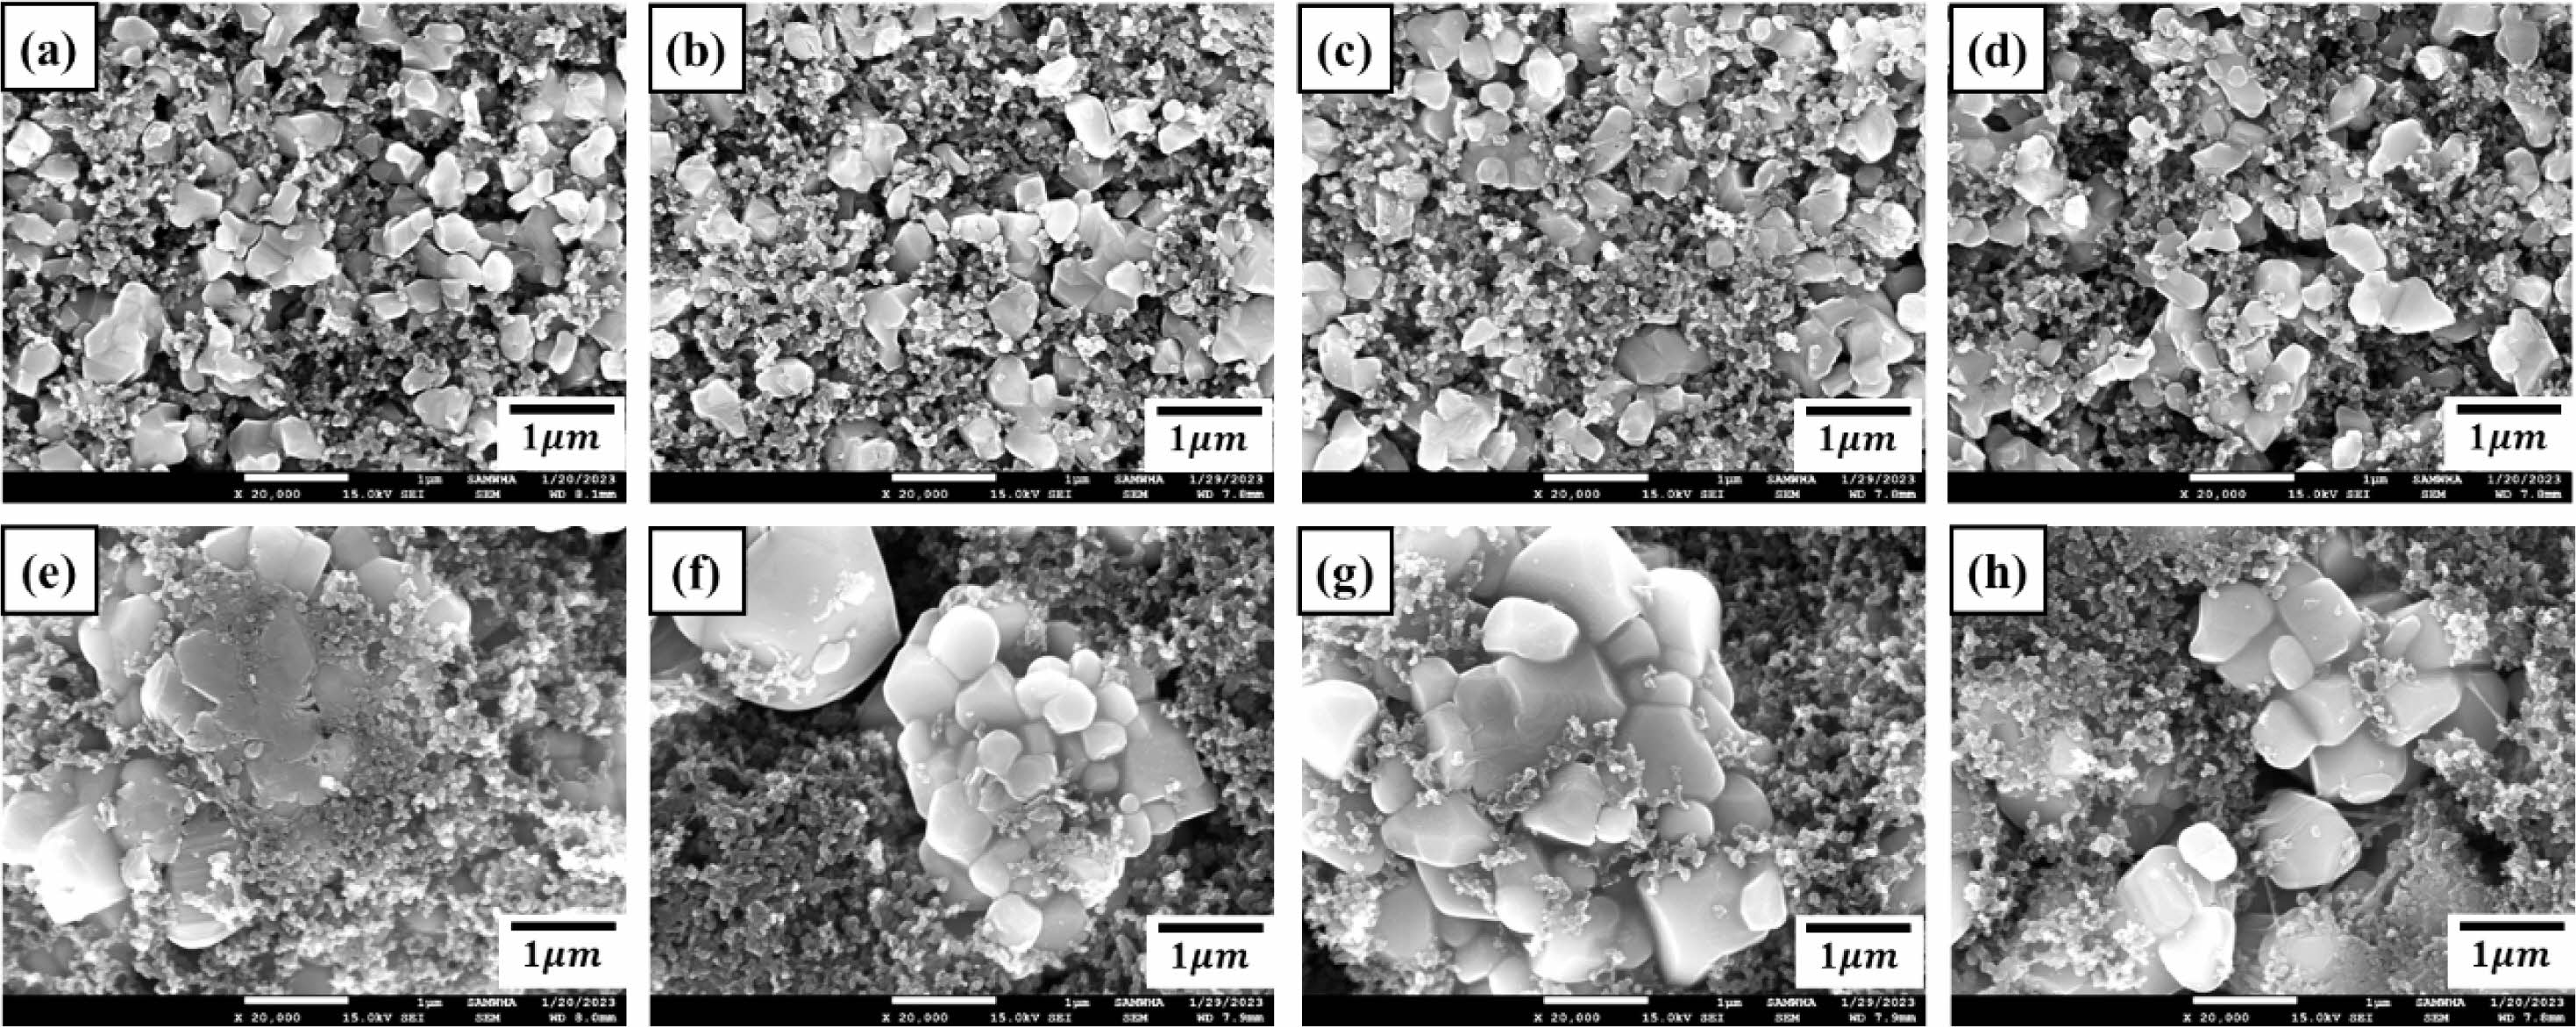
Figure 2 shows FE-SEM images of anode electrodes (a) 2.7 V, (b) 3.4 V, (c) 3.5 V, (d) 3.6 V, and cathode electrodes (e) 2.7 V, (f) 3.4 V, (g) 3.5 V, and (h) 3.6 V. The SEM images indicate that particle of LCO, LTO, and granule morphology of NCM are not pulverized severely after high voltage aging treatment.
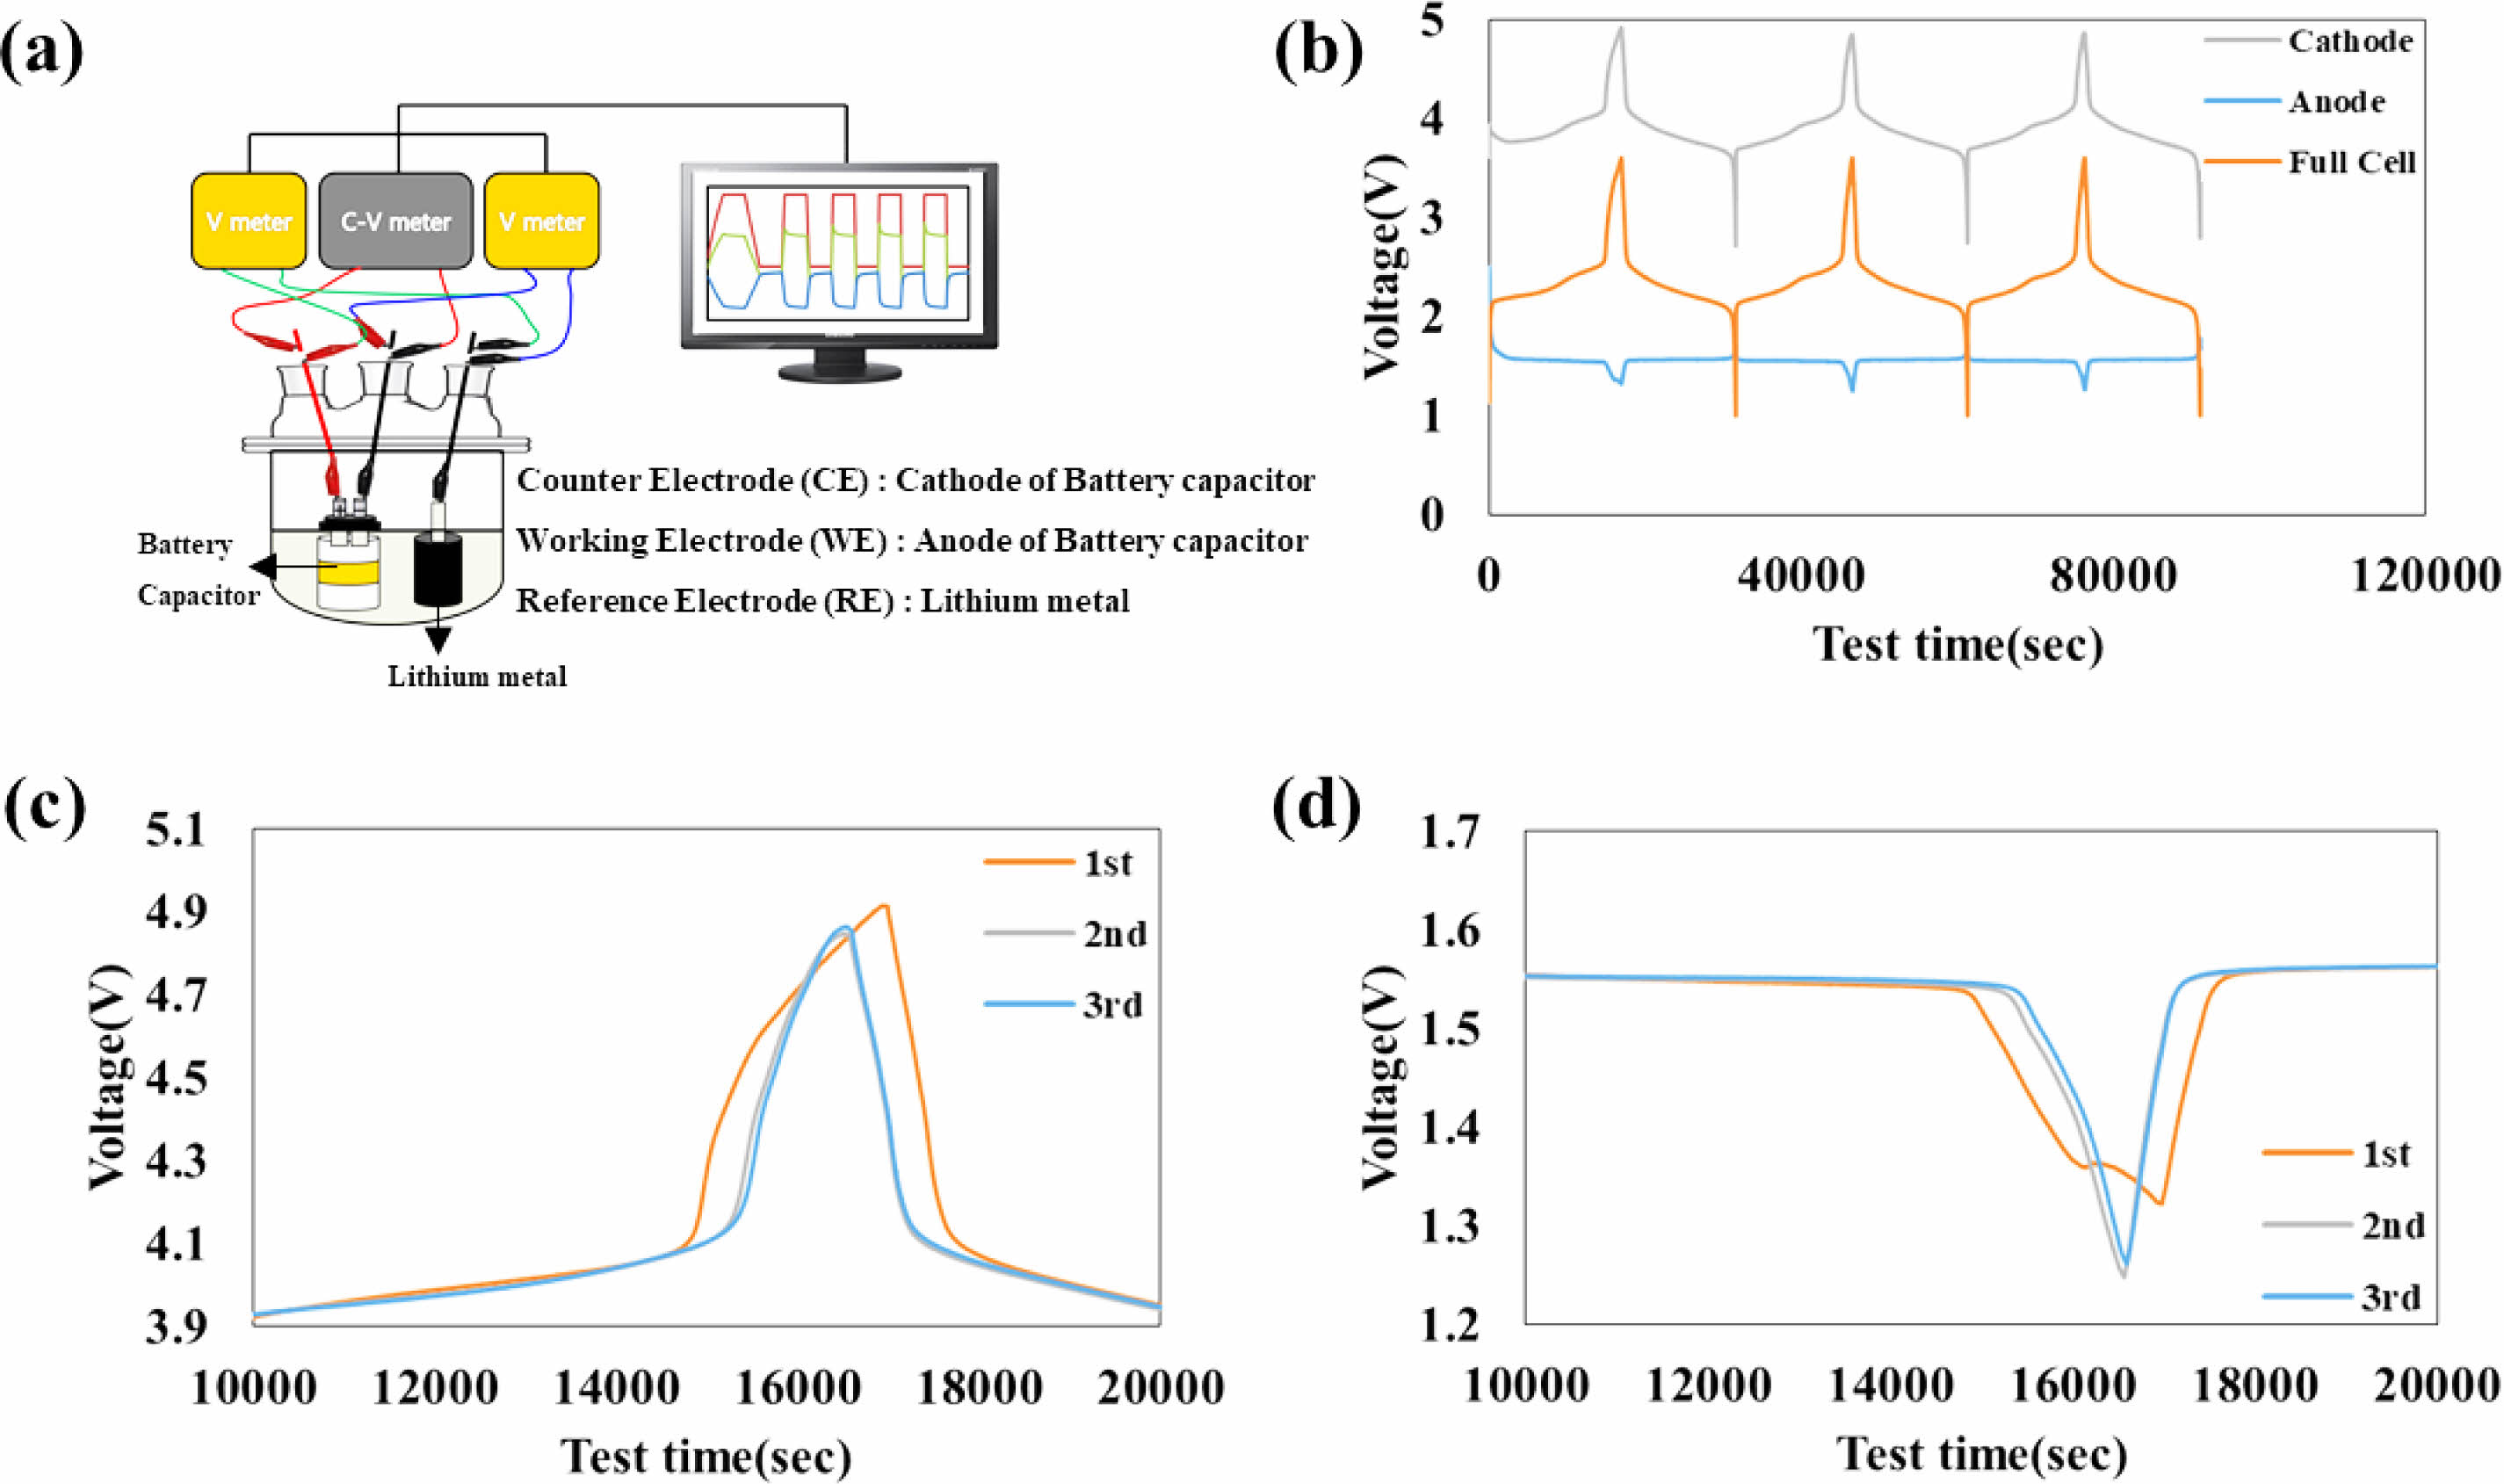
Figure 3(a) shows a schematic illustration of the three-electrode system in the galvanostat mode measurements for the full cell. The voltage profiles of cathode, anode, and full cell at a C-rate of 1C between 1 V to 3.6 V are shown Fig. 3(b). The duration of the first peak is longer than that of the second and third peaks. Fig. 3(c) and (d) clearly show that the second and third cycle peaks of cathode and anode are same and smaller than the first cycle peak. It indicates that irreversible electrochemical reactions occur during the first cycle. Furthermore, Fig. 3(d) shows that a plateau in the voltage profile at 1.36 V is observed only during the 1st cycle of anodes. This observation demonstrates that a SEI layer is formed at a voltage higher than 3.4 V of charging of 1st aging step, and this layer prevents the decomposition of the electrolyte on the surface of LTO during the 2nd and 3rd cycles.
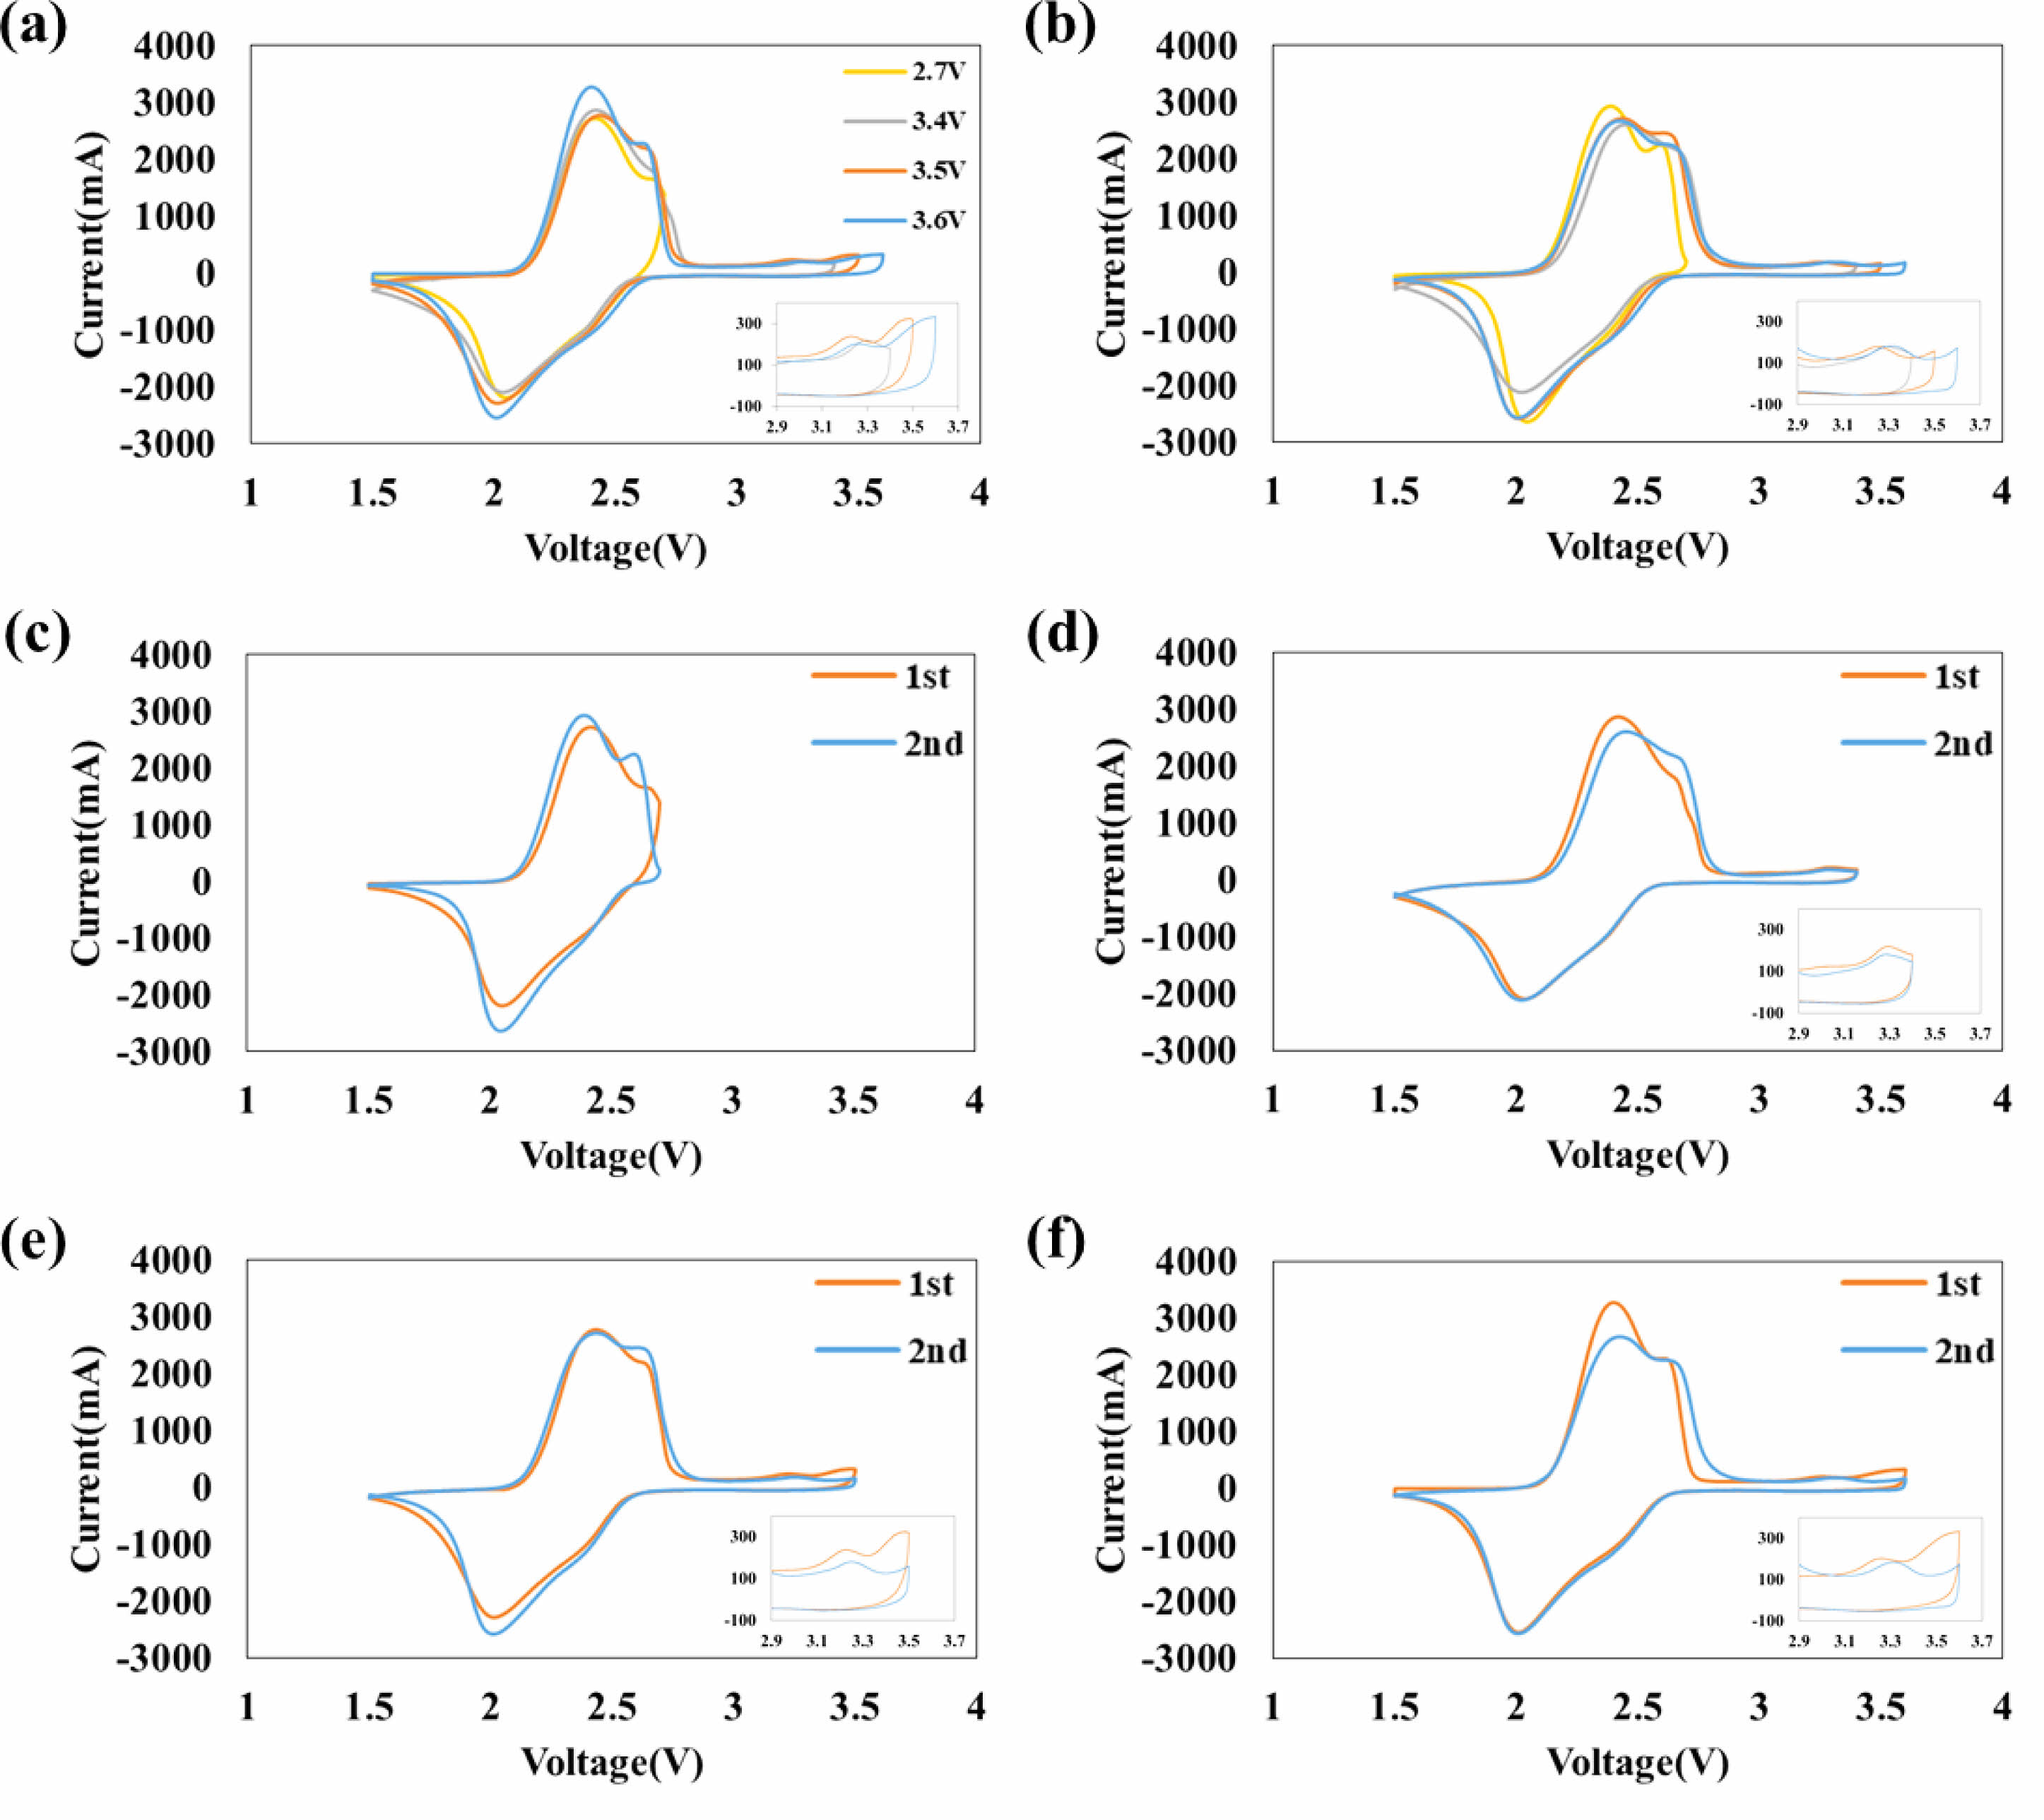
Figure 4 shows cyclic voltammetry of (a) the first cycle, (b) the second cycle. A small peak is observed after the charging step at 3.3 V, but no peaks are observed during the discharging step between 2.7 V and 3.6 V. Additionally, the areas of cyclic voltammetry decrease over time, indicating that (1) the peak observed after 3.35 V is irreversible, and (2) an SEI layer is formed after 3.35 V. The area change between 3.3 V and 3.6 V is getting bigger, when voltage of charging at aging step is getting higher. The cyclic voltammetry for 3.5 V(e) and 3.6 V(f) are similar and larger than that for 3.4 V(d), indicating that the decomposition of the electrolyte starts at 3.35 V and rapidly progresses after 3.5 V.
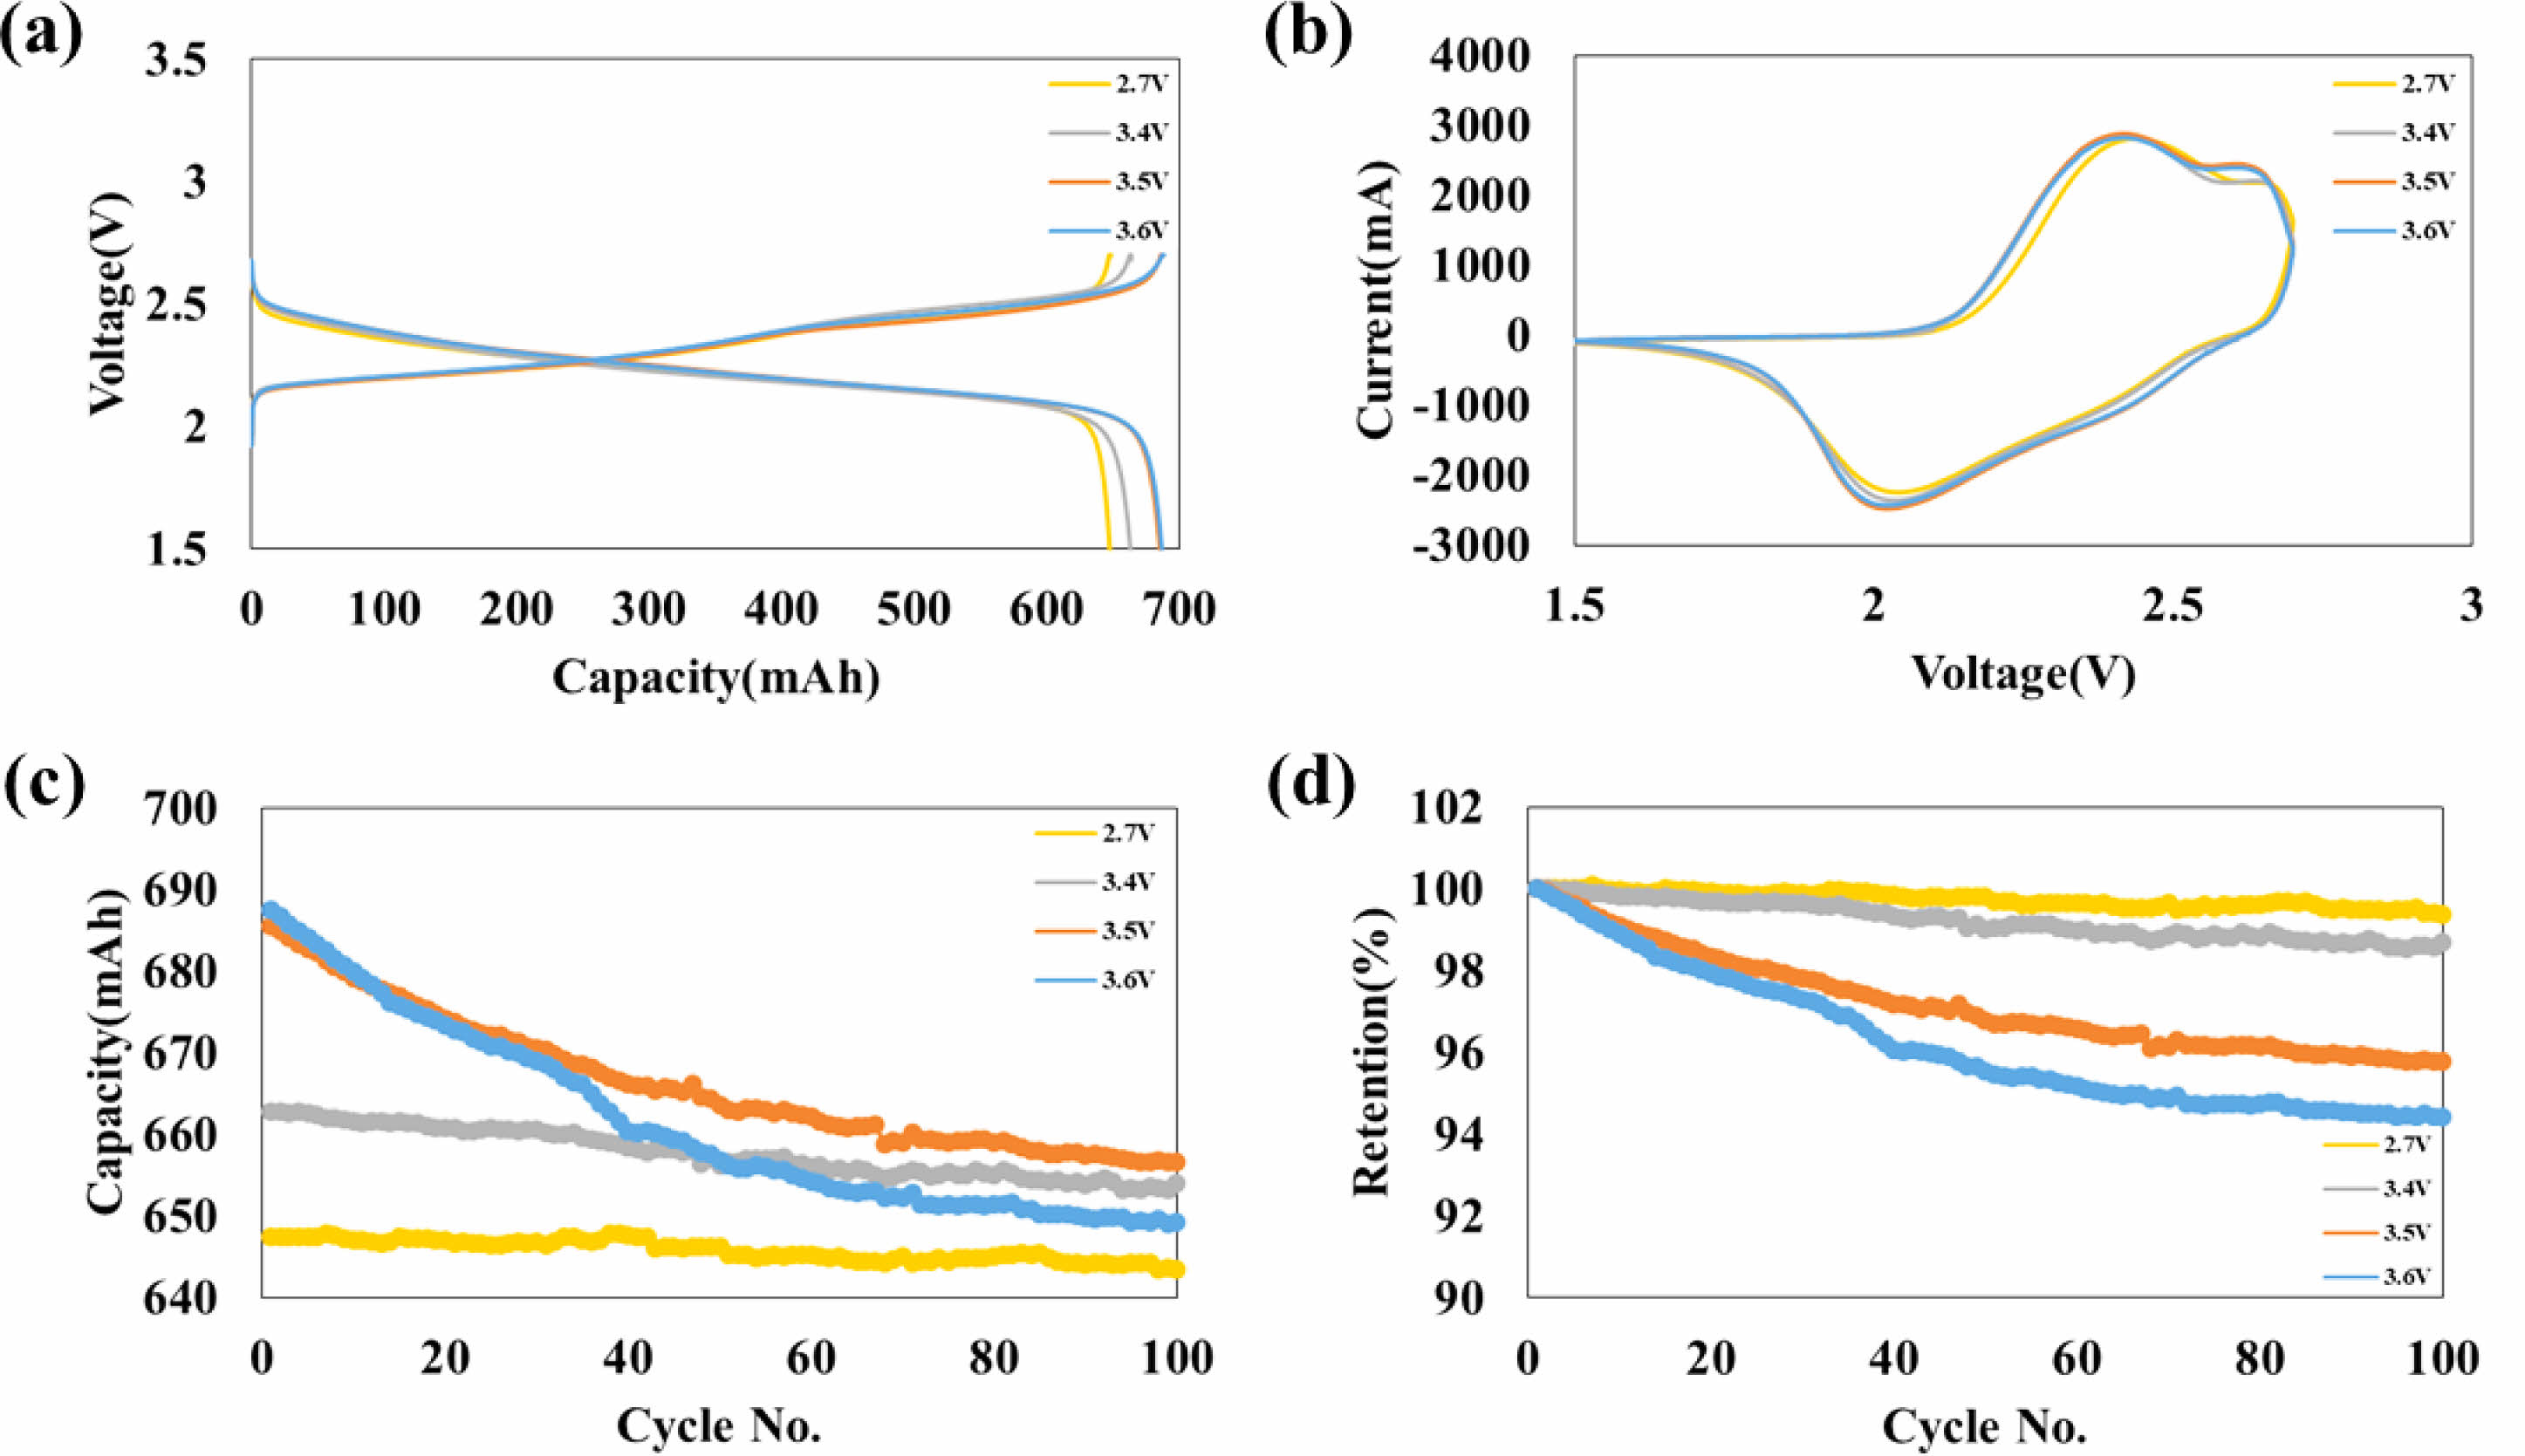
As exhibited in Fig. 5(a), capacities of discharge of 2.7 V, 3.4 V, 3.5 V, and 3.6 V aged full cells were obtained to be 647, 662, 684, and 686 mAh, respectively, during the first cycle. The charge and discharge voltage profiles of the full cell are also shown in Fig. 5(a).
Figure 5(b) displays the cyclic voltammetry curves of battery capacitors aged at different voltages (2.7 V, 3.4 V, 3.5 V, and 3.6 V) during the first cycle, measured from 1.5 V to 2.7 V. The integral areas of the high voltage-aged full cells are consistently larger than that of the reference (2.7 V) in a succession of 3.6 V > 3.5 V > 3.4 V > 2.7 V. All oxidation and reduction peaks are the same, although the capacities increase after the high voltage aging treatment. This indicates that lithium physisorption occurres. In my opinion, this physisorption comes from a new artificial SEI layer that forms during the high voltage aging treatment.
Figure 5(c) and (d) show the cycle and retention performance of battery capacitors with aging voltages of 2.7 V, 3.4 V, 3.5 V and 3.6 V for 100 cycles at 1C in the potential range of 1.5 V to 2.7 V, respectively, after the aging step. The full cells with the 2.7 V, 3.4 V, 3.5 V, and 3.6 V aging treated cells have specific discharge capacities of 643, 654, 656, and 649 mAh, respectively, after 100 cycles. The retention rates after 100 cycles are 99.39, 98.68, 95.79, and 94.43%, respectively. These results demonstrate that as the aging voltage increases, the capacity increases, but the retention decreases.
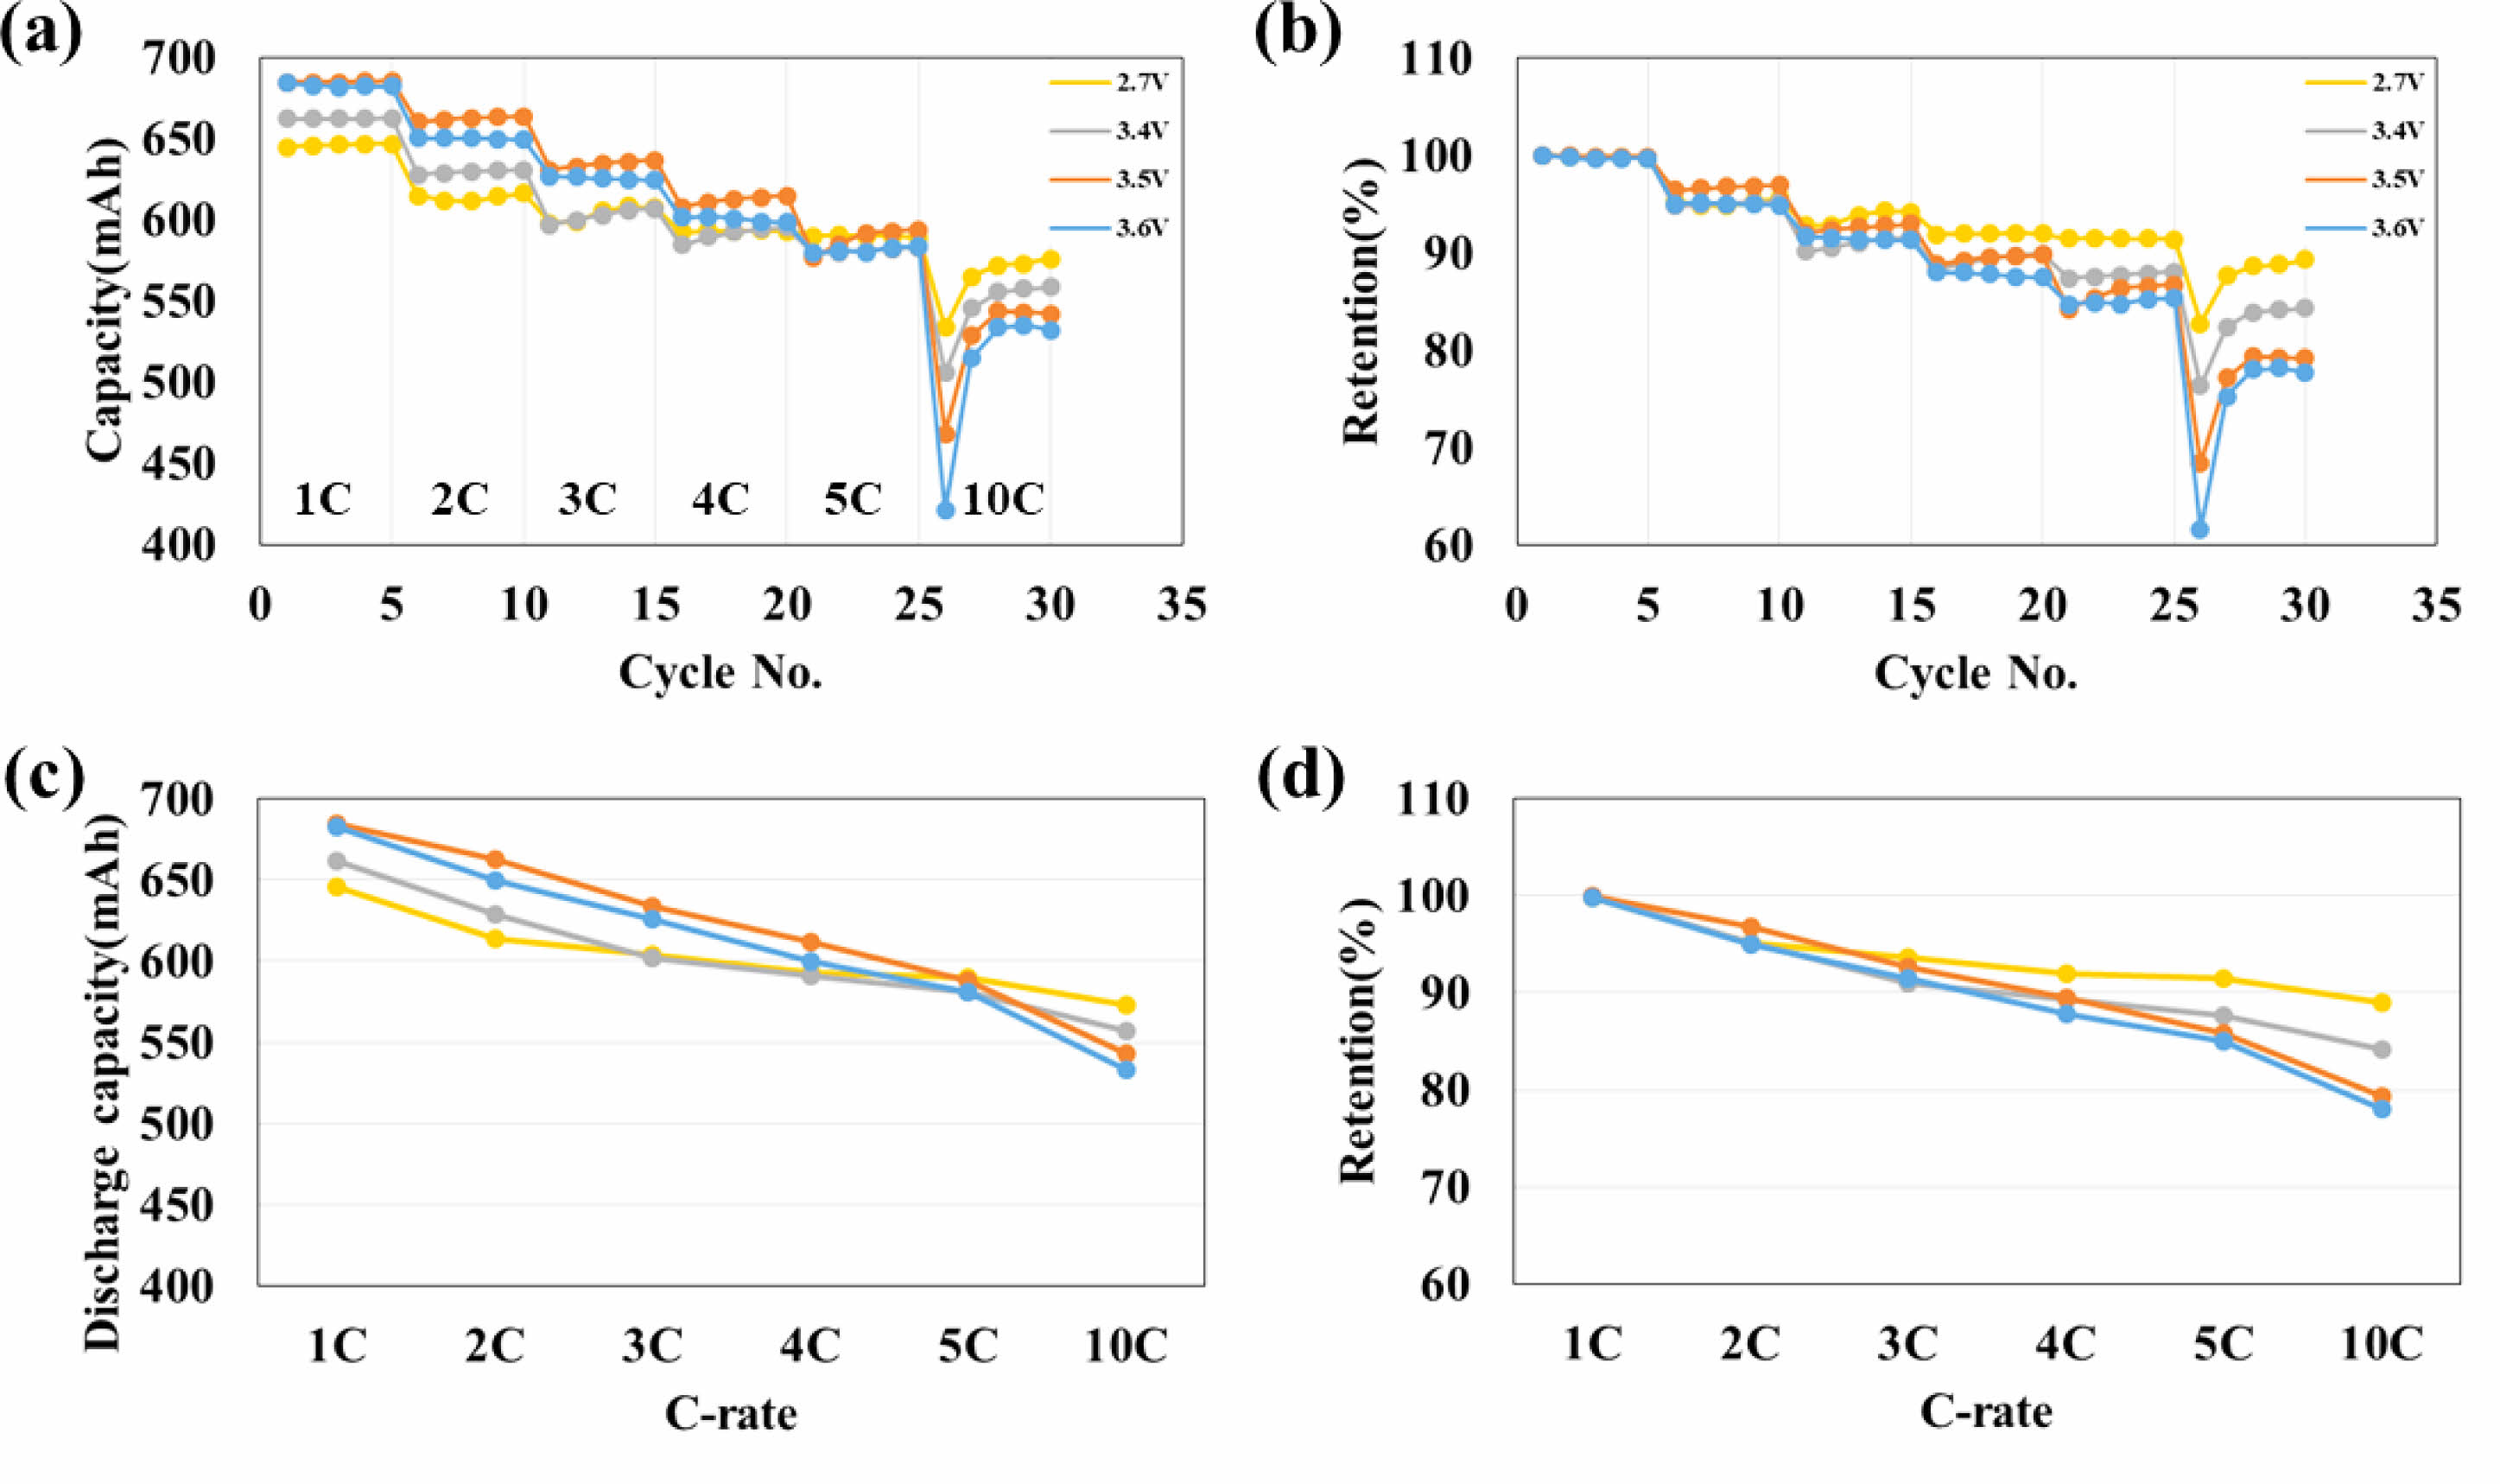
Figure 6 shows C-rate (a) capabilities, (c) normalized of capabilities, (b) retention, and (d) normalized of percent discharge capacity retention of the 2.7 V, 3.4 V, 3.5 V, and 3.6 V aged battery capacitor. From 1C to 3C, the capacity of the high-voltage treated full cell is bigger than the reference (2.7 V). However, the order of discharge capacity is reversed at 10C. The retention of high-voltage aging treated full cells is consistently smaller than the reference (2.7 V) in a sequence of 2.7 V > 3.4 V > 3.5 V > 3.6 V. This reveals that the capacitance increases, but the resistance also increases as the aging voltage increases.
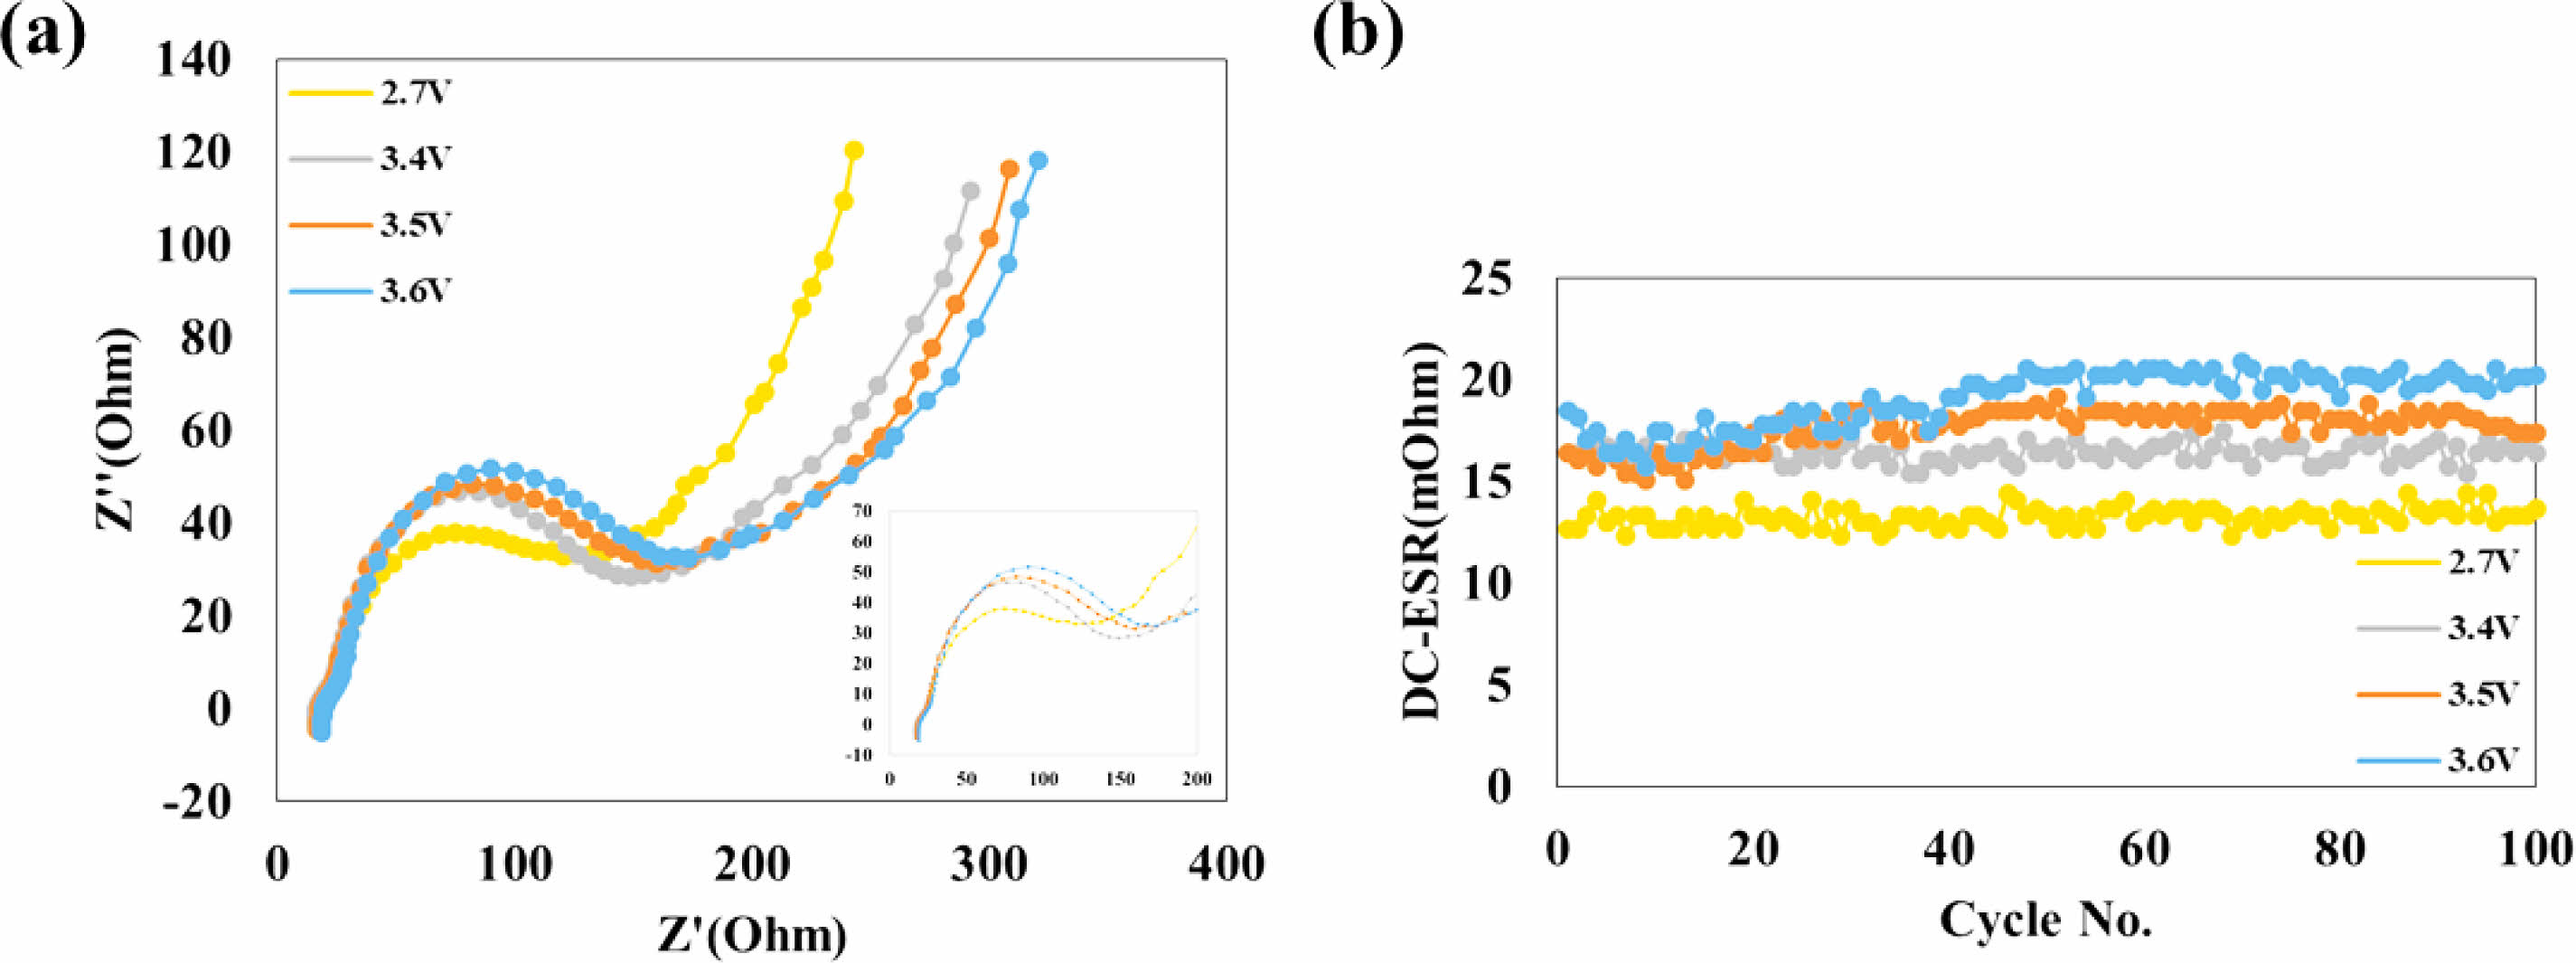
Figure 7 shows (a) electrochemical impedance spectra of the electrodes and (b) DC-ESR of the 2.7 V, 3.4 V, 3.5 V, and 3.6 V aged battery capacitor. As the aging voltage increases, the half-circle of impedance spectra and value of DC-ESR increase. This indicates that (1) A SEI layer is formed after 3.4 V, and (2) as a higher voltage is applied during the aging step, the SEI layer becomes thicker.
|
Fig. 1 (a) XRD patterns of anode electrodes, and (b) the enlarged (111) diffraction peaks. |
|
Fig. 2 FE-SEM images of anode electrodes (a) 2.7 V, (b) 3.4 V, (c) 3.5 V, (d) 3.6 V, and cathode electrodes (e) 2.7 V, (f) 3.4 V, (g) 3.5 V, and (h) 3.6 V. |
|
Fig. 3 (a) Schematic illustration of the three-electrode system in the galvanoStat Mode measurements for the full cell. (b) Voltage profiles of cathode, anode, and full cell at the C-rate of 1C between 1 V to 3.6 V. And peak part of voltage profiles of (c) cathode, and (d) anode. |
|
Fig. 4 Cyclic voltammetry of (a) at 1st cycle, (b) at 2nd cycle, and aging voltage of charge (c) 2.7 V, (d) 3.4 V, (e) 3.5 V, and (f) 3.6 V |
|
Fig. 5 (a) Discharge/charge voltage profiles and (b) cyclic voltammetry curves of battery capacitors of 2.7 V, 3.4 V, 3.5 V and 3.6 V of aging voltage at 1st cycle. And (e) cycle, (f) retention performance of battery capacitors of 2.7 V, 3.4 V, 3.5 V and 3.6 V of aging voltage for 100 cycles at 1C respectively, after aging step |
|
Fig. 6 C-rate (a) capabilities, (c) normalized of capabilities, (b) retention, and (d) normalized of percent discharge capacity retention of the 2.7 V, 3.4 V, 3.5 V, and 3.6 V aged battery capacitor. |
|
Fig. 7 (a) Electrochemical impedance spectra of the electrodes and (b) DC-ESR of the 2.7 V, 3.4 V, 3.5 V, and 3.6 V aged battery capacitor. |
In this study, the effect of aging voltage on the electrical properties of a battery capacitor was investigated. We applied the charging voltage 2.7 V, 3.4 V, 3.5 V, and 3.6 V during the aging step and evaluated the electrical properties. We found that a SEI layer was formed after 3.4 V. The capacity was improved by the lithium physisorption by the formation of the SEI layer. As the aging voltage is getting higher, the amount of lithium physisorption and capacity is getting bigger. But the resistance is increase, and the retention is lower at the same time. Based on these results, we confirmed that cell aging at 3.4 V can deliver superior electrochemical performances.
This work was supported by the Technology Innovation Program (10062226, The development of battery capacitor (58Wh/L) composed of graphene and lithium transition metal oxide based flexible electrode for IoT device) funded By the Ministry of Trade, Industry & Energy (MOTIE, Korea).
- 1. J.B. Goodenough and K.S. Park, J. Am. Chem. Soc. 135 (2013) 1167-1176.
-

- 2. R. Mukherjee, R. Krishnan, T.M. Lu, and N. Koratkar, Nano Energy. 1 (2012) 518-533.
-
- 3. N.S. Choi, Z.H. Chen, S.A. Freunberger, X.L. Ji, Y.K. Sun, K. Amine, et al. Angew Chem. Int. Edit. 51 (2012) 9994-10024.
-
- 4. K. Zhang, Z. Hu, and Z.L. Tao, Chen J. Sci. China Mater. 57 (2014) 42-58.
-
- 5. P.G. Bruce, B. Scrosati, and J.M. Tarascon, Nanomaterial. Angew Chem. Int. Edit. 47 (2008) 2930-2946.
-
- 6. V.M. Nagulapati, Y.H. Yoon, D.S. Kim, H. Kim, W.S. Lee, J.H. Lee, et al. J. Ind. Eng. Chem. 76 (2019) 419-428.
-
- 7. J.M. Tarascon and M. Armand, Nature 414 (2001) 359-367.
-
- 8. S.H. Lee, J.K. Lee, D.H. Beak, and J.R. Yoon, J. Ceram. Process. Res. 20 (2019) 69-72.
-
- 9. J.W. Seok, J. Lee, T. Rodgers, D.H. Ko, and J.H. Shim, Trans. Electr. Electron. Mater. 20 (2019) 548-553.
-
- 10. N. Sharma, D. Puthusseri, M.O. Thotiyl, and S. Ogale, ACS Omega. 2 (2017) 8818-8824.
-
- 11. C. Chen, H. Guo, Z. Zhao, S. Li, and Z. Jiang, Electrochim. Acta. 293 (2019) 141-148.
-
- 12. B.H. Li, C.P. Han, Y.B. He, C. Tang, H.D. Du, Q.H. Yang, and F.Y. Kang, Energy Environ. Sci. 5 (2012) 9595.
-
- 13. L. Wen, Z. Wu, P. Zhao, J. Liang, H. Luo, G.-q. Liu, and F. Li, J. Electrochem. Soc. 166[3] (2019) A5033-A5037.
-
- 14. Y. Li, Q. Chen, Q. Meng, S. Lei, C. Li, X. Li, and J. Ma, ACS Appl. Mater. Interfaces 11[29] (2019) 25804-25816.
-
- 15. G. Liu, R. Zhang, K. Bao, H. Xie, S. Zheng, J. Guo, and G. Liu, Ceramics International 42 (2016) 11468-11472.
-
- 16. J. Wang, Z. Yang, W. Li, X. Zhong, L. Gu, and Y. Yu, Journal of Power Sources 266 (2014) 323-331.
-
- 17. Y.-B. He, M. Liu, Z.-D. Huang, B. Zhang, Y. Yu, B. Li, F. Kang, and J.-K. Kim, Journal of Power Sources 239 (2013) 269-276.
-
- 18. R. Wang, Z. Wang, X. Li, and H. Zhang, Electrochimica Acta 241 (2017) 208-219.
-
- 19. J.K. Lee, W.S. Lee, J.R. Yoon, and K.M. Choi, Ceram. Process. Res. 23 (2022) 766-769.
-
 This Article
-
2023; 24(4): 611-616
Published on Aug 31, 2023
- 10.36410/jcpr.2023.24.4.611
- Received on Feb 2, 2023
- Revised on Apr 25, 2023
- Accepted on May 24, 2023
Services
- Abstract
introduction
experimental
results and discussion
conclusions
- Acknowledgements
- References
- Full Text PDF
Shared
Correspondence to
- Jung-Rag Yoon
-
R&D Center, SAMWHA CAPACITOR, Yongin, South Korea
Tel : +82-10-6805-8134 - E-mail: yoonjungrag@samwha.com
Clean-Energy Research Institute(CRI), Hanyang University, 222, Wangsimni-ro, Seongdong-gu, Seoul, 04763, Korea
E-mail: jcpr@hanyang.ac.kr