


- The phase simulation of High-Tc superconductor compound YBa2Cu3-yPbyO6.5+d
Emad K. Al-Shakarchia,*, Salwan K.J. Al-Anib and Wedad M. Faysalc
aAl-Nahrain University, College of Science, Physics Department, P.O. Box 64055, Baghdad, Iraq
bAl-Mustansiriya University, College of Science, Physics Department, Baghdad, Iraq
cBaghdad University, College of Science, Physics Department, Baghdad, IraqThis article is an open access article distributed under the terms of the Creative Commons Attribution Non-Commercial License (http://creativecommons.org/licenses/by-nc/4.0) which permits unrestricted non-commercial use, distribution, and reproduction in any medium, provided the original work is properly cited.
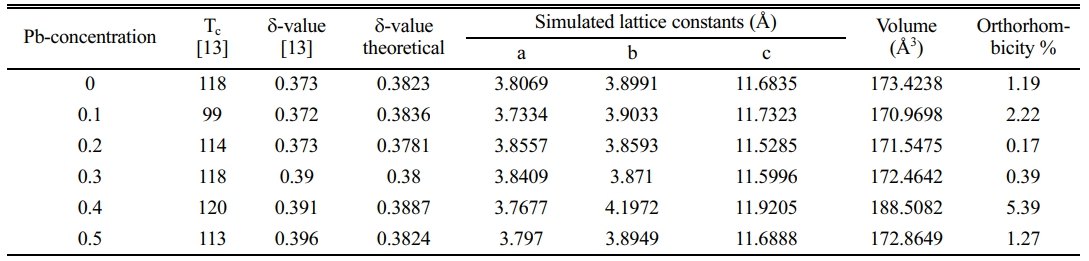
The simulation of a possible change in a structural phase of superconducting compound YBa2Cu3-yPbyO6.5+d was done for the samples prepared by solid-state reaction represented by (y=0-0.5). Theoretically, the probability structural phase was derived from a pure structure YBa2Cu3O6.5+d, which had an orthorhombic phase with lattice constants (a=3.8203, b=3.8855, and c= 11.6835 Å) and space group Pmmm. There is a partial variation in the orthorhombic unit cell from the pure phase through the substitution of Pb. There is a structural phase transition from orthorhombic to tetragonal phase at (y=0.2, 0.3). The limited variation in the lattice constant is around the theoretical values with the orthorhombic phase. The valency (+2) of Pb-ions took place in the position of Cu+2-ion in the composition YBa2Cu3-yPbyO6.5+d. There is a sharp increase in the lattice constants (b, c) at y=0.4 with the remaining orthorhombic phase and space group Pmmm. The simulation exhibited the position of atoms within the unit cell, which was a function of the bond's nature between different atoms and their effect on the conductivity behavior with Pb substitution. The results predicted a linear relation between the c-axis and oxygen excess (δ).
Keywords: Orthorhombic phase, Resistivity measurements, Lattice constants, Anisotropy, Oxygen excess
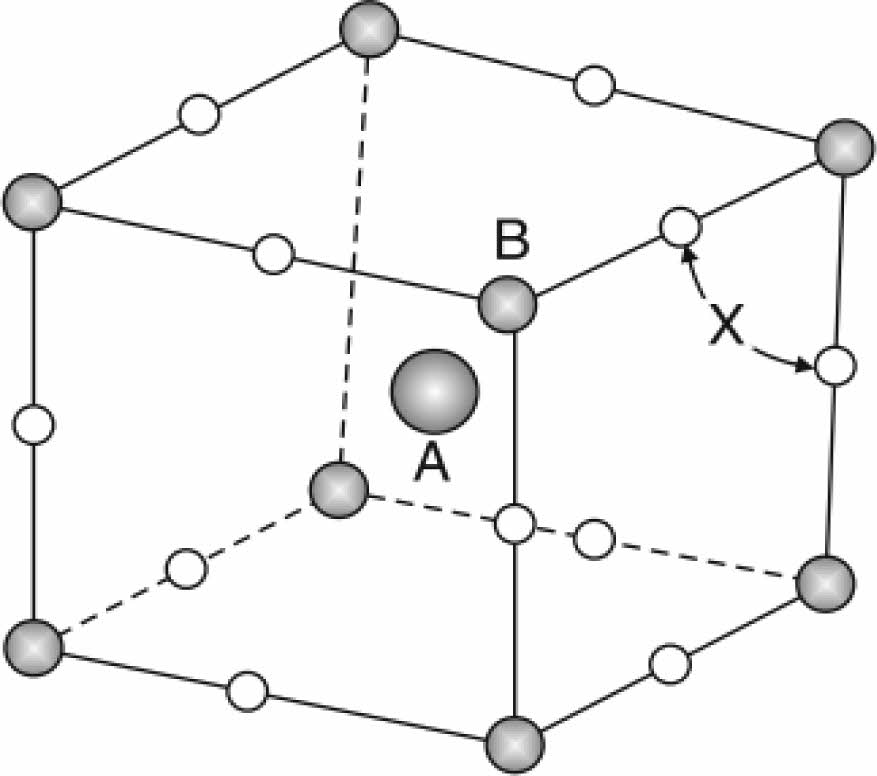
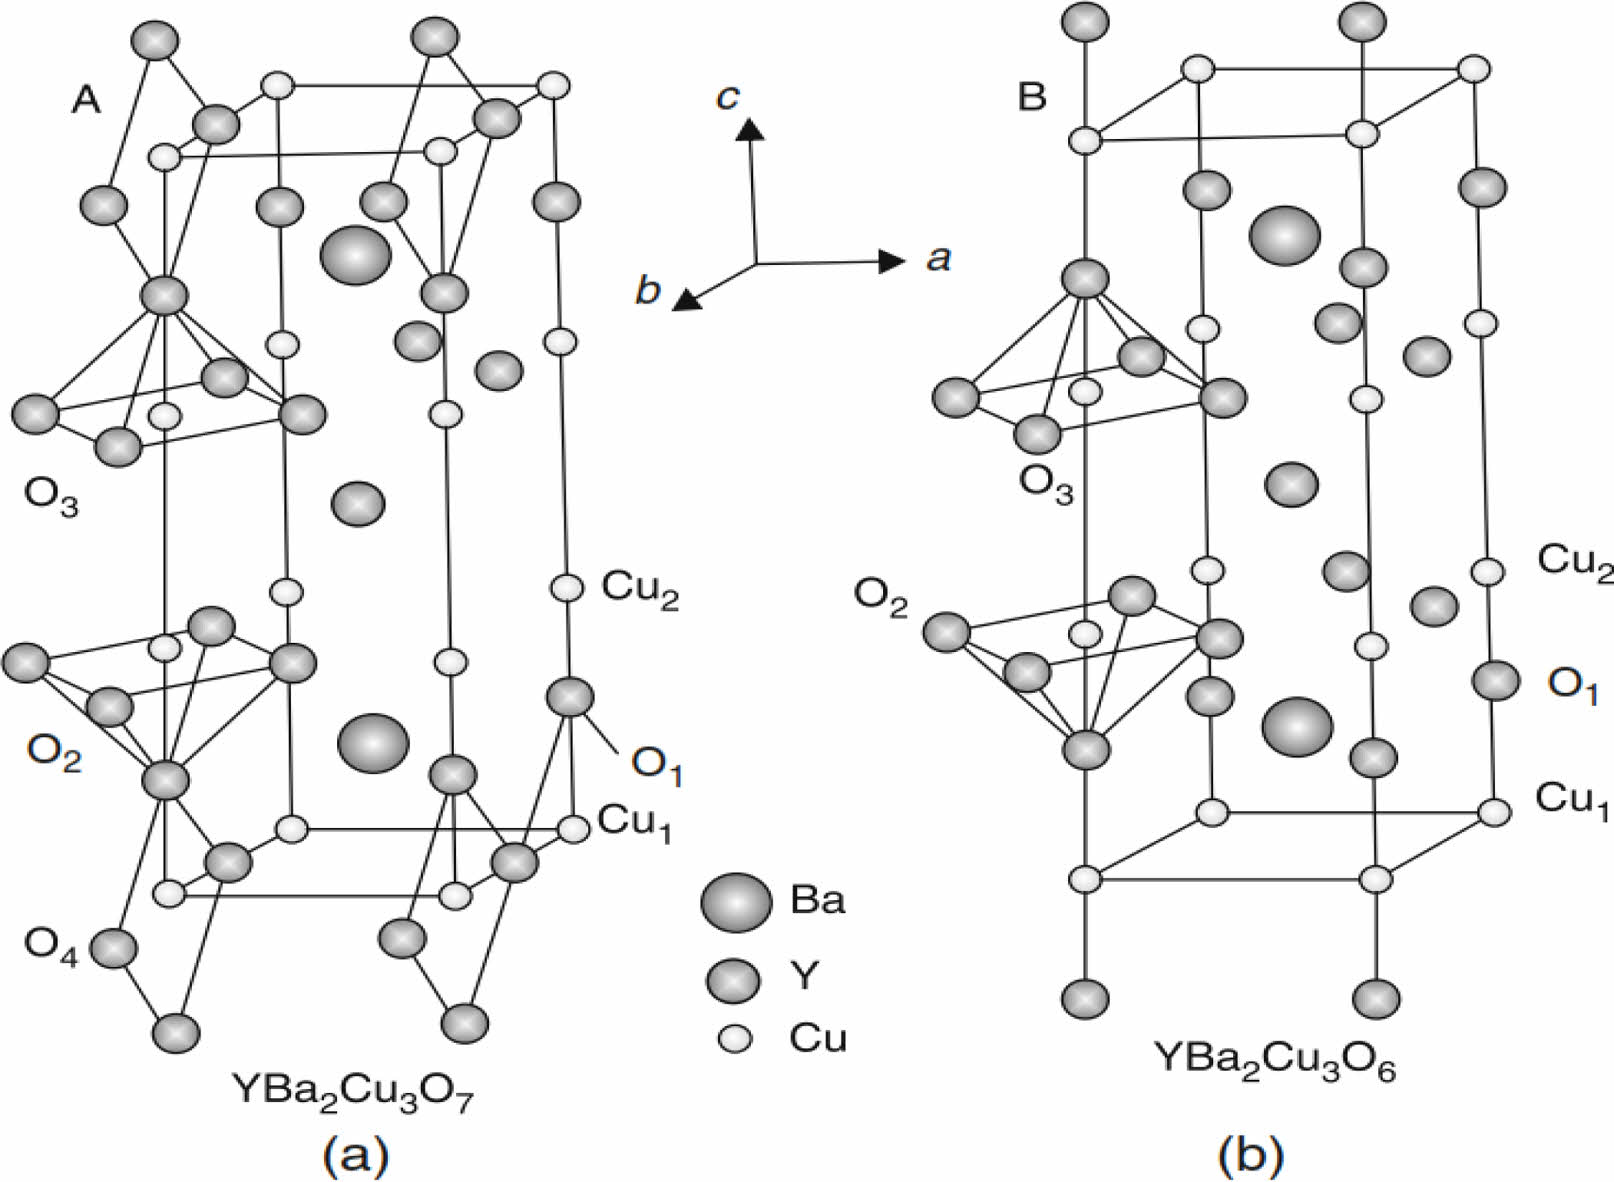
In general, the superconductor compound YBa2Cu3O6.5+d has an orthorhombic structure, and it has two Cu-O sheets in the basal plane and Cu-O chains along the c-axis. The structural phase has a perovskite unit cell with the composition ABX3, shown in Fig. 1. The metallic Cu-cations mentioned by site B are surrounded by six oxygen ions occupying site X. The metallic Y-cation site A occupies the center of the perovskite structure [1]. The multiplying of a perovskite unit cell produces the YBa2Cu3O6.5+d compound, mentioned in Fig. 2. There are many layers represented by the Cu1-O layer having copper ion (Cu1) surrounded by four oxygen ions, and the Cu2-O layer, where (Cu2) is surrounded by five oxygen ions forming tetrahedrons. Both layers are active in the conductivity mechanism. The layers Y-O and Ba-O are included in the structure. The effect of oxygen content in the compound plays an important role; in the specification of superconducting properties. The facts were stated that if (β≤0.5), there is a superconducting state, or if it is equal to (β≤0), there is a non-superconducting state, as mentioned in Fig. 2b.
The unit cell parameters (a, b, and c) varied due to the insertion of extra oxygen (δ) in the unit cell of YBa2Cu3O6.5+d [2]. If the d-value approach to zeroes, the structural phase is a tetragonal or non-superconducting state. There is a predicted correlated relationship between the c-axis and β-value as follows [2].

The assumption is that the bond created by Cu-O atoms in the crystal unit cell of YBa2Cu3O6.5+d is the reason for a conductivity mechanism in the structure during insulated CuO2 layers. The resistance of YBa2Cu3O6.5+d is higher if the carriers moved in the z-direction and lower if flowing through the XY-plane, then it is more effective by Cu-O planes. The second thing was related to a content of oxygen excess in a unit cell represented by d-value, which is in the range (0≤δ≤0.5) [3]. This value is a separating wall between a superconducting and non-superconductor state, i.e. orthorhombic to tetragonal phase transition as mentioned by Eatough et al. [4]. The change in the lattice constants is a key to understanding the conductivity mechanism in the phase (Y-123). Many studies take the phase diagram of YBa2Cu3O6.5+d, and their parameters are affected [5-7]. The effect of substitution in the Cu-ion of the mixture by isovalent ions like Ag, Mo. Sr, Sc [8-12] plays principle roles in the basic properties of the YBa2Cu3O6.5+d high-temperature superconductor and their effect on the anisotropy factor of unit cells [13].
On the other hand, the doping of YBa2Cu3O7-δ by BiFeO3 nanoparticle by the ratio (x=0, 0.2, 1, 1.5, and 2) showed an orthorhombic crystal phase structure with a Pmmm space group. The doping with (x=1%) recorded a high density of Y-123 phase. Whereas, the doping with (x=1.5%) recorded a highest Tc value (91.91 K) improving a superconducting properties [14]. The nanoparticle of high Tc superconductor YBa2Cu3O7-δ was prepared by electrospinning and sol-gel techniques. The nanoparticle size was (20-50 nm) producing Tc-value of about (78 K). The YBCO nanoparticles have single orthorhombic phase structure with agglomerated nanoparticles size of about (388 nm). They found electrospinning in combination with a sol-gel techniques are an effective routes to realize different nanostructure morphologies of YBCO superconductor [15].
In this paper, it is necessary to discuss the presence of Pb2+-ions in the perovskite structure that may cause a displacement of neighboring oxygen ions that make a partial distortion in the lattice constants of the orthorhombic phase [16]. Whereas a high density of Pb-ion made inversion in the lattice constants with still orthorhombic phase appeared (a=5.4019, b=5.4333, and c=15.7388 Å) and a variation in symmetry to space group Cmmm [17, 18]. The effect of Pb-substitution with the ratio (y=0.1-0.5) was applied to study a structural simulation and lattice parameters variation. The large substitution values will give more details on the behavior of the Y-123 high-temperature superconductor comparison with the previous one [16]. The importance of this research is providing an expected phase for Y-123 high Tc superconductor. It is suitable to understand the benefit of Pb substation on the atomic distribution within the unit cell. This behavior is useful in the understanding the conductivity mechanism in Y-123 high Tc superconductor.
|
Fig. 1 The principle perovskite unit cell by the formula ABX3 [1]. |
|
Fig. 2 The multi-perovskite structure of YBa2Cu3O6.5+δ (a) it has orthorhombic phase (a=3.823, b=3.885, c=11.7 Å). (b) It has tetragonal phase (a=b=3.86, c=11.7 Å) [1]. |
The samples YBa2Cu3-yPbyO6.5+d were prepared by solid-state reaction as discussed before [19] for different values of (y=0-0.5). The results of X-ray diffraction had analyzed and refined by defined software. The change is possible in simulated X-ray diffraction and the expected unit cell that was predicted. The software CrystDiff and Endeavour was applied to complete the simulation. In addition, the simulation will produce the atomic positions in a unit cell. This will give more details about the conductivity mechanism that might be happening in the system Y-123, as discussed before in the system Hg-1223 [20]. The second point, it is possible to correlate the extra oxygen content during Iodmetric titration. They are probably of atomic position in a predicated unit cell.
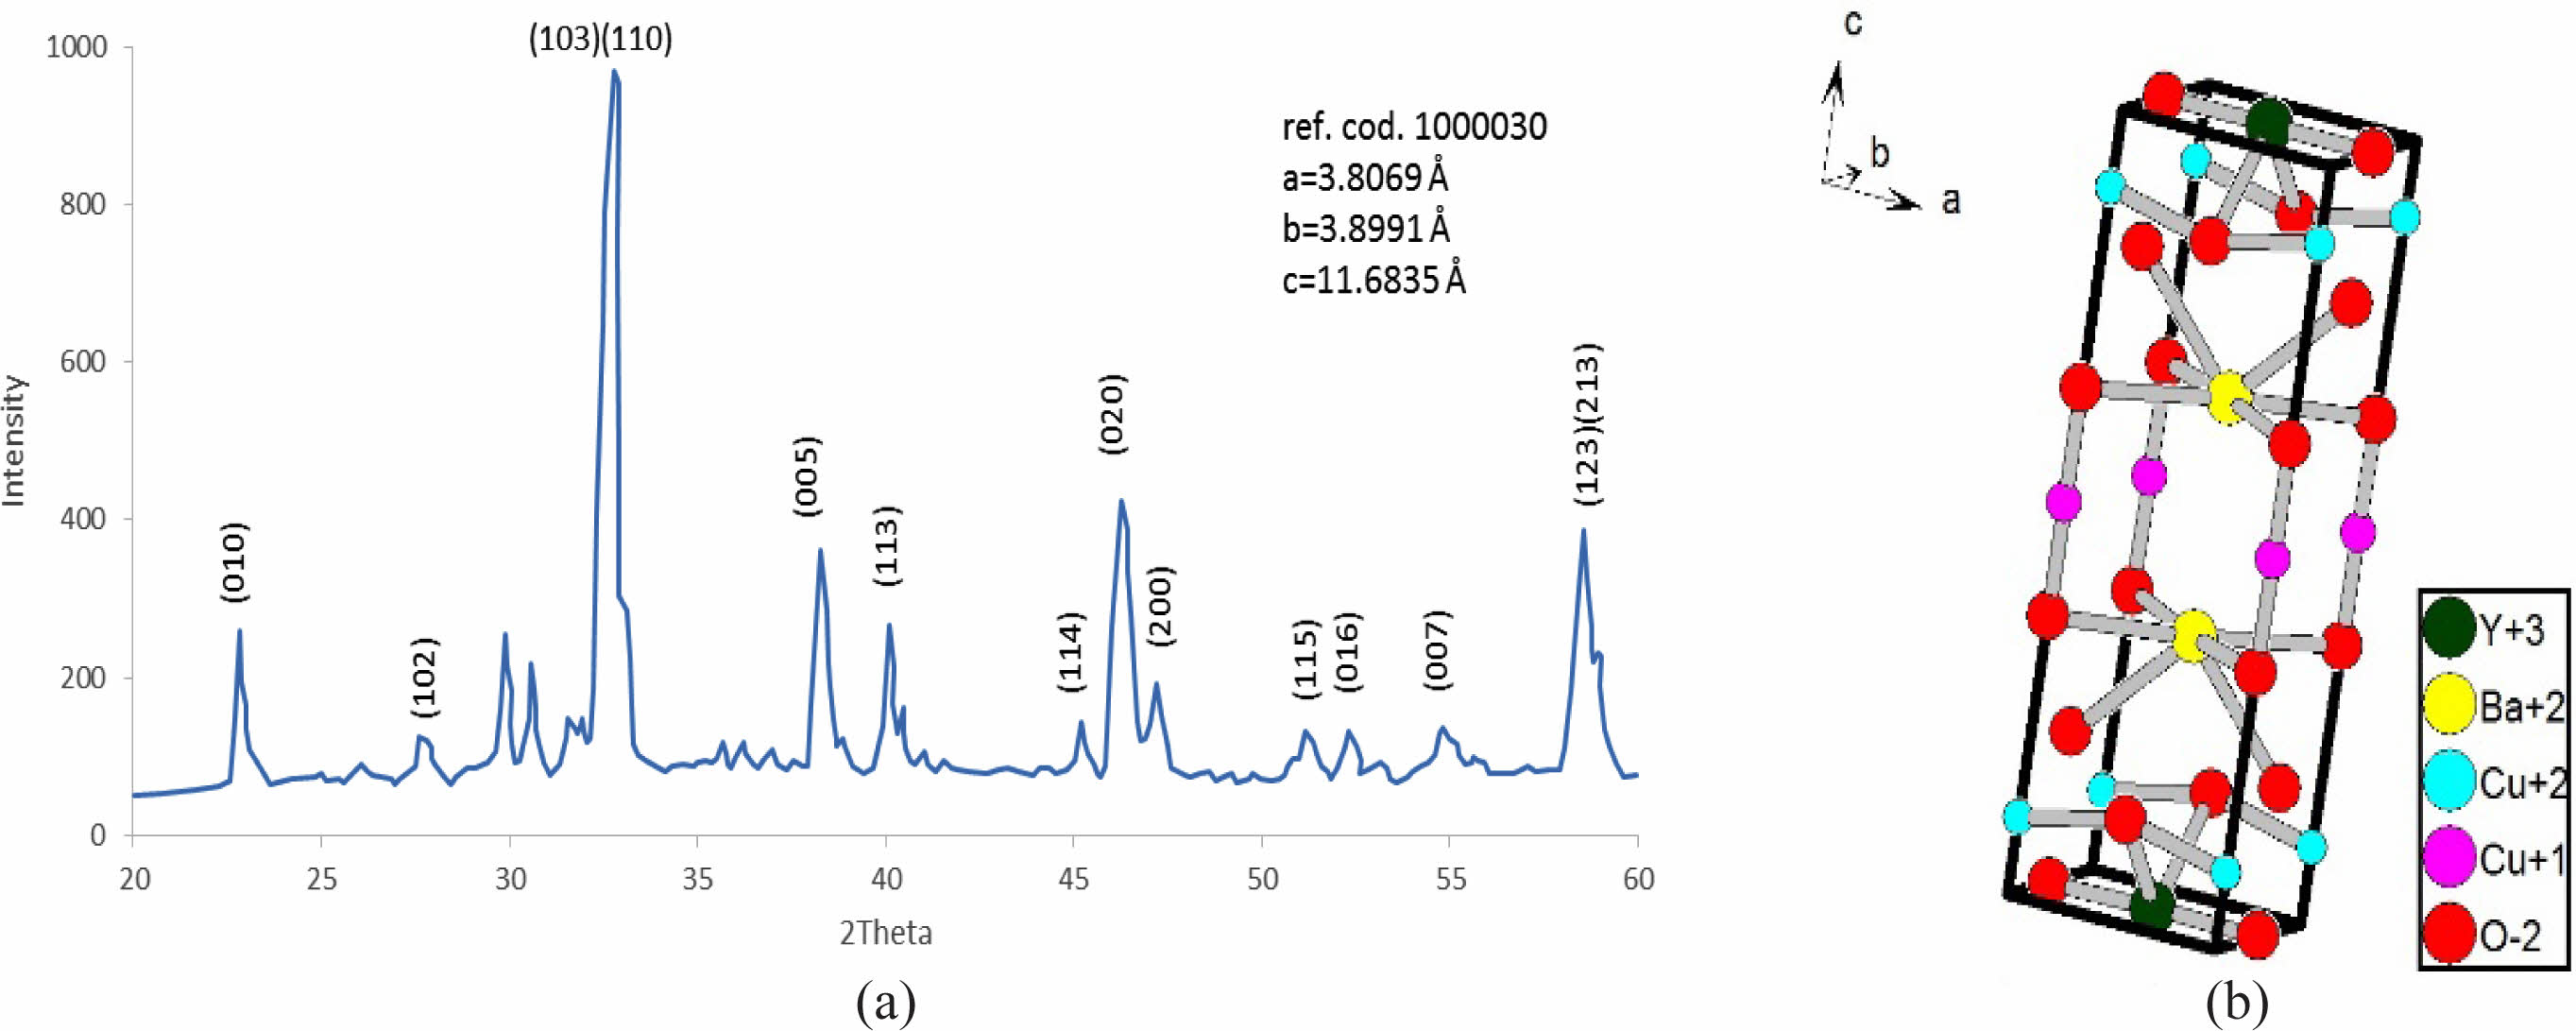
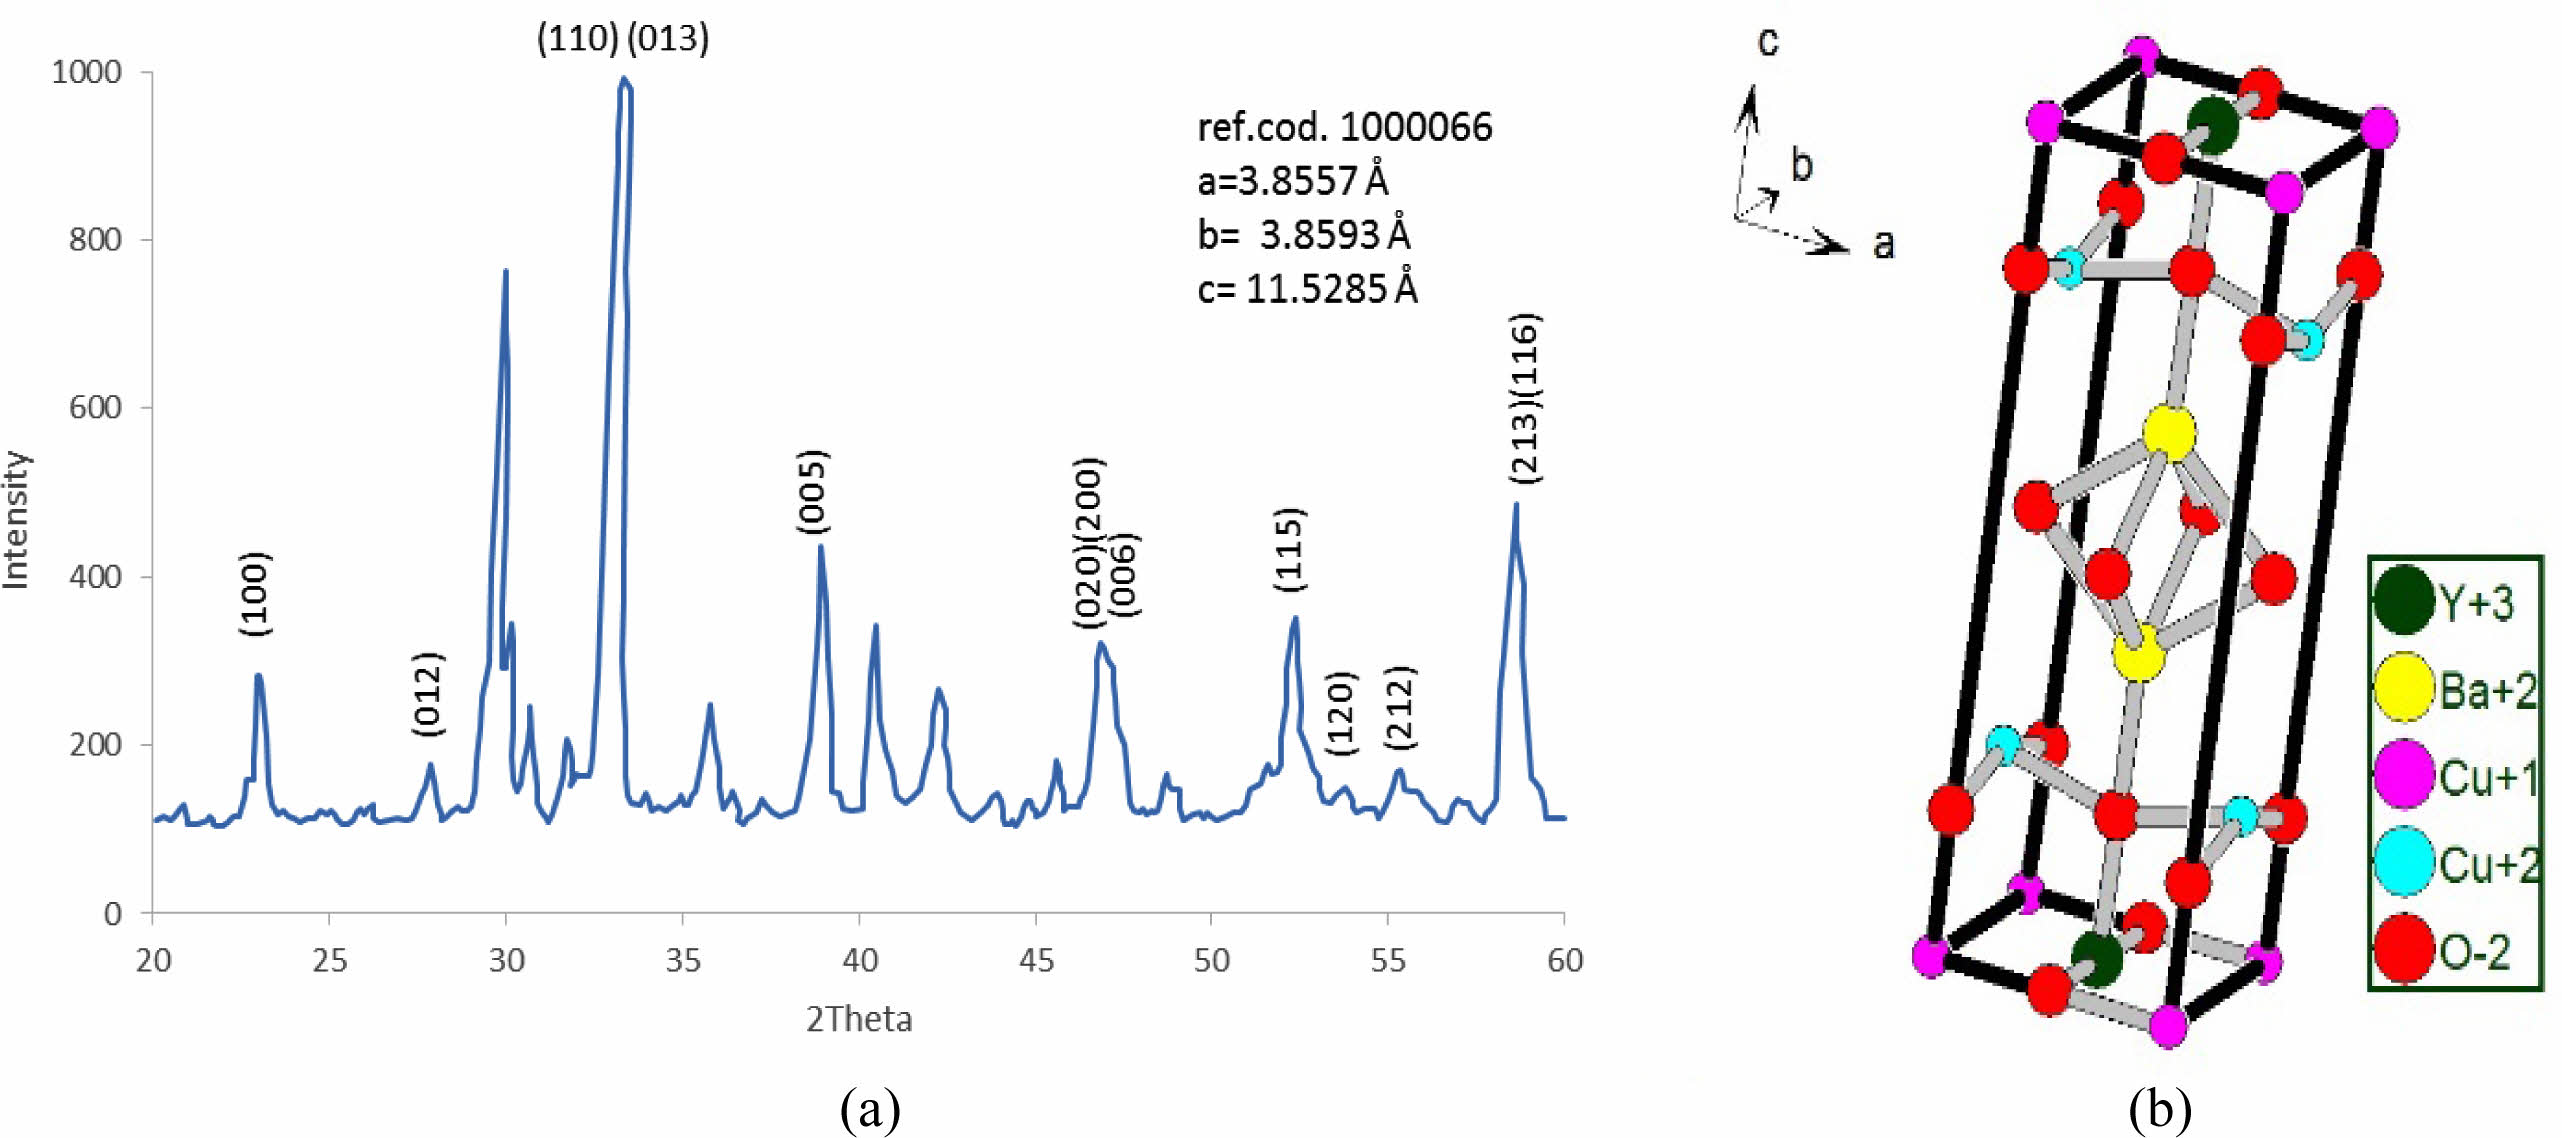
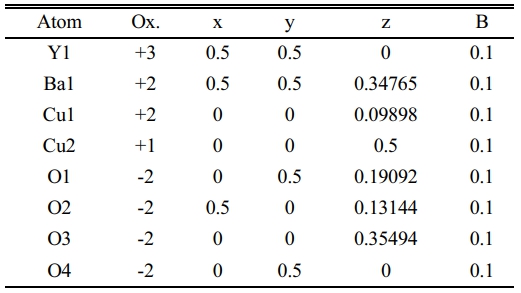
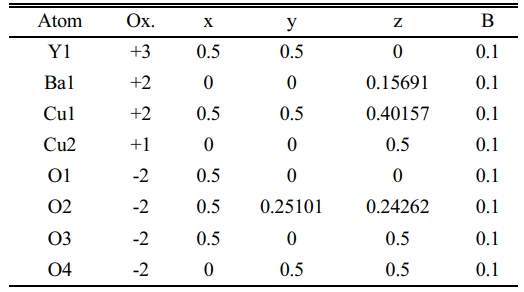
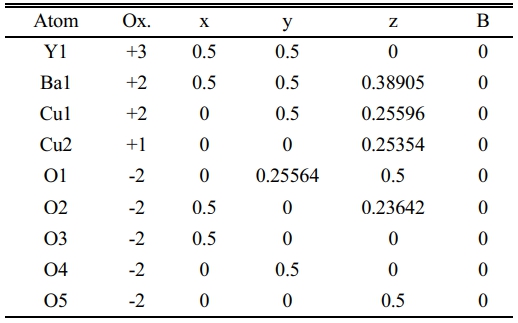
After a successive preparation of all samples by solid state reaction, the resistivity measurements and recording a certain critical temperature and oxygen excess (d) as mentioned in Table 7. The substitution of Pb+2-ion (y=0.1-0.5) concerning to Cu+2-ion is different from Heep [8], this fact is making this research is a pioneer because it takes a simulation in a phase deformation due to the substitution. The results of X-ray diffraction for all samples under study had been analyzed and refined by using CrystalDiffract software, and the simulated unit cell predicated by Endeavour software. Their results are mentioned in Fig. 3-8 for different value of Pb-concentration respectively. The standard database mentioned by 1000030 and 1000066 was used for the simulation. The principle peaks mentioned in a single phase of a pure sample YBa2Cu3O6.873 appeared in Fig. 3 that is agreement with Cava et al. [21]. The principle peak is remarking by the following Miller indices (010), (103), (110), (005), (113), (020), (200), (123), (213). Most of those peaks are compatible with Lopez et al. [22]; they showed an orthorhombic phase with lattice constants (a=3.819, b=3.884, and c=11.683 Å). There is an approach with the obtainable results during the simulation on a pure sample that showed an orthorhombic phase with a lattice constant (a=3.8069, b=3.8991, and c=11.6835 Å), as shown in Table 7. The splitting in the peaks (020) and (200) is a function of appearing the orthorhombic phase, whereas the merging in both peaks produces a tetragonal phase. The orthorhombicity ratio regularly appears concerning the substituted sample by Pb-atoms (1.19%). The simulation on the XRD patterns is predicting a uint cell mentioned in Fig. 3b. The position of atoms regarding simulation is mentioned in Table 1, there is a partial difference in the atomic sites comparision with previous study [23].
On the other hand, the substitution of (Pb=0.1) showed a decrease in the intensity of such peaks as remarked by (101), (113), (020), (213), as shown in Fig. 4a. This decrease is a sign of a variation of lattice constants that showed more orthorhombicity, as mentioned in Table 7. There is a distinction between the simulated unit cells (a, b) and the values of a pure sample as a function of Pb insertion in the mixture. That is orthorhombicity value was recorded (2.22%). They are a separation layer created by the Cu+1-ions. Whereas the insertion of Pb-ions created the Cu+1-O layer, it might be inserted Pb-ion in stade of Cu+1 in this layer. It might be the reason for polarizing more oxygen. At the same time, the creation of tetrahedron structure is due to the presence of Pb-ions in the unit cell, as shown in the simulated unit cell Fig. 4b. The oxidation value for lead is (+2, +4), which is twice the oxidation number for copper. This point will make the polarization of more oxygen by lead rather than copper. The atomic positions in a simulated unit cell appear in Table 2.
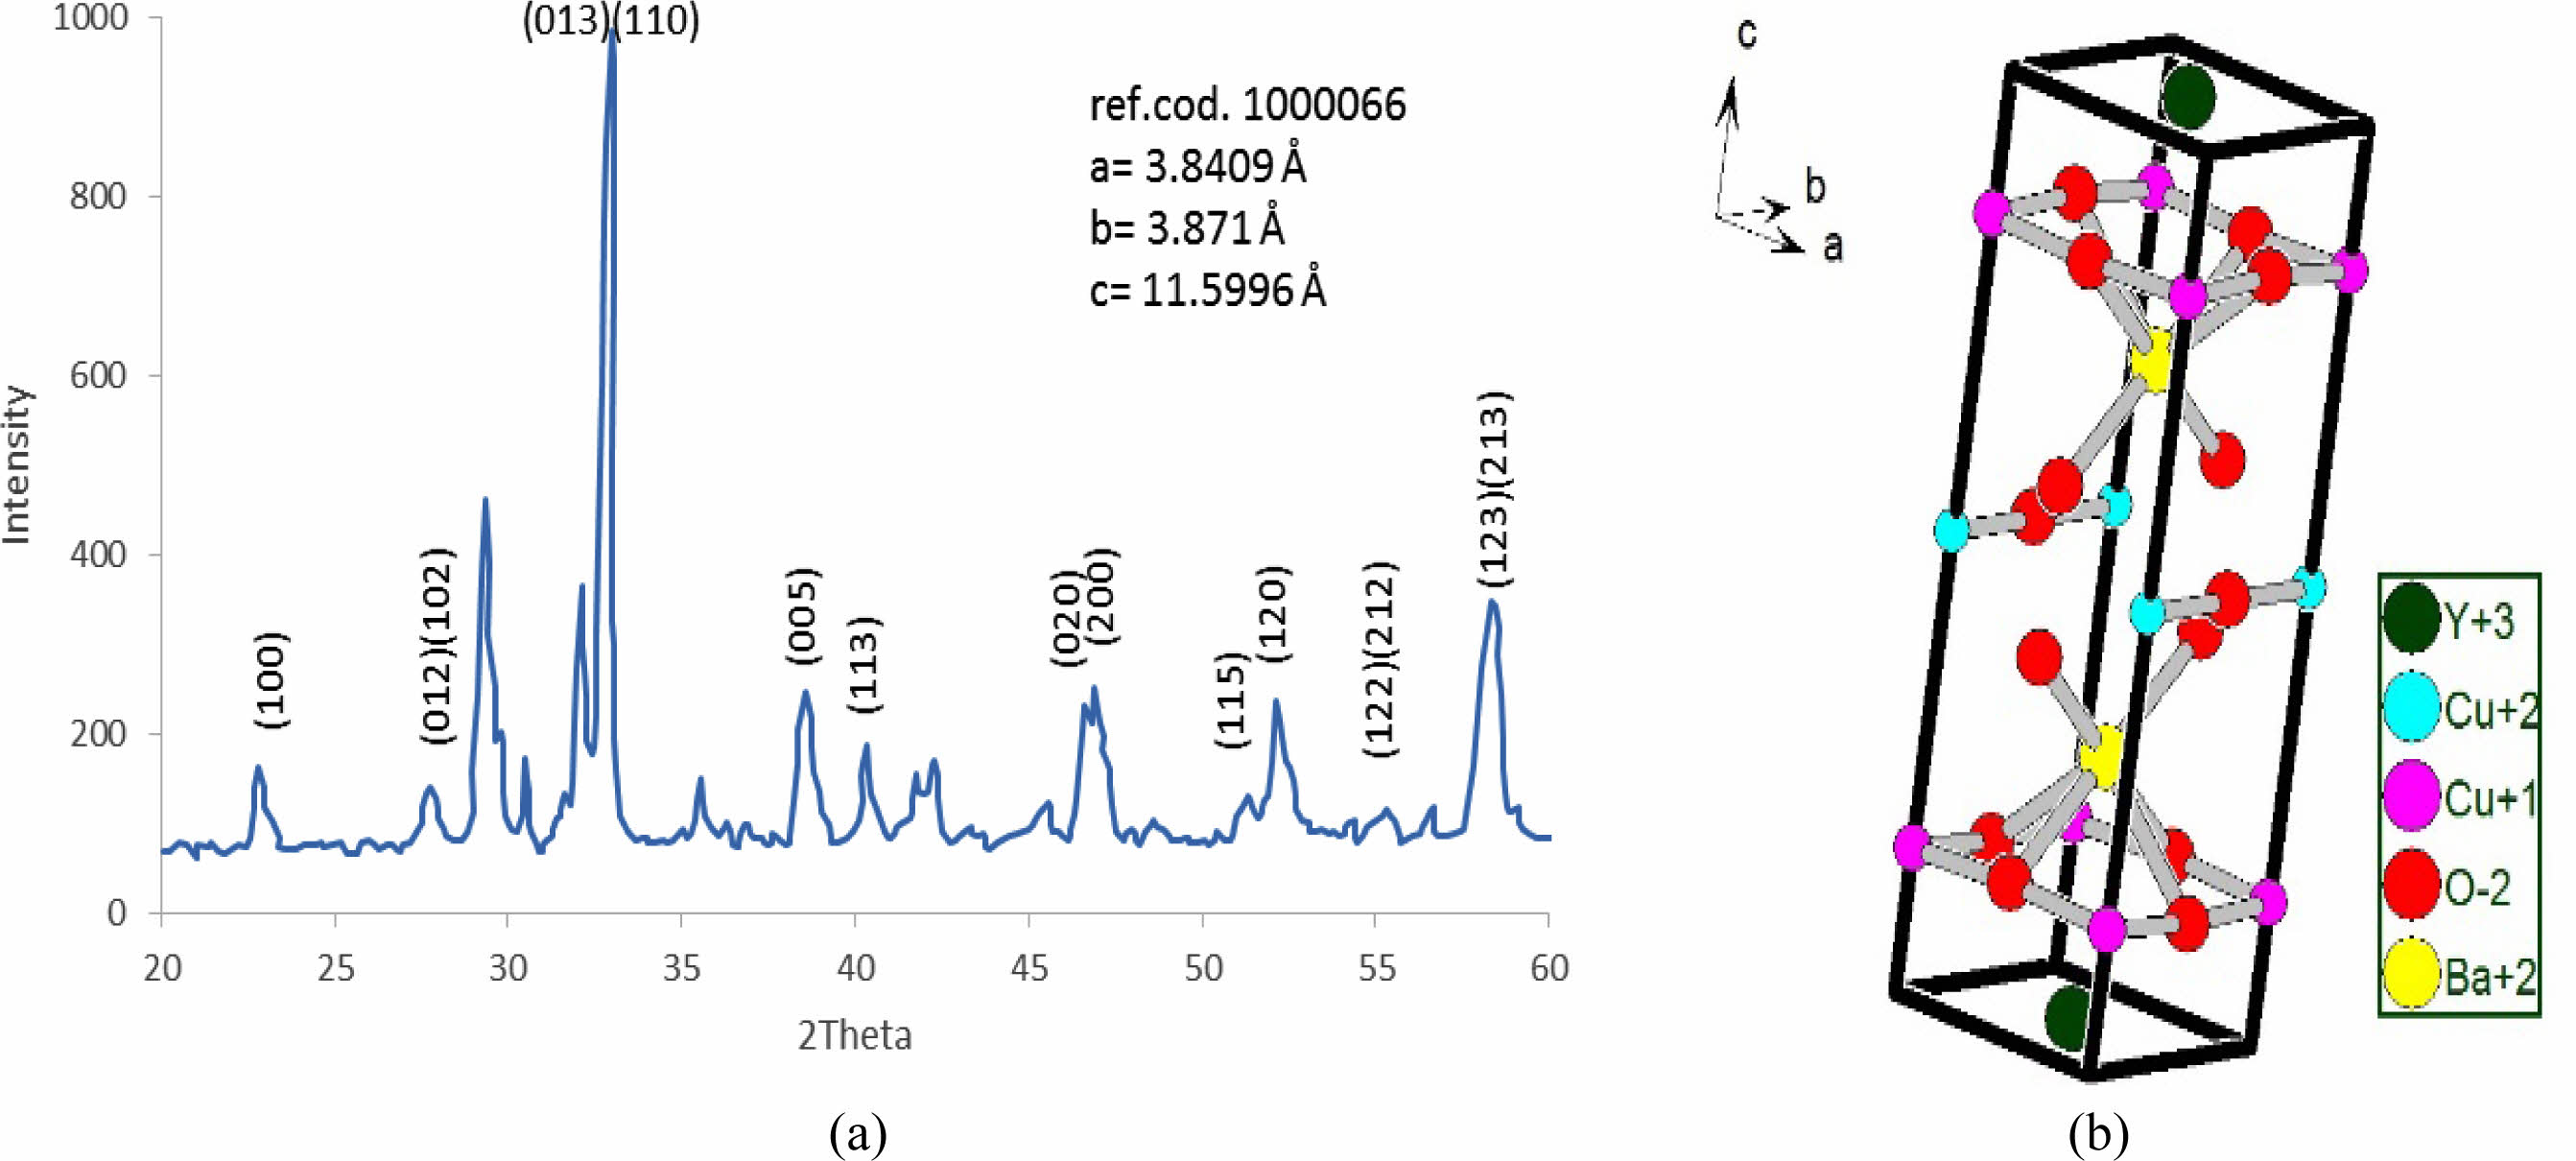
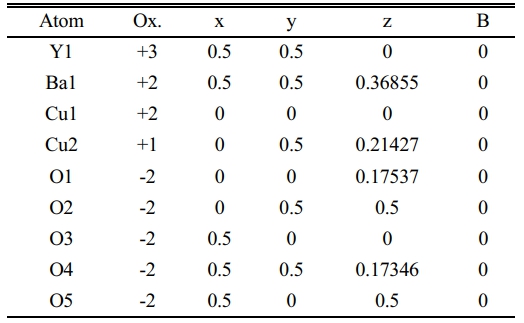
The substitution ratio (Pb=0.2) had a direct effect; on the structural phase during the refinement of the XRD pattern and the simulation of the unit cells, as mentioned in Fig. 5a, b. There are new peaks labeled by (2θ=29.979, 30.132, 30.11, 30.696, 35.777, 38.931, and 42.259), which might be related to the bonding of Pb-atom with oxygen atoms or others. The appearance of those peaks is related to the insertion of Pb-atoms per unit cell compared with pure ones. The results exhibited a tetragonal phase through the equality of (a, b) values and creating an octahedron in the central unit cell, as shown in Fig. 5b; it was composed of Ba-ions and O-ions. The lowest value of orthorhombicity of about (0.17%) appeared for this reason. It is believed that Pb-ions will take place at the site of Cu+2-ions in the layer above and below the octahedron structure. The presence of Pb-ions makes a bending in a bond Pb-O2 that is proof of the appearance of a tetragonal phase. The simulated output was recorded in Table 3. There is a slight variation of Cu(2) atom in the unit cell as a partial substitution by Pb+2-ion in comparison with a previous study [9]; they used Mo-atom as substitution with Cu-atom by a ratio (0.2). An important thing is appearing five sites of oxygen atoms per unit cell, which means there is more oxygen polarizing per unit cell due to the substitution (Pb=0.2) in the mixture.
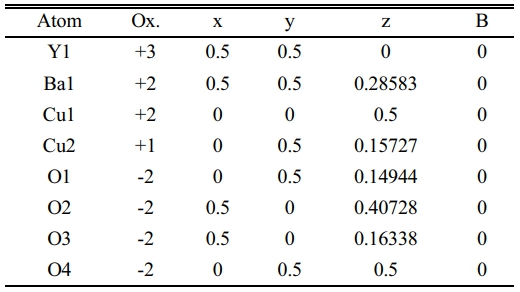
The same things happened at (Pb=0.3) as shown in Fig. 6a, b. The bending is lower than before, which is the reason for orthorhombic starting with an orthorhombicity ratio of (0.39%), as shown in a simulated unit cell Fig. 6b. The position of atoms within the proposed unit cell is exhibited in Table 4. The elongation in the c-axis makes the substitution value (0.3) more effective. The extension in the c-axis comes from taking an interstitational site for Pb substituted atoms along the c-axis. The strange peaks appeared at (2θ=29.37, 30.494, 32.166, 35.531, 42.194, and 42.296), which are related to Pb substitution per unit cell with slight shifting in their positions from the previous one. This is a direct effect on a partial variation in the lattice constants. The creation of tetrahedrons in the upper and lower of multi-perovskite is clear based on the Ba-ions. The high elongation in the b,c-axis is mentioned in Table 7.
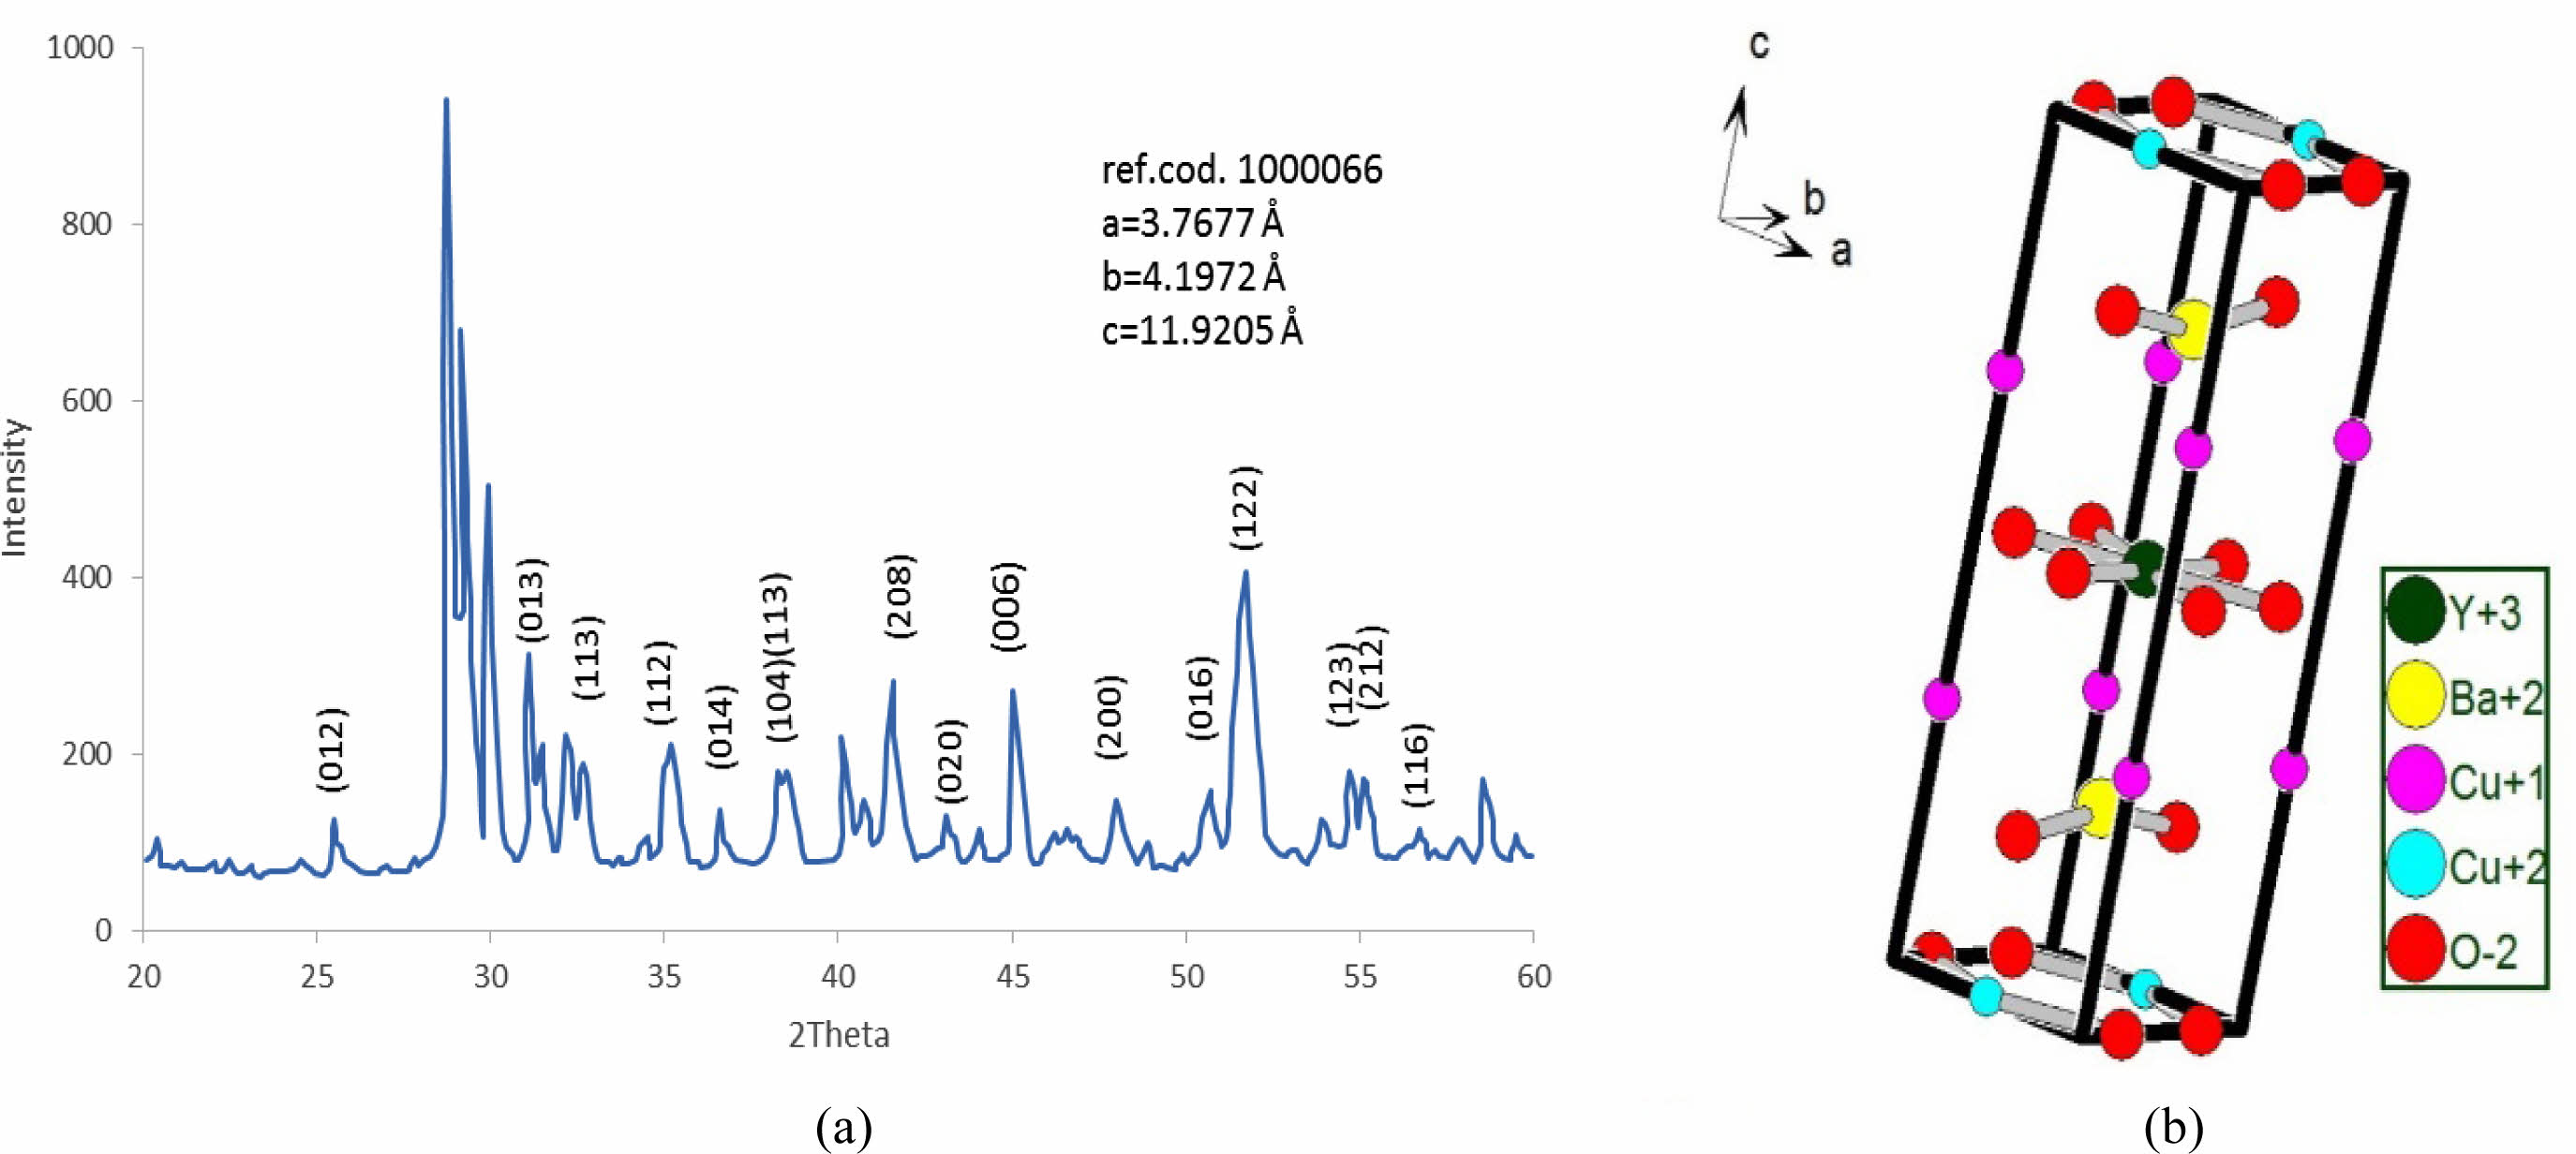
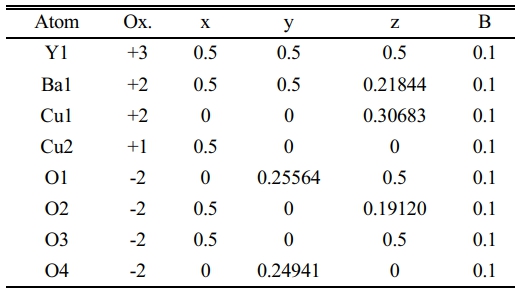
The substitution value (Pb=0.4) appears in the XRD pattern, as shown in Fig. 7a. There is an increase in the intensity of new peaks mentioned by (2θ=28.717, 28.817, 28.867, and 40.0747). The sharp increase in those peaks has a direct reason for the excess in both axes (b, c), as mentioned in Fig. 9 and Table 7. The high intensity of those peaks is regarding the high concentration of Pb-atoms. The analytical results showed lattice constants (a=3.7677, b=4.1972, c=11.9205 Å) with a high orthorhombicity ratio of about (5.39%). The sharp difference in the lattice constants (a, b) is related to a high density of inserted Pb-atoms per unit cell incomparable with pure one. The simulated unit cell is shown in Fig. 7b; the new thing regards the appearance of new bonds in both basal planes, which are created between O-Pb-O. This is a direct reason for increasing the axes (b, c). The creation of the Y-O3 bond is considered a separation layer between both sides of an orthorhombic unit cell. This layer acts as an insulating layer between both sides and removes the tetrahedron within the unit cell. This may be attributed to high resistivity in comparison with pure one. The output of the simulated unit cell is noticed in Table 5, which shows the site of atoms appearing in the unit cell. The Pb-atoms are taking the position of Cu+2.
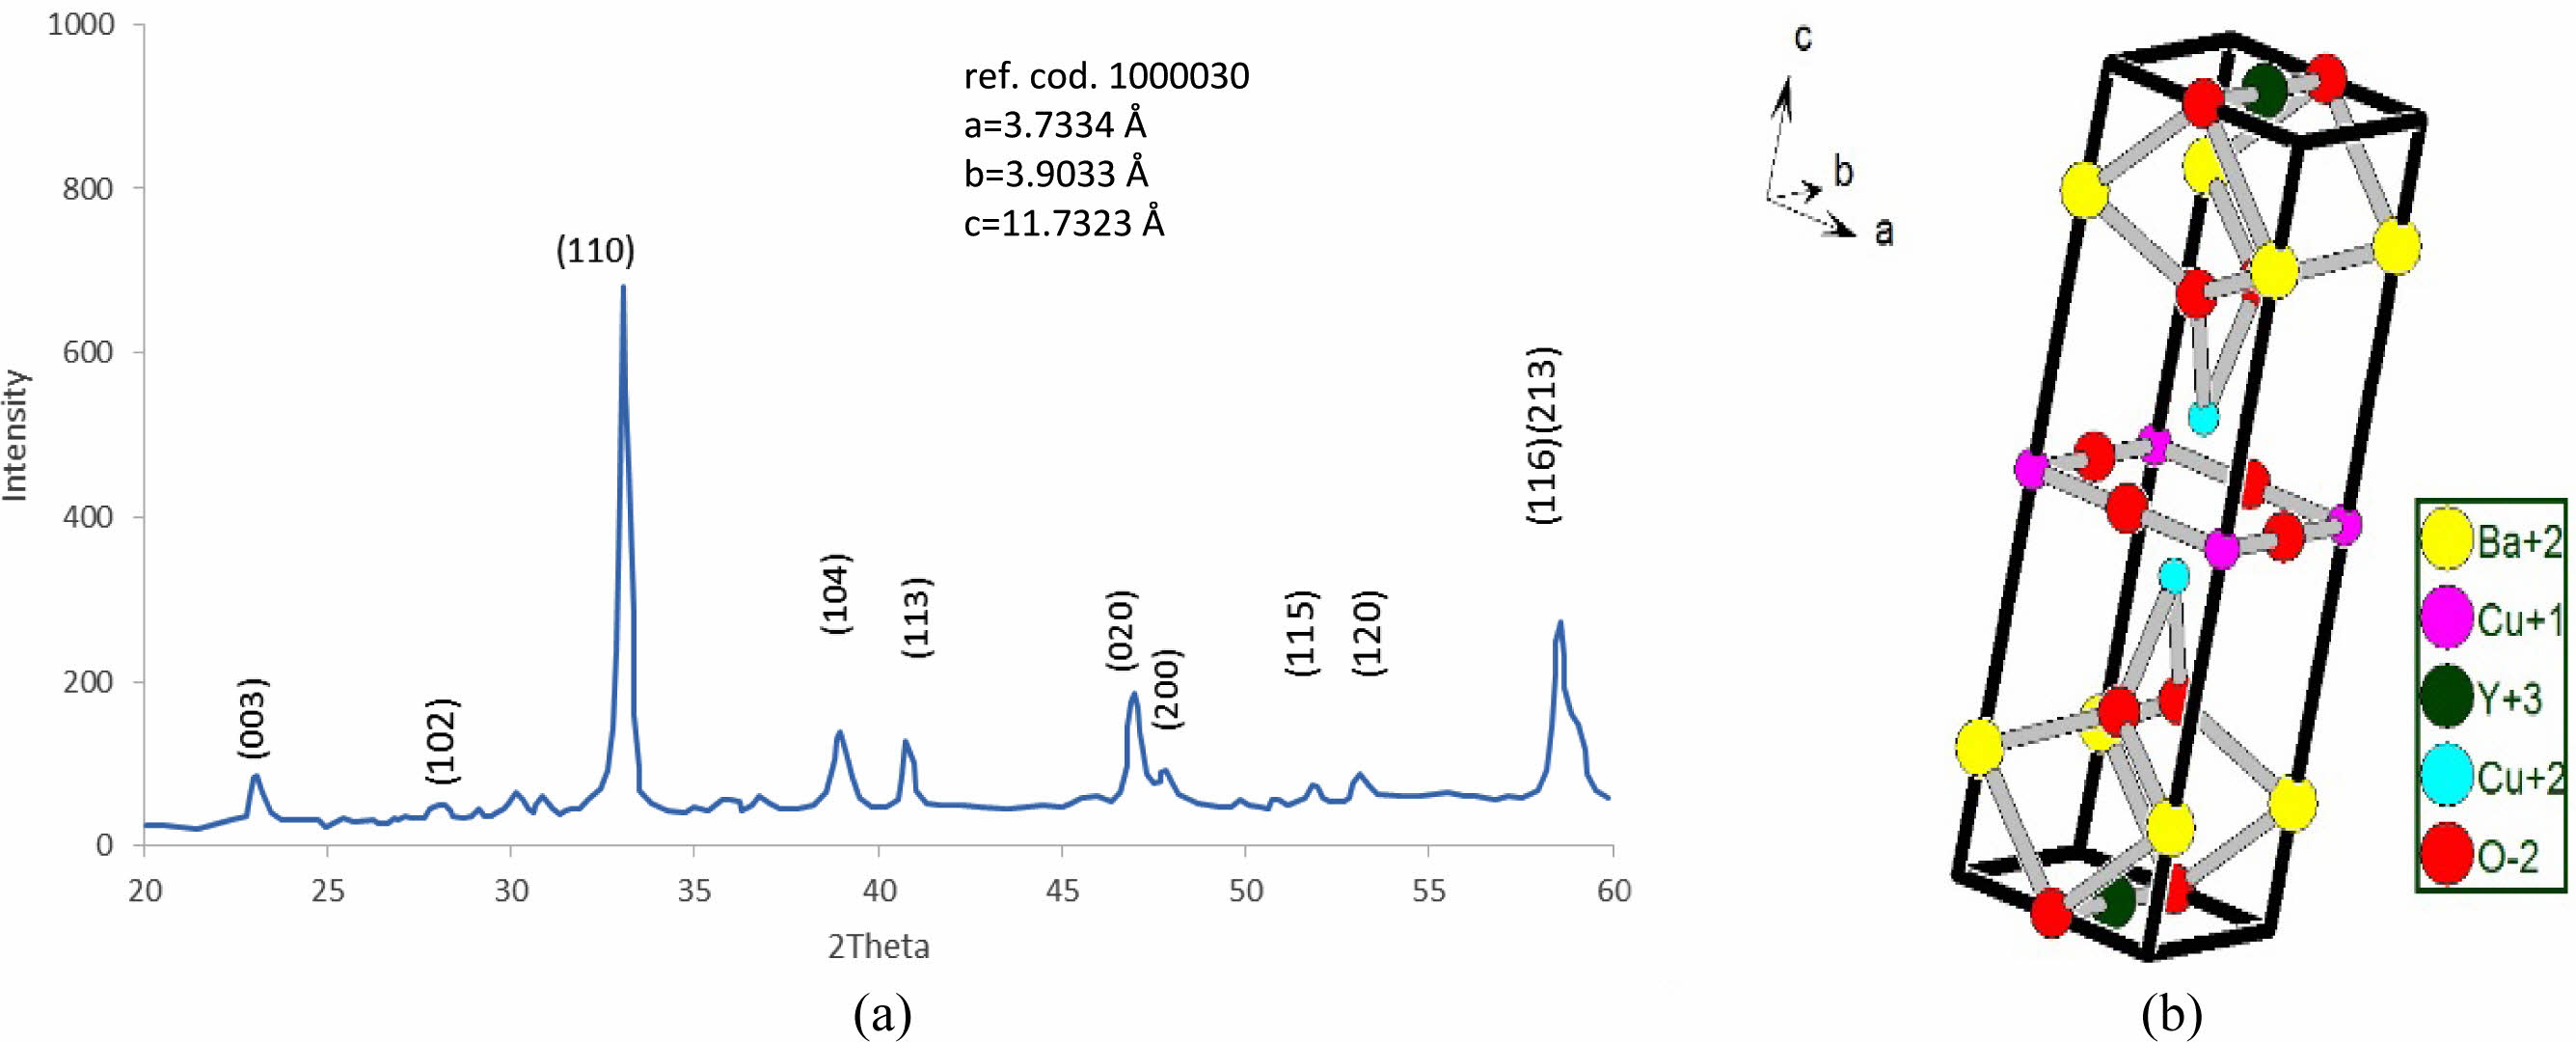
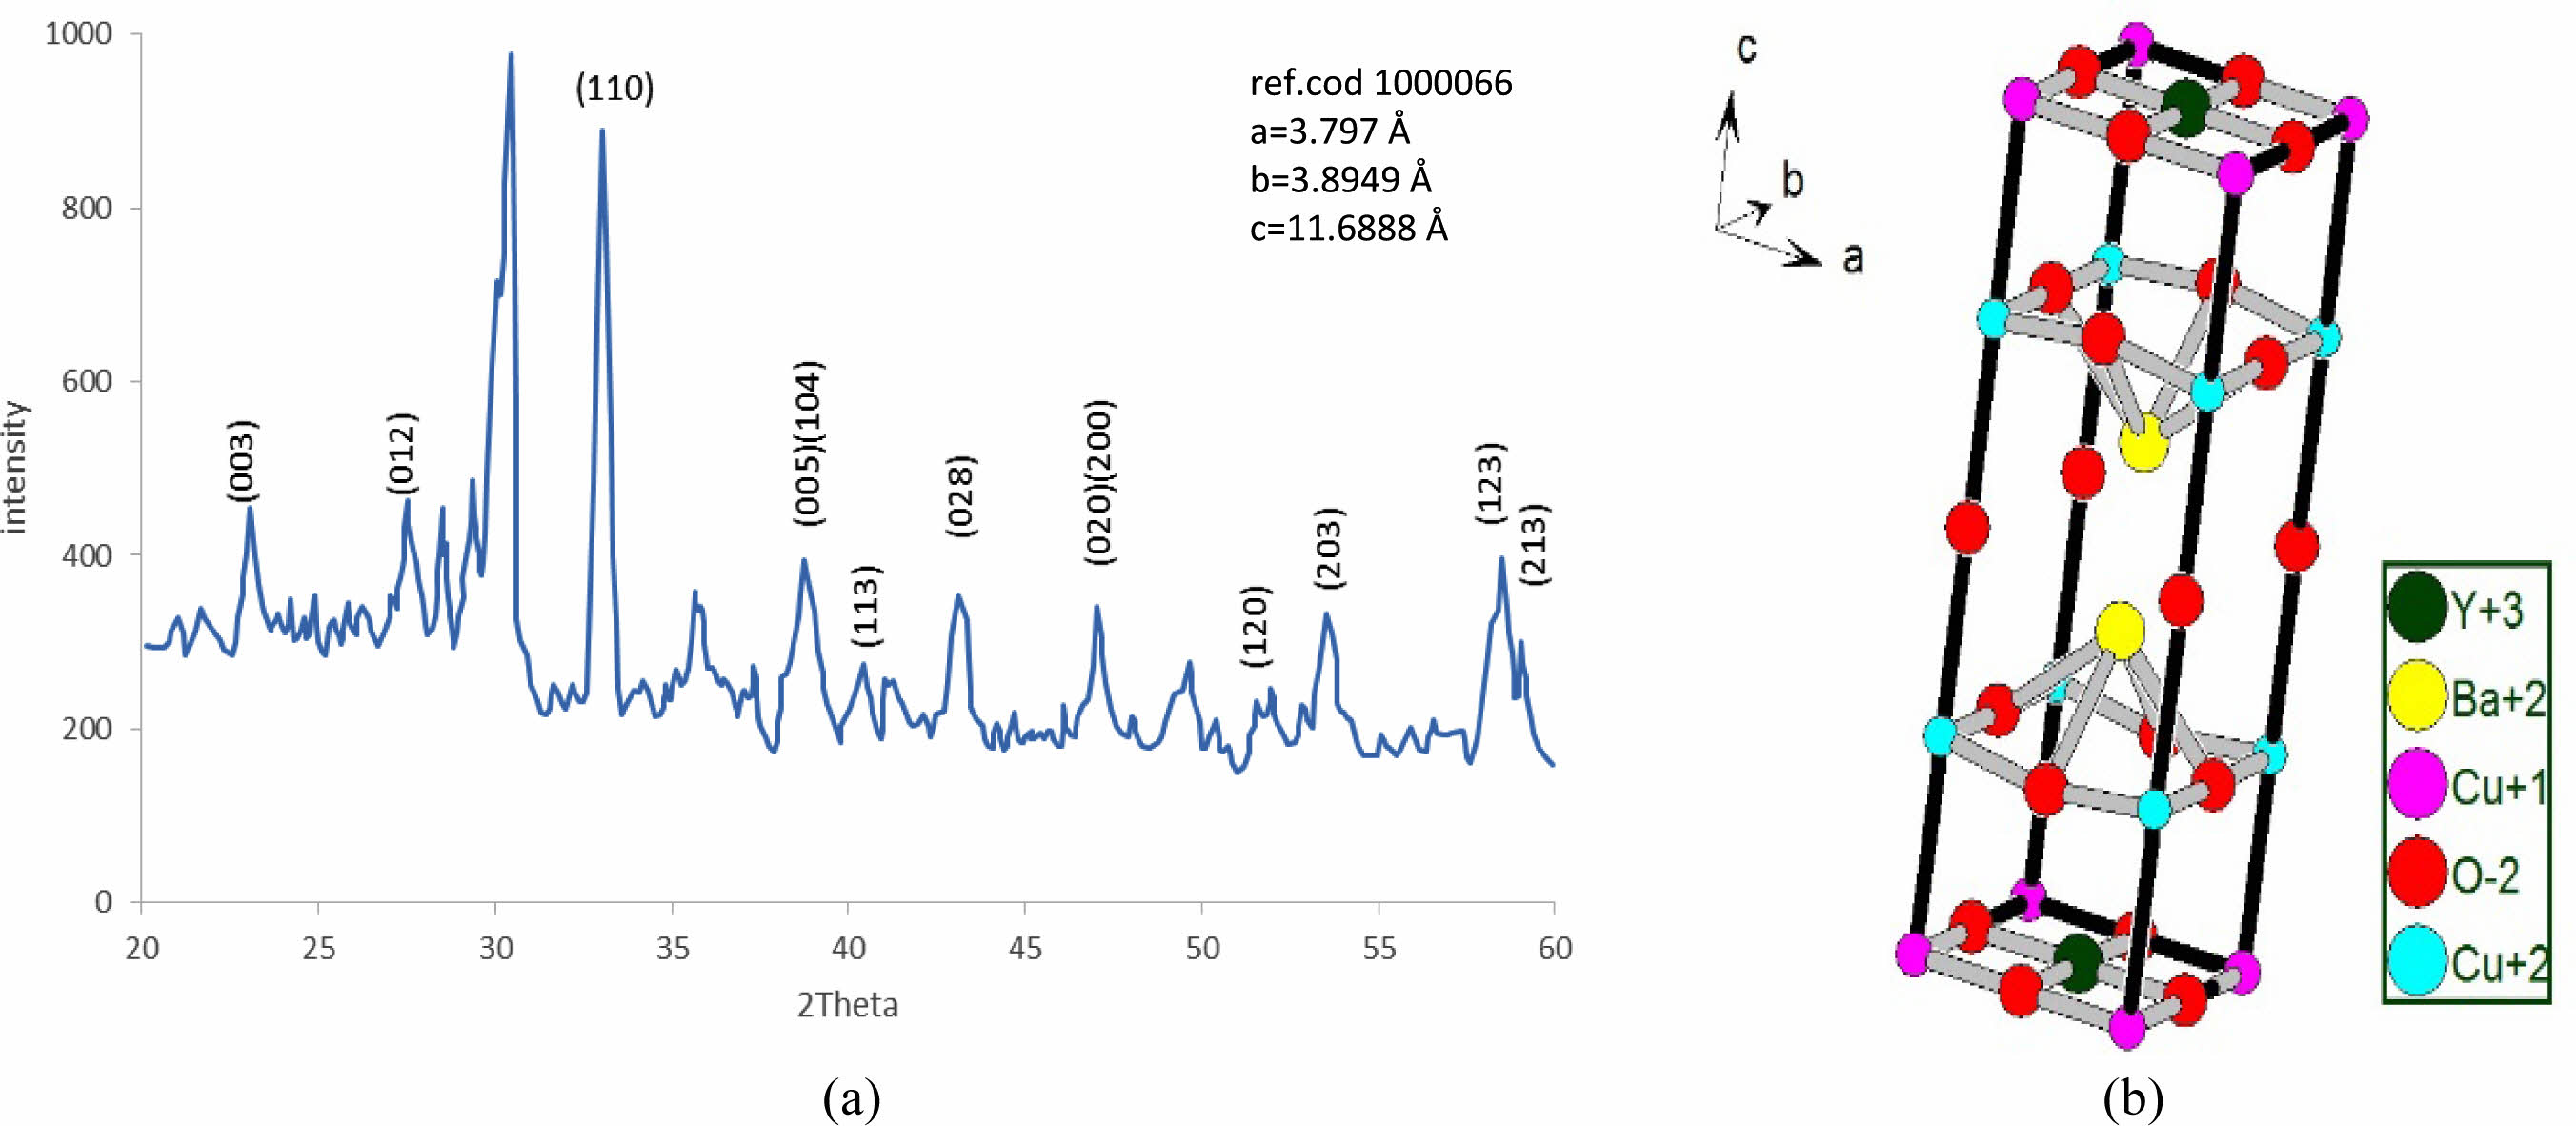
The substitution of (Pb=0.5) is remarking in Fig. 8a; there is a still appearance of new peaks mentioned by (2q=28.503, 29.37, 35.843, 41.426, and 49.705). The refinement on XRD-pattern producing lattice constants (a=3.797, b=3.8949, c=11.6888 Å), with an orthorhombicity ratio of (1.27%) like a pure sample. This contradicts Sunshine et al. [24], who showed a tetragonal phase with lattice constants (a=3.836, c=11.857 Å). The simulation of the lattice constants producing a predicated unit cell is shown in Fig. 8b, and their atomic sites per unit cell are mentioned in Table 6. The results proved the presence of five sites for oxygen atoms per orthorhombic unit cell rather than the previous study [24], which showed two oxygen atomic sites per unit cell. The high concentration of oxygen atoms within a unit cell means more orthorhombicity mentioned in Table 7. The simulation showed the appearance of tetrahedrons within the unit cell, which might be affected by the improvement of normal conductivity. It is well known that the insertion of Pb-atoms is happening concerning Cu+2-ions. So it is clear that Pb-ions is a part of the tetrahedron structure. This is the main difference concerning the substitution (Pb=0.4).
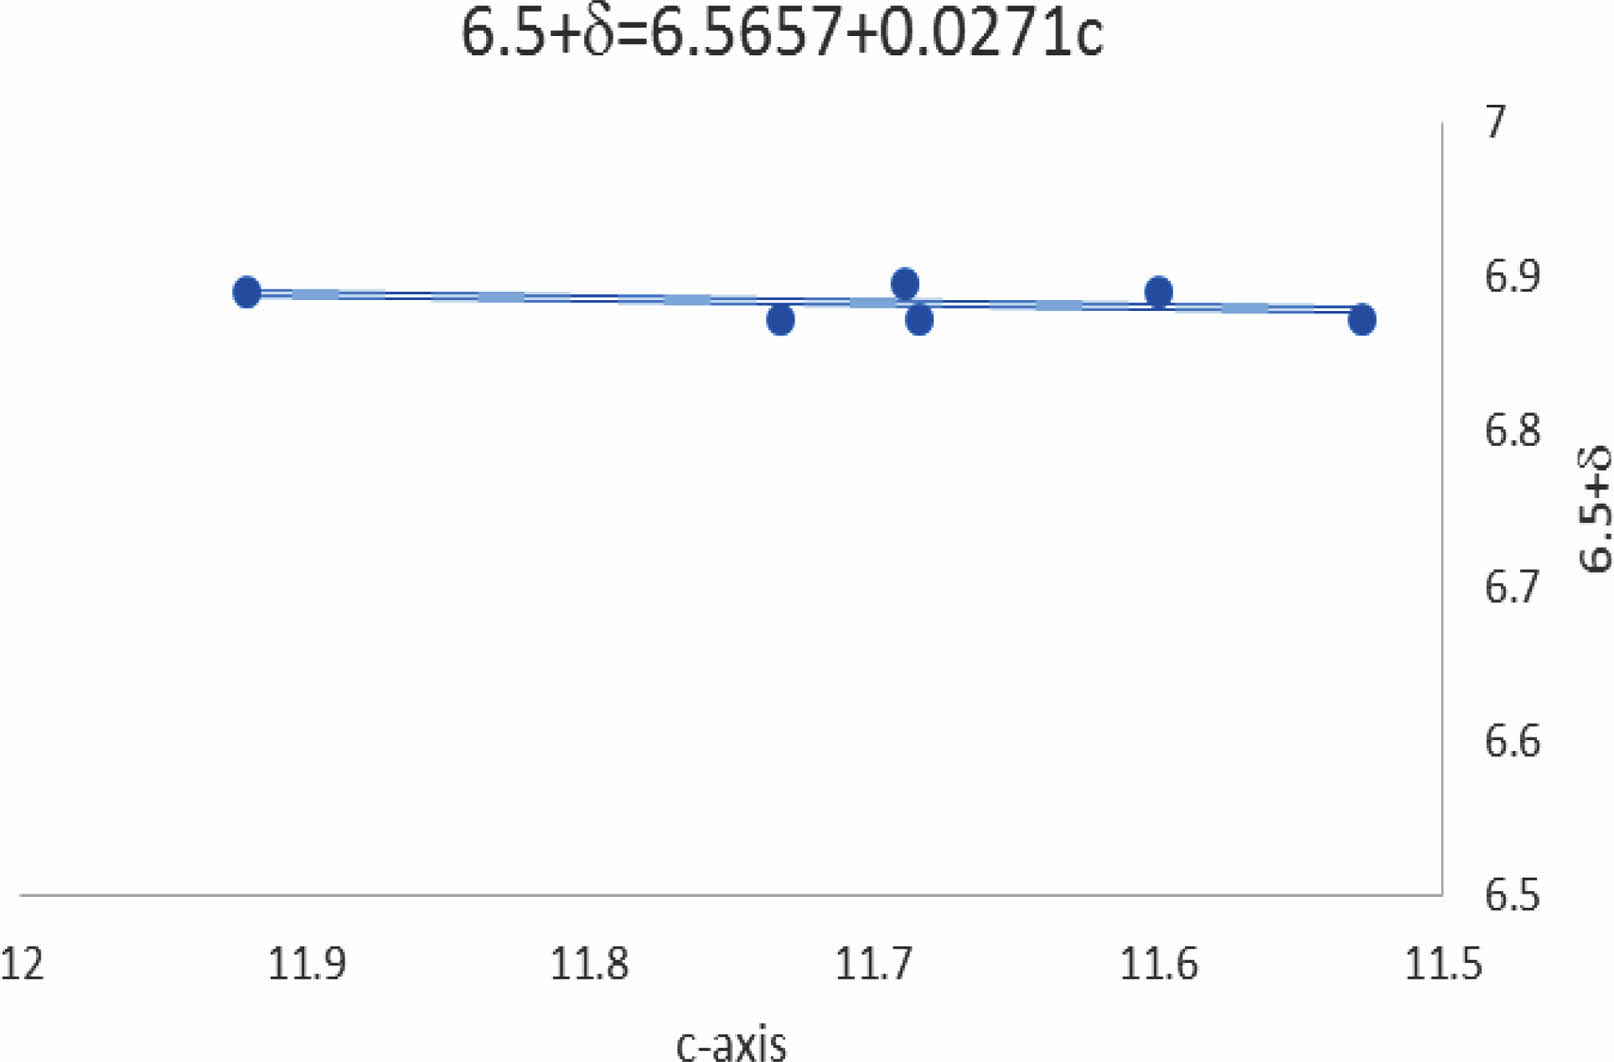
In general, there is a variation in the lattice constants as a function of lead substitution concerning Cu+2. Substitution of Pb+4-ions might be attributed to polarizing more oxygen atoms within the unit cell. The relation of the c-axis with δ-values is shown in Fig. 10; it is a fitting equation related to the line function produced between the c-axis and the oxygen excess represented by δ-values Y-123 substituted by Pb-atoms. This is another proof of the insertion of Pb+2-ion concerning Cu+2-ion with the unit cell. The fitting equation is (6.5+δ=6.5657+0.0271c) mentioned in Fig. 10. The predicted equation is a more accurate comparison with the predicated one by Benzi et al. [2] for many reasons. The first one is regarding the stoichiometry of oxygen in the mixture (6.5) by the chemical reaction and the δ-value is an additive oxygen atom per unit cell during the Iodmetric titration. Secondly, the predicted equation is more comfortable with the data concluded rather than the previous one [2].
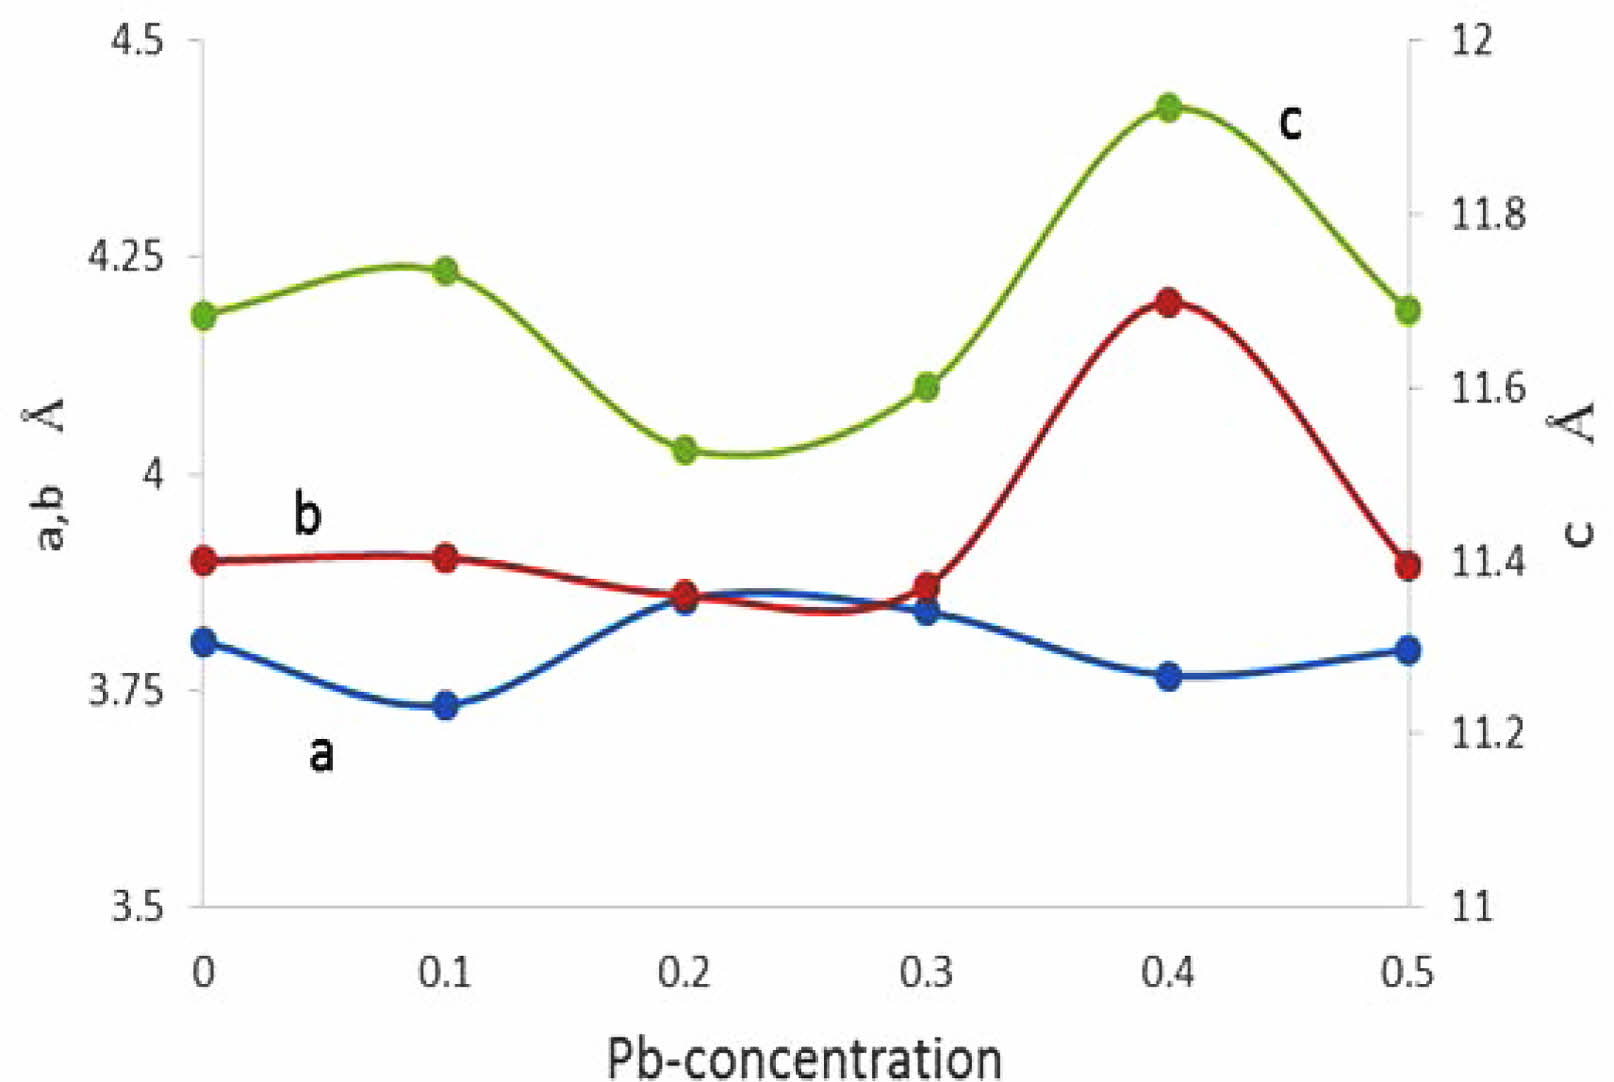
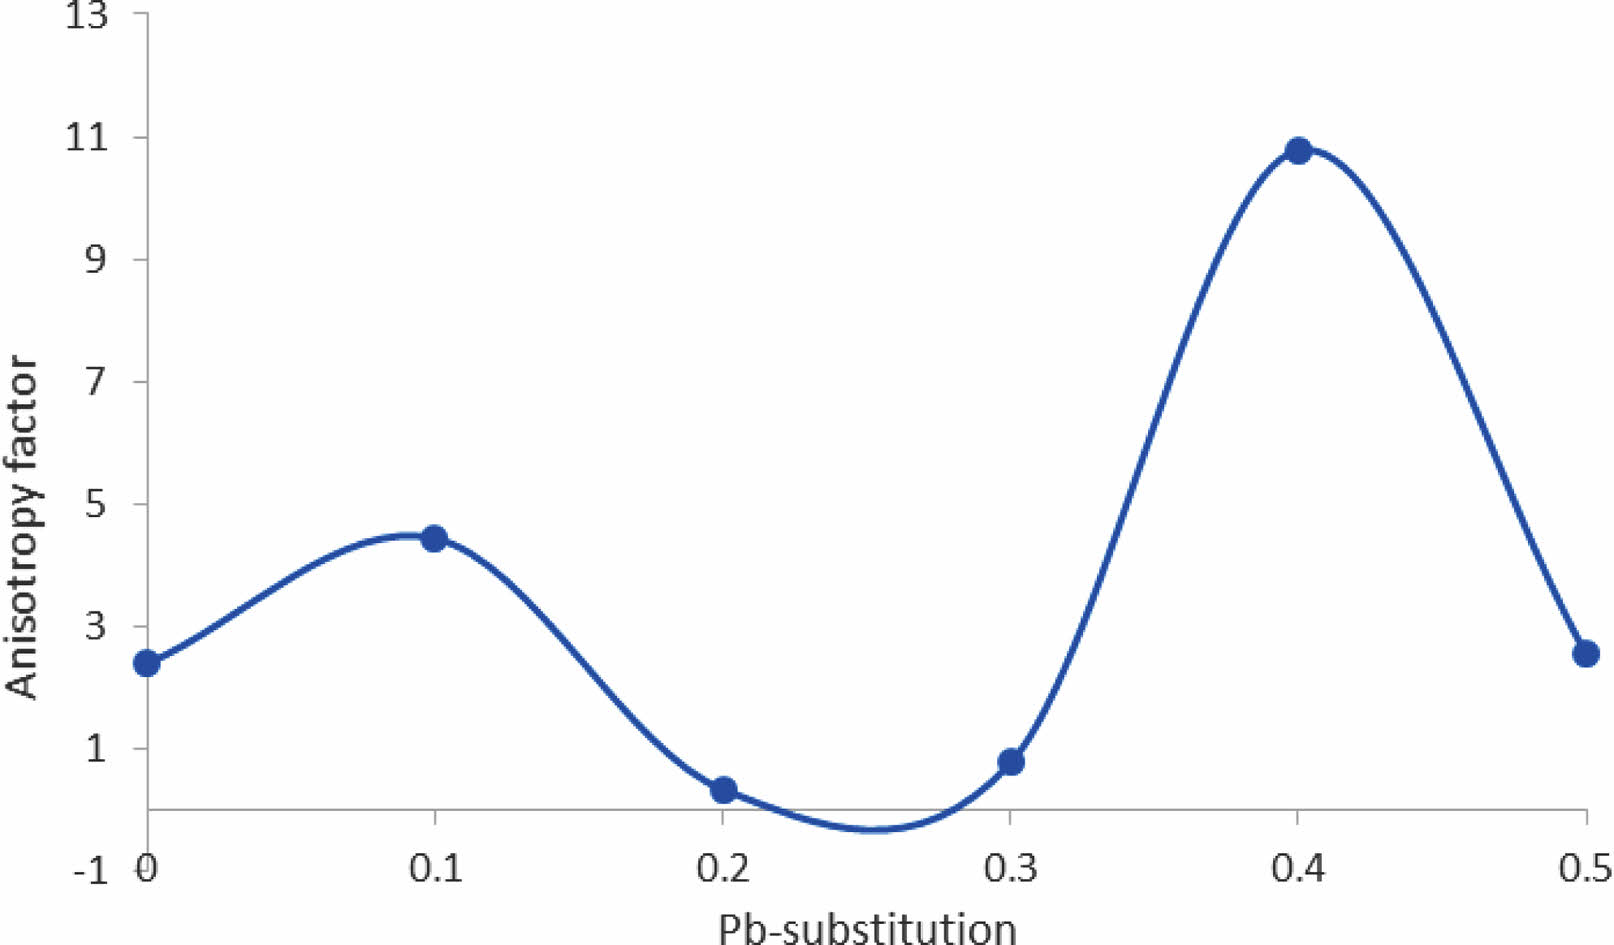
Another thing was mentioned in Table 7, the orthorhombicity values as a function of Pb-substitution, there is a high value of orthorhombicity for pure sample compared with the previous one [25] it is a sign of high stability in the phase produced. There is a minimum value of orthorhombicity at (y=0.2, 0.3) that is in agreement with the approaching of lattice constants (a, b) products of a tetragonal phase as shown in Fig. 9. This fact will tend to the appearance of lower anisotropy of the unit cell in comparison with other values of Pb substitution as shown in Fig. 11. That means the lower anisotropy factor producing a low superconducting phase. The substitution acts as impurities within the unit cell to improve the conductivity. These impurities were the reason for the anisotropy of the unit cell and later on the strength of the superconducting phase. That is a contradiction to Sujinnapram et al. [13] stated there is no effect on the c-axis during the impurities and later in the superconducting phase.
|
Fig. 3 The refinement XRD pattern for YBa2Cu3O6.873, (b) the simulated unit cell predicated. |
|
Fig. 4 (a) The refinement of XRD pattern for YBa2Cu2.9Pb0.1O6.872, (b) the simulated unit cell predicated. |
|
Fig. 5 (a) The refinement of XRD pattern for YBa2Cu2.8Pb0.2O6.873, (b) the simulated of unit cell predicated. |
|
Fig. 6 (a) The refinement of XRD pattern for YBa2Cu2.7Pb0.3O6.89, (b) the simulated unit cell predicated |
|
Fig. 7 (a) The refinement of XRD pattern for YBa2Cu2.6Pb0.4O6.891, (b) the simulated unit cell predicated. |
|
Fig. 8 (a) The refinement of XRD pattern for YBa2Cu2.5Pb0.5O6.896, (b) the simulated unit cell predicated. |
|
Fig. 9 The variation of lattice constant as a function Pbconcentration. |
|
Fig. 10 The variation of oxygen excess as a function c-axis. |
|
Fig. 11 Explain the anisotropy factor in the structure as a function Pb-substitution. |
|
Table 1 Indicate the atomic position due to the unit cell simulation in YBa2Cu3O6.873. |
|
Table 2 Indicate the atomic position due to the unit cell simulation in YBa2Cu2.9Pb0.1O6.872. |
|
Table 3 Indicate the atomic position due to the unit cell simulation in YBa2Cu2.8Pb0.2O6.873. |
|
Table 4 Indicate the atomic position due to the unit cell simulation in YBa2Cu2.7Pb0.3O6.89. |
|
Table 5 Indicate the atomic position due to the unit cell simulation in YBa2Cu2.6Pb0.4O6.891. |
|
Table 6 Indicate the atomic position due to the unit cell simulation in YBa2Cu2.5Pb0.5O6.896. |
This research is a procedure for determining the expected crystal structure for any superconductor compounds. The correlation between the XRD pattern and Iodometric titration results was studied in detail. It was found that the substitution of Pb+2-ion concerning Cu+2-ion in the composition Y-ba-Cu-O system. The main conclusion deals with more polarization of oxygen atoms per unit cell as a function of the c-axis, which is affected by the substitution ratio of Pb-atom. The phase transformation from orthorhombic to tetragonal and tetragonal to orthorhombic phase is during the substitution (Pb=0.2).
- 1. A.K. Saxena, in "High-Temperature Superconductors" (Springer Series in materials science 125, 2010) p. 42.
-

- 2. P. Benzi, E. Bottizzo, and N. Rizzi, J. Crystal Growth 269 (2004) 625-629.
-
- 3. M.Z. Balbag, O. Ozbaş, and M.İ. Cenik, Afyon Kocatepe University, J. of Science 8[1] (2009) 79-90.
- 4. M.O. Eatough, D.S. Ginley, B. Morosin, and E.L. Venturini, Applied Physics Letters 51 (1987) 367-368,
-
- 5. R.J. Cava, B. Batlogg, R.B. van Dover, D.W. Murphy, S. Sunshine, T. Siegrist, J.P. Remeika, E.A. Rietman, S. Zahurak, and G.P. Espinosa, Phys. Rev. Lett. 58[16] (1987) 1676-1679.
-
- 6. D.G. Hinks, L. Soderholm, D.W. Capone, J.D. Jorgensen, I.K. Schuller, C.U. Segre, K. Zhang, and J.D. Grace, Appl. Phys. Lett. 50[23] (1987) 1688-1690.
-
- 7. M.N. Makadsi, E.K. Al-Shakarchi, and Sh.J. Shakir, Iraqi J. of Sci. 38[1] (1997) 99-105.
- 8. A.F. Hepp and J.R. Gaier, Materials Science Forum 137-139 (1993) 377-394.
-
- 9. M.K. Wu, D.H. Chen, D.Y. Chen, S.R. Sheen, and F.Z. Chien, Tamkang Journal of Science and Engineering 3[3] (2000) 139-144.
-
- 10. F. Hanic, A. Cigan, S. Buchta, J. Manka, and A. Konakovsky, Int. J. Inorganic Materials 3 (2001) 551-557.
-
- 11. E.K. Al-Shakarchi, S.K.J. Al-Ani, and W.M. Faysal, J. Physical Science and Application 2[9] (2012) 352-358.
- 12. D. Cahen, Z. Moisi, and M. Schwartz, Mat. Res. Bul. 22 (1987) 1581-1588.
-
- 13. S. Sujinnapram, P. Udomsamuthirun, T. Kruaehong, T. Nilkamjon, and S. Ratreng, Bull. Mater. Sci. 34[5] (2011) 1053-1057.
-
- 14. N.A.C. Dzul-Kifli, M.M.A. Kechik, H. Baqiah, A.H. Shaari, K.P. Lim, S.K. Chen, S.I.A. Sukor, M.K. Shabdin, M.K.A. Karim, K.K.M. Shariff, and M. Miryala, Nanomaterials 12(3958) (2022) 1-15.
-
- 15. S.E. Jasim, M.A. Jusoh, M. Hafiz, and R. Jose, Procedia Engineering 148 (2016) 243-248.
-
- 16. S. Ezzatpour, L. Sharifzadegan, F. Sarvari, and H. Sedghi, Physica C: Superconductivity and its applications 549 (2018) 150-153.
-
- 17. R.J. Cava, B. Batlogg, J.J. Krajewski, L.W. Rupp, L.F. Schneemeyer, T. Siegrist, R.B. van Dover, P. Marsh, W.F. Peck Jr, P.K. Gallagher, S.H. Glarum, J.H. Marshall, R.C. Farrow, J.V. Waszczak, R. Hull, and P. Trevor, Nature 336 (1988) 211-214.
-
- 18. B.A. Howe, Crystal Structure and Superconductivity of YBa2Cu3O7-x, M.Sc. thesis submitted to Minnesota State University, (2014).
- 19. W.M. Faysal, in "The Effect of Additives on the Behavior of the High-Temperature Y1-x(Al,Ti)xBa2Cu3-y(Ag,Pb)yO6.5+g Superconductor" (Ph.D. thesis submitted to University of Baghdad, College of Science, Physics department, 2001).
- 20. E.K. Al-Shakarchi and A.I. Al-Janabi, J. of Superconductivity and Novel Magnetism 33 (2020) 379-385.
-
- 21. R.J. Cava, B. Batlogg, R.B. Vav Dover, D.W. Murphy, S. Sunshine, T. Siegrist, J.P. Remeika, E.A. Rietman, S. Zahurak, and G.P. Espinosa, Physical Review Letters 58[16] (1987) 1676-1679.
-
- 22. J.M. Juárez-Lopez, A. Guillén-Cervantes, J.G. Quiñones-Galván, K.E. Nieto-Zepeda, O. Zelaya-Angel, J. Santos-Cruz, E. Díaz-Valdés, G. Contreras-Puente, and F. de Moure-Flores, Mater. Res. Express 7 (2020) 096001-10.
-
- 23. R. Beyers and T.M. Show, Solid State Physics 42 (1989) 135-212.
-
- 24. S.A. Sunshine, L.F. Schneemeyer, T. Siegrist, D.C. Douglass, J.V. Waszczak, R.J. Cava, E.M. Gyorgy, and D.W. Murphy, vskites via Chemical Substitution, Chemistry of Materials 1 (1989) 331-335.
-
- 25. A.N. Kamarudin, M.M.A. Kechik, M. Miryala, S. Pinmangkorn, M. Murakami, S.K. Chen, H. Baqiah, A. Ramli, K.P. Lim, and A.H. Shaari, Coatings 11[377] (2021) 1-12.
-
 This Article
-
2023; 24(4): 603-610
Published on Aug 31, 2023
- 10.36410/jcpr.2023.24.4.603
- Received on Dec 18, 2022
- Revised on Mar 1, 2023
- Accepted on Mar 9, 2023
Services
Shared
Correspondence to
- Emad K. Al-Shakarchi
-
Al-Nahrain University, College of Science, Physics Department, P.O. Box 64055, Baghdad, Iraq
Tel : 009647714762006 - E-mail: emad.abbas@nahrainuniv.edu.iq, eks2000@hotmail.com
Clean-Energy Research Institute(CRI), Hanyang University, 222, Wangsimni-ro, Seongdong-gu, Seoul, 04763, Korea
E-mail: jcpr@hanyang.ac.kr