- Performance of expanded clay aggregate based structural light weight concrete beams containing fibre reinforcement
K.K. Gaayathria,*, K. Sugunab and N. Raghunath Pulipakab
aAssistant Professor, Vel Tech Rangarajan Dr Sagunthala R&D Institute of Science and Technology, Avadi - 600062
bDepartment of Civil and Structural Engineering, Annamalai University, Annamalainagar, 608002, Tamilnadu, IndiaThis article is an open access article distributed under the terms of the Creative Commons Attribution Non-Commercial License (http://creativecommons.org/licenses/by-nc/4.0) which permits unrestricted non-commercial use, distribution, and reproduction in any medium, provided the original work is properly cited.
The current work examines the flexural behavioral analysis of structural lightweight concrete (SLWC) beams made of expanded clay aggregate (ECA) and its conclusions. Polypropylene (PP) fiber is used in these beams. The investigation took into account a total of six beams, of which one specimen was constructed using regular-weight concrete and the other using SLWC with 20% ECA in place of coarse aggregate. The remaining four beams were constructed using SLWC material with an ECA base that included polypropylene fiber in volume fractions of 0.1%, 0.2%, 0.3%, and 0.4%. Each beam underwent testing in a loading frame up to 4-point bending.
Keywords: Expanded clay aggregate, Polypropylene fiber, Deflection, Ductility, Strength.
There are many benefits to using structural lightweight concrete (SLWC) beams, including their high energy capacity, good durability, efficient thermal insulation, high specific strength, low density, ductility, and heavy strength. Buildings, bridges, floors, and walls frequently use SLWC. The density of concrete is still a vital factor in determining how much a structural component weighs on its own. The self-weight of the structural components is decreased while using SLWC material. The performance of structural lightweight concrete is enhanced overall by the addition of micro-reinforcement.
Longitudinal tensile reinforcement ratio exerts a heavy influence on the flexural ductility of SLWC beams, according to Jingjun Li et al. (2001). According to Nahhab and Ketab (2020), when natural river sand is replaced with 50% expanded glass, it significantly enhanced the ductility of SLWC beams. Bernardo et al. (2016) found that the addition of polypropylene fibers in SLWC beams enhances the ductility and toughness capacity. In their study, the authors found that 30 kg/m3 of polypropylene fibers is the optimal and cost-effective dosage for lightweight concrete beams. In the literature Sohaib et al. (2016), there was an increase observed in terms of ultimate strength up to 32.1% whereas a decline of up to 46.7% was recorded for deflection in lightweight concrete beams made with crushed bricks. In the study conducted by Kamran et al. (2014), the authors found that both cracking and ultimate strength levels were satisfactory for lightweight concrete beams made using ACI 318 and ACI 313. The shear capacity of RC beams in which normal weight was replaced with lava lightweight aggregate, showed no significant difference, as per HS Lim et al. (2006).
In the current study, the researchers took efforts to investigate the flexural behavior of ECA-based SLWC beams with the inclusion of polypropylene fibers of varying volume fractions [1-20].
Materials
The authors used IS 12269:2013 specifications while building ECA-based SLWC beams using regular Portland cement (Grade 53). Granite was further crushed to a maximum particle size of 20 mm in accordance with IS 383:2016 and utilised as coarse aggregate. 20% of the coarse material was replaced with expanded clay aggregate. Both natural river sand and M-sand were blended and used to create fine aggregate. In this study, commercially available Recron 3s fibres that met ASTM C1116 specifications were employed. Additionally, the researchers used the heavy-range water-reducing additive Conplast SP 430 in accordance with ASTM C494 requirements. Fe 500D ribbed reinforcement bars with high yield strength were employed as the primary reinforcement [21-25].
Concrete Mix Design
In line with IS 10262:2019 standards that deal with the preparation of control and beam specimens, a mixed design were utilized to prepare M25-grade concrete. In this mix, the water-cement ratio was fixed at 0.5. The slump achieved was about 50 mm-70 mm.
Control Specimens
To have control specimens, prism specimens (100 × 100 × 500 mm), cylinder specimens (150 × 300 mm), and cube specimens (150 × 150 × 150 mm) were cast and validated for modulus of rupture, modulus of elasticity, and compressive strength. Table 1 tabulates the nomenclature of the control as well as beam specimens used for the study. Table 2 shows the test results attained by the control specimens.
Details of Beam Specimen
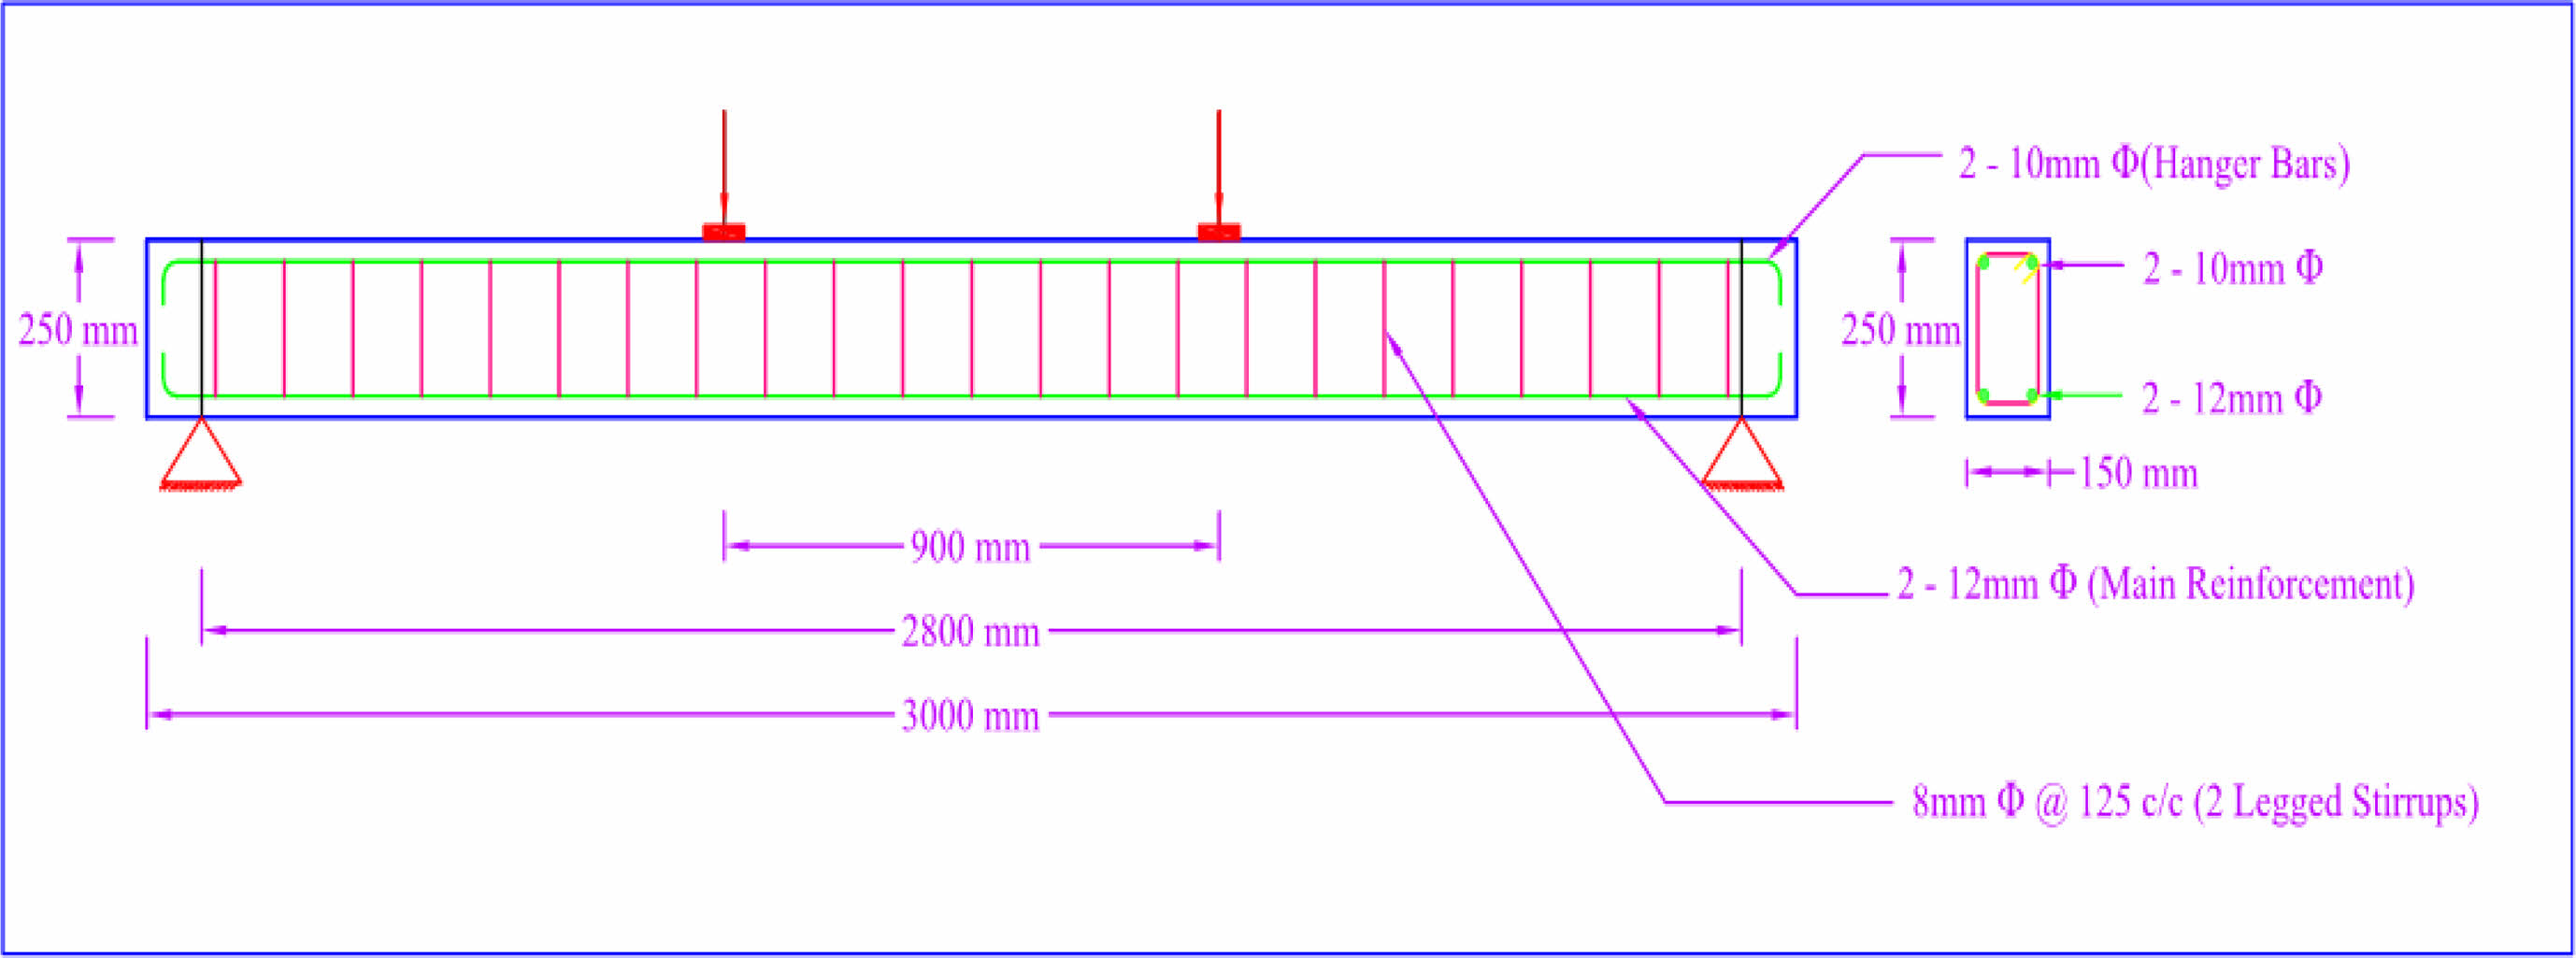
Six full-scale beams sized 150 mm × 250 mm × 3000 mm were constructed and validated in the current study. One beam was made with normal-weight concrete whereas another beam was made as SLWC with 20% coarse aggregate replaced by ECA. The rest of the beams were made with ECA-based SLWC with varying volume fractions of polypropylene fibers such as 0.1%, 0.2%, 0.3%, and 0.4%. In main reinforcement, two 12 mm diameter HYSD bars were used whereas in shear reinforcement, 2-legged shear stirrups were used with each having an 8 mm diameter at 125 mm spacing. Fig. 1 shows the reinforcement details used for the current study [26].
Test Set-Up
In this work, the compressive strength of various specimens, including ECA-based SLWC, PP fibre-reinforced SLWC, and normal-weight concrete, was measured using a compression testing machine with a 2000 kN capacity. The cube and cylinder specimens, for which the requirements had previously been provided, were validated by the researchers. To estimate the modulus of elasticity for each of the three specimens, cylinder specimens measuring 150 × 300 mm were validated in the compression testing machine during the experiment. These cylinder specimens had a longitudinal compress meter connected to them. A typical loading frame with a 50 kN capacity was used to analyze prism specimens that were 100 × 100 × 500 mm in size. Calculating the modulus of rupture for the previously described specimens is done.
With the help of a 500 kN capacity standard loading frame, all full-scale beams were validated. The beams were given support using a hinge on one end and a roller on another end. The test span of the beam was 2.8 m. A spreader beam was used to facilitate the application of two-point loading. The researchers used 0.01 mm precision dial gauges to determine the deflection at both mid-span and below the loading points. To determine the crack width across the loading stages, a crack detection microscope was used with 0.02 mm accuracy.
|
Fig. 1 Reinforcement details of beam specimens |
Effect of PP Fibres on Strength
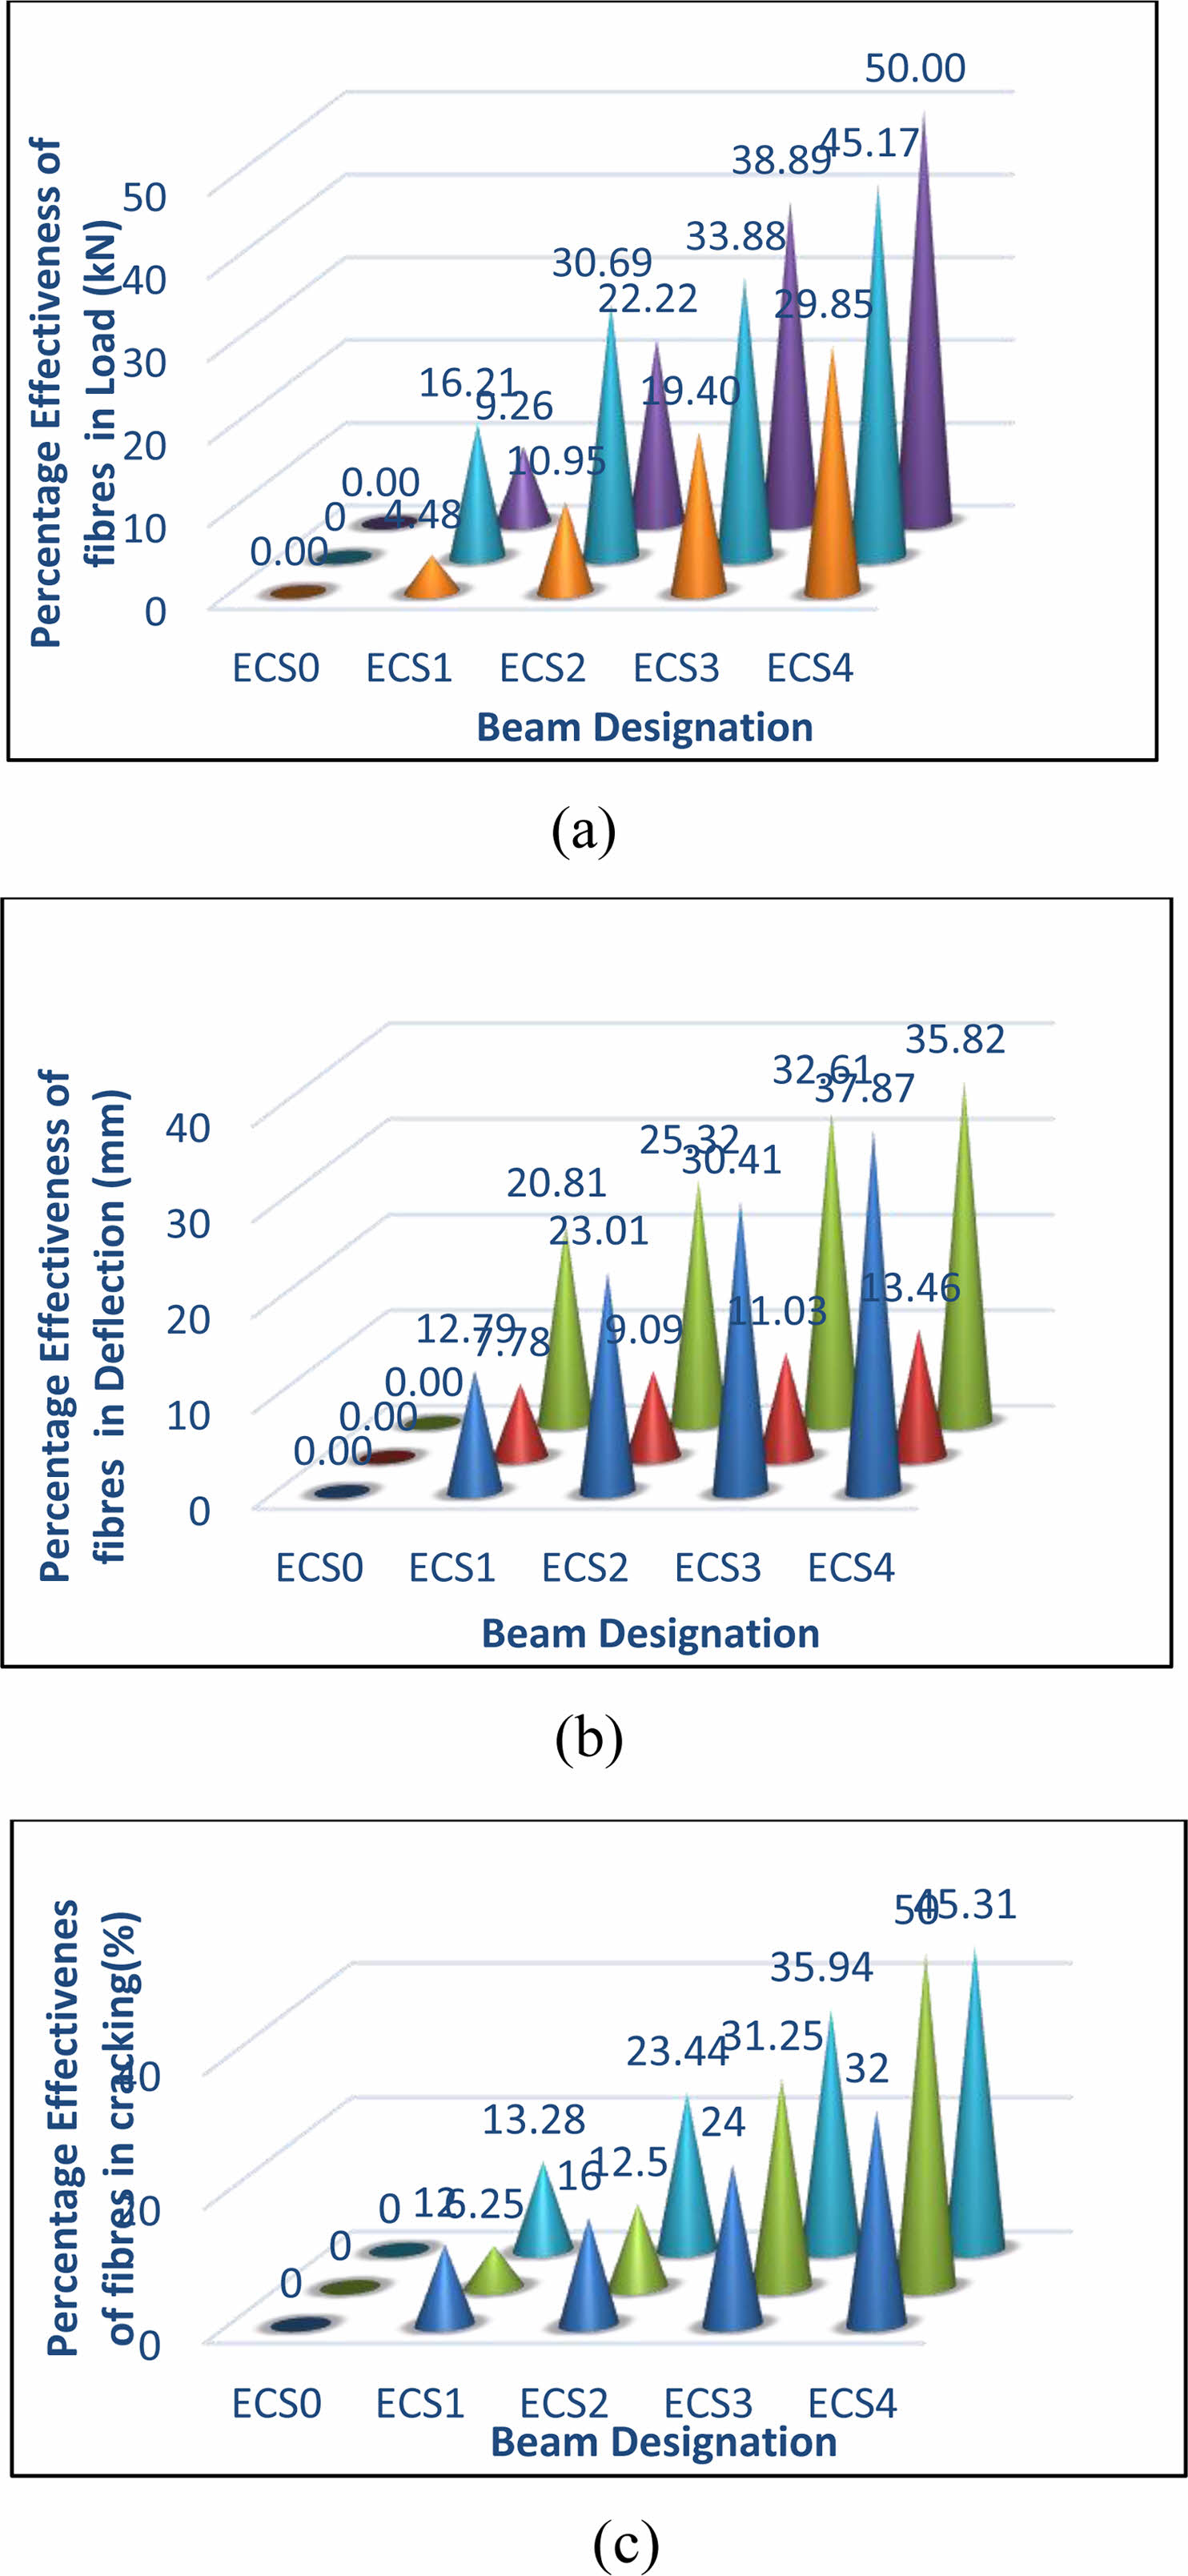
The first crack loads were examined through visual observation alone. Beams such as ECS1, ECS2, ECS3, and ECS4 exhibited an increase in first crack load up to 9.26%, 22.22%, 38.89%, and 50% respectively, when compared against the reference beam, ECS0. Beam ECS4 showed an increase in first crack load up to 37.29%, 22.73%, and 8% compared to other beams such as ECS1, ECS2, and ECS3. Beam ECS3 attained an increase in first crack load up to 27.12% and 13.64% when compared with the beams such as ECS1 and ECS2 respectively. Beam ECS2 showed an increase of up to 11.86% in the first crack load over beam ECS1. Table 3 shows the test results accomplished by the beam specimens.
The researchers plotted the yield loads against the loading stage beyond which the 'load-deflection' plot departed from linearity. Beams such as ECS1, ECS2, ECS3, and ECS4 exhibited an increase up to 5.39%, 18.52% and 21.42%, 31.65% in yield load than the reference beam, CS0. Beam ECS4 showed an increase of up to 24.92%, 11.08%, and 8.43% in yield load than the beams such as ECS1, ECS2, and ECS3. Beam ECS 3 showed an increase of up to 15.21% and 2.45% in yield load when compared with the beams such as ECS1 and ECS2. Beam ECS2 showed an increase of up to 12.46% in yield load over beam ECS1. The optimum loads were attained in line with the loading stage beyond which the beams cannot withstand any form of deformation, given the same load intensity is provided. Beams such as ECS1, ECS2, ECS3, and ECS4 exhibited an increase up to 4.48%, 10.98%, 19.40%, and 29.85% respectively, at optimum load conditions than the reference beam, CS0. Beam ECS4 showed an increase of up to 24.29%, 17.04%, and 8.75% in ultimate load than the beams such as ECS1, ECS2, and ECS3 respectively. Beam ECS3 showed an increase of up to 14.29% and 7.62% in ultimate load than the beams such as ECS1 and ECS2 respectively. Beam ECS2 showed an increase of up to 6.19% in ultimate load over beam ECS1. The increase in load capacity discussed above would be a result of heavy tensile strength from PP fibers and enhanced bonds between the matrix and the fibers. The percentage increase for all the load stages is shown in Fig. 2(a).
Effect of PP Fibres on Deformation
Beams such as ECS1, ECS2, ECS3, and ECS4 exhibited a decline up to 20.81%, 25.32%, 32.61%, and 35.82% respectively in deflection at first crack load than the reference beam, ECS0. Beam ECS4 exhibited a decline up to 55.79%, 42.26%, and 21.22% in deflection at first crack load than other beams such as ECS1, ECS2, and ECS3. Beam ECS3 showed a decrease up to 28.51% and 17.36% respectively, in deflection at first crack load than other beams such as ECS1 and ECS2. Beam ECS2 showed a decline of up to 9.50% in deflection at the first crack load over beam ECS1. Beams such as ECS1, ECS2, ECS3, and ECS4 exhibited a decline of up to 7.78%, 9.09%, 11.03%, and 13.46% in deflection at yield load than the reference beam ECS0. Beam ECS4 showed a reduction of up to 5.27%, 4.01%, and 2.19% in deflection at yield load than other beams such as ECS1, ECS2, and ECS3. Beam ECS3 showed a decline of up to 3.02% and 1.78% in deflection at yield load than other beams such as ECS1 and ECS2. Beam ECS2 showed a decline of up to Y10% in deflection at yield load compared to beam ECS1. Beams such as ECS1, ECS2, ECS3, and ECS4 exhibited a decline up to 12.79%, 23.01%, 30.41%, and 37.87% respectively, in deflection at ultimate load than the reference beam ECS0. Beam ECS4 showed a reduction of up to 22.24%, 12.08%, and 5.72% in deflection at ultimate load than other beams such as ECS1, ECS2, and ECS3 respectively. Beam ECS3 showed a decline of up to 15.63% and 6.01% in deflection at ultimate load than other beams such as ECS1 and ECS2 respectively. Beam ECS2 showed a decline of up to 9.07% in deflection at ultimate load compared to beam ECS1. The percentage decrease in deflection, at all the loads, is presented in Fig. 2(b).
Load-deflection Relationship
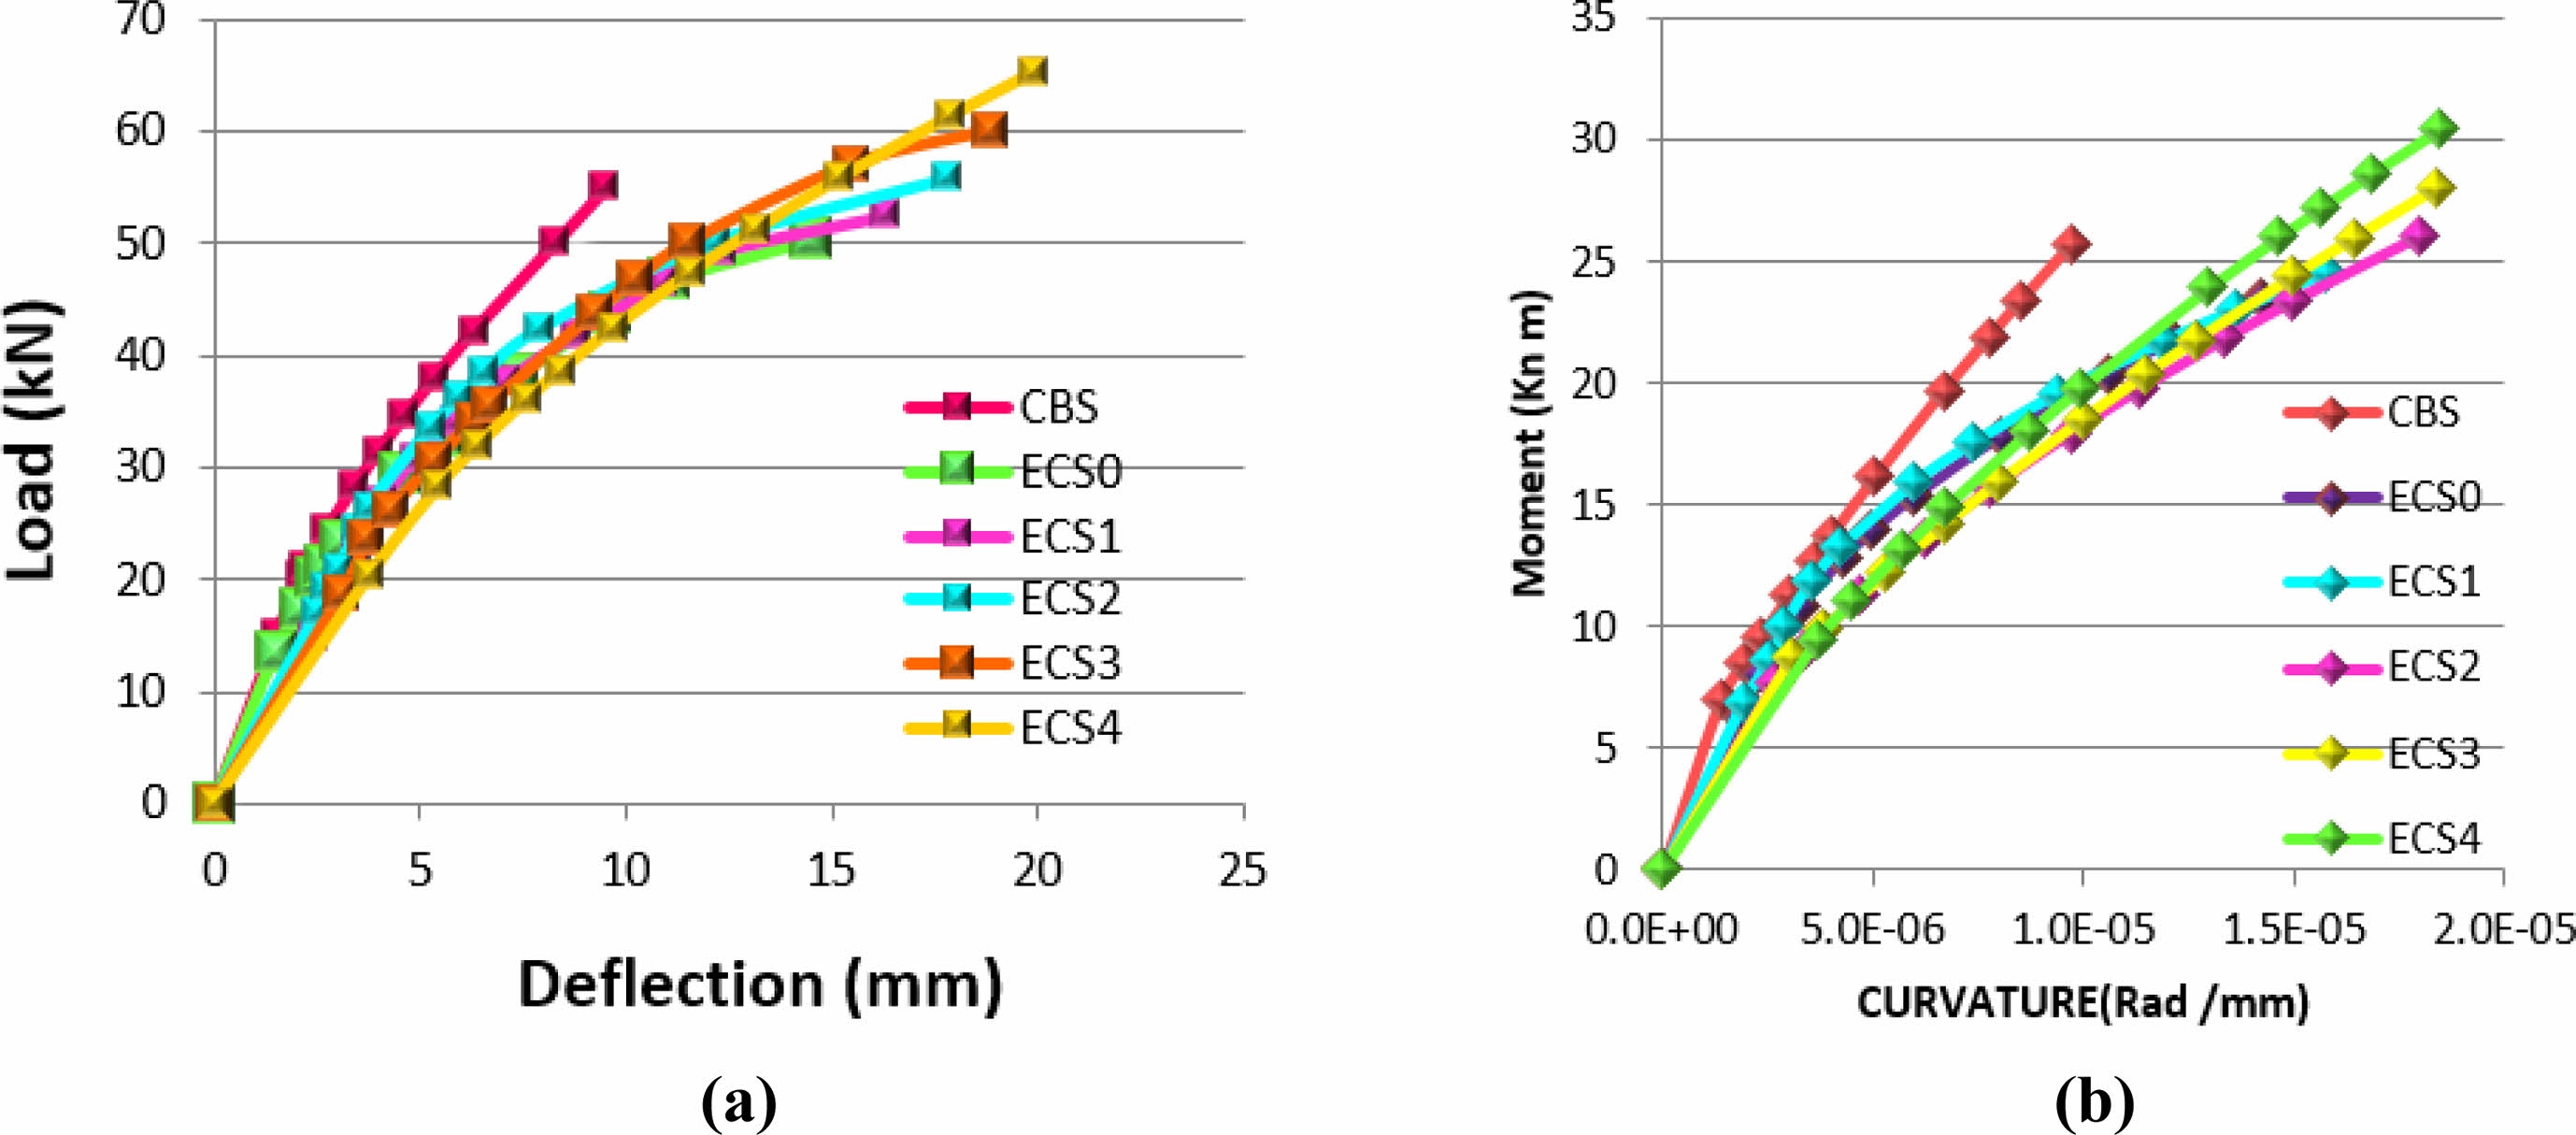
Figure 3(a) shows the load-deflection responses achieved by the beams considered in this study. The figure portrays that load-deflection curves are linear with heavy stiffness up to the first crack load. However, after this loading limit, there is a deviation observed in the curves from linearity while the slopes decreased gradually. The reduction in the number of slopes denotes the degradation of stiffness as a result of the increasing number of cracks formed over the loaded span. The tension reinforcement started yielding on the application of additional loading. However, there was a significant decline observed in the slope of the curves beyond the yield stage. The beams exhibited huge deformations even in case of minimal increment in the applied load. This trend continued till the ultimate stage. When the applied load was further increased, the concrete collapsed into the compression zone, failing beams. Afterward, the load applied started decreasing gradually. Figure 3 shows the ductile mode of failure through load-deflection plots. It is evident from Fig. 3 that the flexural stiffness of the tested beams got enhanced when the volume fraction of PP fibers was increased. This increase in flexural stiffness might be due to the bridging action of the fibers. This action arrested the cracks from further widening. On the other hand, a high volume fraction of the fiber enabled the beams to undergo large deflections at the ultimate stage.
Moment-Curvature Relationship
Figure 3(b) shows the moment-curvature plots for all the beams considered for the current study. It can be observed that up to the first crack stage, M - Phi curves were linear with higher slopes. With the additional moment, the slope of the curves started decreasing gradually and continued till the yield stage. This decline, in the slope of the curves, was noticeable beyond the yield stage too. The beams exhibited huge curvatures even in the case of micro-level increments at the moment, up to the ultimate stage. When the moment was further increased, it made the concrete collapse into compression zone failing beams.
Effect of PP Fibres on Cracking History
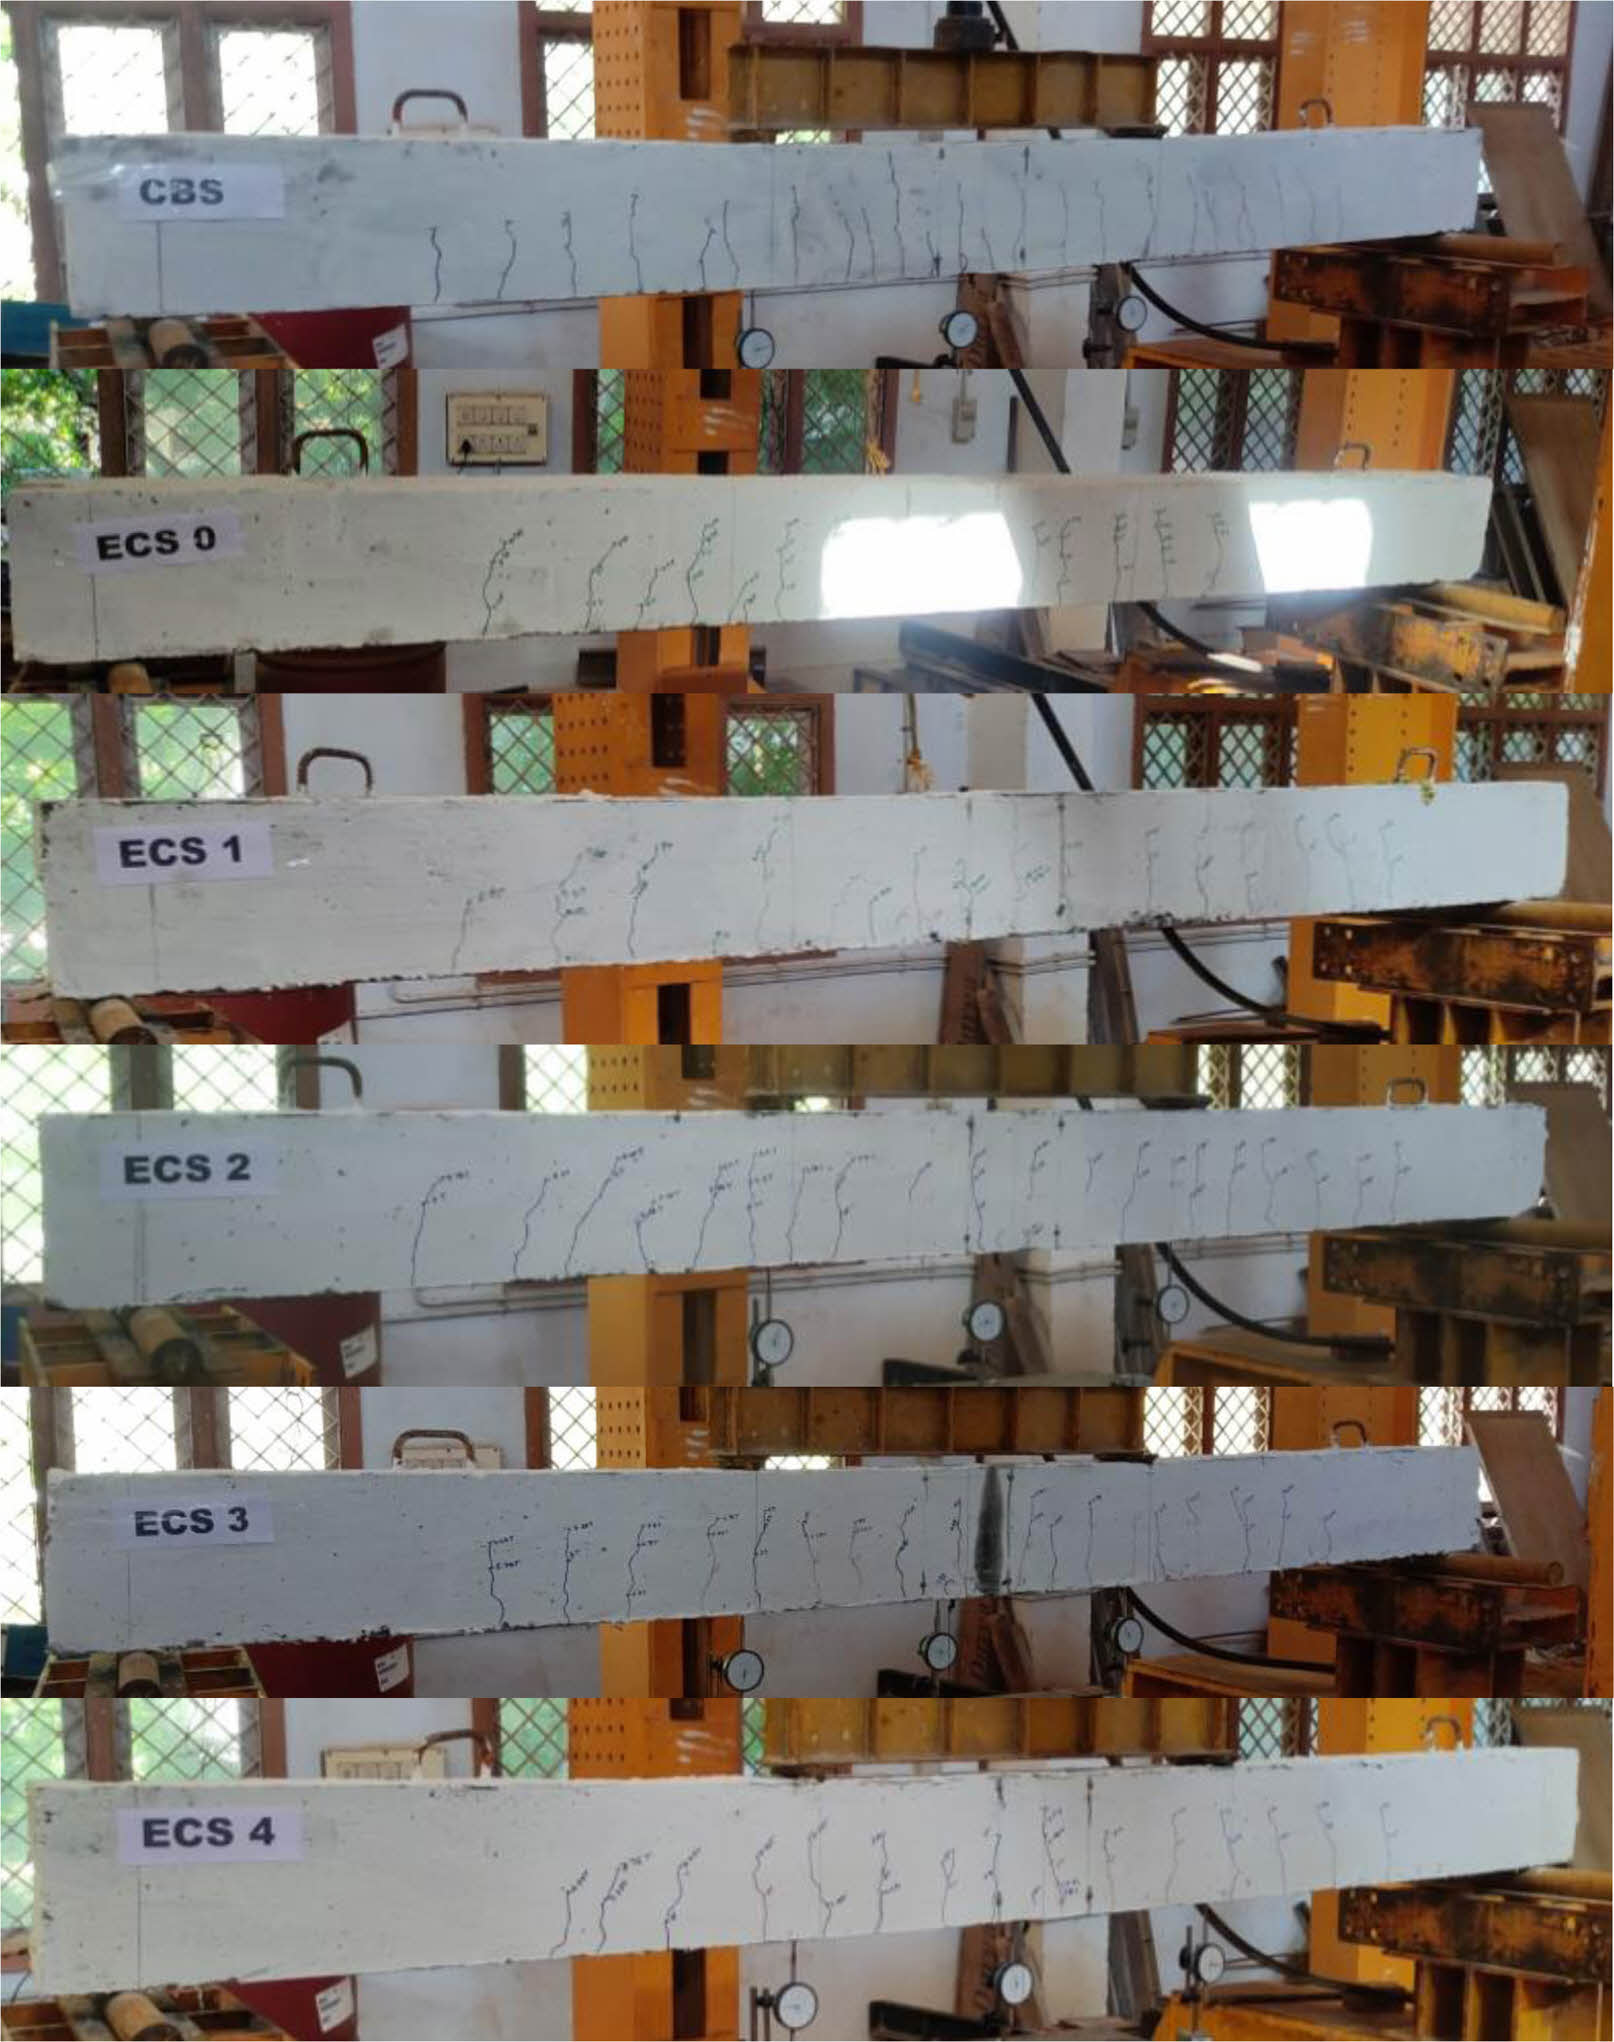
Figure 2(c) shows the crack pattern obtained in the case of all the beams considered for the current study during failure. Fine vertical cracks were found at the moment zone in the initial loading stages. When additional loading was applied, the existing vertical cracks propagated toward the compression zone resulting in the emergence of new fine vertical cracks along the loaded span. The number of cracks and the width of cracks increased when applied loading was increased up to the ultimate stage. It can be concluded that the inclusion of PP fibers resulted in more cracks near the failure.
Beams such as ECS1, ECS2, ECS3, and ECS4 exhibited a decline of up to 12%, 16%, 24%, and 32% respectively in crack width than the reference beam ECS0. Beam ECS4 showed a decline of up to 22.73%, 19.05%, and 10.53% in crack width than the beams such as ECS1, ECS2, and ECS3 respectively. Beam ECS3 showed a decline of up to 13.64% and 9.52% in crack width than the beams such as ECS1 and ECS2 correspondingly. Beam ECS2 showed a reduction of up to 4.55% in crack width over beam ECS1. Beams such as ECS1, ECS2, ECS3, and ECS4 exhibited reductions up to 6.25%, 12.5%, 31.25%, and 50% respectively in terms of the number of cracks than the reference beam, ECS0. Beam ECS4 showed an increase of up to 41.18%, 33.33%, and 14.29% in the number of cracks compared to beams such as ECS1, ECS2, and ECS3 correspondingly. Beam ECS3 showed an increase of up to 23.53% and 16.67% in terms of the number of cracks than the beams such as ECS1 and ECS2 respectively. Beam ECS2 showed an increase of up to 5.88% in the number of cracks over beam ECS1. Beams such as ECS1, ECS2, ECS3, and ECS4 exhibited reductions up to 13.28%, 23.44%, 35.94%, and 45.31% respectively in terms of spacing of cracks than the reference beam ECS0. Beam ECS4 showed a decline up to 36.94%, 28.57%, and 14.63% in terms of spacing of cracks than the beams such as ECS1, ECS2, and ECS3 respectively. Beam ECS3 showed a decline of up to 26.13% and 16.33% in terms of spacing of cracks than the beams such as ECS1 and ECS2 respectively. Beam ECS2 showed a decline of up to 11.71% in the spacing of cracks over beam ECS1. Figure 6 shows the percentage of effectiveness in crack width, number, and spacing of cracks. Figure 4 Figure 6
Effect of PP Fibres on Ductility
Beams such as ECS1, ECS2, ECS3, and ECS4 exhibited an increase up to 4.69%, 12.81%, 17.50%, and 21.56% in deflection ductility respectively than the reference beam, ECS0. Beam ECS4 showed an increase of up to 16.12%, 7.76%, and 3.46% in deflection ductility than other beams such as ECS1, ECS2, and ECS3 respectively. Beam ECS3 showed an increase of up to 12.24% and 4.16% in deflection ductility than other beams such as ECS1 and ECS2 correspondingly. Beam ECS2 showed an increase of up to 7.76% in deflection ductility over beam ECS1. Beams such as ECS1, ECS2, ECS3, and ECS4 exhibited increased energy ductility up to 4.88%, 10.73%, 19.02%, and 29.27% respectively than the reference beam, ECS0. Beam ECS4 showed increased energy ductility up to 23.26%, 16.74%, and 8.61% than other beams such as ECS1, ECS2, and ECS3 respectively. Beam ECS3 showed increased energy ductility up to 13.49% and 7.49% than other beams such as ECS1 and ECS2 respectively. Beam ECS2 showed increased energy ductility up to 5.58% over beam ECS1.
Effect of PP Fibres on Energy capacity
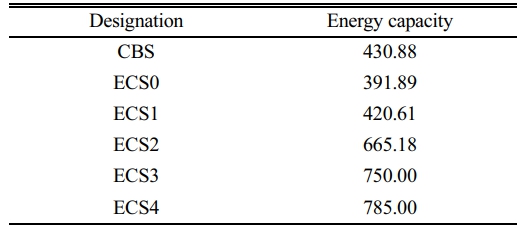
Beams such as ECS1, ECS2, ECS3, and ECS4 exhibited increased energy capacity up to 7.33%, 69.74%, 91.74%, and 100.31% respectively than the reference beam, ECS0. Beam ECS4 showed increased energy capacity up to 86.63%, 18.01%, and 4.67% than other beams such as ECS1, ECS2, and ECS3 respectively. Beam ECS3 showed an increase of up to 78.31% and 12.75% in energy capacity than other beams such as ECS1 and ECS2. Beam ECS2 achieved an increased energy capacity of up to 58.15% over beam ECS1. Table 4 presents the energy ductility values of all the beams considered for the current study.
|
Fig. 2 Impact of Polypropylene Fibres upon load and Deflection at First Crack, Yield, and Ultimate load Stages, and Cracking history |
|
Fig. 3 (a) Load - deflection Relationship, (b) Moment Vs Curvature Relationship. |
|
Fig. 4 Crack Patterns of Beams. |
|
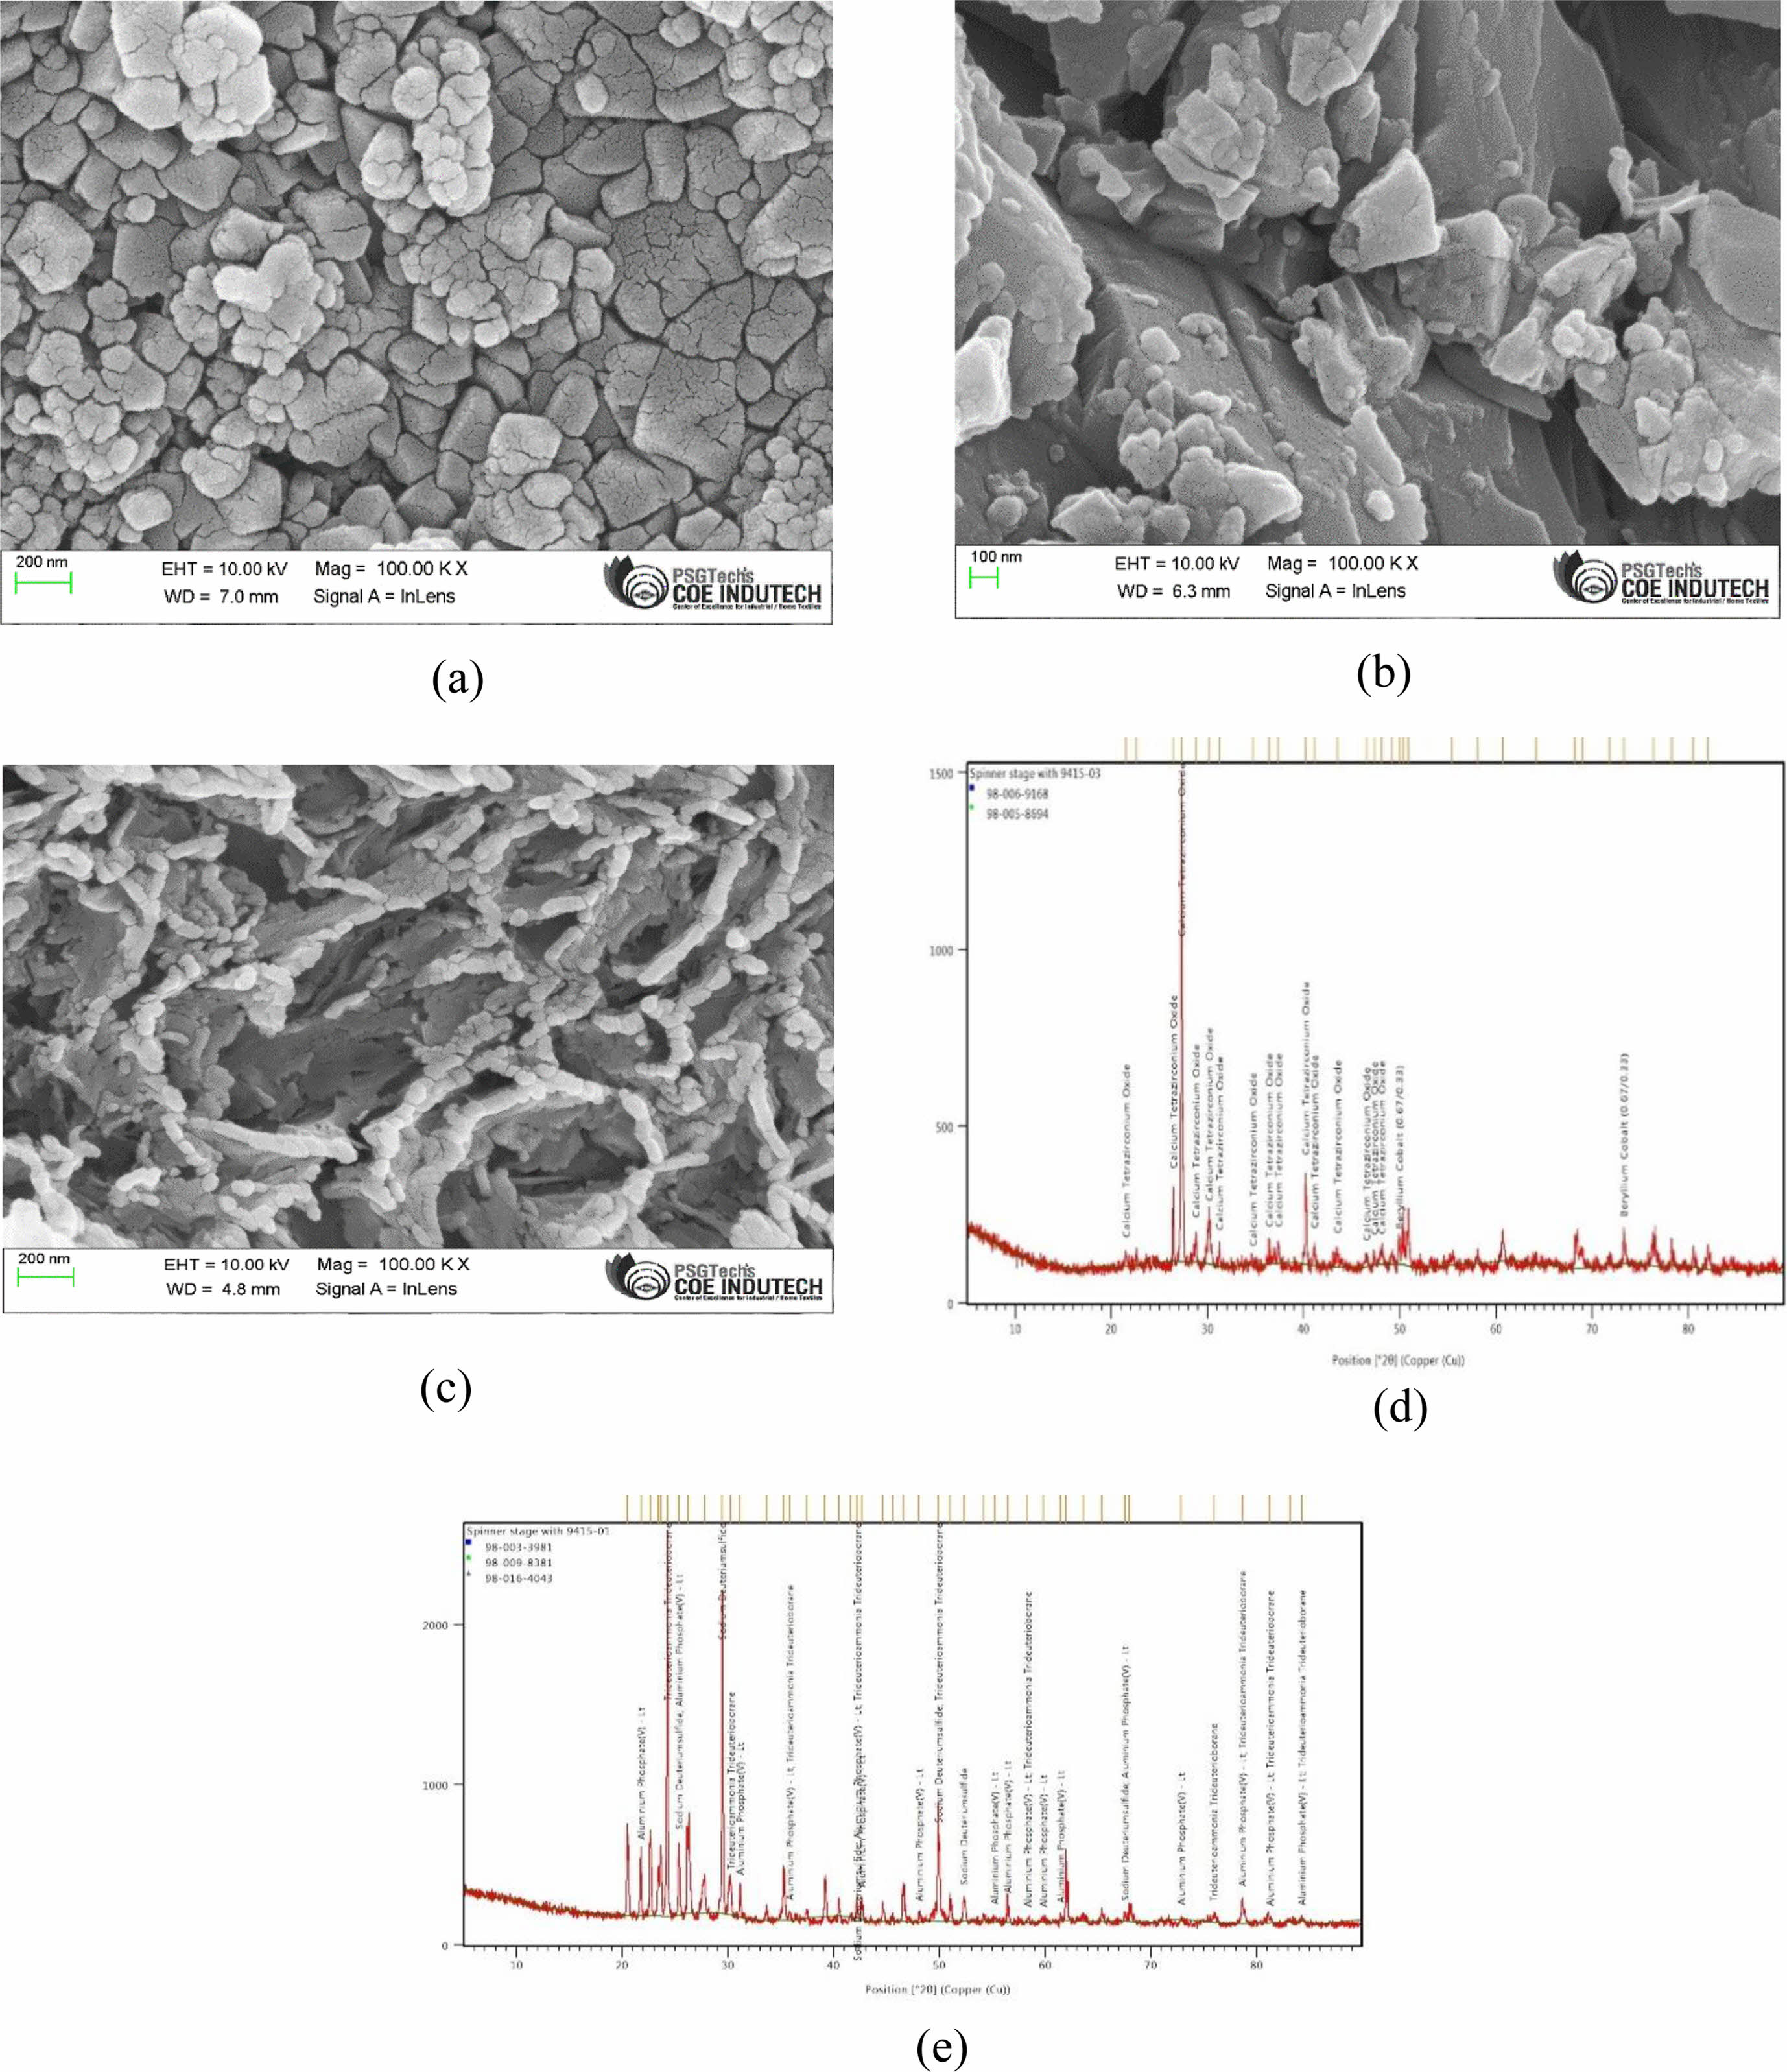
Fig. 5 SEM Image with 100× Magnification and XRD image at 2 Theta. |
Figure 5 displays the SEM images of control concrete, LWC with EC aggregates, and polypropylene fiber-reinforced EC-based LWC (a-c). To keep track of the interfacial transition zone's condition, SEM photos were taken at 100× magnification levels. In order to create the concrete mixtures, 20% EC aggregates were used in place of regular aggregates. At a w/c ratio of 0.5, the entire set of concrete mixtures was created. Concrete mixtures containing polypropylene (PP) fibres were given the proper amount of high-range water-reducing additive (SP - Coloplast 430) to increase their mobility. The SEM picture of a concrete mixture with regular particles is depicted in Fig. 5(a) (crushed granite). The micrograph in Fig. 5(a) shows that all of the concrete mixtures employed for the current study had excellent interlocking between the matrix and ECA. Additionally, there is no pore-line breaking visible between the ECA and the matrix. The production of hydration products and improved bonding at the interfacial transition zone is depicted far too clearly in the magnified photos. The concrete mixture in Fig. 5(b) contains 0.4% volume fraction of PP fibres and 20% EC aggregate. It was discovered that the matrix structure was thick and had few pores. The PP fibres created a 3D network within the matrix, which stopped cracks from forming or spreading outward. The development of tiny bumps on the surface of PP fibres is depicted in Fig. 5(c). The link between the matrix and the PP fibres would have likely been strengthened as a result. It should be emphasised that considerable energy is needed for the PP fibres to be pulled out and broken, as well as for the fractures to advance. These details likely played a role in the PP fiber-reinforced SLWC with EC aggregates' significantly improved mechanical and durability qualities. Figure 5 depicts the elemental makeup of control concrete and SLWC with microfibers (d, e).
The tensile capability of structural lightweight concrete beams that included 20% expanded clay aggregate was improved to 29.85% by the addition of 0.4% volume fraction of polypropylene fibers. The structural lightweight concrete beams with 20% expanded clay aggregate had a deflection reduction of up to 37.87% in the presence of 0.4% volume fractions of polypropylene fibers. When 0.4% polypropylene fibers and 20% expanded clay aggregate was used to make beams, the energy ductility was improved by 29.27% and the deflection ductility by 21.56%. With 32% less crack width and 45.31% less crack spacing in the beam, the maximum number of cracks, or 50%, was recorded using a 0.4% volume fraction of polypropylene fibers and 20% of expanded clay aggregate.
No participation of humans takes place in this implementation process
No violation of Human and Animal Rights is involved.
No funding is involved in this work.
Conflict of Interest is not applicable in this work.
There is no authorship contribution
There is no acknowledgement involved in this work.
- 1. W.Chen, X. Ji, and Z.Huang, Sci. and Engg. of Comp. Mat. 1[28] (2021) 249-263.
-

- 2. P. Zhang, J. Wang, Q. Li, J. Wan, and Y. Ling, Sci. and Eng. of Comp. Mat. 1[28] (2021) 299-313.
-

- 3. J. Li, J. Niu, C. Wan, X. Liu, and Z. Jin, Cons. and Buil. Mat. 1[157] (2017) 729-736.
-

- 4. A.H. Nahhab and A.K. Ketab, Cons. and Buil. Mat. 233[1] (2020) 117922-117930.
-

- 5. L.F.A. Bernardo, M.C.S. Nepomuceno, and H.A.S. Pinto, J. of Civ. Engg. And Manag. 22[5] (2016) 622-633.
-

- 6. N. Sohaib, F. Seemab, G. Sana, and R. Mamoon, Proce. of the Eig. Int. Conf. on Adv. in Civ. and Stru. Engg. (2016) 1-10.
-

- 7. K. Aghaee, K.D. Tsavdaridis, and M.A. Yazdi, Mag. of Con. Res., ICE Pub. (2014).
-

- 8. H.S. Lim, T.H. Wee, M.A. Mansur, and K.H. Kong, Pro. of the 6th A-Pac. Stru. Engg. and Cons. Conf. APSEC 2006 (2006).
- 9. J. Gao, W. Suqa, and K. Morino, Cem. and Con. Comp. 1[19] (1997) 307-313.
-

- 10. X. Liu, T. Wu, X. Yang, and H. Wei, Cons. and Bui. Mat. 226 (2019) 388-398.
-

- 11. D. Altalabanni, D.K.H. Bzeni, and S. Linsel, Cons. and Buil. Mat. 252 (2020).
-

- 12. Z. Yuan and Y. Jia, Cons. and Bui. Mat. 266 (2021) 121048.
-

- 13. F. Altun and B. Aktas, Cons. and Bui. Mat. 38 (2013) 575-581.
-

- 14. X. Liu, H. Du, and Min-Hong Zhang, Cons. and Buil. Mat. 80 (2015) 255-261.
-

- 15. M.R. Ahmad, B. Chen, Comp. Part B 171 (2019) 46-60.
-

- 16. T.M. Nahhas, J. of Con. Engg. and Man. 1 (2013).
- 17. M.L.B. Othman, A.l.M. Alsarayreh, and R.B. Abdullah, J. of Engg. Sci. and Tech. 15[2] (2020) 1186-1201.
- 18. C. Wu, Y. Kan, C. Huang, and T.S. Yen, J. of Mar. Sci. and Tech. 19[2] (2011) 132-140.
-

- 19. W.S. El-Sayed, A.M.A. Heniegal, E.E. Ali, and B.A. Abdelsalam, Po. Sa. Engg. Res. J. 17[2] (2013) 105-116.
- 20. M.N. Haque, H. Al-khaiat, and O. Kayali, Cem. & Con. Comp. 26[4] (2004) 307-314.
-

- 21. P.C. Chidighikaobi, Mat. To.: Proc. 19[5] (2019) 2467-2470.
-

- 22. I. Hussain, B. Ali, T. Akhtar, M. Sohailjameel, and S.S. Raza, Ca. Stu. In Con. Mat. 13 (2020)-00429.
-

- 23. H.Tanyildizi, Mat. and Des. 30 (2009) 3252-3258.
-

- 24. A. Karimipour, Mec. of Mat. 150 (2020)-103592.
-

- 25. A. Chowdary, N. Chaithra, and K. Chethan, Int. J. for Inn. Res. in Sci. and Tec. 4[3] (2017).
- 26. M.A. Mashrei, A.A. Sultan, and A.M. Mahdi, Int. J. of Civ. Engg. and Tec. 9[11] (2018) 2208-2217.
 This Article
-
2023; 24(4): 595-602
Published on Aug 31, 2023
- 10.36410/jcpr.2023.24.4.595
- Received on Aug 23, 2022
- Revised on Sep 20, 2022
- Accepted on Oct 12, 2022
 Services
- Abstract
introduction
experimental program
results and discussions
microstructural analysis
conclusions
- Ethics Approval and Consent to Participate
- Human and Animal Rights
- Funding
- Conflict of Interest
- Author Contributions
- Acknowledgements
- References
- Full Text PDF
Shared
 Correspondence to
- K.K. Gaayathri
-
Assistant Professor, Vel Tech Rangarajan Dr Sagunthala R&D Institute of Science and Technology, Avadi - 600062
Tel : +91 73732 25566 - E-mail: gaayathrikk14@gmail.com


 Copyright 2019 International Orgranization for Ceramic Processing. All rights reserved.