


- Migration pattern and crystallization characteristics of CeO2 in tailing glass-ceramics under microwave irradiation
Wence Xua, Zhao Caoa, Rui Mac, Nannan Wub and Shunli Ouyangb,*
aSchool of Mining and Coal Engineering, Inner Mongolia University of Science and Technology, Baotou 014010, China
bGuangzhou Maritime University, Guangzhou 510725, China
cSchool of Material and Metallurgy, Inner Mongolia University of Science & Technology, Baotou 014010, ChinaThis article is an open access article distributed under the terms of the Creative Commons Attribution Non-Commercial License (http://creativecommons.org/licenses/by-nc/4.0) which permits unrestricted non-commercial use, distribution, and reproduction in any medium, provided the original work is properly cited.
Slag glass-ceramics doped with different proportions of CeO2 were prepared by fusion casting method using iron tailings and fly ash as raw materials. The effect of CeO2 on the activation energy and crystallization pattern of glass-ceramics under the effect of ohmic thermal radiation and microwave radiation was investigated. The experimental results show that the crystallization activation energy of glass-ceramics gradually increases with the addition of CeO2, and the diopside crystallization is suppressed. Compared with conventional heat-treated samples, microwave irradiation effectively reduces the glass transition temperature, mainly depending on the enhanced crystallization kinetics by microwave non-thermal effects. Further analyzed by Raman spectroscopy, the microwave effect promoted the combination of Ce4+ with [SiO4] to generate fully depolymerized Q0, inhibited the generation of Q2 and Q3, and increased the glass stability
Keywords: Slag glass-ceramics, Microwave effect, Raman spectroscopy, CeO2, Diopside
Besides global warming, China is under great pressure to achieve the “double carbon” target. Therefore, there is an urgent need to research and promote clean and efficient heating technologies. In recent years, microwave (MW) technology has shown the advantages of energy saving and environmental protection, improving material properties and reducing carbon emissions from combustion [1-4]. MW is widely used in preparing and researching various oxide, carbide, and nitride ceramic powders and glass-ceramic composites [5-8]. The principle of MW heating is to produce ionic motion or a molecular dipole in the material volume induced by MW electric or magnetic fields. Due to the friction between molecules, the electromagnetic field interacts with polar molecules resulting in the conversion of electromagnetic energy into heat inside the irradiated material [3, 9]. Based on the material’s absorption of MW due to its dielectric loss, the electromagnetic energy is converted into heat at the molecular level, generating heat throughout the sample volume to achieve the overall heating goal [10, 11]. MW sintering is a powerful method of processing materials and improving the performance characteristics of several materials simultaneously [9, 12].
MW sintering has shown various advantages, such as high temperature, high heating rates, uniform temperature, and equivalent thermal history throughout the specimen [1, 13-15]. MW-material interaction mechanism has suggested that MW electromagnetic radiation combines well with low-frequency elastic lattice oscillations, producing a non-thermal phonon distribution that enhances the ion mobility and diffusivity of crystalline solids under MW irradiation. From the theory of the mean mass dynamic effect of a high-frequency electric field in ionic crystals, the electric field of high-frequency oscillations improves charge and mass transport in solids [16-18]. Additionally, different studies have shown that the MW technique significantly affects the sintering and crystallization kinetics of the material. For example, Chen et al. [19] prepared ZrO2 ceramics using the multimode cavity MW mixed sintering method to refine the ceramic grain size and reduce the sintering temperature. Additionally, the grain boundary diffusion and induced phase transition caused by MW selective heating jointly weakened the grain boundary binding strength and enhanced the toughness of the material.Li et al. [20] reported that MW treatment for preparing glass-ceramics significantly reduced the crystallization activation energy and accelerated grain growth. Furthermore, MW radiation affected crystal orientation, promoting the formation of a diopside crystal structure.
The combination of high glass transition temperature, good mechanical properties, good high-temperature thermal stability, and good corrosion resistance in rare earth silicate glass make it a potential material for many applications [21-23]. In previous studies, glass-ceramics with high corrosion and wear resistance were successfully prepared through the melting method using Bayan obo slag, blast furnace slag, and fly ash as the main raw materials [24-26]. The excellent properties obtained by glass-ceramics are mainly related to the glass matrix rare earth oxides. Among them, CeO2 is often used as a flux for glass to reduce the glass melting temperature. However, the formation of CeO2 in silicate glass and the law of structural evolution for glass-ceramics have not been fully understood.
In this study, CeO2-doped glass-ceramics were prepared using a conventional muffle furnace and an MW heating system. The structure and crystallization of MW-treated glass-ceramics were compared with those of conventional furnace heat-treated samples, exploring migration pattern and crystallization characteristics of CeO2 in tailing glass-ceramics under microwave irradiation.
Sample preparation
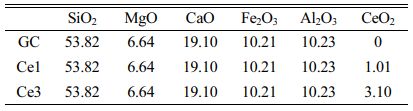
In the experiment, Bayan obo iron tailings and fly ash were used to prepare slag glass-ceramics (CaO–MgO–Al2O3–SiO2), and Table 1 shows the slag composition. The experimental study used tailings to fly ash addition ratio of 3:2, with a combined waste utilization rate of ~70%, and small amounts of SiO2, MgO, and CaO (chemical grade) to make up the base glass composition. Glass-ceramics (Ce0, Ce1, and Ce3) with different CeO2 additions were prepared, and the total CeO2 content in the samples was 0, 1, and 3%, respectively. The CeO2 content in the Ce0 sample was obtained from the tailings. The base glass composition is shown in Table 2.
The primary glass was produced by the conventional melting and casting method, with different concentrations (0-3 wt%) of CeO2 as the additive. First, iron tailings, fly ash, and other additives were thoroughly mixed and melted in an electric furnace at 1500 ℃ for 3 h for homogenization. Second, the glass solution was cast into a glass block in a metal mold and annealed in a muffle furnace at 600 °C for 1 h. Subsequently, the solution was poured into cold water, and the water-quenched glass was subjected to DSC. Finally, MW-assisted crystallization of the primary glass was performed. The MW frequency was 2.45 GHz, and the maximum input power was 5 KW. The MW heating rate was controlled by adjusting the MW input power. For comparison purposes, conventional heat treatment was also used to prepare the glass-ceramics. The selected heat treatment temperature was determined based on the DSC test results, and the heating rate was controlled at 2-3 ℃/min.
Techniques of Characterization
The water-quenched slag was detected via DSC measurement (STA 449F3-NetzSCH5) at different heating rates (5, 10, 15, and 20 K/min). Thermal properties of the glass transition temperature (Tg) and glass crystallization temperature (Tp) of raw glass were characterized using DSC. The crystal structure and composition of glass-ceramics were obtained by X-ray diffraction (XRD, Rigaku Miniflex600, Cu-Kα, 20° ≤ 2θ ≤ 80°, 10°/min). A representative sample of the slag glass-ceramic was selected for polishing and placed in a 5% molar mass hydrofluoric acid solution for 30 s. Consequently, the glass was etched away, and the crystal phase morphology was fully revealed. The crystal phase morphology of the sample was observed using a scanning electron microscope (SEM Zeiss-Suppra55) in the secondary-electron phase mode. Meanwhile, EDS energy spectrum accessories were used to collect information on element enrichment.
For Raman spectroscopic analysis, different glass-ceramics were ultrasonically cleaned in deionized water for 5 min, dried, and mounted on glass slides. The samples were tested at room temperature. Raman spectra were acquired using a confocal Raman microscope (Renishaw inVia-Qontor, UK) equipped with a green laser (532 nm). A 50 mW laser was focused with a 50× objective, and the scattered light was collected by a thermoelectrically cooled CCD detector. Cosmic rays were removed in spectral processing, followed by background subtraction.

Thermal evolution of the primary glass
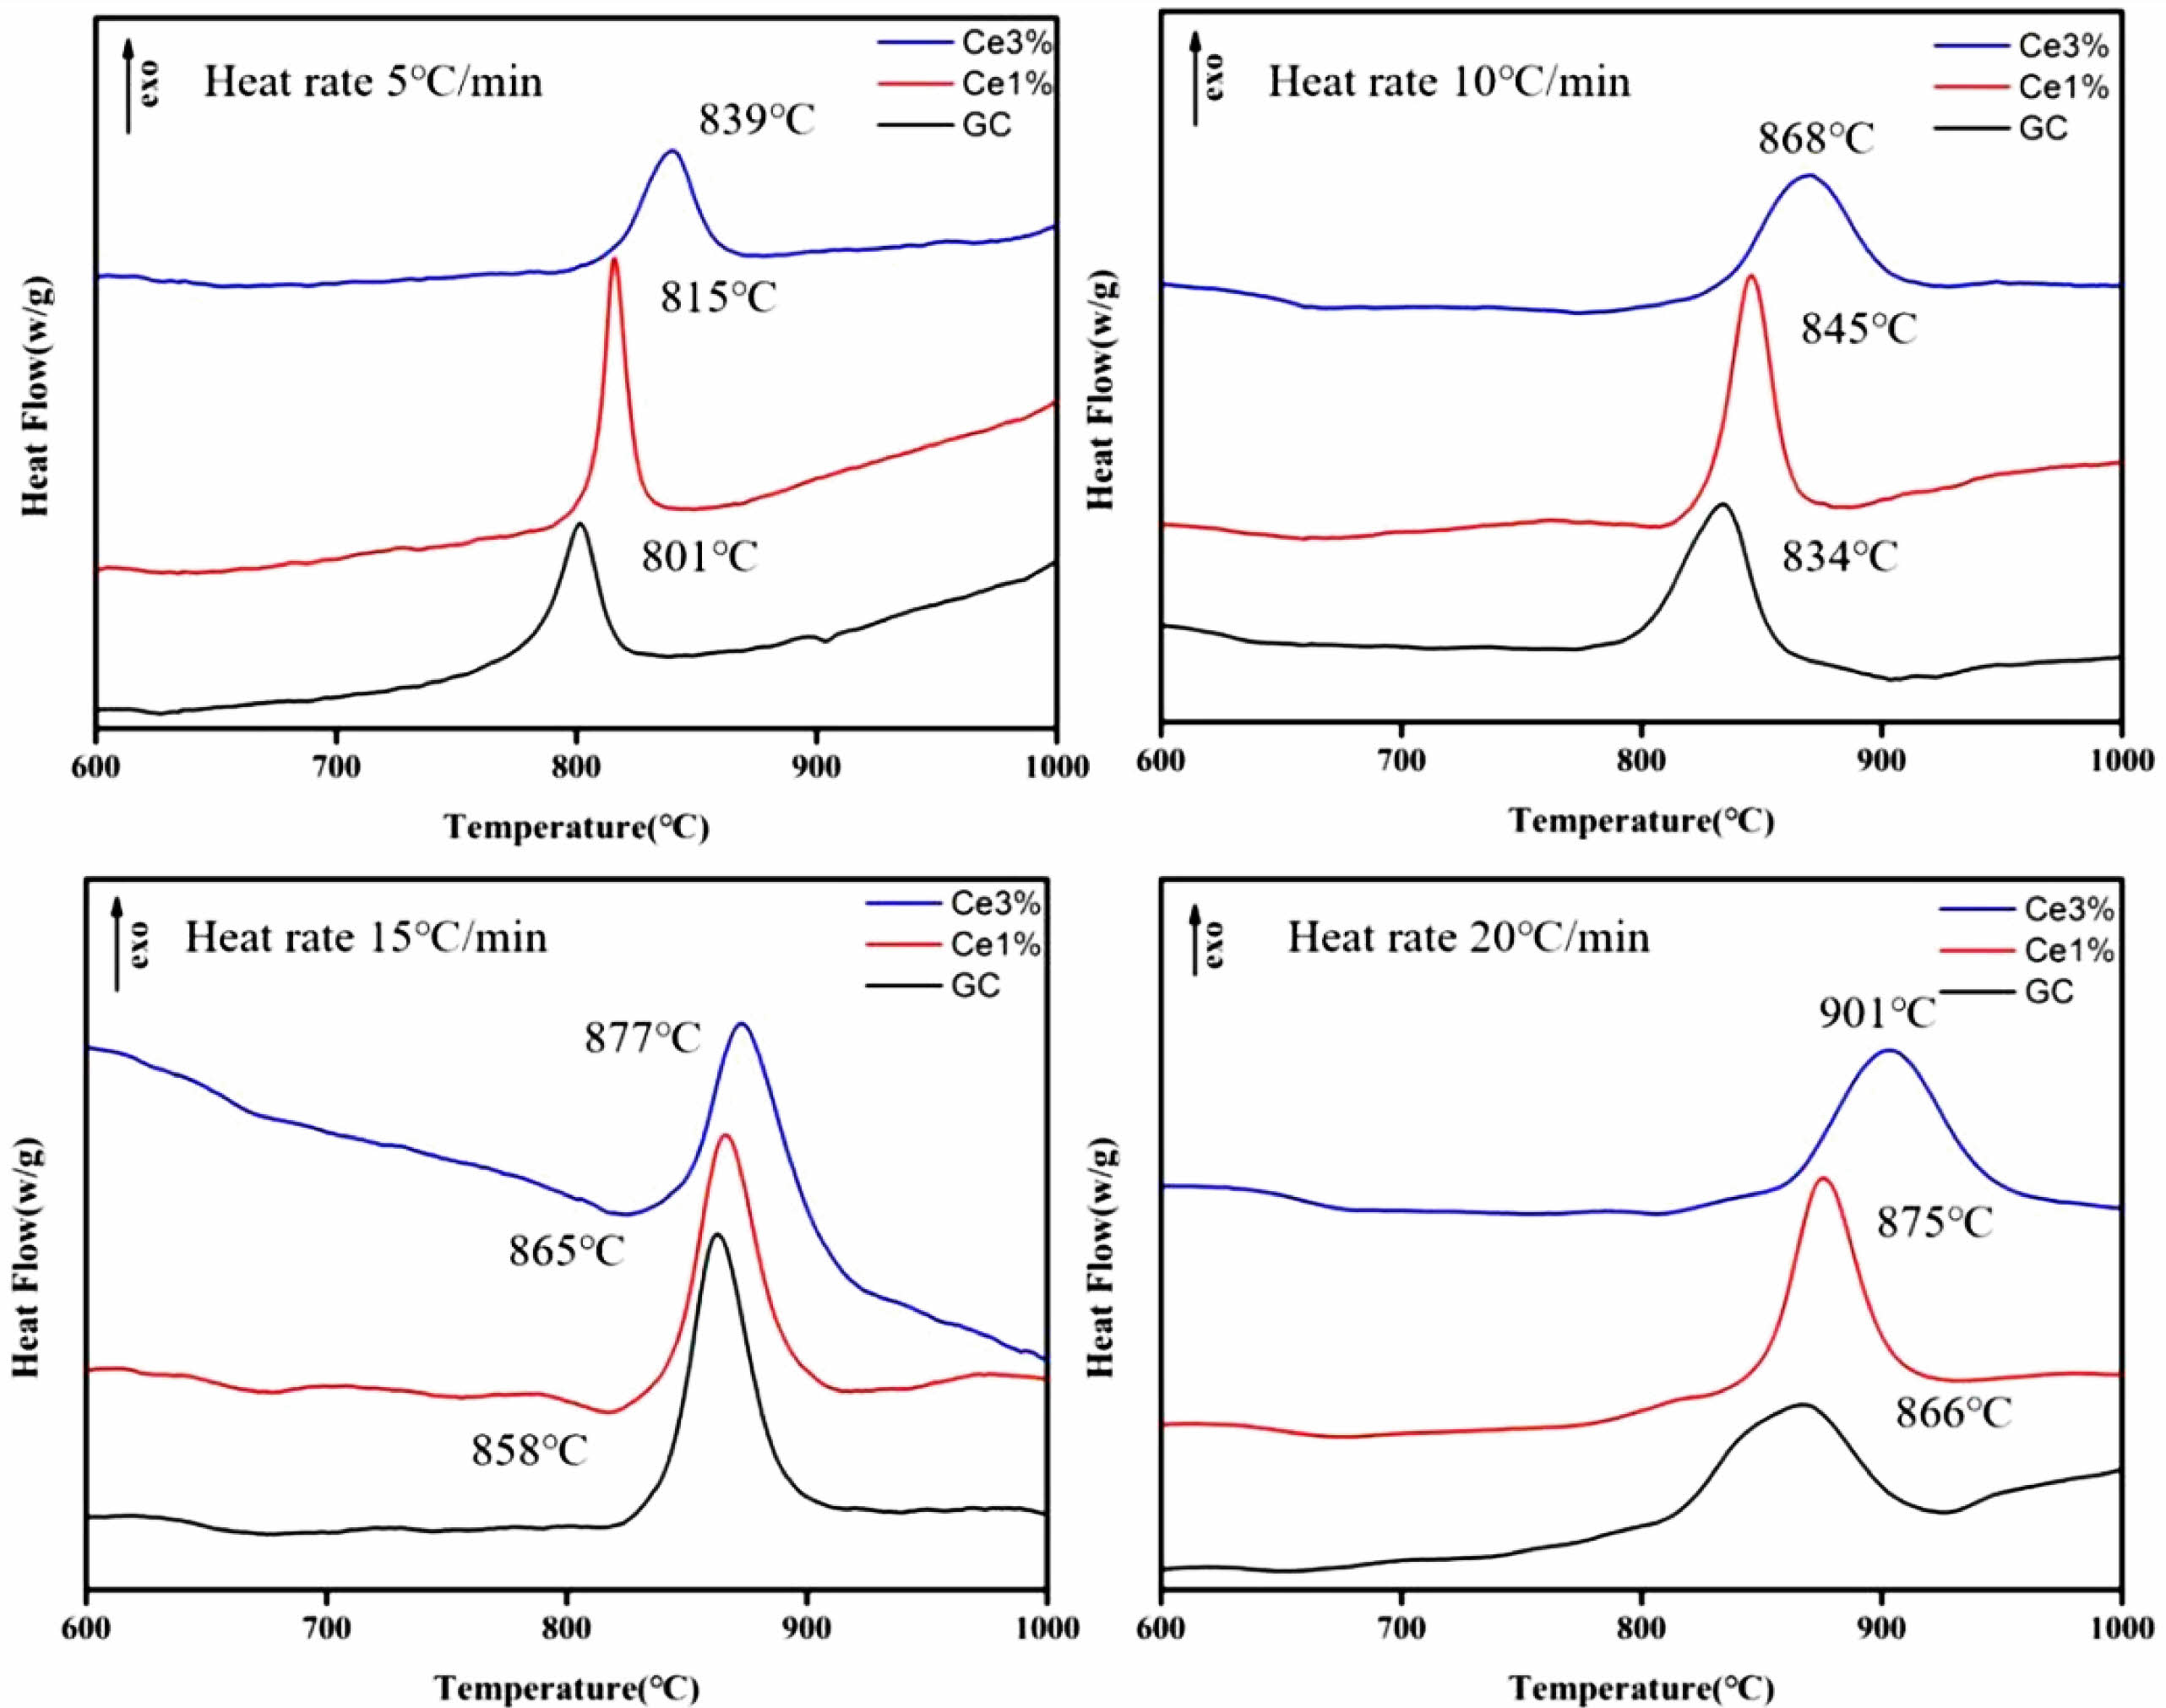
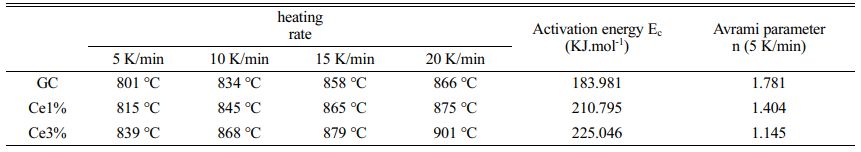
As shown in Fig. 1, independent crystallization peaks were formed between 800 ℃~900 ℃ for each sample at different heating rates. With an increase in CeO2, the crystallization temperature of the glass-ceramics increased. Numerous studies have shown that the stability of the primary glass and the crystallization activation energy determine the crystallization ability of glass-ceramics [27-29]. The DSC curve values were used to determine the crystallization thermodynamic parameters of the glass. Based on the crystallization kinetic theory proposed by Kissinger and the crystallization kinetic parameters of Augis-Bennett [30, 31], the crystallization activation energy (Ec) and Avrami index (n) were calculated:
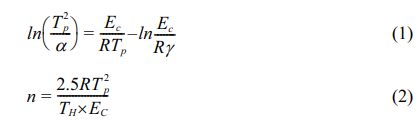
where α, R, TH, and Tp are the test heating rate, gas constant, exothermic peak half-peak width, and the corresponding crystallization temperature at α, respectively. Ec represents the energy barrier for the crystallization of the primary glass. A low Ec promotes the nucleation and crystal growth of the glass, which is closely related to the structure of the primary glass. Using Eqs. (1) and (2), Ec and n were obtained, and the calculated results shown in Table 3.
Meanwhile, Tp, Tb (crystallization onset temperature), and Tg were determined from the DSC analysis, and the glass stability (GS) parameters KGS were calculated as follows [28, 32]:

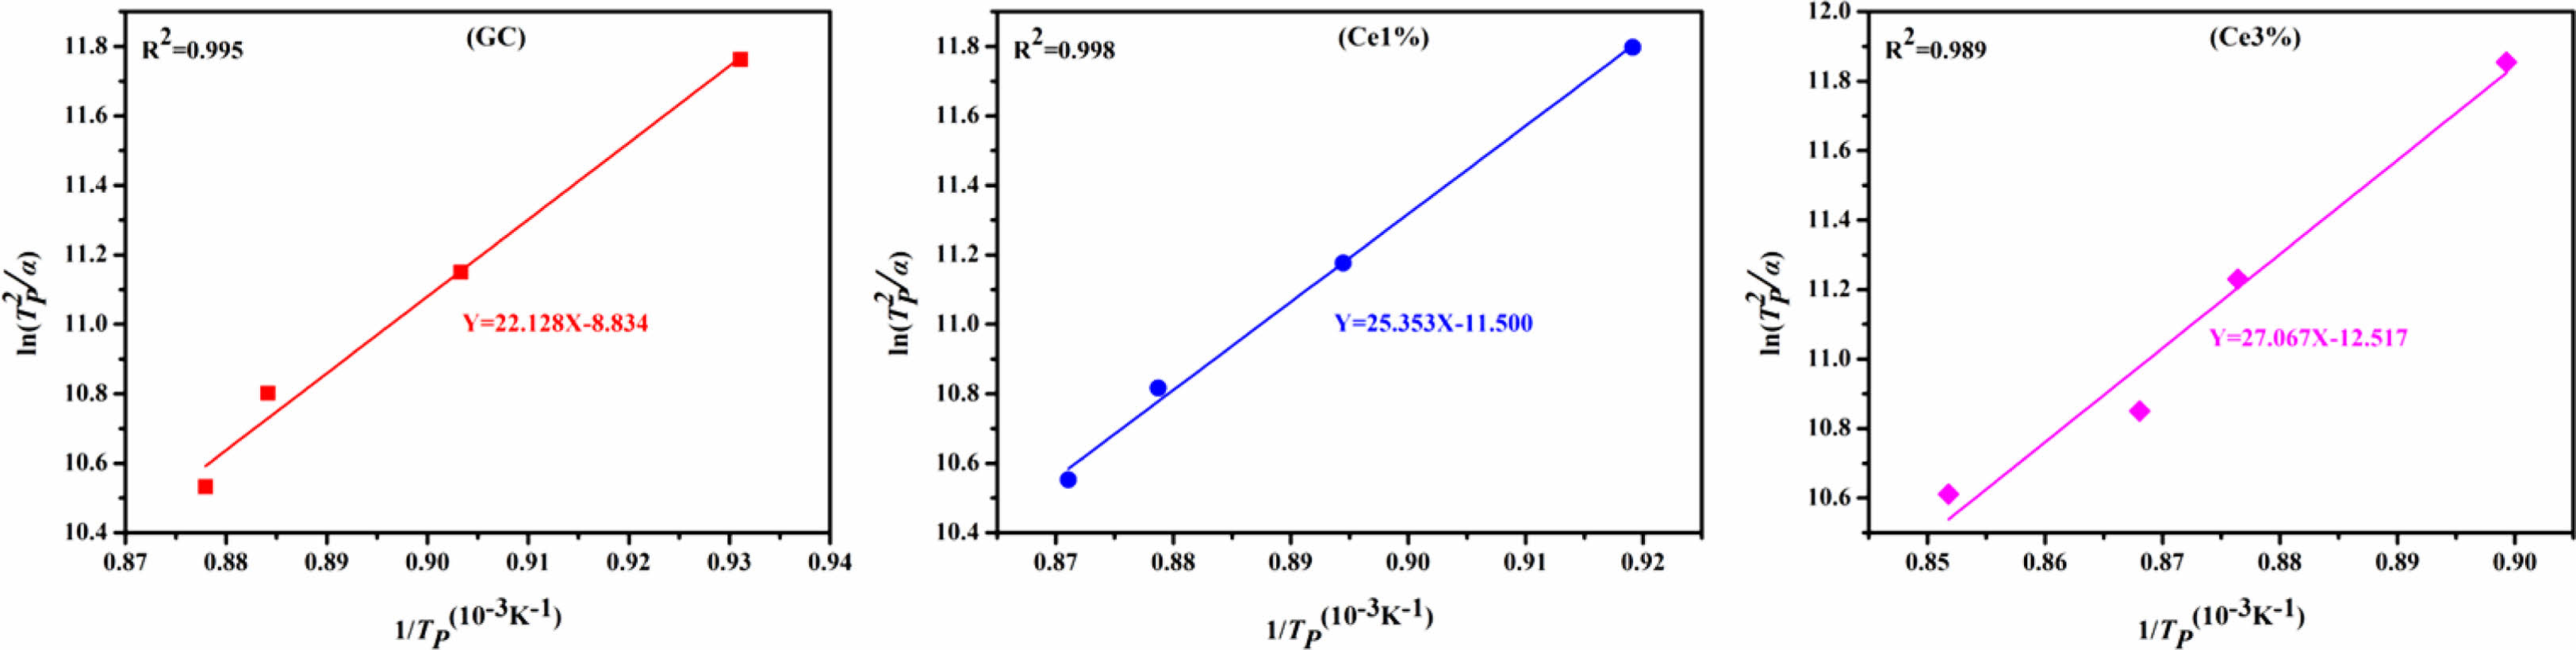
The KGS values were obtained from Eqs. (3) and (4), which decreased from 9.76 to 5.83 and then increased to 9.07 with an increase in CeO2. The Ec value increased from 183.981 to 225.046 KJ·mol−1 as CeO2 increased (Fig. 2 and Table 3). Additionally, the crystallization index values of the different specimens ranged from 1~2. It represents the coexistence of surface and bulk crystallization in glass-ceramics. However, the crystallization index values showed a decreasing trend with the increase of Ce ions in the primary glass. It can be shown that cerium oxide can inhibit the crystallization of this glass-ceramics. Du et al. [25] found that CeO2, as a high field strength ion in silicate glass, combined with [SiO4] tetrahedra to form Ce-containing silicate glass agglomerates, which inhibited the crystallization of glass-ceramics. Similar results emerged in our study, where an increase in CeO2 content raised the crystallization temperature of the glass-ceramics. Combining the above results, it is tentatively speculated that CeO2 can make the glass more stable and increase the crystallization energy potential, which makes the crystallization efficiency of glass-ceramics lower.
Structural characteristics of the primary glass
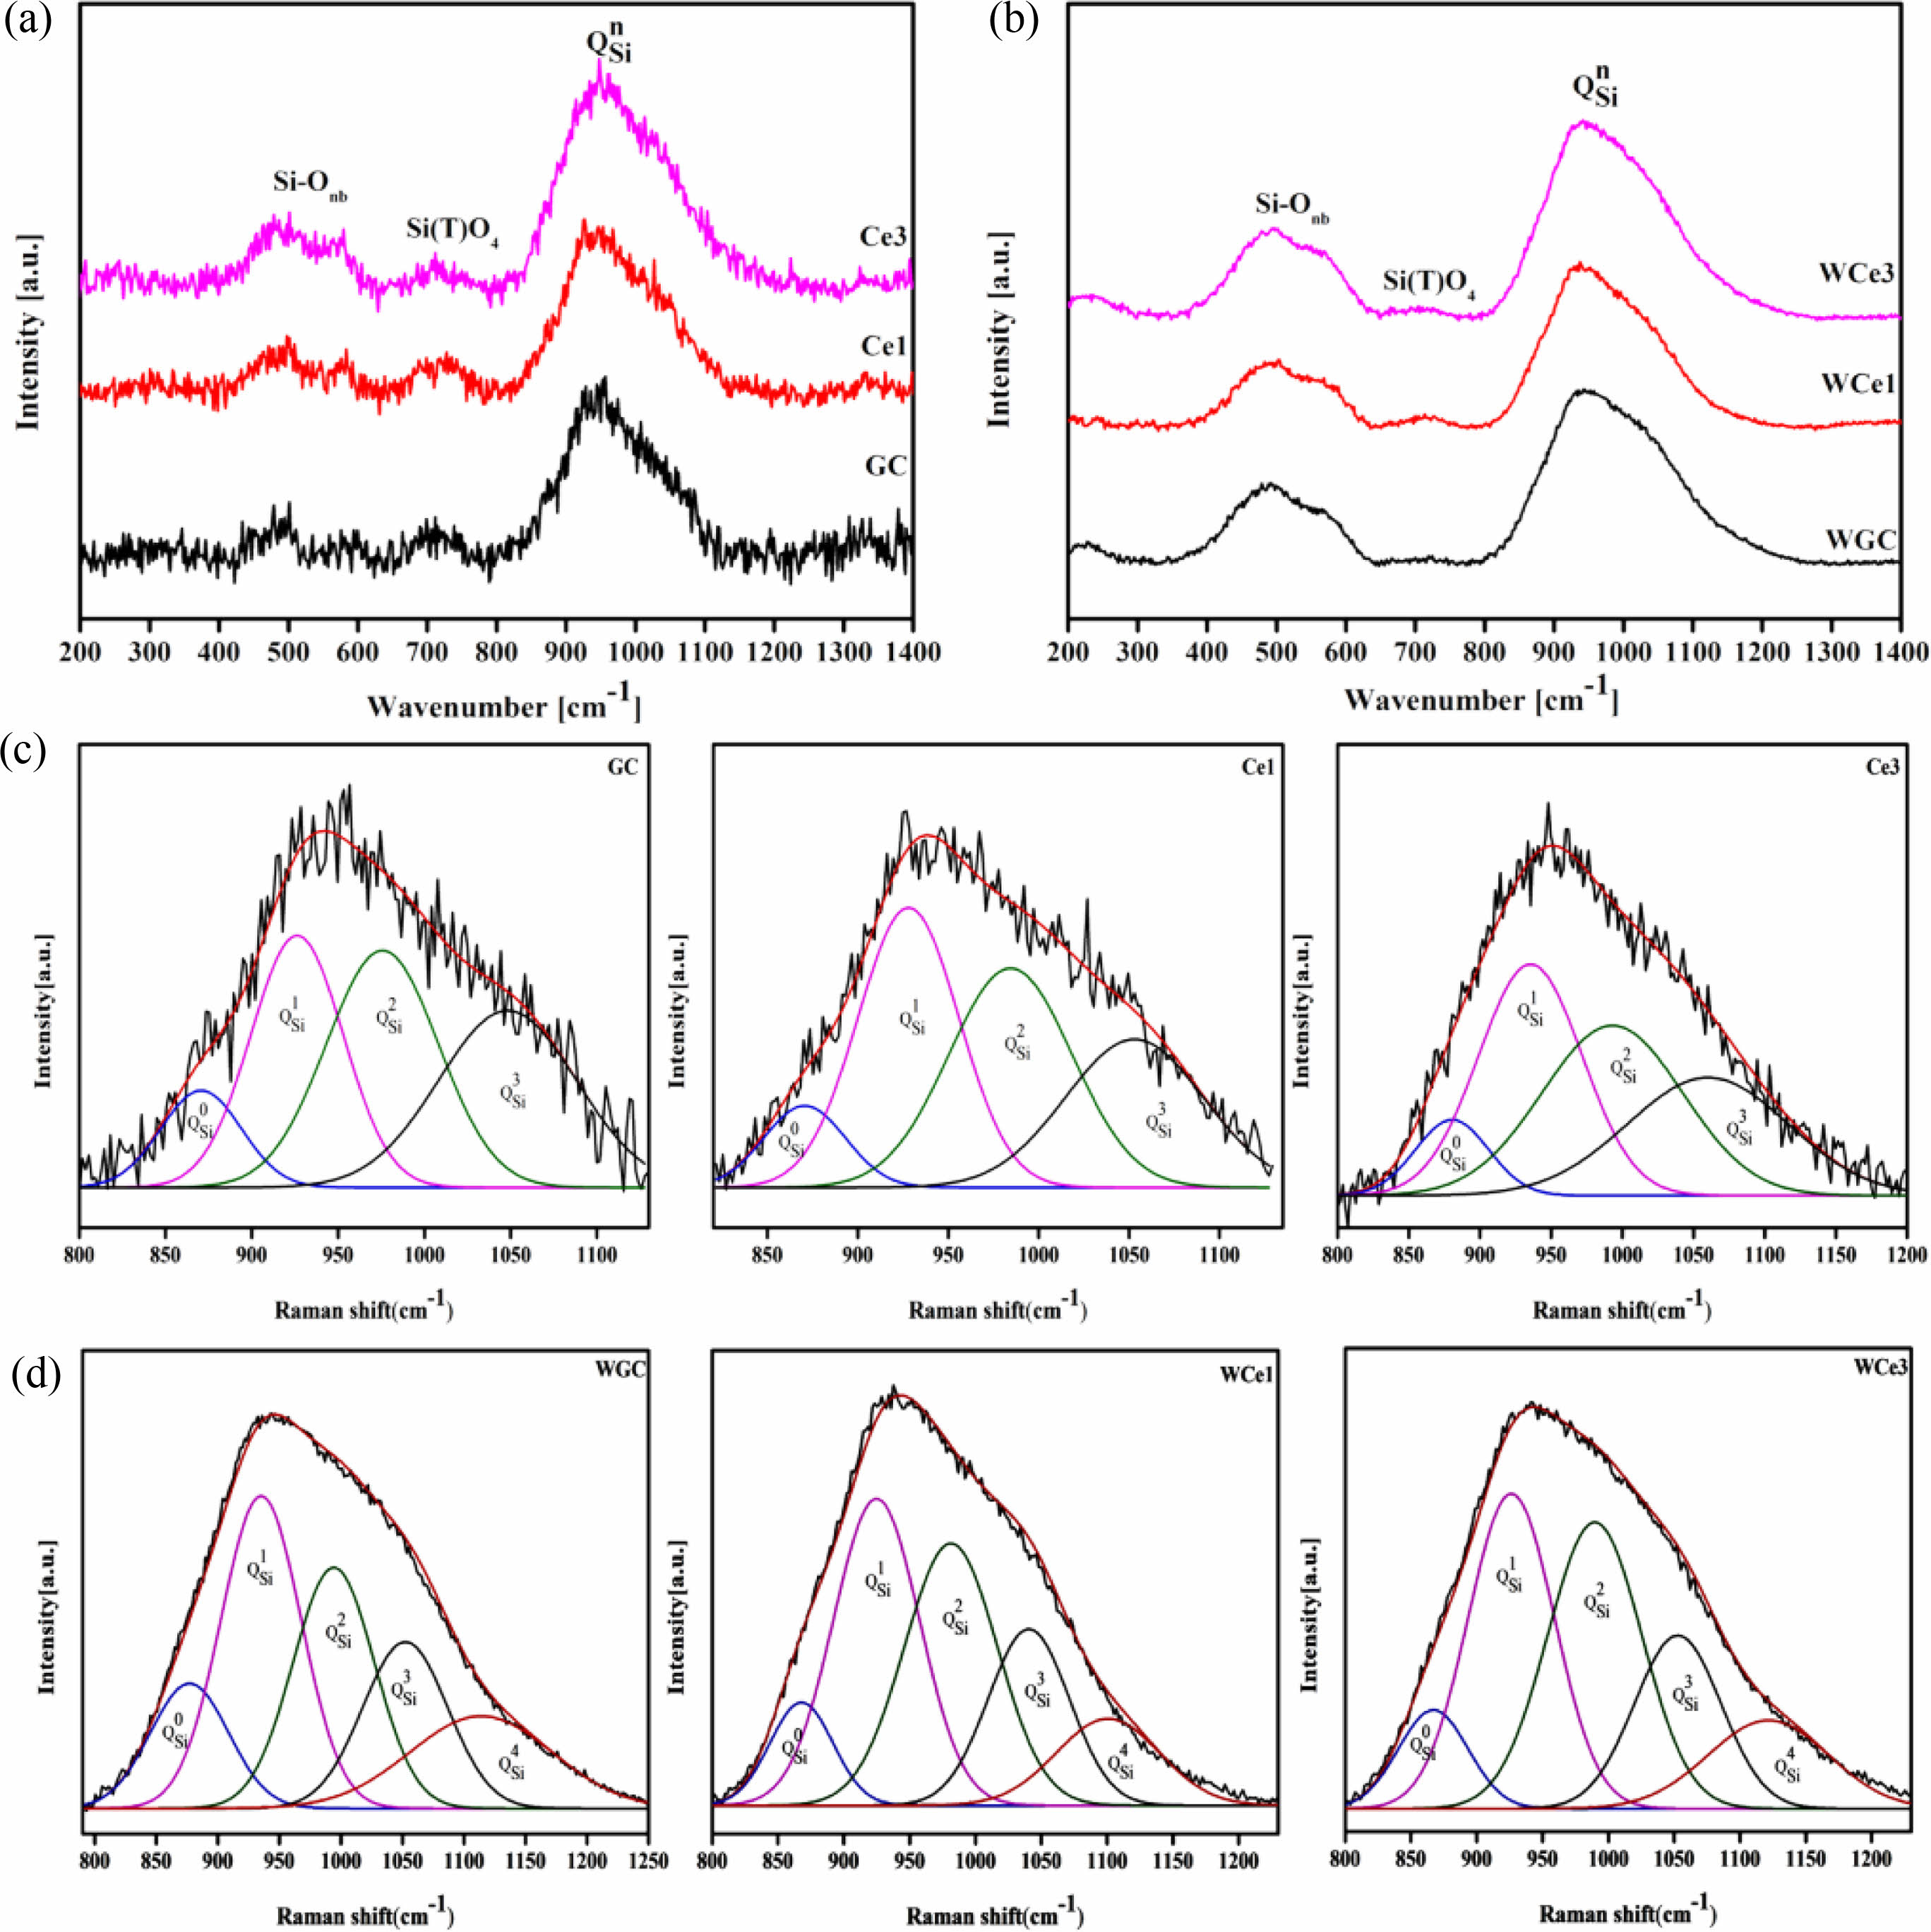
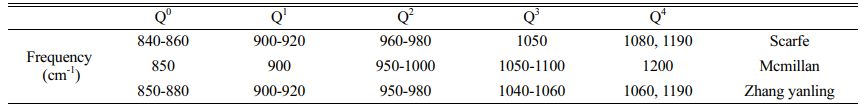
The structure of the primary glass is among the important factors affecting future crystallization and phase transition. The primary glass is prepared in OH and MWH modes at 600 ℃. Fig. 3 shows the Raman spectra of the primary glass with different CeO2 content. This Raman spectrum has three important regions near 200-1300 cm−1, a ~500 cm−1 band for Si-O bending vibrations, a weak peak at ~700 cm−1 for the independent Si(T)-O glass structure, and a strong band at ~1000 cm−1 representing the stretching mode of the Si-O band with a different Qn structure to the shoulder peak [33, 34]. According to the silicate structure theory by Mysen [35], the Raman spectra ranging from 800-1200 cm−1 were divided into five typical BO and NBO structural units, namely, SiO2(Q4), [SiO5]2−(Q3), [SiO6]4−(Q2), [Si2O7]6−(Q1), and [SiO4]4−(Q0).
In previous studies, it was found that the chemical reaction of cerium oxide in molten glass at high temperature occurs, 4Ce4++2O2-→4Ce3++O2 . CeO2 on the glass melt to destroy the polymeric [CeO4] structure, reduce the viscosity of the glass, homogenize the glass composition of the effect [36, 37]. The high-temperature thermodynamic catalysis causes the coexistence of Ce4+/Ce3+ in part of the valence state change of cerium ions in the glass. The Ce3+-O component of the primary glass is present as octet and acts as a modifier of the glass network with the glass network body. And Ce3+ (similar to Ca2+) acts as a charge-compensating cation near the [SiO4] tetrahedral unit. This leads to the reaction of the nonbridging oxygen (NBO) anion with the Ce ion and its gradual conversion to bridging oxygen (BO), which leads to an increase in the polymerization of the glass [38, 39]. In contrast, the [CeO4] structure forms a continuous glass network body with the [SiO4] and [AlO4] tetrahedra in the glass matrix, enhancing glass polymerization [39, 40].
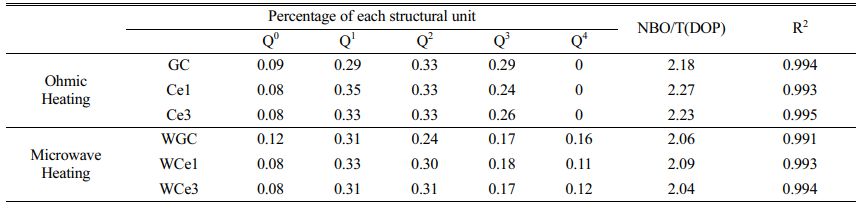
Further, the results of the past study (Table 4) were referred to for the fitting of a deconvolution Si-O network for different samples at 800-1200 cm-1. The results of Qn were fitted using Peak Fit software, and the fitted results are shown in Figs. 3(c-d). The ratio of NBO to total oxygen (NBO/T) can reflect the degree of depolymerization (DOP) of the glass network structure, and the content ratio of Qn is linearly proportional to the area ratio of the characteristic peaks [28, 33, 41]. The DOP is determined by Eq. (5), and the results are shown in Table 5.

With the increase of CeO2 from 0% to 3%, the DOP value increases from 2.18 to 2.27 and then decreases to 2.23 for the conventional heat-treated glass, whereas it increases from 2.06 to 2.09 and then decreases to 2.04 for the MW heat-treated glass. Obviously, the glass polymerization of the MWH samples was higher than that of the OH samples. Similarly, the KGS value proves that the stability of the primary glass first decreases and then increases. The Raman spectroscopy results showed that CeO2 in the primary glass improved the complexity of the glass structure. Therefore, when the CeO2 concentration is less than 1%, Ce ions mainly form ligand structures to increase the free oxygen in the glass network and reduce the degree of glass polymerization. When the CeO2 concentration increases, [CeO4] are formed, resulting in a decrease in DOP and an increase in KGS. Meanwhile, the microwave effect produces an activation effect on the primary glass, which improves the efficiency of the forward reaction of glass transformation into glass-ceramics.
The results show that Q1 and Q2 in different samples are the main silica-oxygen network structures of the glass network (Fig. 3c-d). However, the microwave treatment reduces the glass separation temperature, resulting in a decrease in the intensity of the Q2 band in the high frequency wave number range, while the intensity of the Q4 band increases significantly. This means that microwave energy tends to accelerate the diffusion of ions in the primary glass and improve the degree of polymerization of the glass network. The combined reference KGS and DOP calculations suggest that a small amount of CeO2 reduces the stability of silicate glass and destroys the connectivity of the glass network. However, the polymerization reaction of the glass network tended to increase with an addition in the CeO2 content, indicating that an increased CeO2 content promoted the formation of highly polymerized glass networks.
Phase identification of glass-ceramics by CeO2 addition
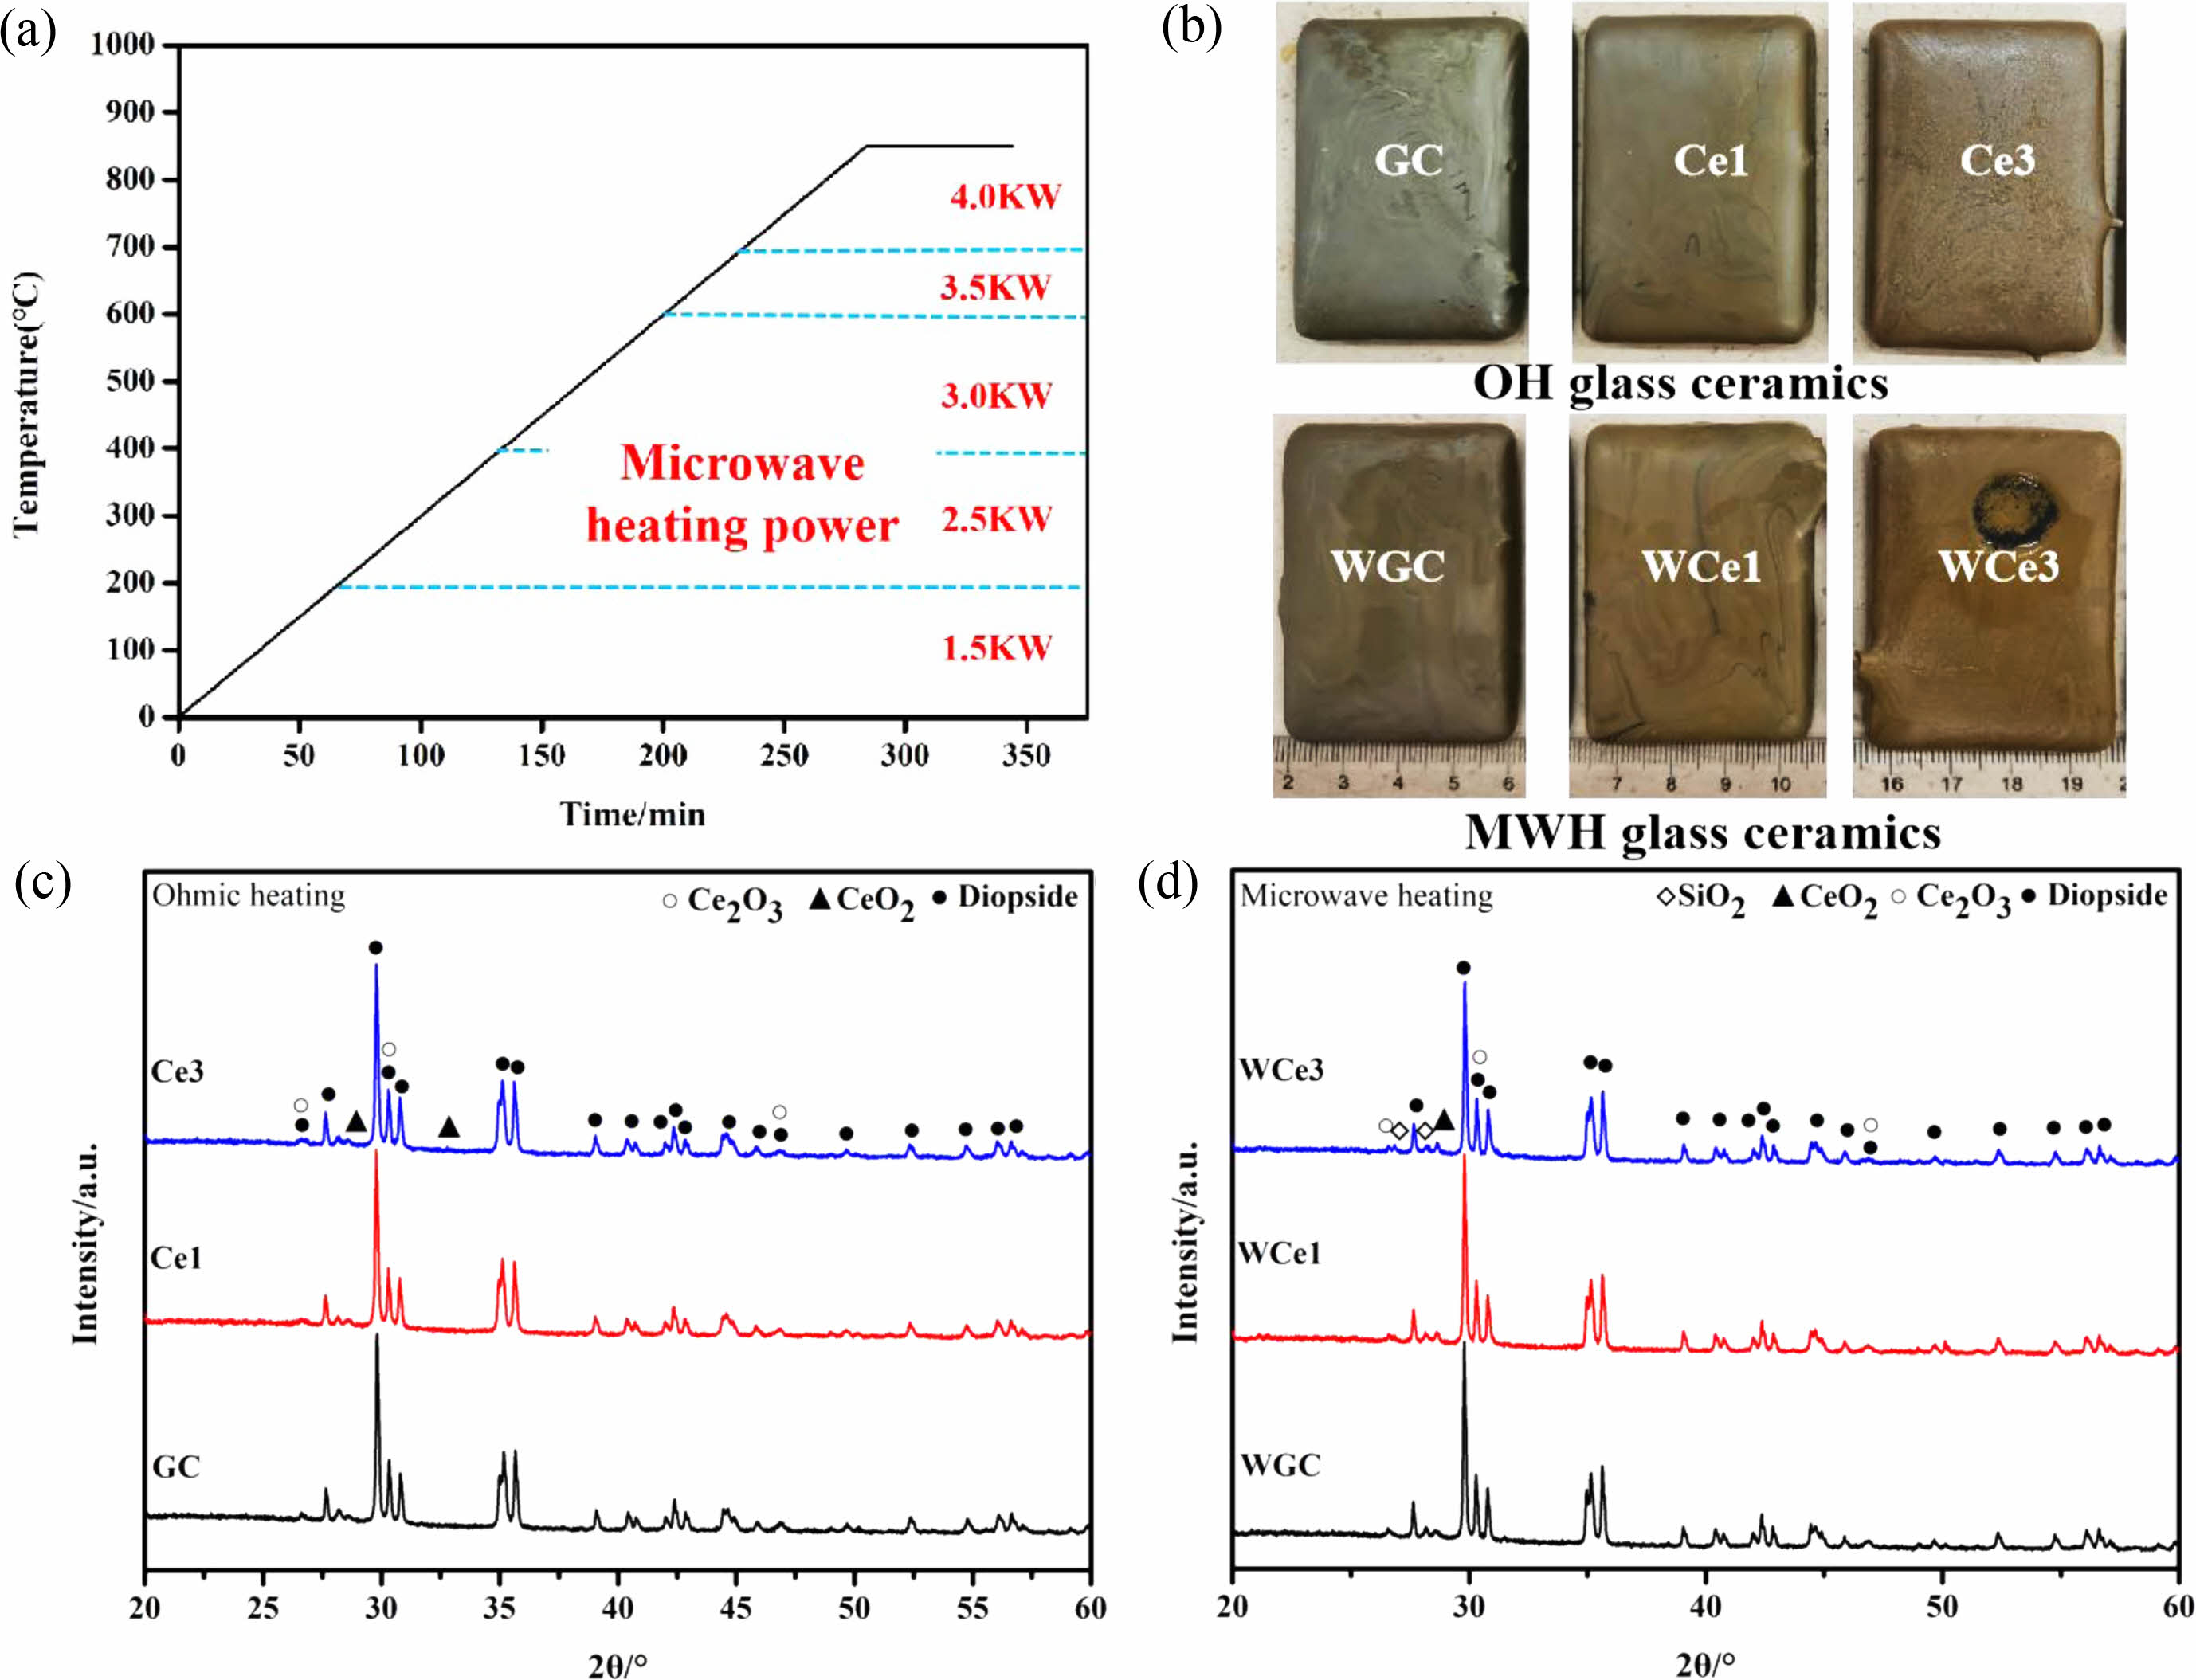
To further investigate the effect of CeO2 addition on the crystallization of CMAS glass-ceramics, the samples containing CeO2 were subjected to crystallization treatment. The temperature rise curve of the glass-ceramics treatment process and the power used at different temperature stages of the microwave process, as shown in Fig. 4a. Fig. 4b shows the macroscopic morphology of the glass-ceramics obtained by the two treatment methods.
Figure 4(c-d) show the XRD patterns of Ohm and microwave heat treatment samples respectively. The two treatment processes crystallize the glass-ceramics, to produce diopside ((Ca, Fe)(Mg, Fe, Al)(Si, Al)2O6 PDF# 72-1379). The precipitation of diopside caused a significant change in the connectivity of the primary glass, and the glass structure formed a stable chain silicate structure. Simultaneously, CeO2 (PDF# 81-0792) and Ce2O3 (PDF# 74-1145) were found in the XRD patterns. During the experiments, crystallization treatment promoted the precipitation of Ce2O3 despite CeO2 addition. The results show (1) that high-temperature melting and thermal crystallization induced partial conversion of Ce ions from Ce4+ to Ce3+ and (2) the coexistence of two valence states of Ce ions in glass-ceramics. According to previous studies, adding CeO2 to glass-ceramics inhibits their crystallization [25]. The addition of CeO2 produces a complex glass network component. Ce ions may be dissolved in the glass matrix as [CeO6] and [CeO4], where [CeO6] acts as a glass modifier and [CeO4] connects the surrounding [SiO4] tetrahedra and acts as a glass network body by bridging oxygen [40].
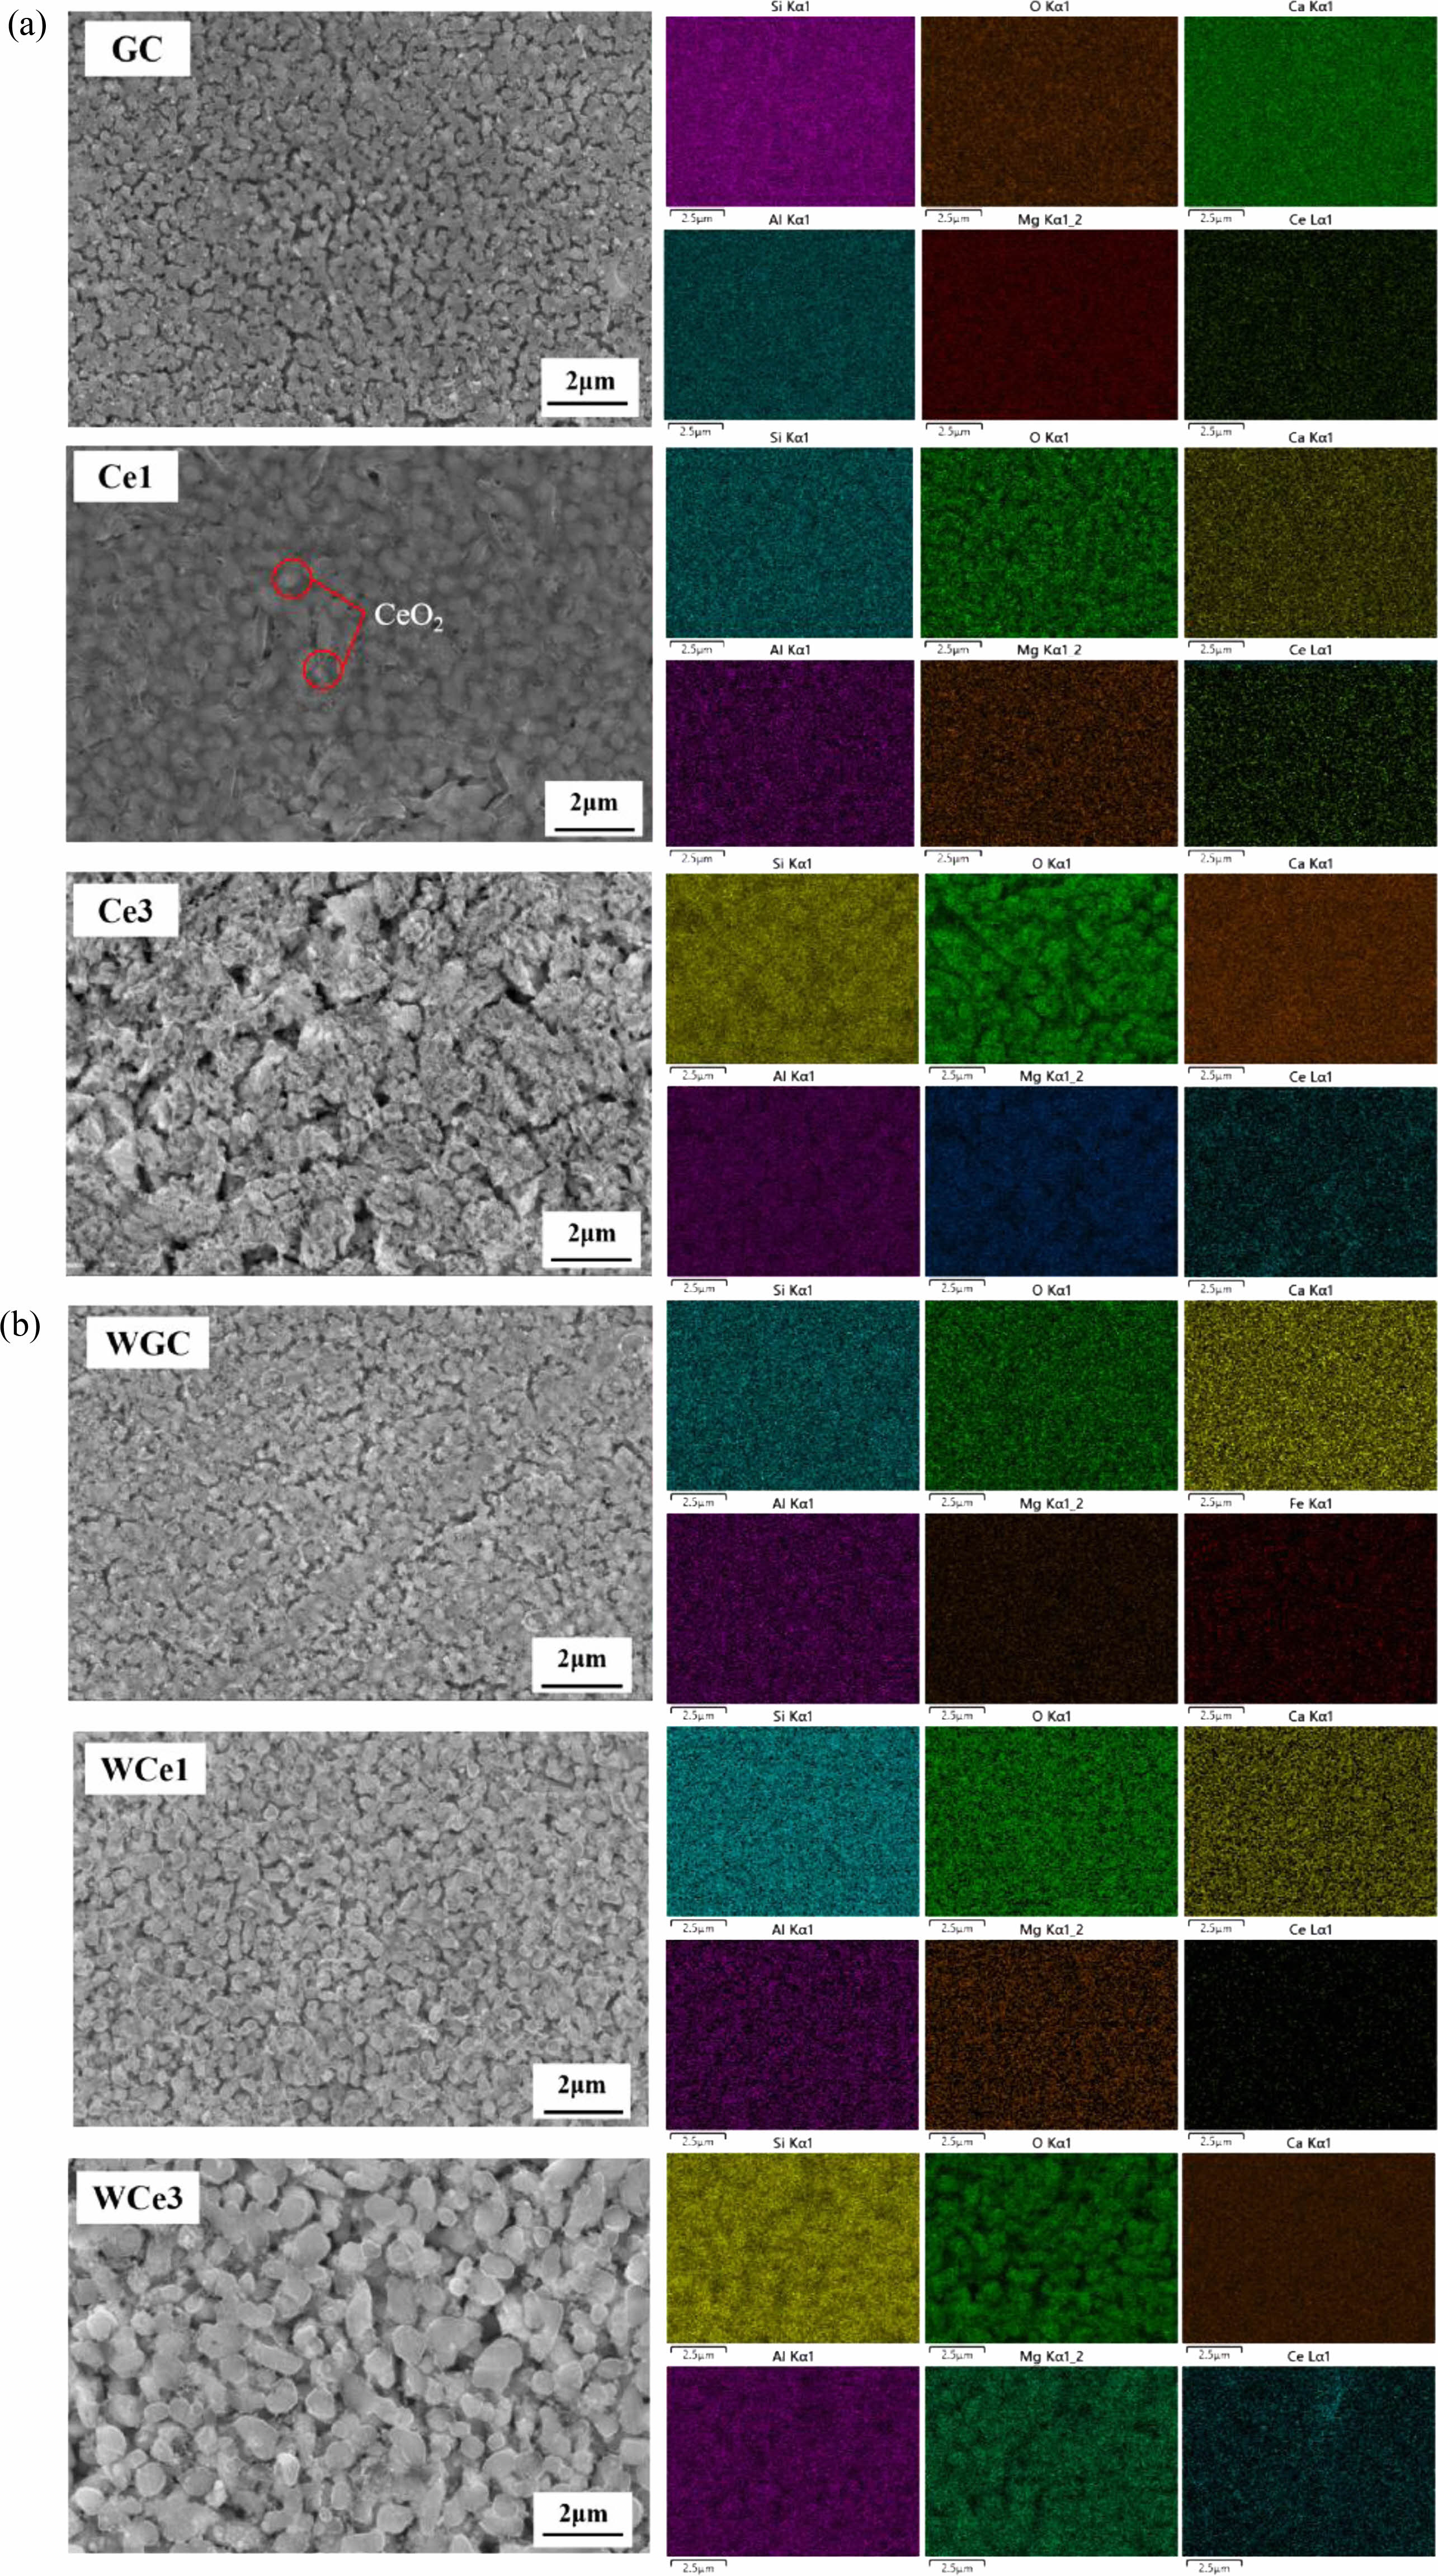
Fig. 5 shows the microscopic morphology of the crystallized glass-ceramic specimens with different CeO2 contents. The MWH resulted in uniform crystallization and grain refinement of diopside. The direct absorption of microwaves within materials allows volumetric heating which produces enhanced diffusion rates, reduced power consumptions, and lower processing times [3]. The results show that compared to OH, MWH has a more stable grain size, can easily obtain a uniform fine grain structure, and can quickly prepare fine-grained, uniformly distributed glass-ceramics. Noteworthy, the glass-ceramics of OH showed deposition with the addition of CeO2 in the glass matrix. However, no significant precipitation of CeO2 was found in the MWH samples. The CeO2 are mainly distributed in the glass, which affects the structure and metal ion distribution of the glass.
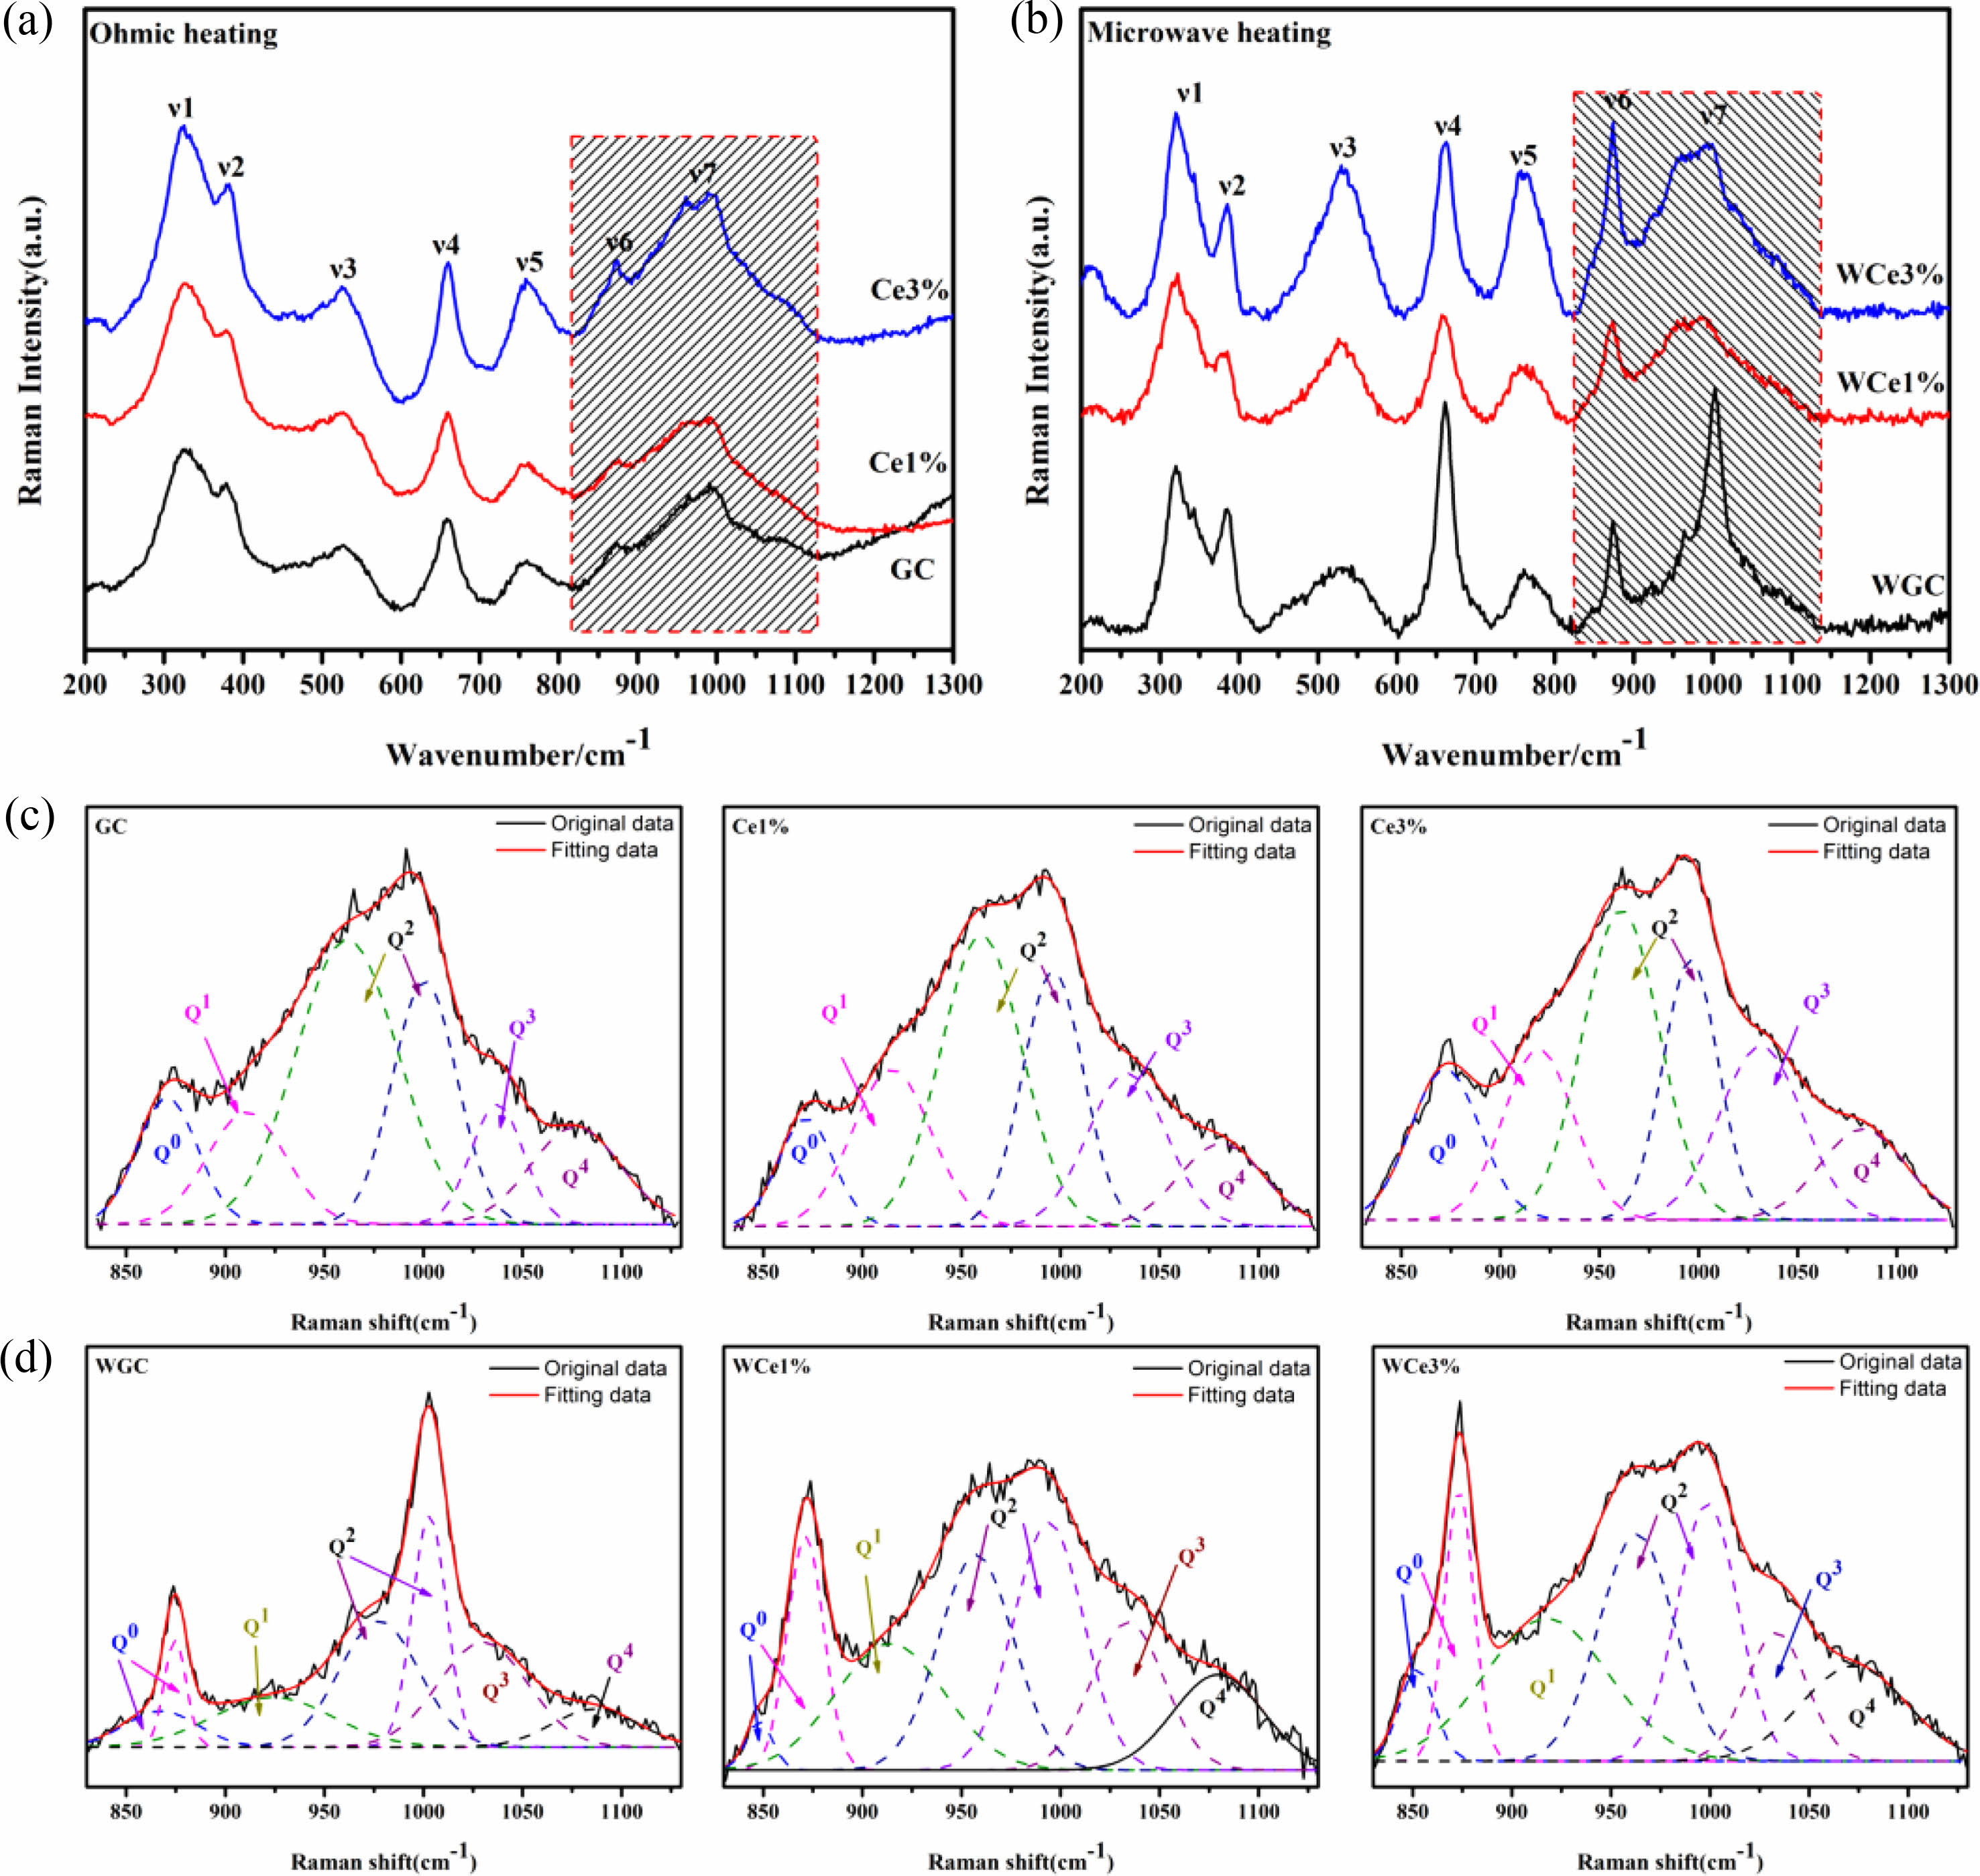
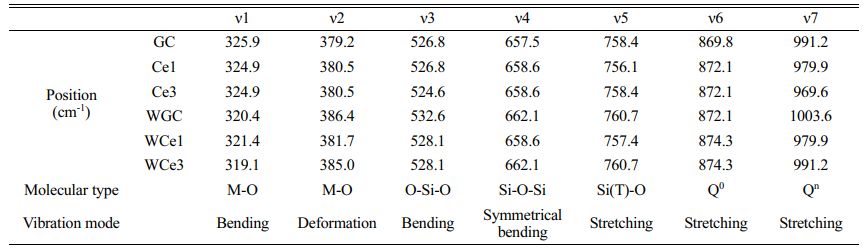
Correlation between structure and crystallization
Figure 6 shows the Raman spectra of glass-ceramics with different CeO2 contents at room temperature. Table 6 shows the results of the Raman peak information for glass-ceramics. Two types of heat treatment to obtain glass-ceramics with broad-shoulder peak polarization in the range of 400-700 cm−1 formed two strong peak units typical of the Si-O bond structure. The Si-Onb and Si-Ob structures were formed at ~530 and ~660 cm−1, respectively. Meanwhile, the diffraction peak intensities of the Si(T)O4 structural unit increased due to the crystallization of the parent glass and was gradually enhanced with CeO2 addition. The peak intensity of the [SiO4] tetrahedra stretching vibration at 800-1200 cm−1 was enhanced with CeO2 addition. These phenomena indicate that crystallization heat treatment promotes the structural readjustment of the primary glass and improves the aggregation and stability of the Si-O network.
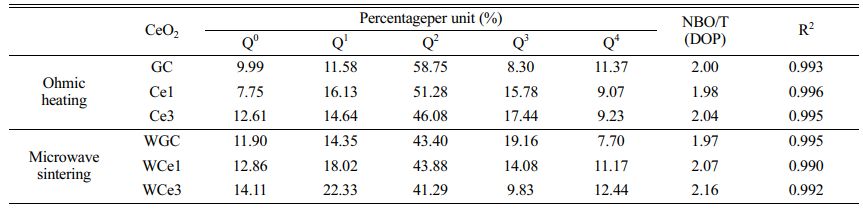
Using the Gaussian inverse fold product method, the different Qn of the glass-ceramics were analyzed (Figs. 6(c-d)). The different Qn were obtained by curve fitting. The DOP of the MWH and OH method glass-ceramics were calculated using Eq. (5), and the results are presented in Table 7.
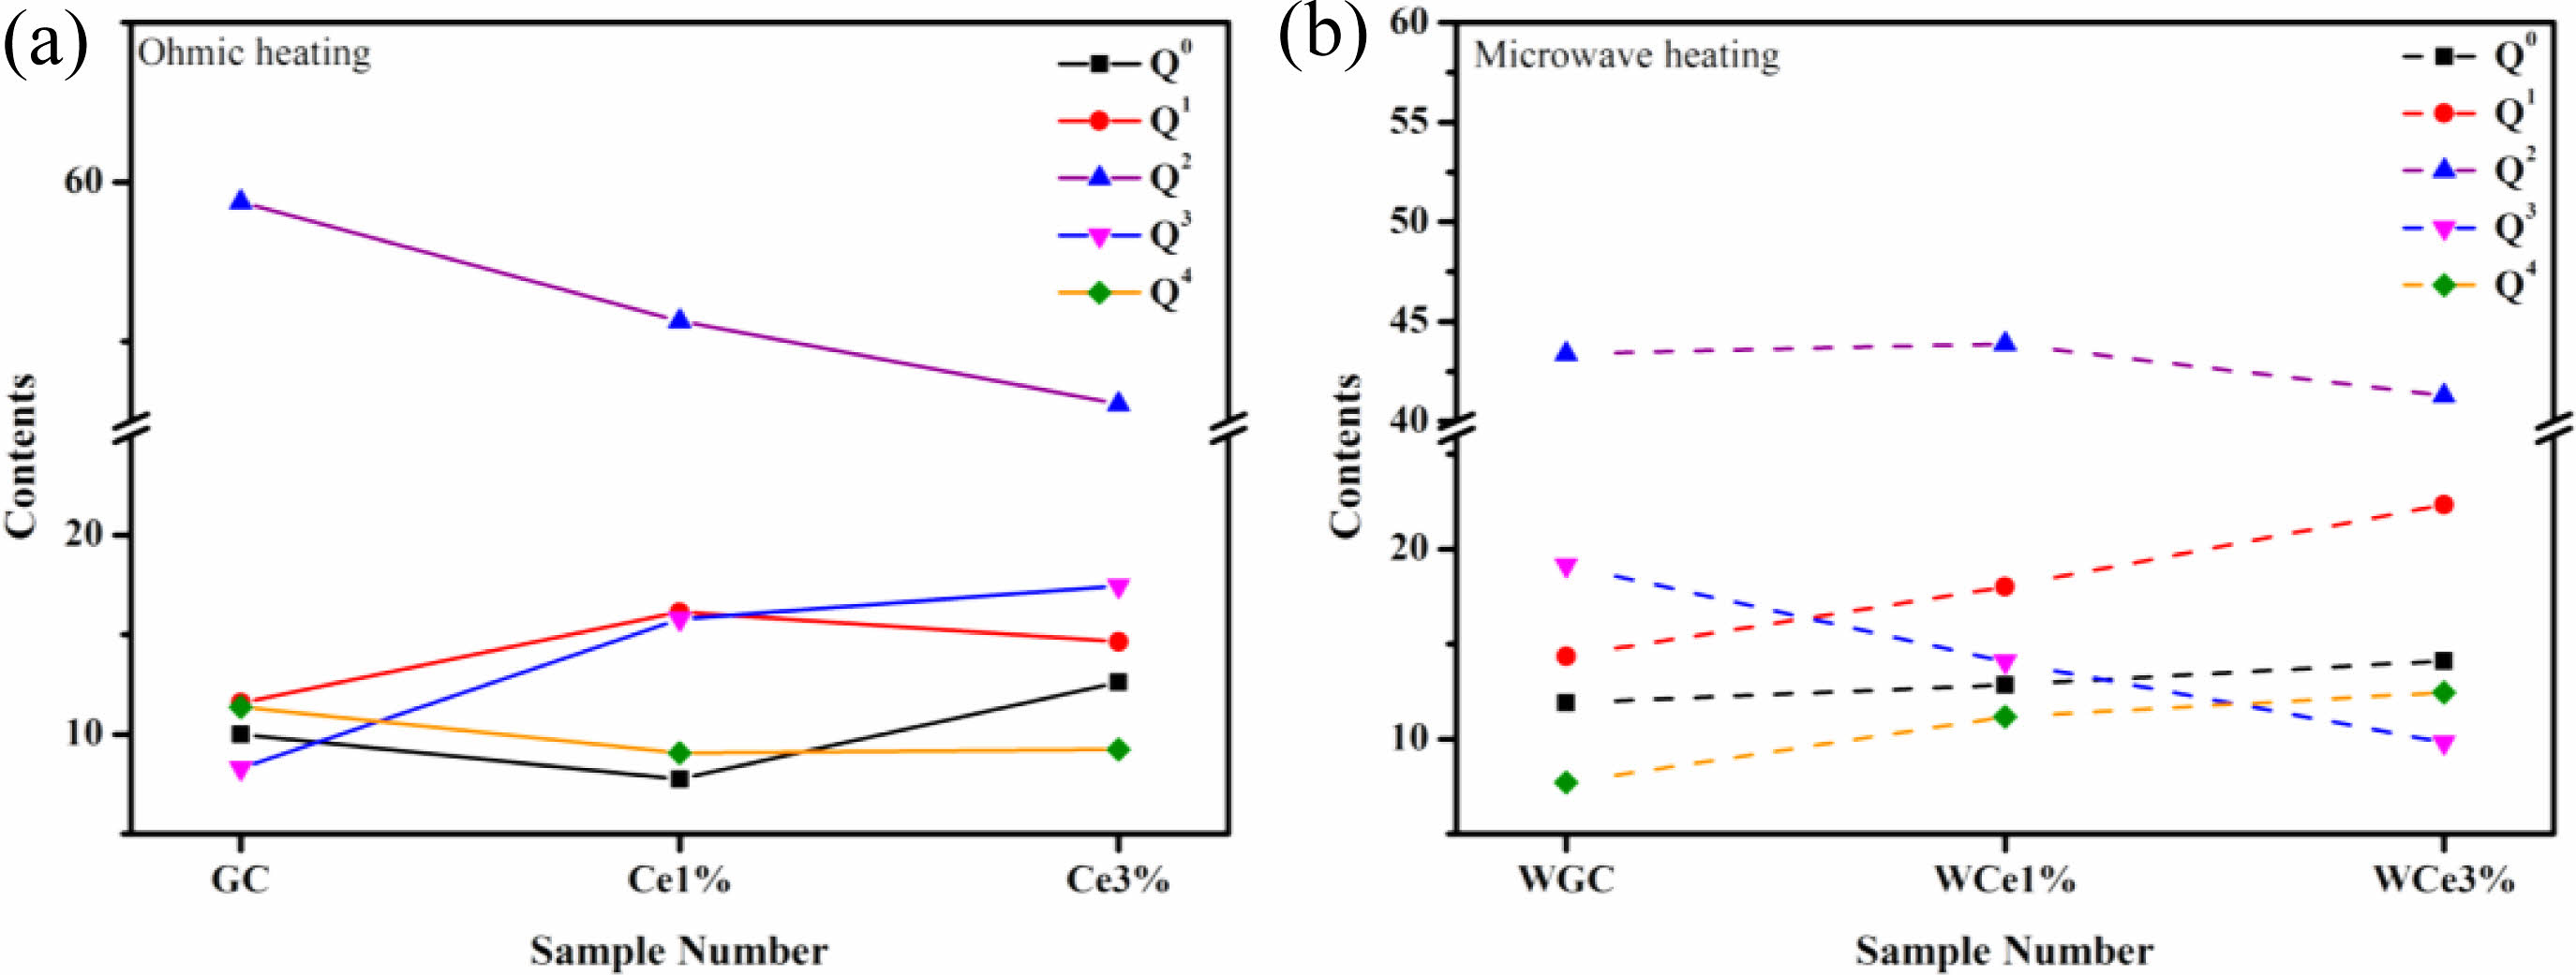
Figure 7a shows the Qn variation of the conventionally heated samples. With the addition of CeO2, the Q2 and Q3 content significantly decreased and increased, respectively. Additionally, the DOP values varied between 1.98 and 2.04. The SEM images showed the precipitation of CeO2 crystals from the glass matrix and the phase-separation of CeO2 from the primary glass leading to its insignificant effect on the DOP of the glass network.
The Raman spectra of the MW-sintered samples showed a significant decrease in Q3 content and an increasing trend in Q0 content with increasing CeO2 content (Fig. 7b). The addition of CeO2 increases the concentration of Ce4+ in the primary glass. A depolarization band appears at ~850 cm-1, the intensity of which is closely related to [CeO4]. The Ce4+ species favorably increase the glass depolymerization. During crystallization of glass-ceramics, Ce4+-O can preferentially attach to the Si-O tetrahedra to form a stable glass network. Additionally, the DOP value of the glass-ceramic sample increased from 1.97 to 2.16 with the addition of CeO2. This result implies that MW heat treatment improved the DOP of silicate glass compared with conventional heat treatment. The free Ce4+ plays the role of a glass network complement, and the high ionic field strength property makes it preferentially form Si-O-Ce structures. In order to neutralize the ionic negativity of the Si-O-Ce structure, often the tetrahedral coordination formed by Ce4+ is wrapped by alkali metal cations that act as modifiers, and these cations effectively stabilize the glass network structure. Unfortunately, the reduction of free alkali metal ions decreases the number of ion diffusion channels, which increases the energy barriers during glass crystallization. At the same time, the Si-O-Ce structural cannot form an ordered arrangement of glass networks during crystallization kinetics, which inhibits the transformation of Si-O network polymerization into stable crystal units. Thus, the glass content of the glass-ceramics increased, and the Ce ions raised the energy potential required for crystallization.
Effective of structures by microwave effects
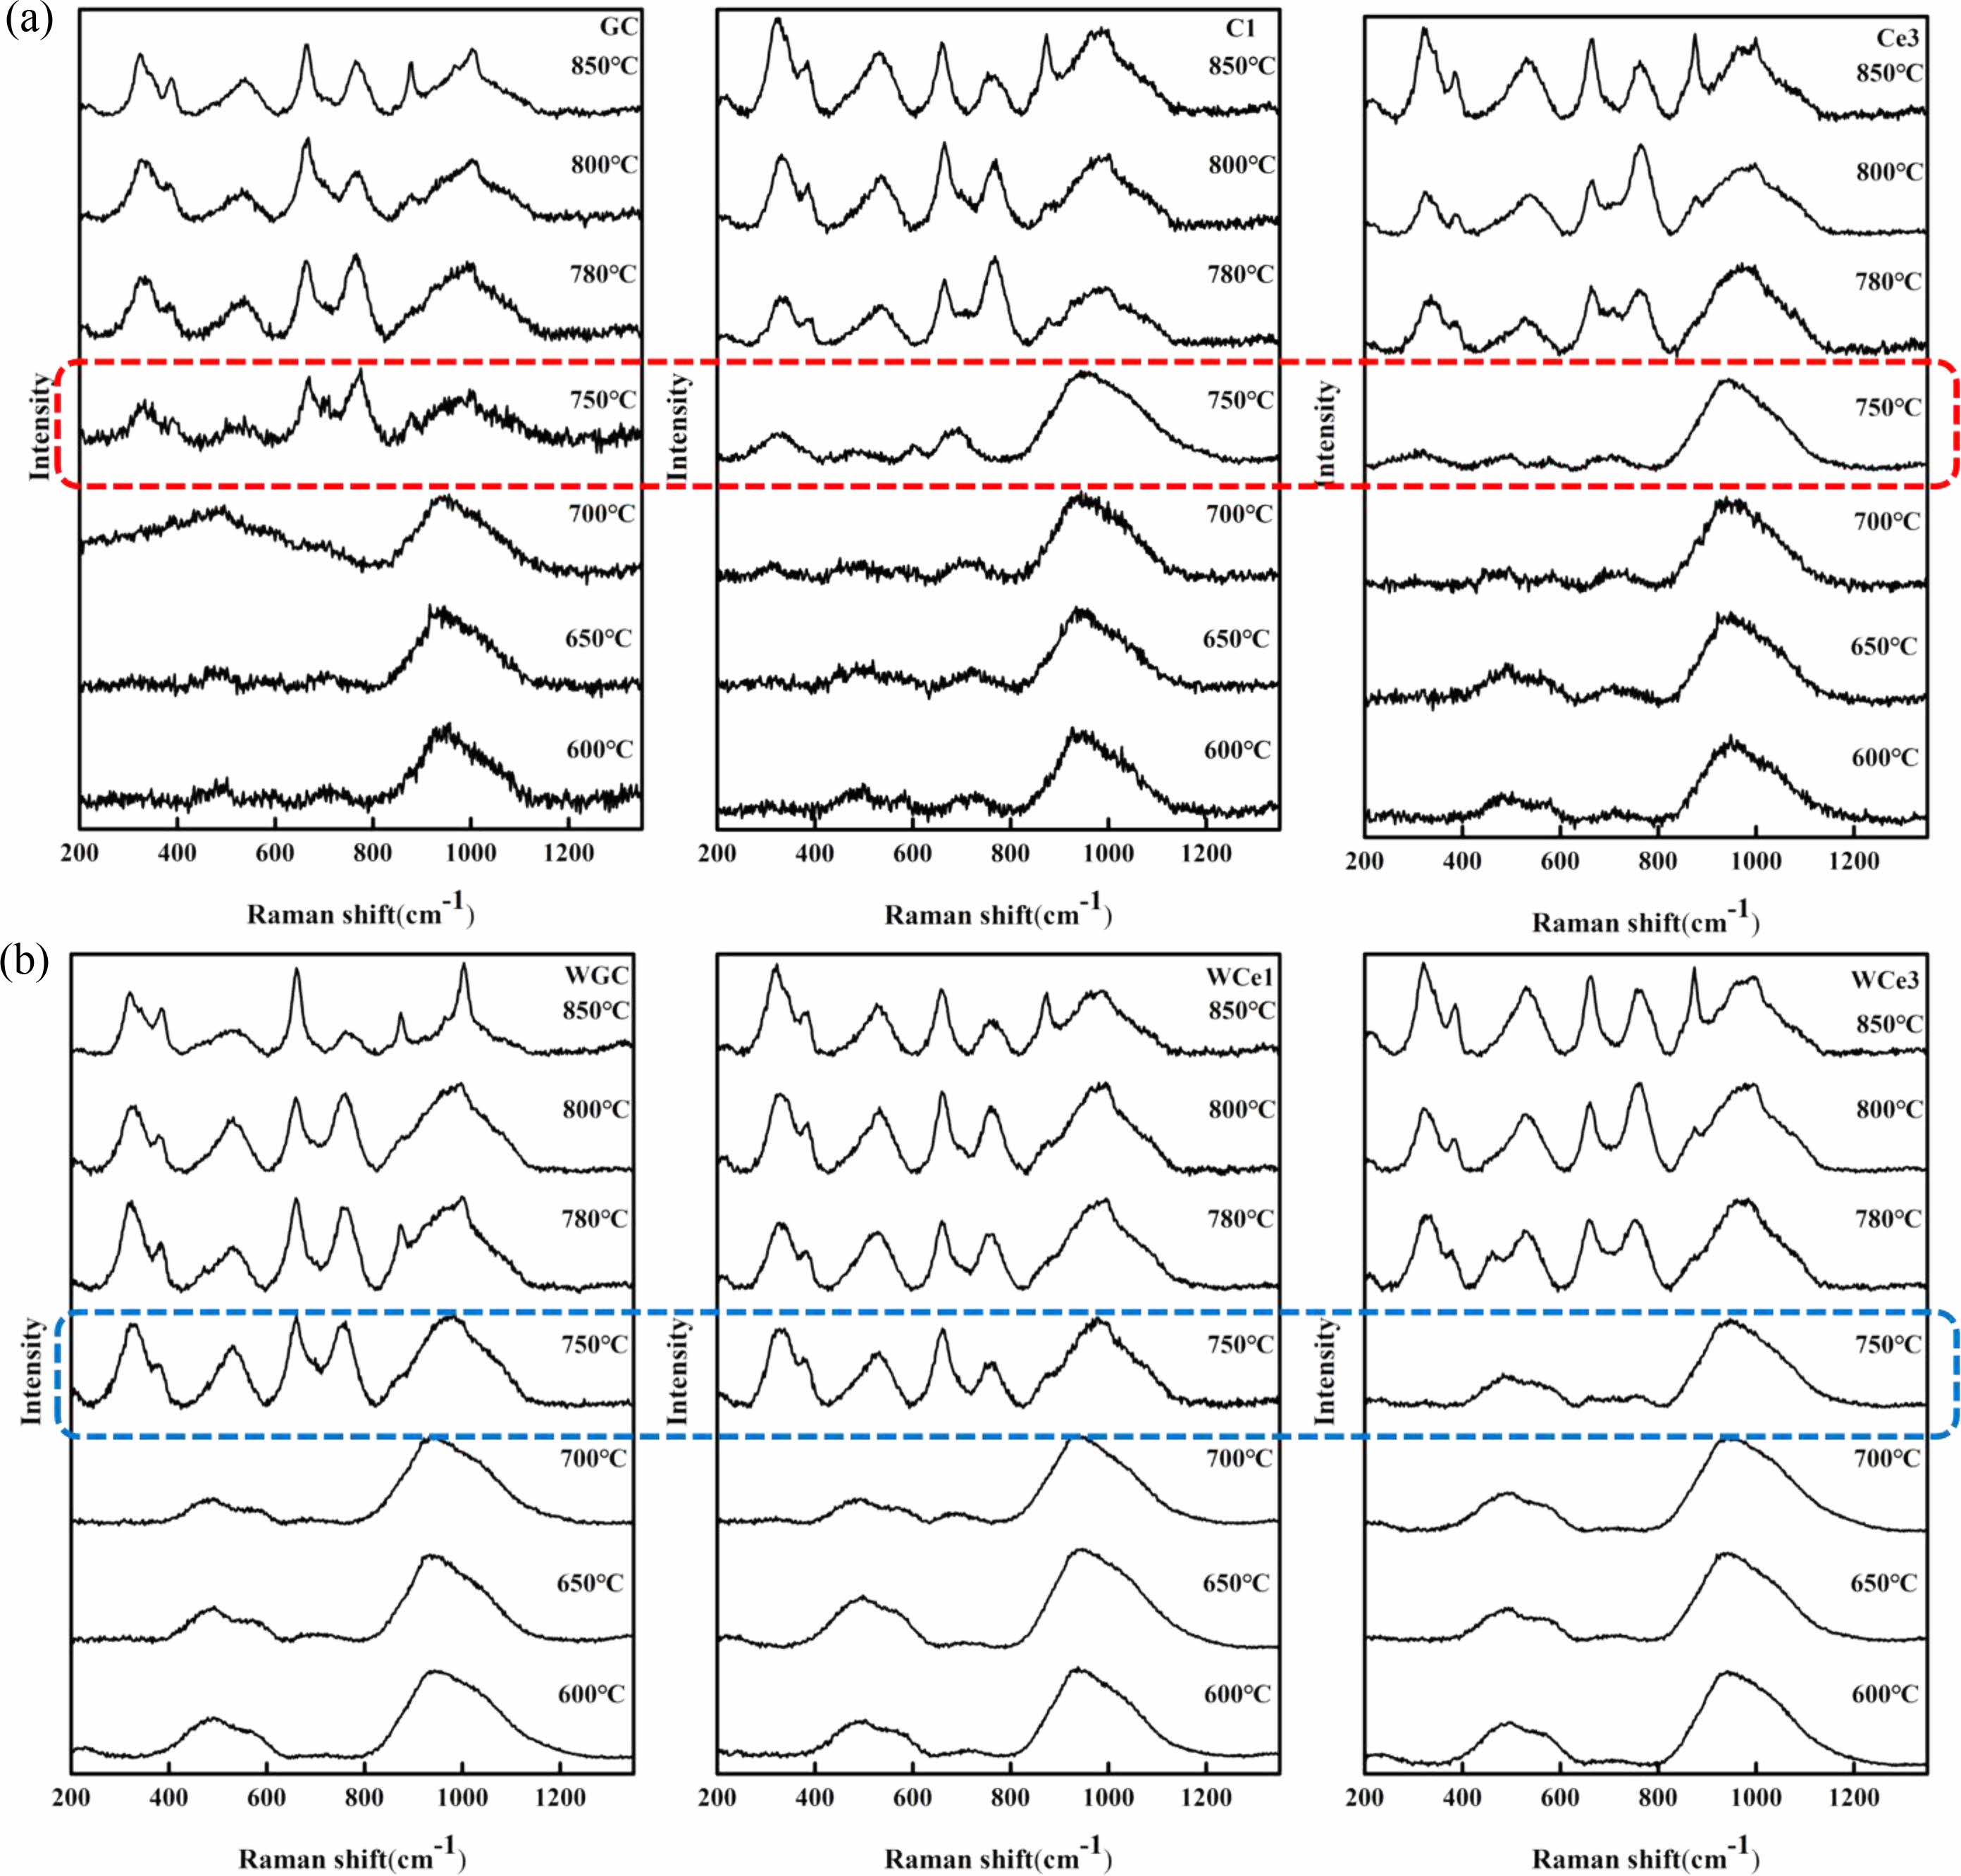
The crystallization of the primary glass must overcome a certain energy barrier to rearrange the ion migration in the glass and then crystallize. The primary glass was cut into small pieces, and the samples were heated to 600 °C, 650 °C, 700 °C, 750 °C, 780 °C, and 800 °C at a heating rate of 3 °C/min for 30 min to obtain their structural characteristics. Fig. 8 shows the Raman spectra of heat-treated samples at different temperatures.
Raman spectroscopy showed that heat treatments below 700 °C failed to crystallize the glass. When the heat treatment temperature was increased to 750 °C, the Si-O structure and the metal ion group were weakly polarized in the glass. Among the samples, the less CeO2 content showed a polarization splitting phenomenon. With the increase in CeO2 content, the crystallization of the glass-ceramics was hindered. It was observed from different samples that glasses preferentially formed Si-Ob with Si(T)O4 structural units in the range of 600~800 cm-1 during phase separation. Further increasing the temperature accelerates the ion diffusion and breaks the original glass network equilibrium state. The free Si-O recombine into a continuous and stable [SiO4] network, and the alkali metal ions become an independent network exosome structure. The experimental phenomenon verifies that high-temperature thermodynamic forces lead to the relaxation of the primary phase structure, generating defects in the glass structure and providing channels for alkali metal ion diffusion. The ion migration drives the glass structure to adjust to form new stable silicate network structural units.
Previous studies, reported that MWH not only enables the crystal growth and distribution in glass-ceramics more uniform, and the microwave effect increase the crystallization kinetics to reduce the reaction temperature and shorten the reaction time [22]. Here, the crystallization kinetics of glass-ceramics were enhanced by microwave irradiation as determined by Raman spectroscopy analysis. The results showed that microwave irradiation (750 °C) resulted in a significant increase in phase separation and accelerated the crystallization rate of the glass-ceramics. Compared with the OH samples, the MWH sample reduces the phase separation temperature of primary glass and promotes crystallization. The non-thermal effect produces a significant activation effect on the primary glass, reducing the sensitivity of crystallization to temperature. Additionally, MW selective heating increased the number of defects in the glass, decreasing the structural stability of the glass. Therefore, compared with the conventional heat treatment, MW heat treatment effectively reduced the Ec of glass-ceramics and promoted diopside crystallization.
Effect of microwave effect on Ce ion migration
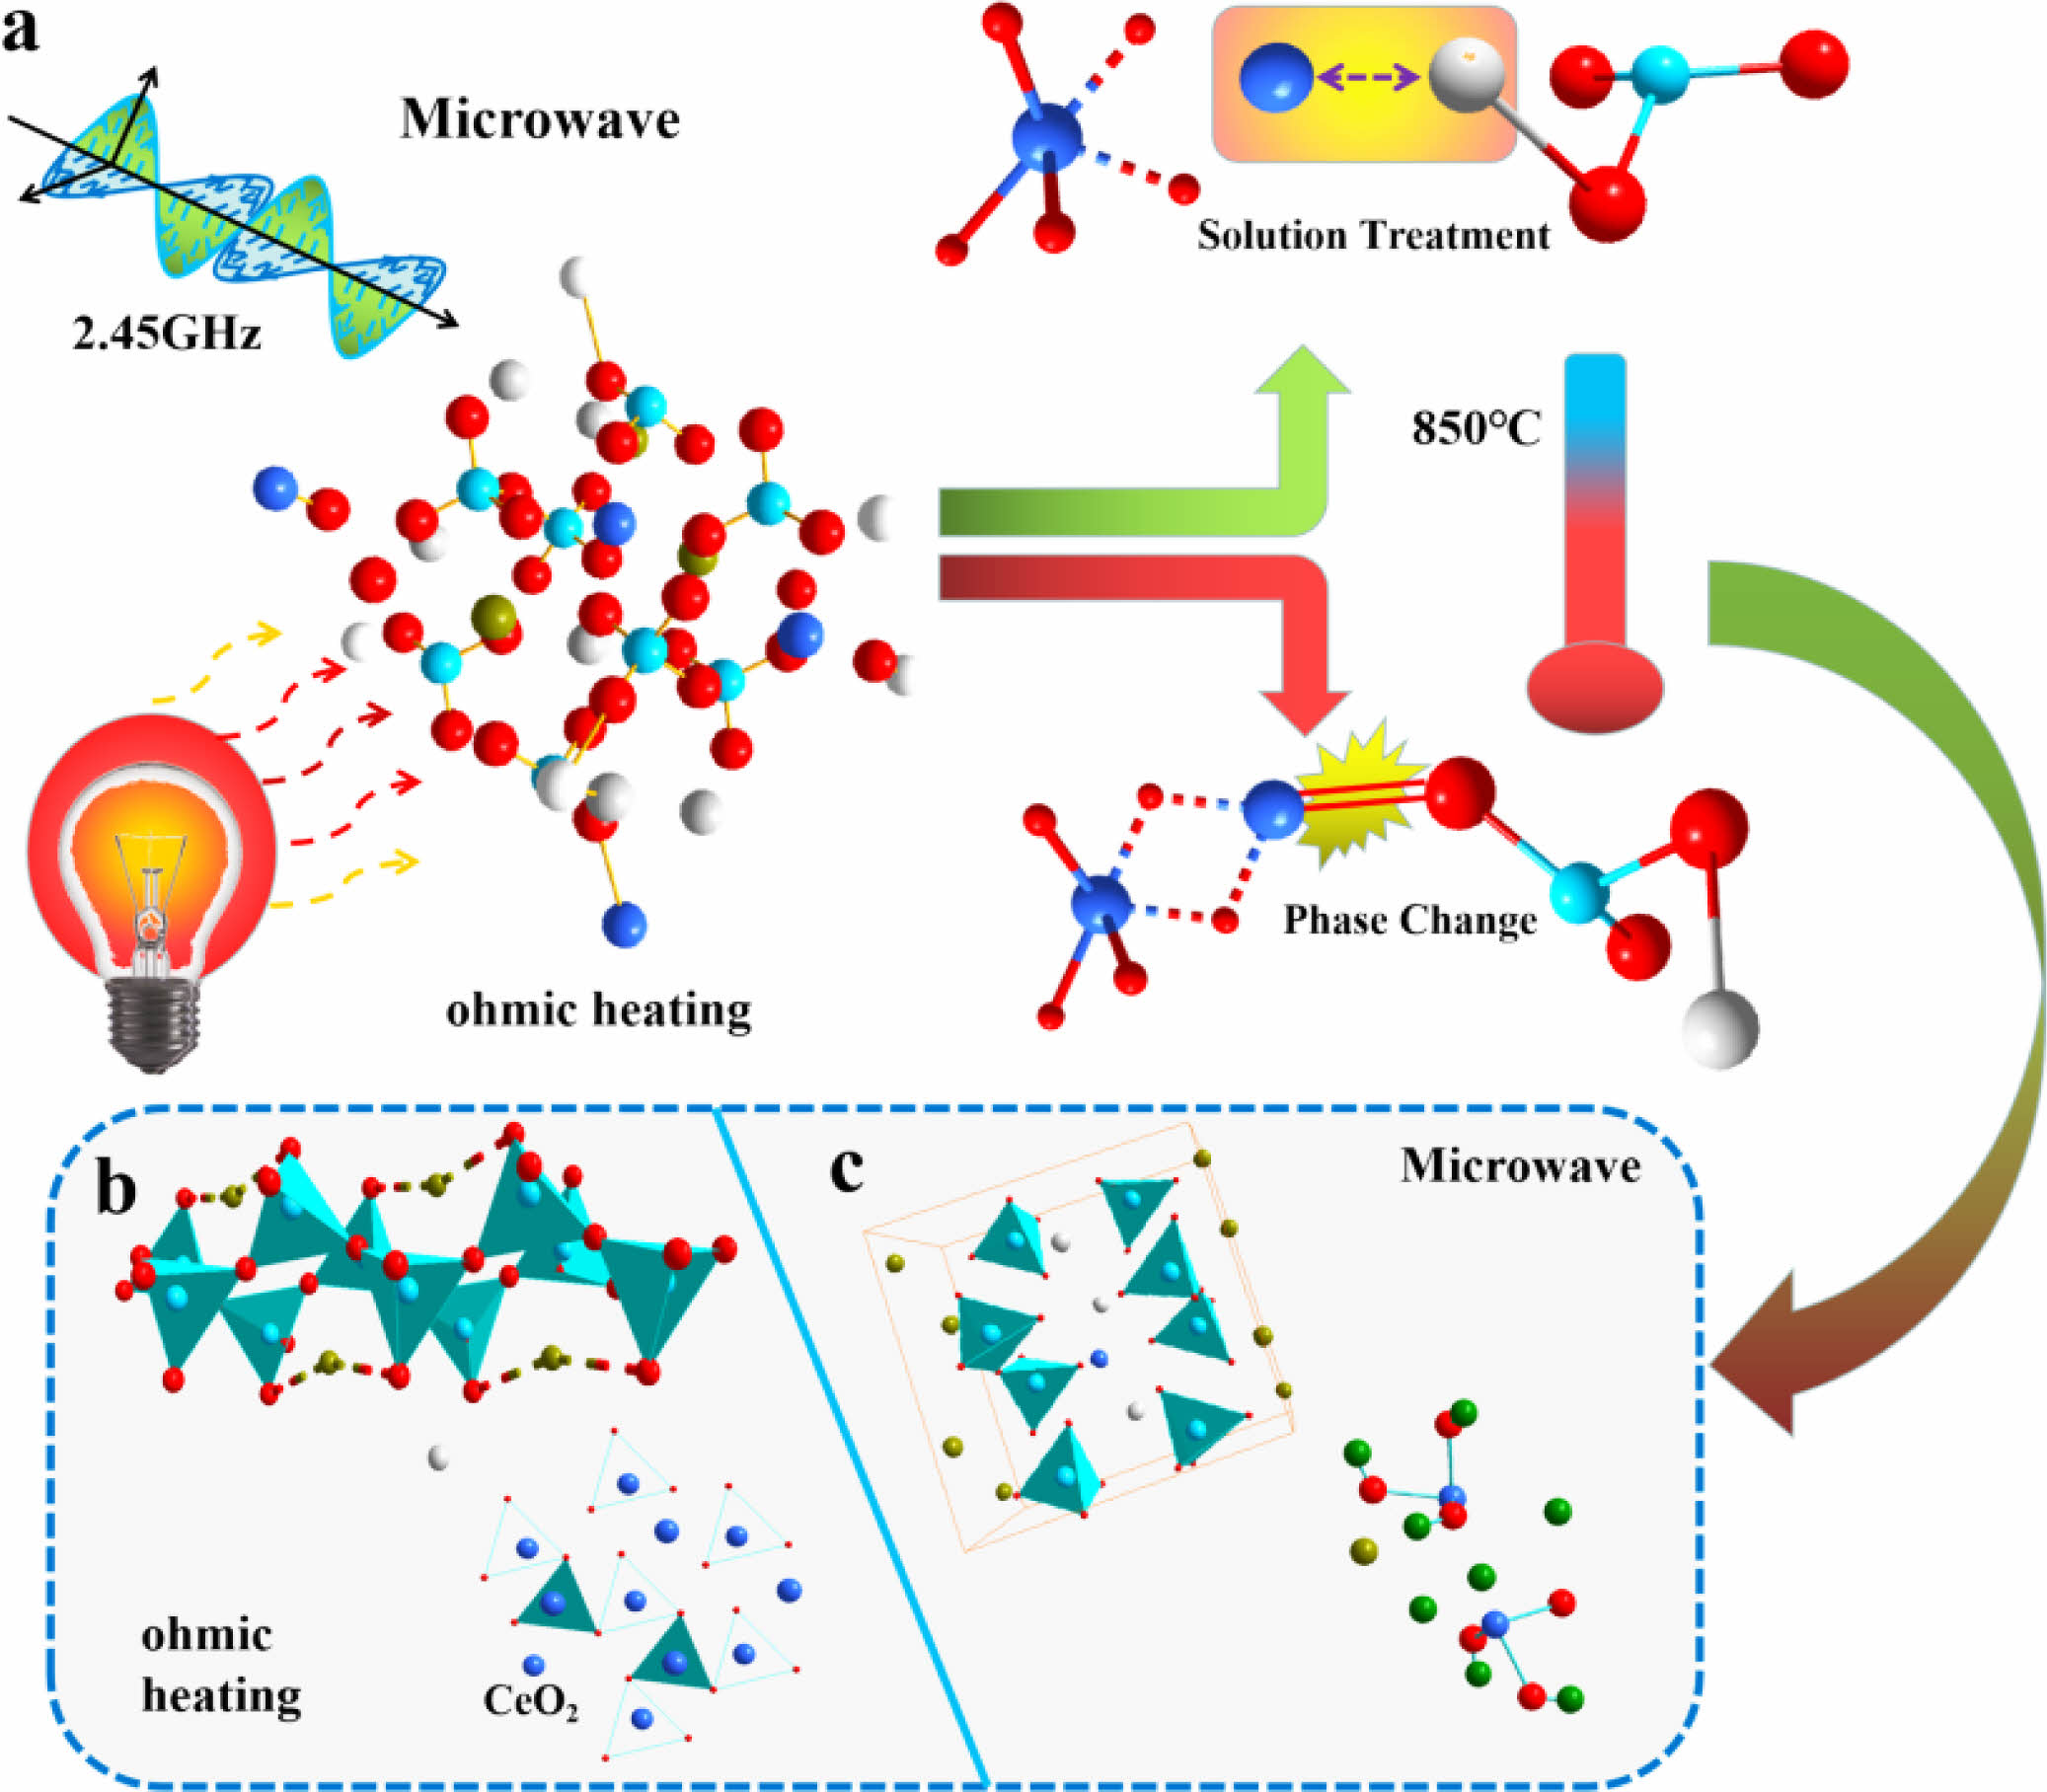
Previous studies, reported that the heat treatment process of glass-ceramics leads to the fact that Ce4+ can be surrounded by [SiO4] structures, forming CeO2-rich aggregates [23, 24]. However, the microwave irradiation heat treatment resulted in a change in the ion migration mode of Ce4+ in the glass-ceramics. Microwave irradiation causes the glass-ceramics to form Q0 at 850 cm-1, and this peak is gradually enhanced with increasing CeO2. This peak is related to the [CeO4] structure, which increases the complexity of the glass structure [39, 40]. Since Ce ions have higher field strength than Si4+ and Al3+ ions, the O2- elements in the pristine [SiO4] are trapped by the Ce4+ ions. The higher-coordination-number Ce4+ ions preferentially bind to the alkali metal ions around the aggregates to maintain electrical neutrality, thus reducing the diffusion rate of atoms in the glass matrix. This phenomenon produces significant energy barriers to diffusion, hindering silicate structural adjustment and inhibiting crystallization.
The migration law model of CeO2 in glass-ceramics was established by the above experimental results, as shown in Fig. 9. Previous studies have identified the [CeO4] and [CeO6] structures as the main forms of rare earth phases [36, 38]. Conventional heat treatment led to CeO2 segregation, which is similar to the results of Du[23]. However, microwave irradiation enhances the negative charge of Ce4+ ions, which combines with alkali metal to form short-range ordered glass clusters Q0. The increase of Q0 content in the glass reduces the degree of polymerization of Q2 and Q3. This structure increases the mass transfer resistance of ions during glass crystallization and hinders the formation of a continuous silica-oxygen network, leading to a decrease in the crystallinity of diopside.
|
Fig. 1 DSC curves of glass-ceramics with different temperature rise rates. |
|
Fig. 2 ln(Tp 2 /α) and 1/Tp of glass with different CeO2 ratios |
|
Fig. 3 Raman spectra of the samples and the deconvolution from 800-1200 cm−1. (a) OH-annealed glass Raman spectra, (b) Raman spectroscopy of MWH-annealed glass, (c) OH sample deconvolution, and (d) MWH sample deconvolution. |
|
Fig. 4 XRD patterns of slag glass-ceramics. (a) Heat treatment process diagram. (b) Macroscopic morphology of glass-ceramics. (c) OH glass-ceramics. (d) MWH glass-ceramics. |
|
Fig. 5 Microscopic morphology and elemental distribution of glass-ceramics. (a) OH samples and (b) MWH samples. |
|
Fig. 6 Raman spectra of different glass-ceramics with 830-1130 cm−1 deconvolution results. |
|
Fig. 7 The content changes of different Qn . (a) Variation of Qn content in OH samples. (b) Variation of Qn content in MWH samples. |
|
Fig. 8 Raman spectra of samples at different temperatures. |
|
Fig. 9 Model diagram of Ce ion migration in the MW and electrothermal fields. |
|
Table 3 ctivation energy (Ec) and Avrami parameter (n) calculated for GC, Ce1%, and Ce3% samples. |
Diopside slag glass-ceramics were prepared using iron tailings and fly ash doped with CeO2. The structural characterization of the conventional heat-treated and microwave irradiation heat-treated glass-ceramics was carried out using XRD, SEM, and Raman spectroscopy techniques.
The addition of CeO2 leads to an increase in the Ec of glass-ceramics from 183.981 to 225.046 KJ·mol−1. The results indicate that Ce ions increase the complexity of the silicate glass and inhibit the crystallization of diopside. Microwave irradiation technology has been successfully applied to the crystallization process of glass-ceramics. Compared with conventional heat-treated samples, microwave irradiation effectively reduces the glass transition temperature, mainly depending on the enhanced crystallization kinetics by microwave non-thermal effects. However, Microwave irradiation enhances the Ce4+ coupling efficiency with [SiO4], which increases the Q0 content in the glass-ceramics and inhibits the crystallization of glass-ceramics. In addition, microwave irradiation resulted in more uniform growth and distribution of diopside. The final results show that the interaction of microwave materials depends on the glass structure, composition and its crystallization characteristics.
This work was supported by the National Natural Science Foundation of China (Grant Nos. 11964025, 11564031), Inner Mongolia Major Basic Research Open Project (Grant No. 0406091701), Inner Mongolia University of Science and Technology Innovation Fund (Grant No. 2019YQL06), Inner Mongolia Autonomous Region Postgraduate Education Innovation Program, (Grant No. BZ2020027).
- 1. K.I. Rybakov, E.A. Olevsky, and E.V. Krikun, J. Am. Ceram. Soc. 96 (2013) 1003-1020.
-

- 2. A.C. Mcmillan, R.J. Lauf, R.S. Garard, Microwave processing of materials, NMAB-473, 1994
- 3. S. Singh, D. Gupta, V. Jain, and A.K. Sharma, Mater. Manuf. Process. 30 (2015) 1-29.
-
- 4. J. Sun, W. Wang, and Q. Yue, Materials 9 (2016) 231.
-
- 5. S. Li, Q. Wang, H. Yu, H. Xu, and Q. Du, J. Ceram. Process. Res. 287 (2017) 126276.
- 6. J. Liu, B. Liang, Y. Ai, J. Zhang, F. He, W. He, and Z. Liu, J. Ceram. Process. Res. 22 (2021) 296-300.
-
- 7. C. Sun, X. Lu, Y. Chen, L. Zuo, and Y. Li, J. Ceram. Process. Res. 22 (2021) 340-344.
-
- 8. C. Sharma, K.L. Singh, A.P. Singh, P. Sharma, S. Mago, V. Naithani, and R.K. Chadha, Mater. Chem. Phys. 240 (2020) 122040.
-
- 9. E.T. Thostenson and T.W. Chou, Composites Part A: Applied Science and Manufacturing 30 (1999) 1055-1071.
-
- 10. M.M. Mahmoud and M. Thumm, J. Eur. Ceram. Soc. 35 (2015) 2915-2922.
-
- 11. Y.V. Bykov, K.I. Rybakov, and V.E. Semenov, Journal of Physics D: Applied Physics 34 (2001) R55-R75.
-
- 12. Z. Li, X. Zhang, G. Ma, R. Muvunyi, and D. Zhang, J. Ceram. Process. Res. 23 (2022) 344-349.
-
- 13. C. Huang and S. Liu, J. Alloy. Compd. 471 (2009) L9-L12.
-
- 14. X. Li, Y. Qiao, J. Shao, C. Bai, H. Li, S. Lu, X. Zhang, K. Yang, and P. Colombo, Ceram. Int. (2022).
-
- 15. S.V. Kapranov and G.A. Kouzaev, Surf. Sci. 667 (2018) 66-78.
-
- 16. K.I. Rybakov, V.E. Semenov, S.A. Freeman, J.H. Booske, and R.F. Cooper, Physical review. B, Condensed matter 55 (1997) 3559-3567.
-
- 17. R. Wroe and A.T. Rowley, J. Mater. Sci. 31 (1996) 2019-2026.
-
- 18. J.H. Booske, R.F. Cooper, and I. Dobson, J. Mater. Res. 7 (1992) 495-501.
-
- 19. Y. Chen, B. Fan, B. Yang, W. Ma, G. Liu, and H. Li, Ceram. Int. 45 (2019) 17675-17680.
-
- 20. H. Li, B. Li, L. Deng, P. Xu, Y. Du, S. Ouyang, and Z. Liu, J. Eur. Ceram. Soc. 39 (2019) 1389-1396.
-
- 21. R. Li, Q. Zhang, X. Peng, and W. Liu, J. Ceram. Process. Res. 21 (2020) 86-91.
-
- 22. S. Ahmad, M.M. Mahmoud, and H.J. Seifert, J. Alloy. Compd. 797 (2019) 45-57.
-
- 23. Y. Du, J. Ma, X. Zhang, H. Zhang, H. Chen, S. Ouyang, and B. Li, J. Ceram. Process. Res. 20 (2019) 401-410.
-
- 24. Y. Du, J. Ma, Y. Shi, X. Zhang, H. Zhang, H. Chen, S. Ouyang, and B. Li, J. Non-Cryst. Solids 532 (2020) 119880.
-
- 25. H. Zhang, Y. Du, X. Yang, X. Zhang, M. Zhao, H. Chen, S. Ouyang, and B. Li, J. Non-Cryst. Solids 482 (2018) 105-115.
-
- 26. B. Li, H. Li, X. Zhang, X. Jia, and Z. Sun, International Journal of Minerals, Metallurgy, and Materials 22 (2015) 1342-1349.
-
- 27. L. Deng, W. Lu, Z. Zhang, Z. Fu, H. Li, H. Chen, Y. Du, Y. Ma, and W. Wang, Mater. Chem. Phys. 261 (2021) 124249.
-
- 28. L. Deng, B. Yao, W. Lu, M. Zhang, H. Li, H. Chen, M. Zhao, Y. Du, M. Zhang, Y. Ma, and W. Wang, J. Non-Cryst. Solids 593 (2022) 121770.
-
- 29. G. Wang, Y. Du, J. Ma, H. Zhang, S. Ouyang, L. Deng, H. Chen, and M. Zhao, J. Ceram. Process. Res. 22 (2021) 665-674.
-
- 30. J.A. Augis and J.E. Bennett, Journal of Thermal Analysis 13 (1978) 283-292.
-
- 31. H.E. Kissinger, Journal of Research of the National Bureauof Standards 57 (1956) 2712.
-
- 32. J. Jiusti, D.R. Cassar, and E.D. Zanotto, Int. J. Appl. Glass Sci. 11 (2020) 612-621.
-
- 33. M. Wang, J. Cheng, M. Li, and F. He, Physica B: Condensed Matter 406 (2011) 3865-3869.
-
- 34. Y. Zhang, H. Li, S. Liu, N. Wu, and S. Ouyang, J. Non-Cryst. Solids 563 (2021) 120701.
-
- 35. B. Mysen, Eur. J. Mineral. 15 (2003) 781-802.
-
- 36. J. Qi, C. Liu, C. Zhang, and M. Jiang, Metallurgical and Materials Transactions B 48 (2017) 11-16.
-
- 37. J. Qi, C. Liu, C. Li, and M. Jiang, J. Rare Earth. 34 (2016) 328-335.
-
- 38. W. Guo, Z. Wang, Z. Zhao, Z. An, and W. Wang, J. Non-Cryst. Solids 540 (2020) 120085.
-
- 39. C. Schilling, A. Hofmann, C. Hess, and M.V. Ganduglia-Pirovano, The Journal of Physical Chemistry C 121 (2017) 20834-20849.
-
- 40. Y. Shi, X. Song, X. Han, M. Zhang, and M. Dong, Advanced Composites and Hybrid Materials 4 (2021) 614-628.
-
- 41. B.J.A. Moulton, A. Picinin, L.D. Silva, C. Doerenkamp, H. Lozano, D. Sampaio, E.D. Zanotto, J. Du, H. Eckert, and P.S. Pizani, J. Non-Cryst. Solids 583 (2022) 121477.
-
- 42. B.O. Mysen, D. Virgo, and C.M. Scarfe, Am. Mineral. (1980) 690-710.
- 43. P. Mcmillan, The American Mineralogist 69 (1984) 622-644.
- 44. Q. Li, J. Gao, Y. Zhang, Z. An, and Z. Guo, Metallurgical and Materials Transactions B 48 (2017) 346-356.
-
 This Article
-
2023; 24(3): 512-524
Published on Jun 30, 2023
- 10.36410/jcpr.2023.24.3.512
- Received on Feb 10, 2023
- Revised on Mar 16, 2023
- Accepted on Mar 20, 2023
Services
- Abstract
introduction
experimental method
results and discussion
conclusion
- Acknowledgements
- References
- Full Text PDF
Shared
Correspondence to
- Shunli Ouyang
-
Guangzhou Maritime University, Guangzhou 510725, China
Tel : 13847267569 - E-mail: ouyangshunli01@163.com
Clean-Energy Research Institute(CRI), Hanyang University, 222, Wangsimni-ro, Seongdong-gu, Seoul, 04763, Korea
E-mail: jcpr@hanyang.ac.kr