


- Response surface methodology optimization of pulse electrodeposited Ni- nano SiC coatings on Al 7075 substrate
S. Sankar Ganesha,* and A. Jeganb
aDepartment of Mechanical Engineering, Government College of Engineering, Tirunelveli–627007, Tamilnadu, India
bDepartment of Mechanical Engineering, AVS College of Technology, Salem – 636 106, Tamilnadu, IndiaThis article is an open access article distributed under the terms of the Creative Commons Attribution Non-Commercial License (http://creativecommons.org/licenses/by-nc/4.0) which permits unrestricted non-commercial use, distribution, and reproduction in any medium, provided the original work is properly cited.
In this research work, Ni- nano SiC coating was pulse electrodeposited on Al 7075 substrate in a watt’s bath. A 3-level, 3-factor central composite design (CCD) of experiments were carried out to assess the influence of pulse plating parameters, i.e., Current Density (A/cm2), Duty Cycle (%), Frequency (Hz) on the microhardness of Ni-SiC coating. A regression model is developed to predict the microhardness of the developed coating using design expert software and optimal parameters for achieving maximum microhardness were found out. The morphology of the nano SiC coating was investigated using FESEM coupled with EDAX, and X-ray diffractometer. Corrosion studies were carried out using Potentiometric polarization and Electrochemical Impedance tests, and the corrosion results show that corrosion potential for the aluminium alloy is -0.92 V and for the Ni- nano SiC coating it increases to -0.65 V. Tafel and Nyquist plots reveal the improved corrosion characteristics of the pulse plated Ni-SiC coating. Significant improvement in the microhardness of the coating is achieved with a maximum hardness of 329.6 HV. Results show that about 3 time’s enhancement in the microhardness obtained with the Ni-SiC nano composite coating, when compared to the Al7075 substrate
Keywords: AL 7075, Ni-SiC nano composite coating, Microhardness, Corrosion resistance, Pulse electrodeposition
Al 7075 aluminium alloys were mostly employed as structural materials in the automobile and aircraft industry due to their established manufacturing techniques, high strength to weight ratio, lightweight, and affordable price compared to other metals and composites [1]. However, these alloys are prone to corrosion because of their chemical composition. Corrosion significantly reduces the life expectancy of these structures, therefore increased corrosion resistance is needed for future applications of Al7075 alloy [2].
Protective coatings were widely used to shield the surfaces of metals and alloys from damage caused by the environment. Surface properties such as wear, oxidation, and corrosion can be enhanced by surface modification with coatings. To perform the surface modification, the desired material is deposited on the substrate using a variety of procedures such as PVD, CVD, electrodeposition, and thermal spray techniques [3, 4]. One of the efficient processes for developing composite coating is electro-deposition. It is of great interest because of its cost effectiveness and huge production potential [5].
Pulse electrodeposition offers better properties far better than Direct Current (DC) plating by favoring grain nuclei initiation and creating finer grains than DC Plating, this results in the improvement of surface properties such as microhardness, wear, and corrosion resistance. In Pulse electrodeposition, the output is periodically switched off, this will discharge the negatively charged layer formed around the cathode and facilitates the ions to reach the cathode resulting in more uniform deposition [6]. Nanoparticle reinforced composite coatings developed by pulse electrodeposition shows superior surface properties than conventional coatings. Composites with Ni matrix and dispersion of nanoparticles show a significant improvement in mechanical properties compared to micro particles because of the hardening effect [7]. Ceramic particles of oxides (Al2O3, SiO2, TiO2), Carbides (SiC, WC, TiC), and Nitrides (Si3N4) are having good corrosion resistance and hardness, Presence of these particles in the coatings in the form of nanocrystals increases mechanical and corrosive properties of the bare metal to a greater extent [8-10]. Silicon Carbide nanoparticles are extensively used by many researchers in coatings because of their qualities like resistance to oxidation, good wear, and corrosion resistance [11].
Zimmerman et al. [12] showed that the tensile strength and yield strength of the nanocomposite Ni-SiC increased by four times and five times correspondingly than the conventional nickel deposit. A comparison of micro SiC and Nano SiC composites in nickel matrix on steel was carried out by Narasimman et al. [13] and found that higher scratch resistance and lower wear loss can be attained by nano SiC particles.
Hajiali fini et al. [14] studied the wear and corrosion properties of Ni-SiC nanocoatings in magnesium alloy and found that SiC nanoparticles dispersed throughout the nickel matrix prevent the corrosion progress. The corrosion potential increases from -1.6 V to -0.31V and an increase of 600% in microhardness (74 HV for the base metal and 523 HV for Ni-SiC coated sample) was achieved with the SiC nanoparticles. Komai et al. [15] investigated the tensile and fatigue fracture behavior of SiC whisker Al 7075 composites and reported that the mechanical behavior and the fatigue cracking behavior of SiC/Al7075 composites was superior to the base material. Pao-chang Huang et al. [16] studied electrodeposition of Ni-SiC coatings on A356 aluminium alloy and found that hardness of the coated sample improved to 538 HV and has a low coefficient of friction and wear. Studies conducted by veeresh kumar et al. [17] reported that the SiC significantly contributed for the increased wear resistance of Al 6061 alloy and Al 6061 – SiC composites exhibits superior mechanical properties.
The effect of pulse plating parameters was analyzed by Ashutosh Sharma et al. [18] revealing that duty cycle, frequency, and current density contributed more than other parameters such as PH, and bath temperature which results in better grain size distribution. Higher hardness values were observed at low frequency and low duty cycle because of the intra-crystalline embedding mechanism of the nanoparticle and the worsening of the preferred [1 0 0] textural perfection [19, 20]. Jegan et al. [21] conducted experiments on steel with Ni-Al2O3 nano coatings and found out that a maximum hardness of 370 HV is reached at the optimum conditions. Joshua et al. [22] conducted optimization of Ni-TiO2 coatings on Inconel and found a remarkable improvement in microhardness up to 474 HV was achieved with 50 HZ, 30% duty cycle, and 0.4 A/cm2.
The inclusion of nanoparticles on 7075 alloy shows that substantial improvement in tensile strength, impact energy, and hardness [24]. Pradeep Devaneyan et al. [25] performed electro co-deposition on Al 7075 alloy with micro SiC particles (2 to 3 microns) in the nickel matrix and found that the deposition of SiC particles increases with an increase in SiC concentration up to 15 g/l, and reduces with further increase in SiC content.
Response Surface Methodology (RSM) is a popular statistical method for optimization of the response in which the response is affected by various input variables [26-28]. RSM investigation for the material removal rate and surface roughness of Al6061 aluminium alloy was carried out by mukesh kumar et al. [29] and the predicted model showed minimum error percentage with the experiment results. Pridhar et al. [30] conducted response surface optimization of aluminium hybrid composite and successfully developed numerical model to predict wear and coefficient of friction of the coating. Optimization of Ni-Al2O3 on aluminium alloy was carried out by Raghavendra et al. [31] using RSM and evaluated the optimal coating parameters to get maximum coating thickness and hardness. Natarajan et al. [32] developed an empirical relationship of pulse electrodeposition parameters for Ni/SiC nanocoatings on steel using RSM and found that the duty cycle dominates the rest of the parameters. Microhardness of SiC coating was successfully predicted by the developed empirical model.
From the past research works, it is clear that the addition of micro SiC and nano SiC particles [33, 34] as a metal matrix composite increases the surface properties of 7075 alloy to a greater extent. Minimum research has been carried out on the influence of pulse parameters on the deposition of Ni-nano SiC particles over Al 7075 alloy. In this study Ni-nano SiC particles were pulse electrodeposited on Al7075 alloy and the effect of Pulse electrodeposition parameters (frequency, duty cycle and current density) on the microhardness of the substrate will be analyzed using response surface methodology. Analysis of Variance (ANOVA) has been carried out to ascertain the impact of the process variables on the response. An empirical model is developed to get the optimum parameters. Surface characterization using FESEM coupled with EDAX, and XRD techniques were used to ascertain the quality of the coating. Potentiometric polarization and Electrochemical impedance spectroscopy tests were also carried out to study the enhancement of the corrosion resistance.
Materials and Methods
Aluminium 7075 alloy specimen with the size of 30 mm × ɸ10 mm is used as a substrate, and a Nickel plate (100 × 30 × 10 mm) of 99.9% purity is used as anode in this study. The chemical composition of the Al7075 alloy is shown in Table 1. Silicon carbide nanoparticle (supplied by Reinste Nano venture Pvt Ltd.) of size less than 100 nm is used for nano-coating.
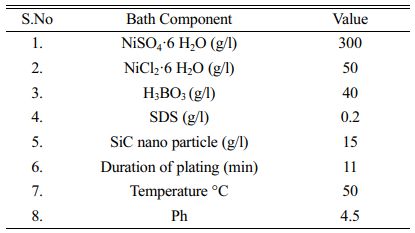
Experiments were conducted with Dynatronix Microstar pulse series DPR 20-30-100 Power supply. Pulse electro deposition of Ni-SiC nano composite coating is carried out in a 1000 ml beaker containing a watt’s bath with an electrode gap of 60 mm. Electrode gap influences the current density and this affects the coating thickness, higher electrode gap leads to higher resistance and high current consumption, previous studies show that an optimum electrode gap of 60 mm results in maximum coating thickness [35]. The electrolyte bath is prepared by adding silicon carbide nano powder and SDS to the watt’s solution and stirred continuously for 15 hours to ensure uniform mixing of nanoparticles. The composition of the bath is given in Table 2.
Al 7075 samples were polished with silicon carbide abrasive paper of different grades up to 2000 grade and then, the samples were ultrasonically cleaned with acetone for 15 minutes followed by rinsing in distilled water. Then the samples are immersed in the zincating bath (ZnO 100 g/l, NaOH 525 g/l, FeCl3 10 g/l, and C4H4Na2O6 1 g/l) for 10 minutes for zinc pretreatment and again rinsed with distilled water before electroplating. Ni-SiC nano coating is pulse electrodeposited on the aluminium substrate over a surface area of 78.5 mm2 on the top surface of the sample for 11minutes at a stirring speed of 450 rpm.
Field emission scanning electron microscopy is used to investigate the surface morphology of the deposited Ni-SiC coatings (FESEM Zeiss) and the elemental composition of the coating was examined by EDAX. XRD analysis is performed with a mini flex X-ray diffractometer with Cu-Ka radiation to ascertain the crystalline orientation of the coating. Vickers microhardness test is conducted at a load of 10 kg using a microhardness tester (Mitutoyo HM -220) for 15 s. Corrosion tests were carried out in 3.5% NaCl solution using a multichannel electrochemical workstation (Auto lab).
Design of experiments
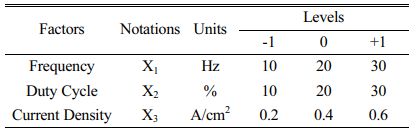
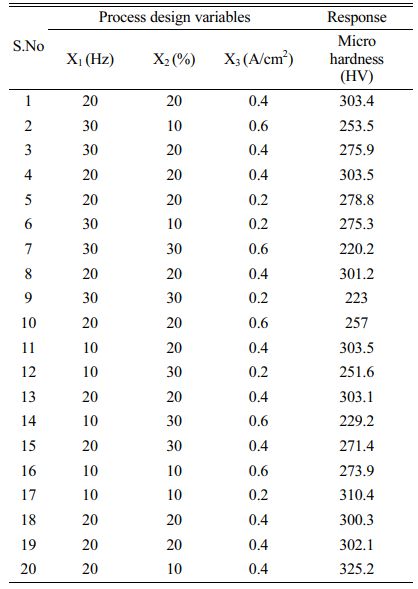
Face Centered Central Composite Design (FCCCD) of RSM was adopted to explore the effect of process variables on the microhardness of the Ni-SiC coating. Gyftou et al. [19] and Pavlatou et al. [20], reported that higher microhardness value achieved at lower frequencies and lower duty cycle and Vaezi et al. [36] found that at lower current densities more SiC nano particles were deposited, which increases the microhardness of the coating. Based on these studies, the following range of input variables has been selected, Frequency (10 Hz-30 Hz), duty cycle (10%-30%), and current density (0.2 A/cm2 -0.6 A/cm2). A three-level, three-factor optimization study has been designed by the Design Expert software, as shown in Table 3. The design of experiments with the recorded responses is listed in Table 4.

Optimization of the process parameters for maximum micro hardness
The process parameters are optimized by design expert software to obtain the maximum hardness. ANOVA has been carried out to check the significance of the developed model. The ANOVA values listed in Table 5. has a value of F > 1 and P < 0.005, which shows that the model is statistically significant and the R2 value (0.9977) is close to 1 revealing the goodness of fit. The predicted R2 is very close to the adjusted R2 value and the lack of fit is not significant. From the ANOVA results, it is found that the percentage of contribution of duty cycle is 32.80%, frequency is 8.1% and current density is 6.16%. Duty cycle dominates over the rest of the parameters in determining microhardness of the coating.
From the analysis, quadratic empirical model is developed for determining micro hardness in terms of Frequency (X1), Duty cycle (X2) and Current density (X3) is shown in Eq. (1)

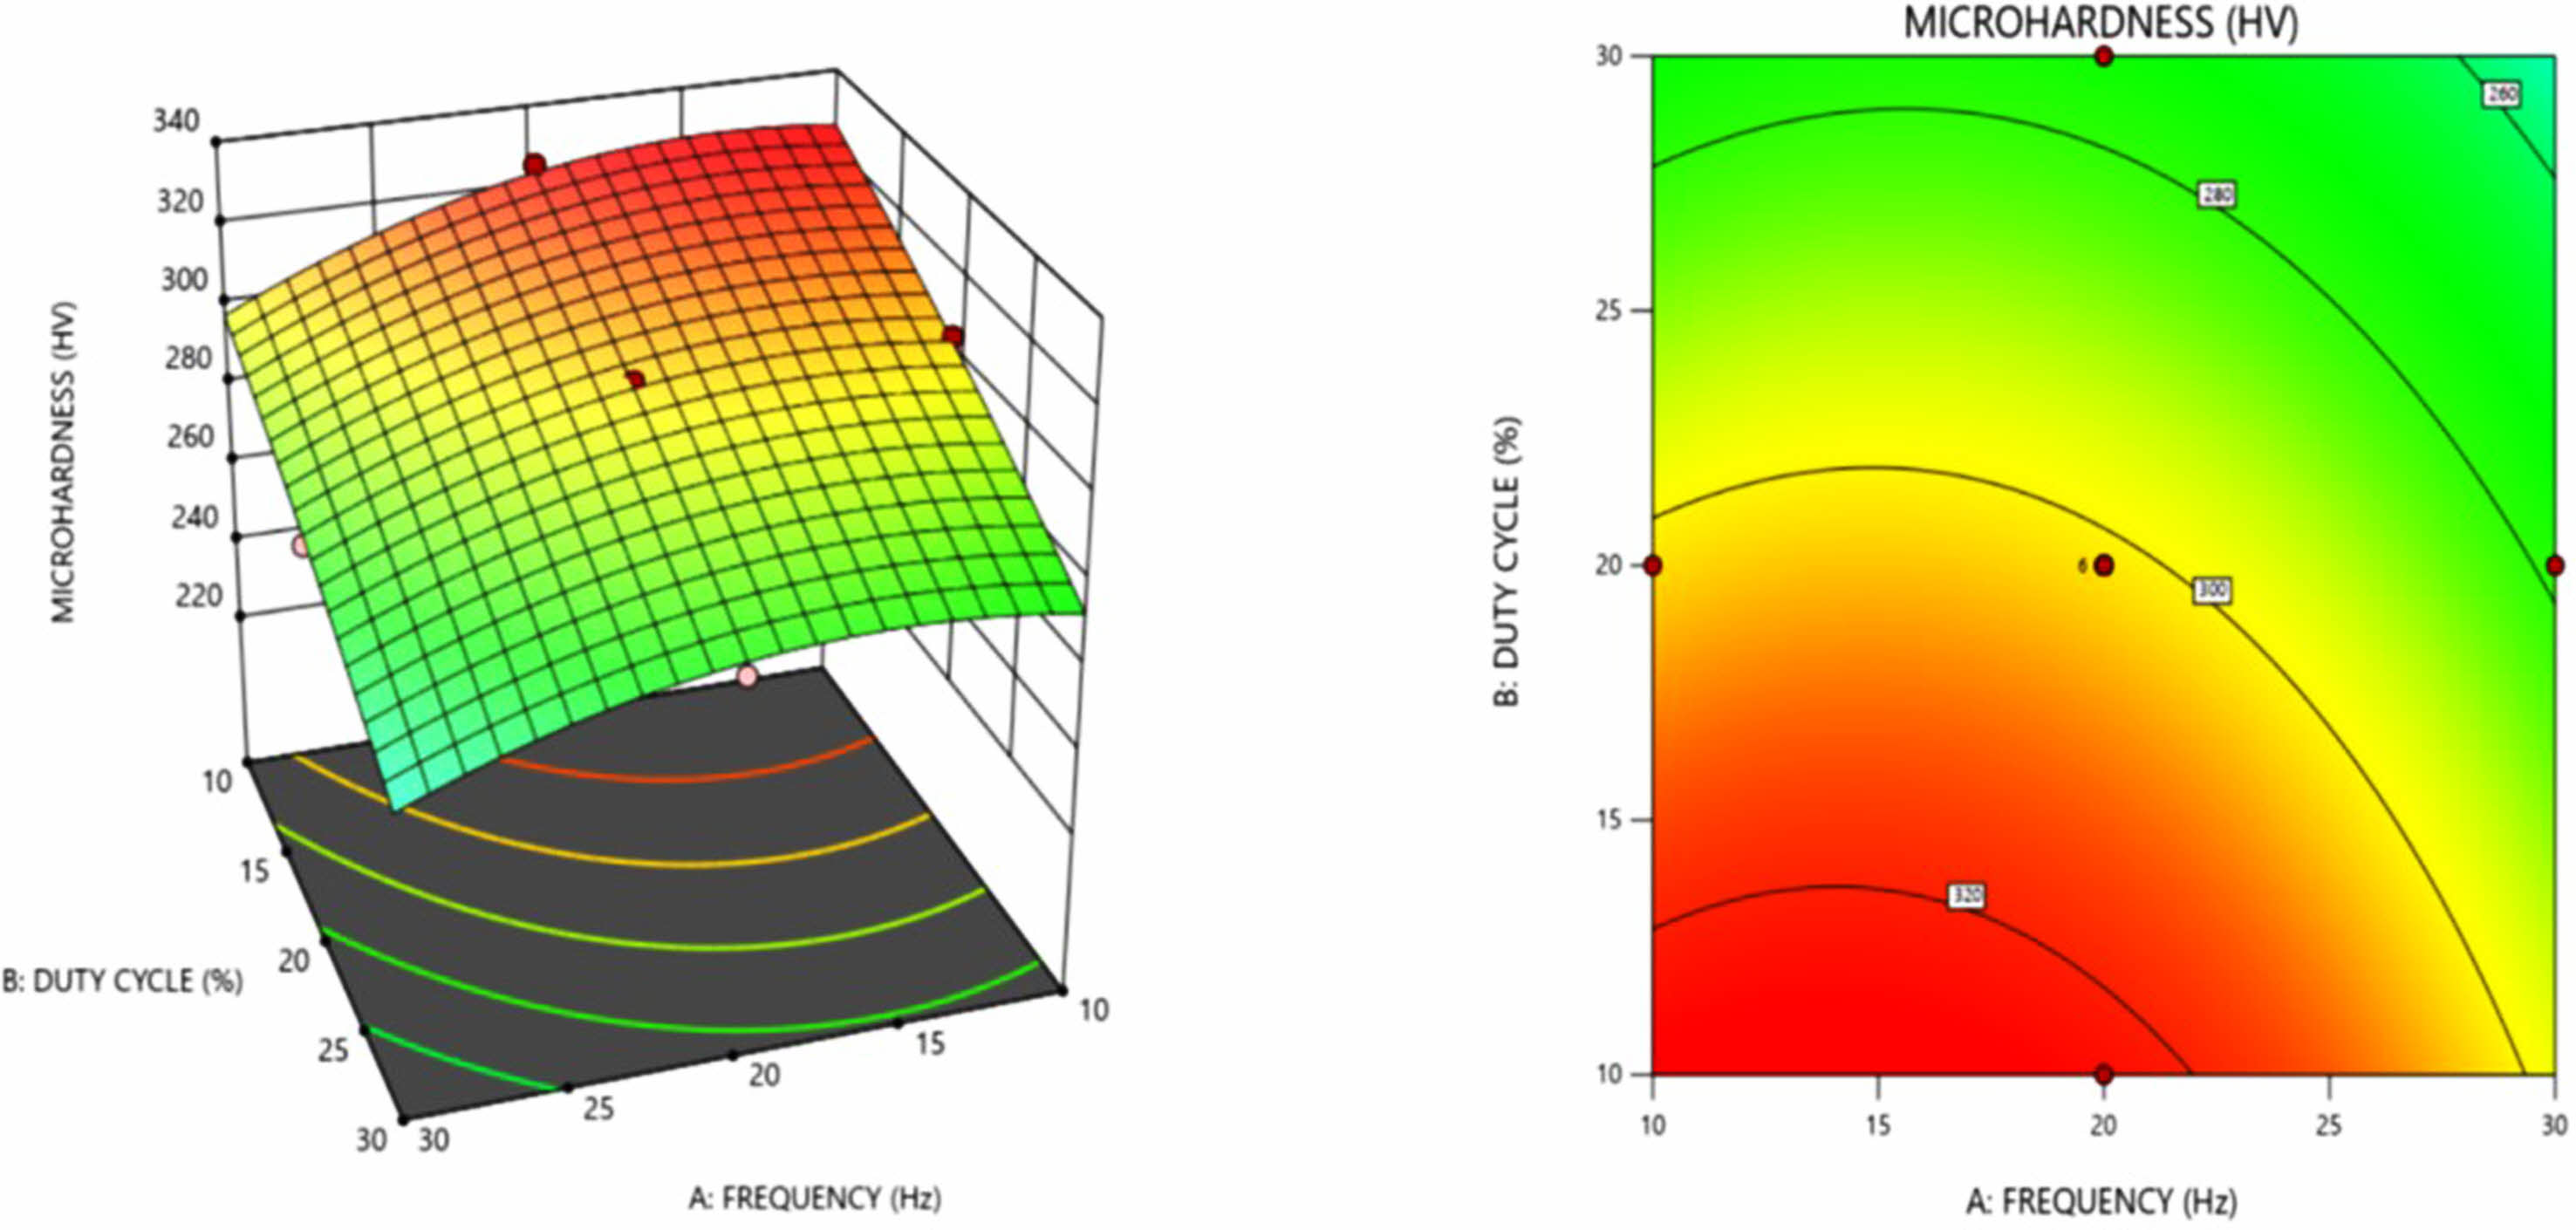
Fig. 1 shows the 3D response and contour plot for micro hardness in terms of frequency and duty cycle. It is evident from the Fig. 1 that higher micro hardness value occurs at lower frequency and lower duty cycle, these results are in agreement with the observations of Gyftou et al. [19] and Pavlatov et al. [20]. Increase in the duty cycle produces wider pulses which favors the transportation of the nickel ions towards the cathode. However, this reduces the absorption of the silicon carbide nano particle on cathode, resulting in lower hardness values at higher duty cycle. Also at higher duty cycle, the shorter off time affects the replenishment of the silicon carbide nano particles near cathode results in reduced absorption of SiC nano particle at cathode [23].
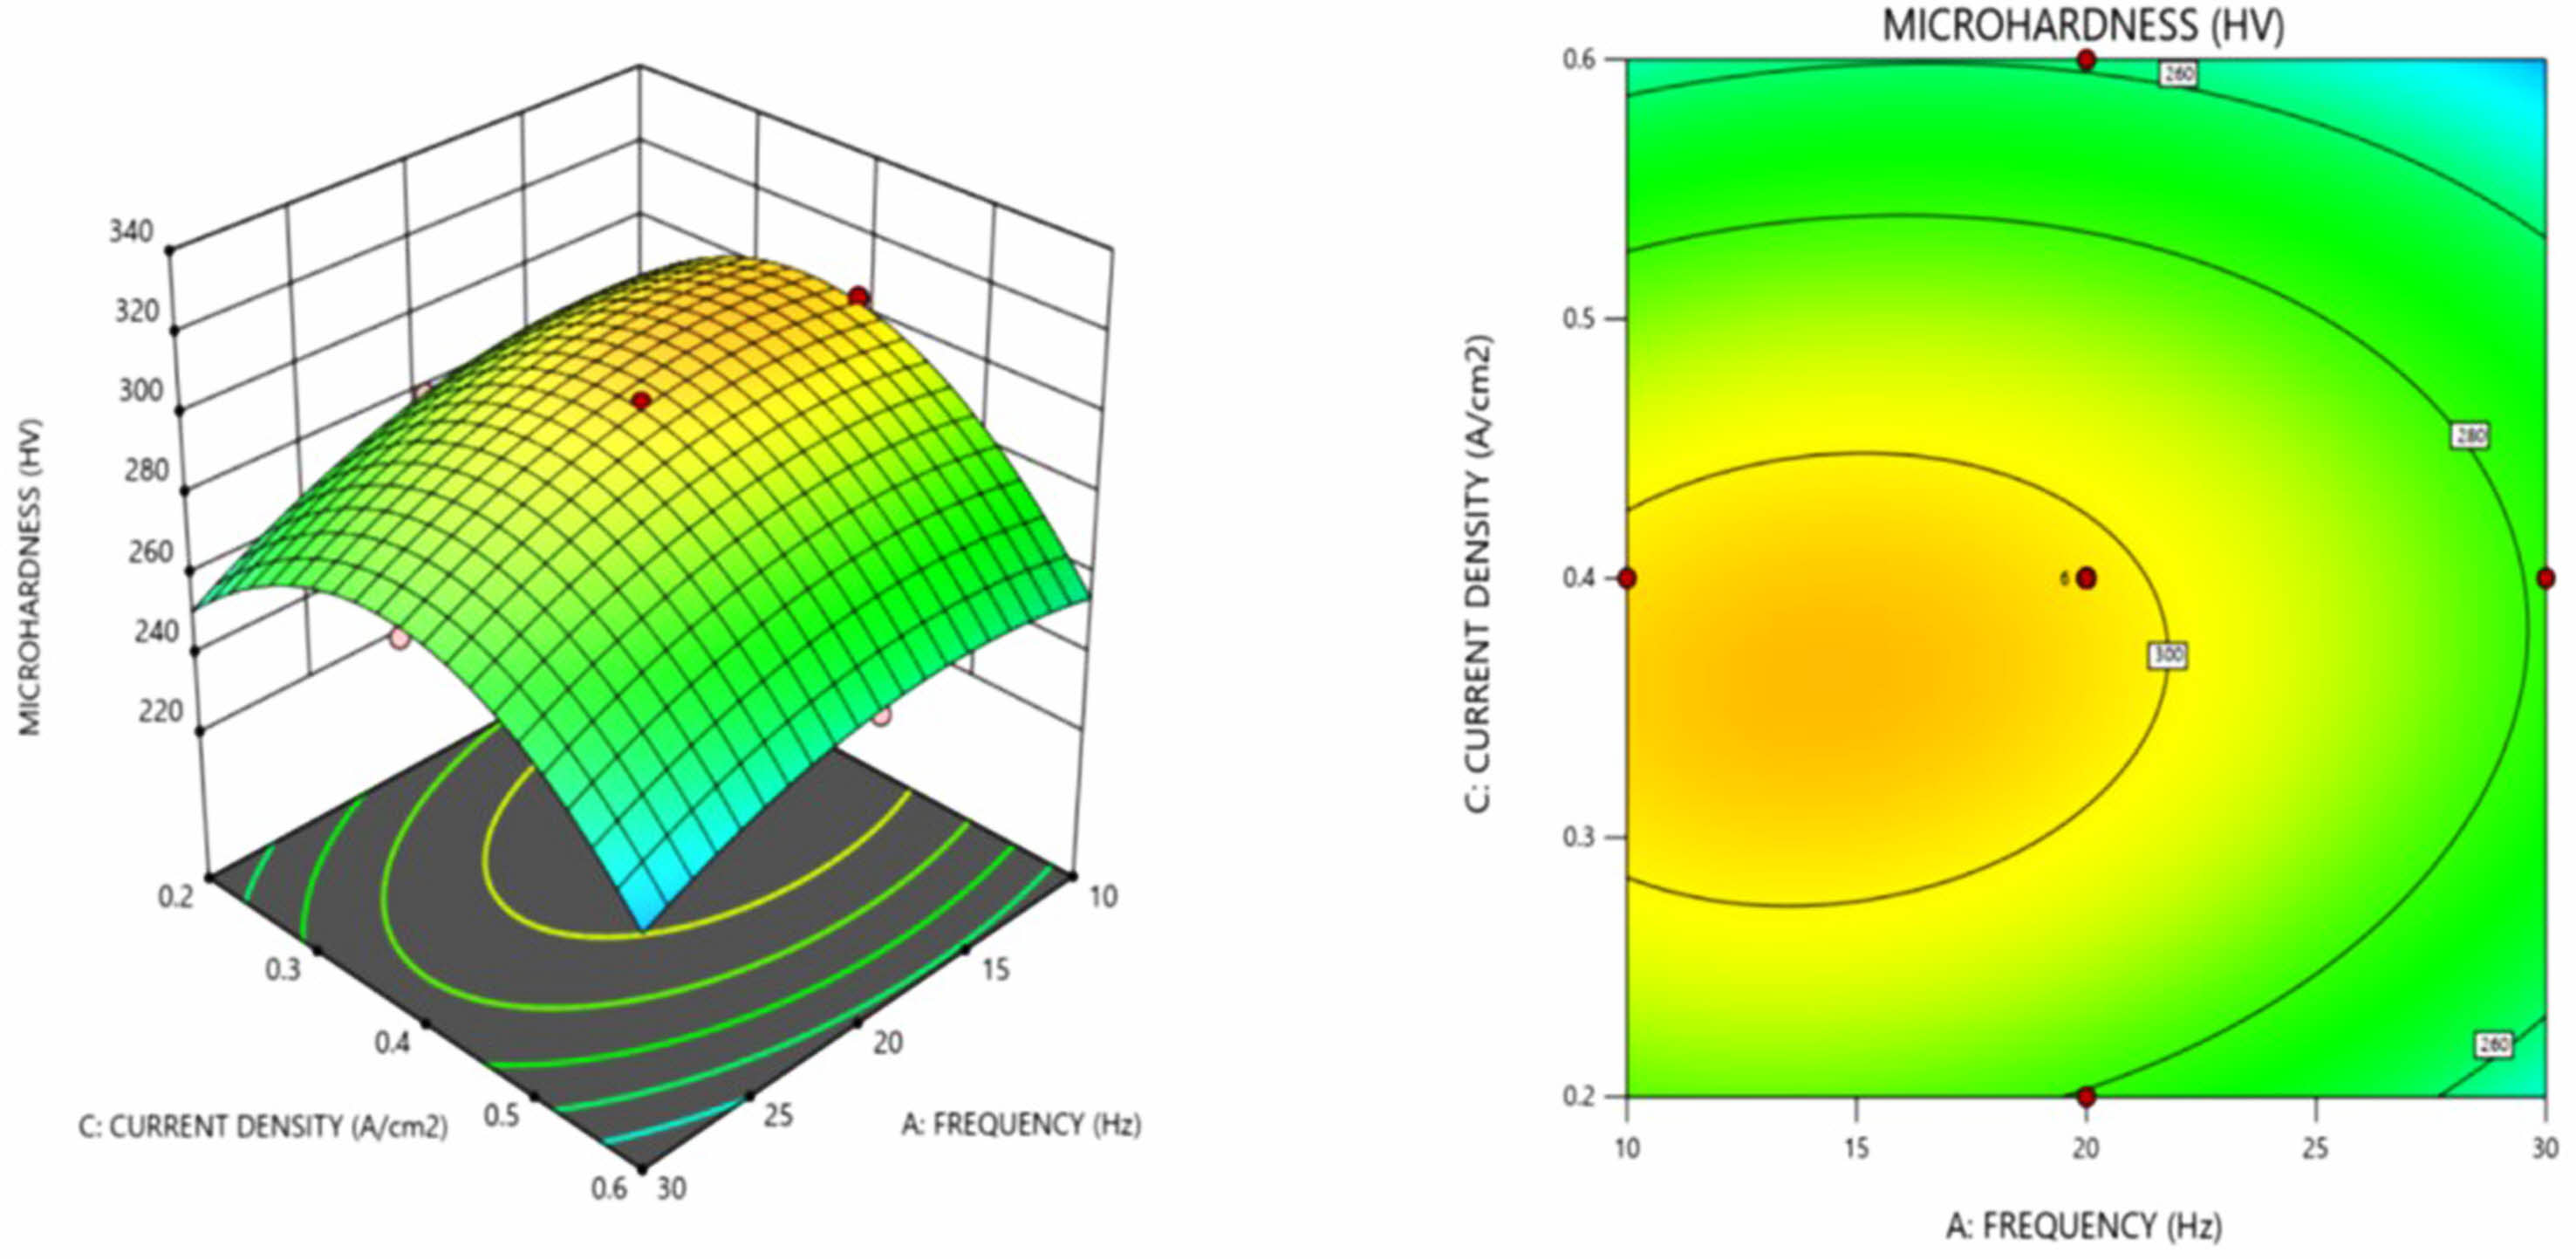
Micro hardness value decreases with increase in frequency, this can be inferred from the response plots in Fig. 1. and Fig. 2. Higher micro hardness at lower frequency attributed to the formation of smaller grain size, in accordance with the Hall-Petch equation given in Eq. (2)

Where H is the microhardness, d is the average grain size and k is a constant
From the Fig. 2, higher microhardness values occurs at lower frequencies and hardness decreases with increase in frequency above 30 Hz, similar trend in the microhardness with varying frequency is observed by Hu et al. [37] and Ghazanlou et al. [38]. The nickel grain size increases as the pulse frequency increases, resulting in a change in microhardness.
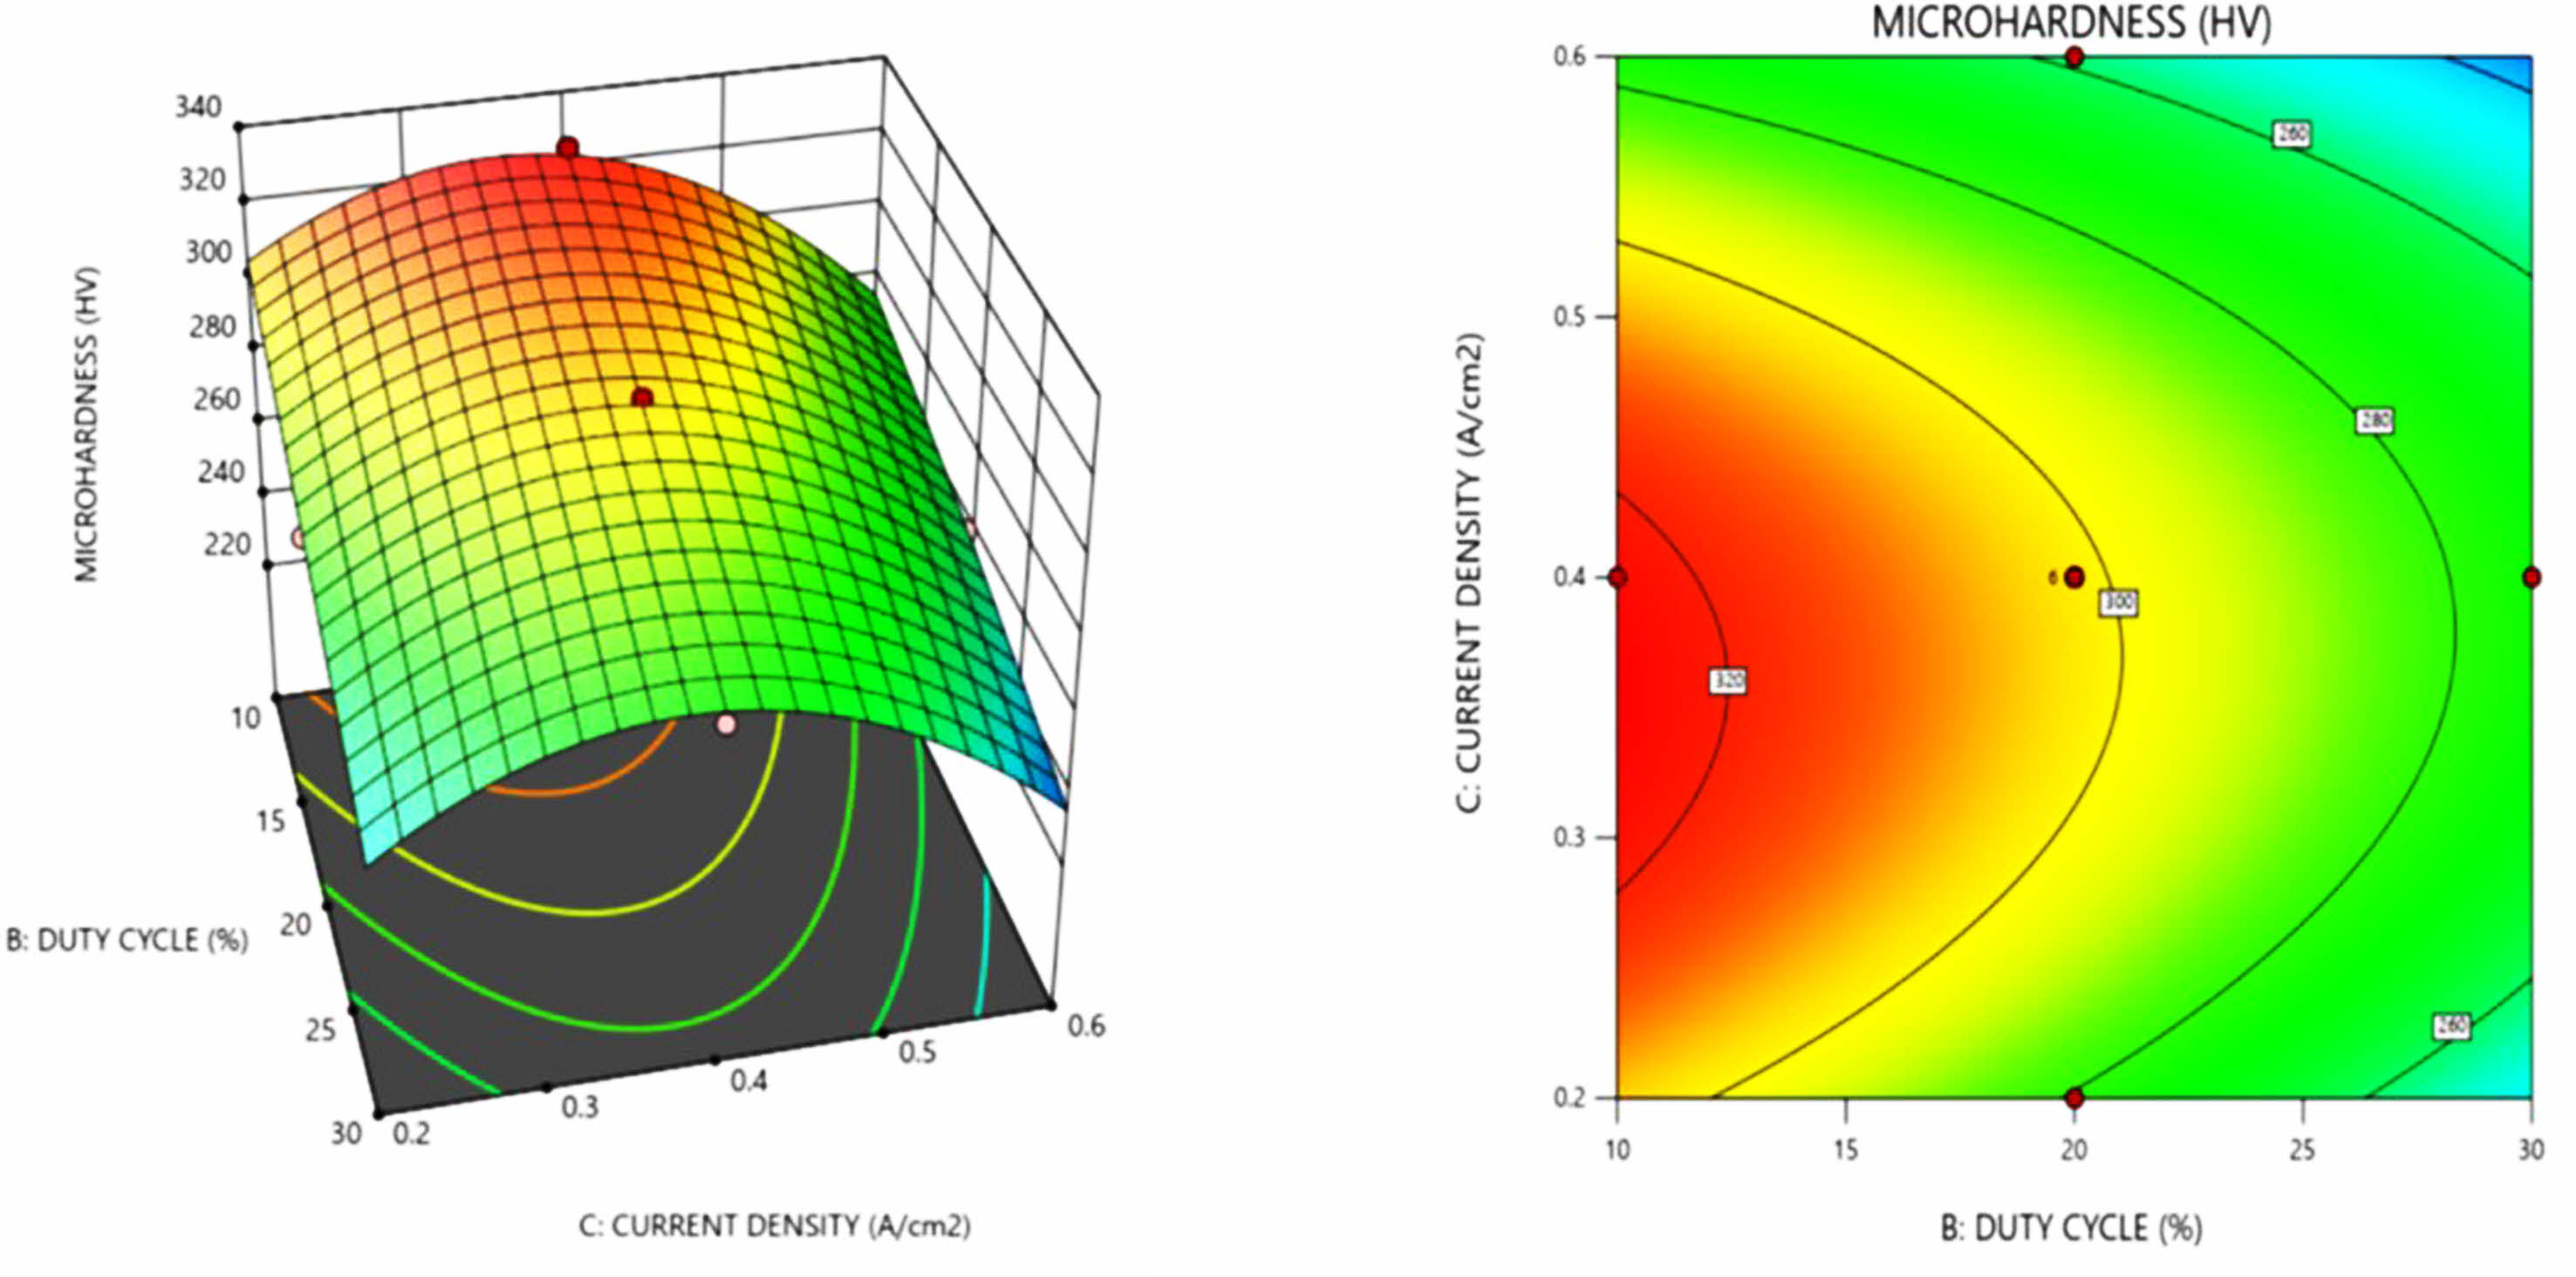
Fig. 3 illustrates the response graph of current density and duty cycle as a function of micro hardness. Increase in current density increases the micro hardness of the Ni-SiC nano coating. It is evident that finer granular microstructure were produced as a result of increase in current density value, this is due to the fact that as the current density rises, the nucleation rate increases resulting in a finer grain microstructure. It is also noted from the contour plot that increasing current density beyond 0.5 A/cm2 shows a decrease in hardness because of the reduction in nanoparticles dispersion into the nickel matrix. Similar trend of decrease in hardness at higher current density was observed by Lajevardi et al. [23] in pulse electrodeposition of Ni-TiO2 particles. At higher current densities, (above 0.4 A/Cm2) nickel ions moves faster than the nanoparticles resulting in the minimal deposition of nanoparticles in the matrix. From the above analysis, a maximum microhardness of 325.2 HV is achieved at 10.6 Hz, 10.9% duty cycle, and 0.36 A/cm2.
Confirmation experiment
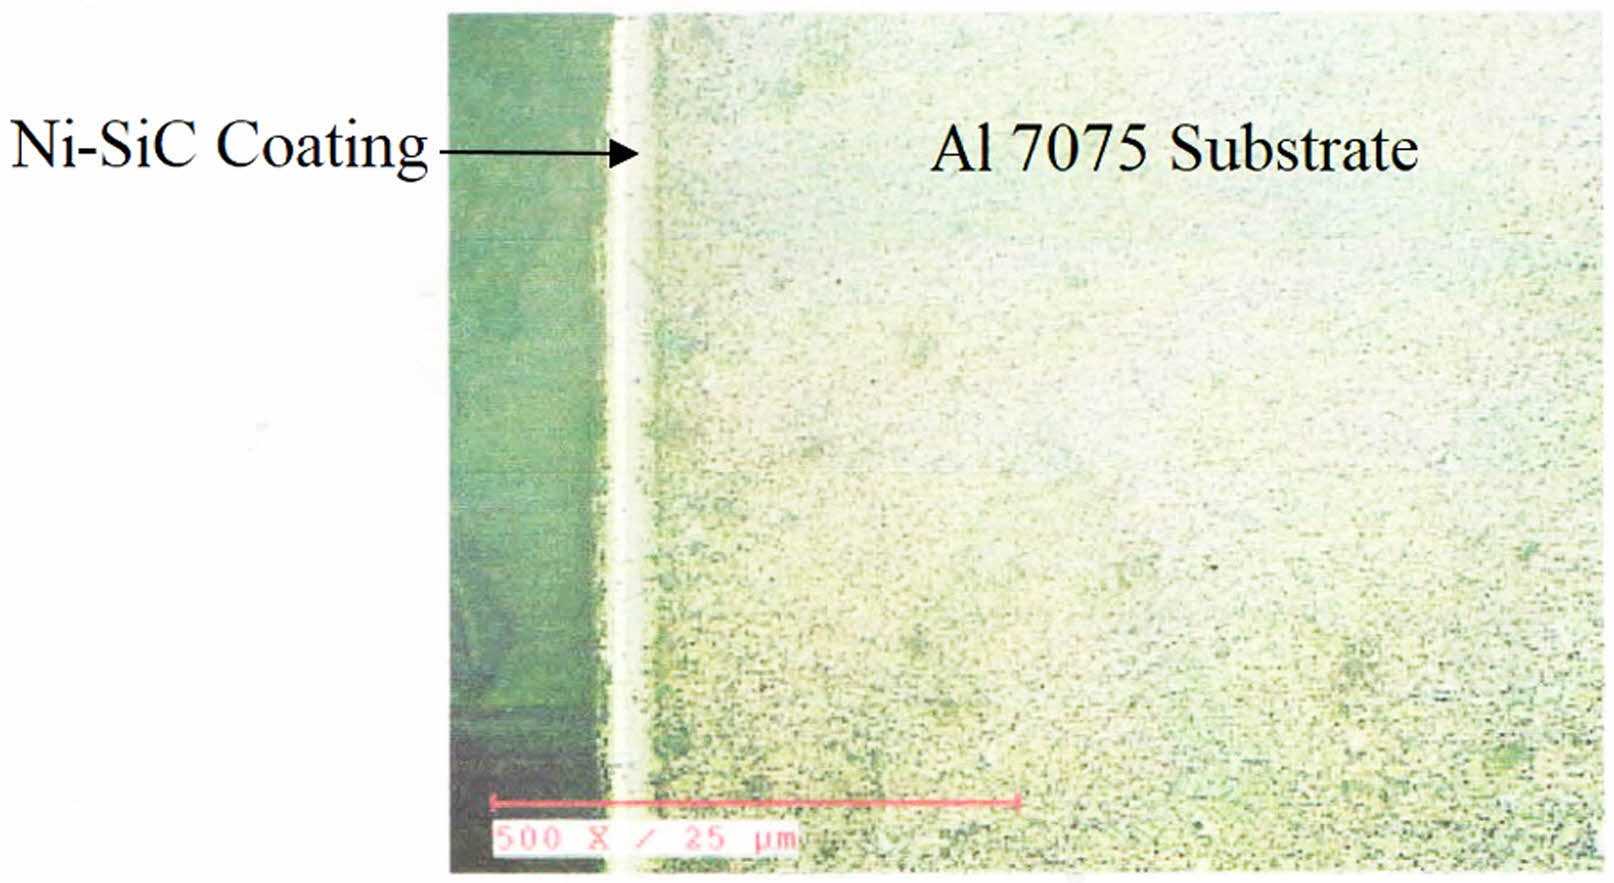
Three confirmation experiments has been carried out to validate the optimum condition suggested by the design expert software. Fig. 4. Shows the coating thickness of the coated sample at optimized condition using a metallurgical microscope at 500 x magnification. Uniform deposition of the coating on the Al 7075 substrate is observed. The result shows an average thickness of 10 µm of Ni-SiC coating on the coated sample.
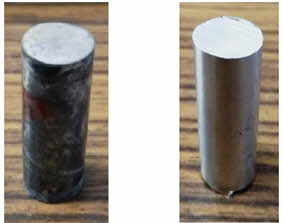
From the confirmation experiments at optimum conditions, a microhardness of 329.6 HV is obtained, which shows a significant improvement of about 3 times of the microhardness of bare alloy which is 103 HV. The experimental microhardness value (329.6 HV) is comparable with the predicted microhardness value of 325.2 HV and the percentage of error between the experimental and predicted value is 1.33%, which reveals that the developed regression model shows a good agreement between the predicted and experimental values in predicting the microhardness value. Fig. 5. Shows the uncoated sample and Ni-SiC sample coated under optimal parameters.
Corrosion studies
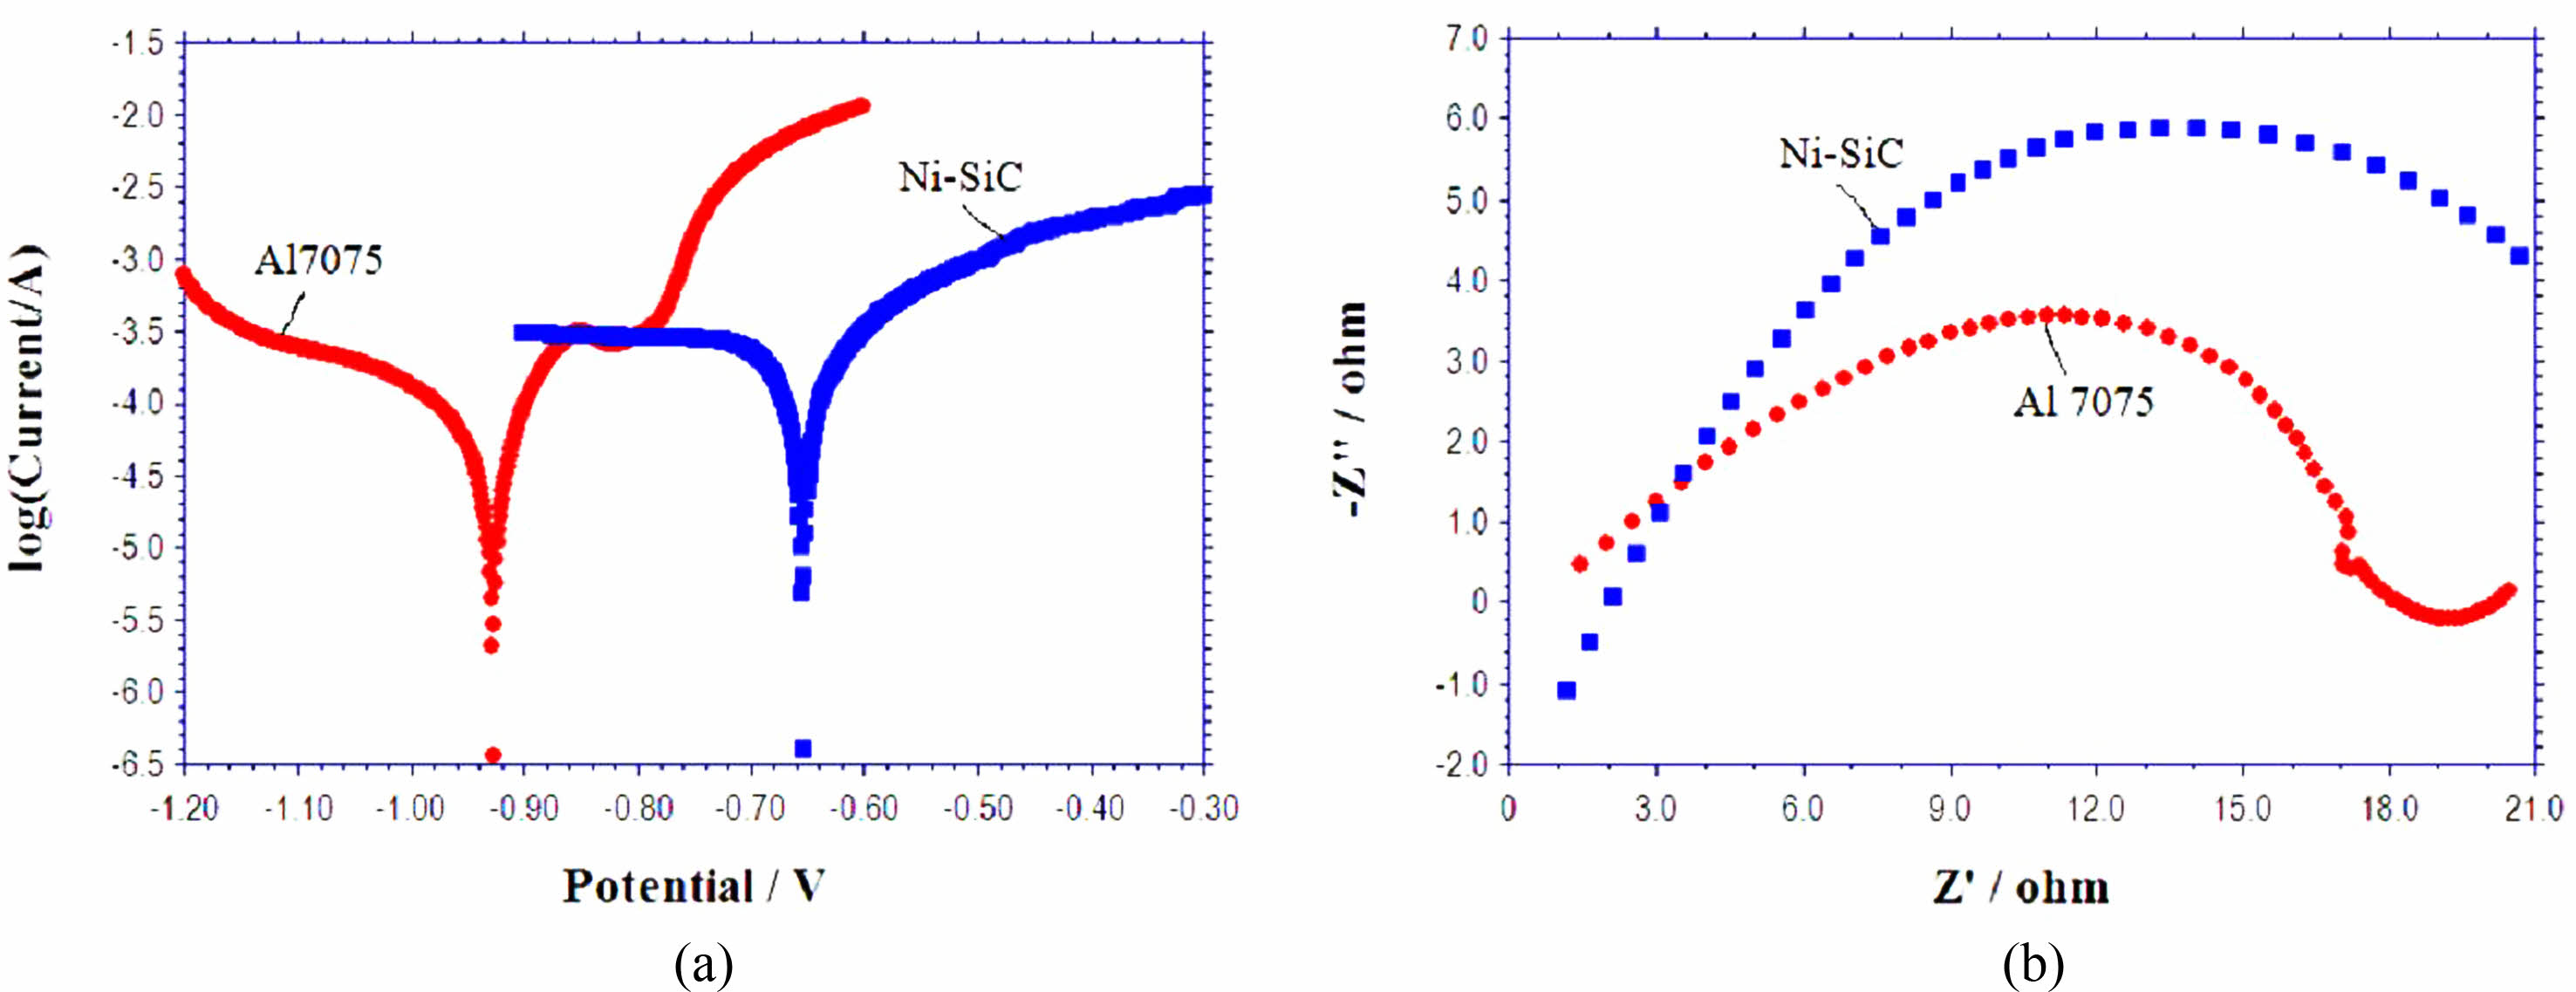
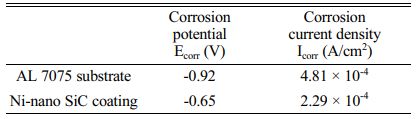
Corrosion tests has been carried out in coated and uncoated specimens by potentiometric polarization tests in 3.5% NaCl with platinum as the counter electrode and saturated calomel as the reference electrode as per ASTM G106-89 standard for 15 minutes. Polarization tests has been performed by varying ± 300 mV around the open circuit potential (OCP) at a rate of 0.5 mV/s. Impedance testing has been carried out from +100 KHz to -0.1 Hz frequency range at OCP. Tafel plot and Nyquist plot results for the Al 7075 aluminium alloy and Ni-SiC nano coating are shown in Fig. 6(a, b). The corrosion characteristics of the bare alloy and the coating are shown in Table 6. It can be inferred from Table 6 that, the corrosion potential increases from -0.92 V for the Al 7075 alloy to -0.65 V for the Ni- nano SiC coating, this is because the uniform distribution of the SiC nanoparticle in the nickel matrix reduces the surface area of contact of the alloy with the corrosive media and hence increases the corrosion potential. The corrosion current density of the composite coating (2.29 × 10⁻⁴ A/cm2) is lower than the bare alloy (4.81 × 10⁻⁴ A/cm2), reduction in corrosion current density indicates a significant reduction in corrosion growth. The above results reveal a significant improvement in the corrosion properties of the developed Ni-SiC coating. The superior corrosive properties of the silicon carbide ceramic particles also contributes a major role in improving the corrosion properties of the coating. These results show a similar trend with the Ni-SiC coating results of Hajiali fini [14].
The semicircular arc radius in the Nyquist plot represents the material’s resistance to corrosion, larger radius indicates the better resistance properties of the material. Fig. 6(b) shows the Nyquist plot for the Al 7075 alloy and the Ni-SiC coating, it is evident from the plot the semicircular radius of the Ni- nano SiC coating shows a larger radius than that of bare alloy which reveals the improved corrosion properties of the nanocomposite coating. The Nano SiC particles in the coating causes increasing corrosion potential compared to the bare alloy, which inturn increases the radius of the coated specimen in the Nyquist plot. These nano SiC particles were embedded in the nickel matrix and fills the pores and gaps and act as inert physical barriers for the corrosion initiation and further growth [39, 40]. Thus, the uniform distribution of nano SiC particles in the nickel matrix reduces the corrosion contact area which significantly improves the corrosion resistance of the Ni-SiC coating.
Characterization of the optimized specimen
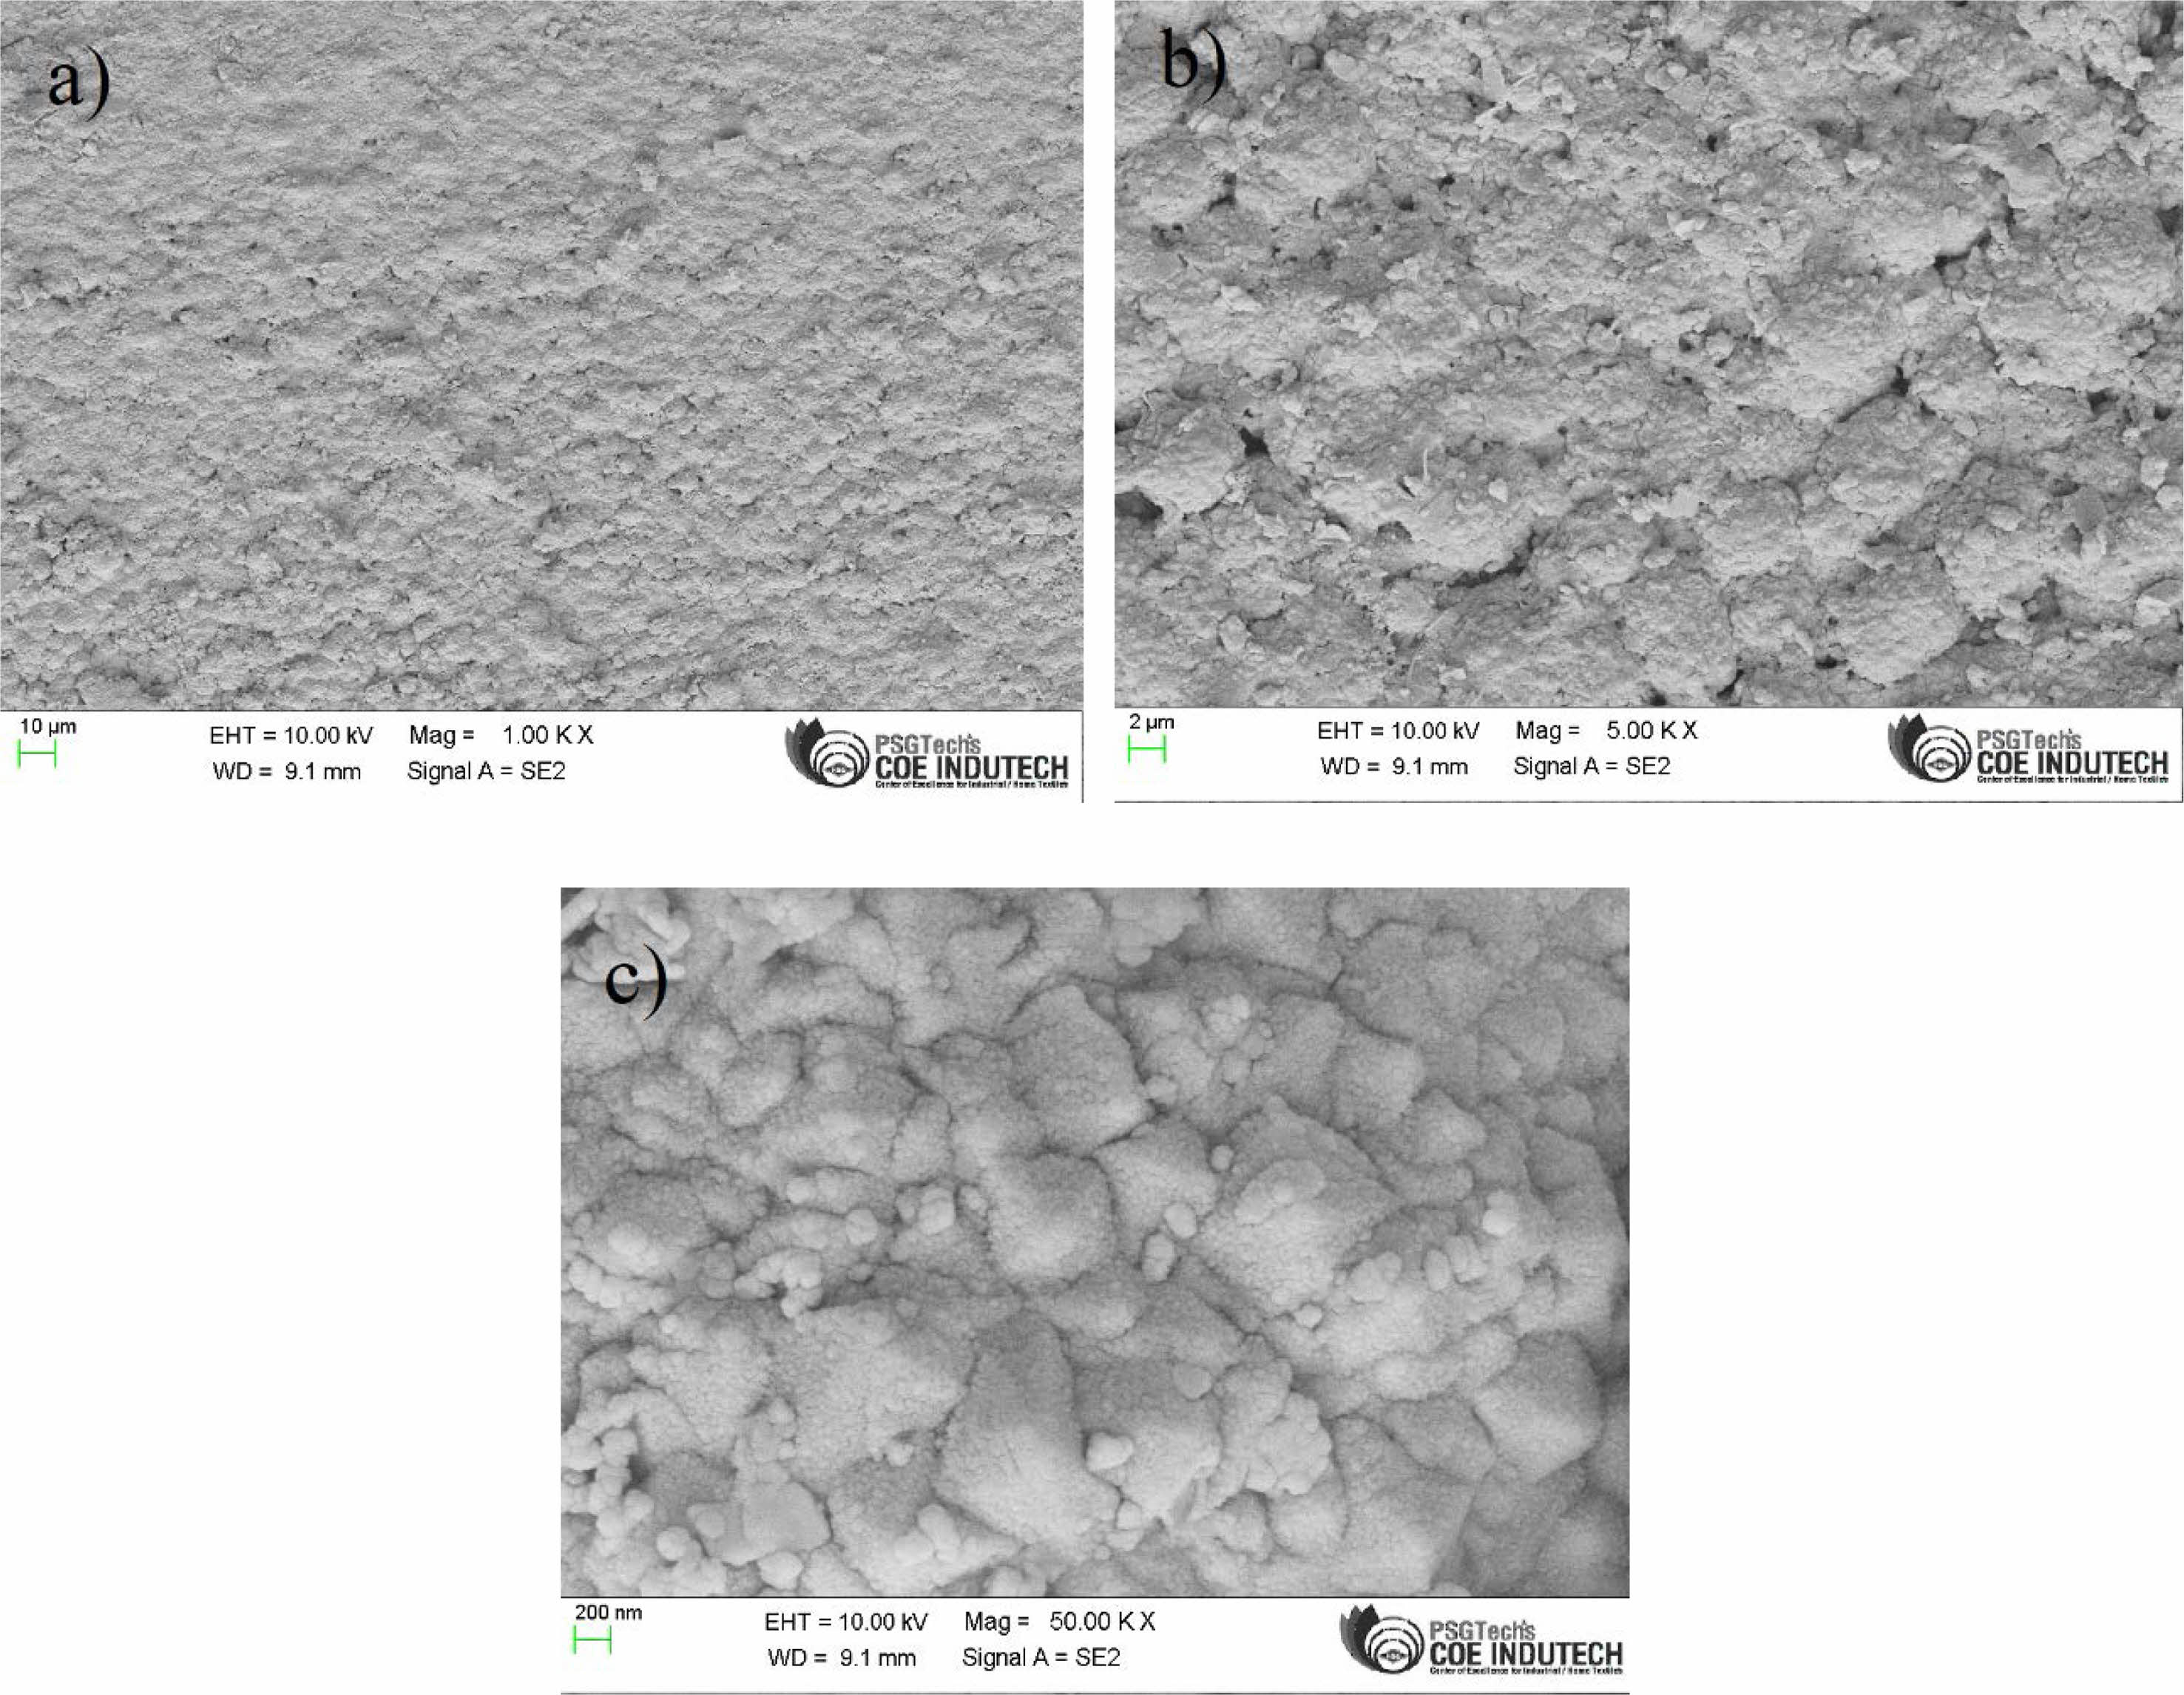
Fig. 7 shows the field emission scanning electron microscopic images of the pulse electrodeposited layers of Ni-SiC coating at a frequency of 10.6 Hz, duty cycle of 10.9% and a current density of 0.36 A/cm2. Uniform deposition of the Ni-SiC coating is observed without any cracks.
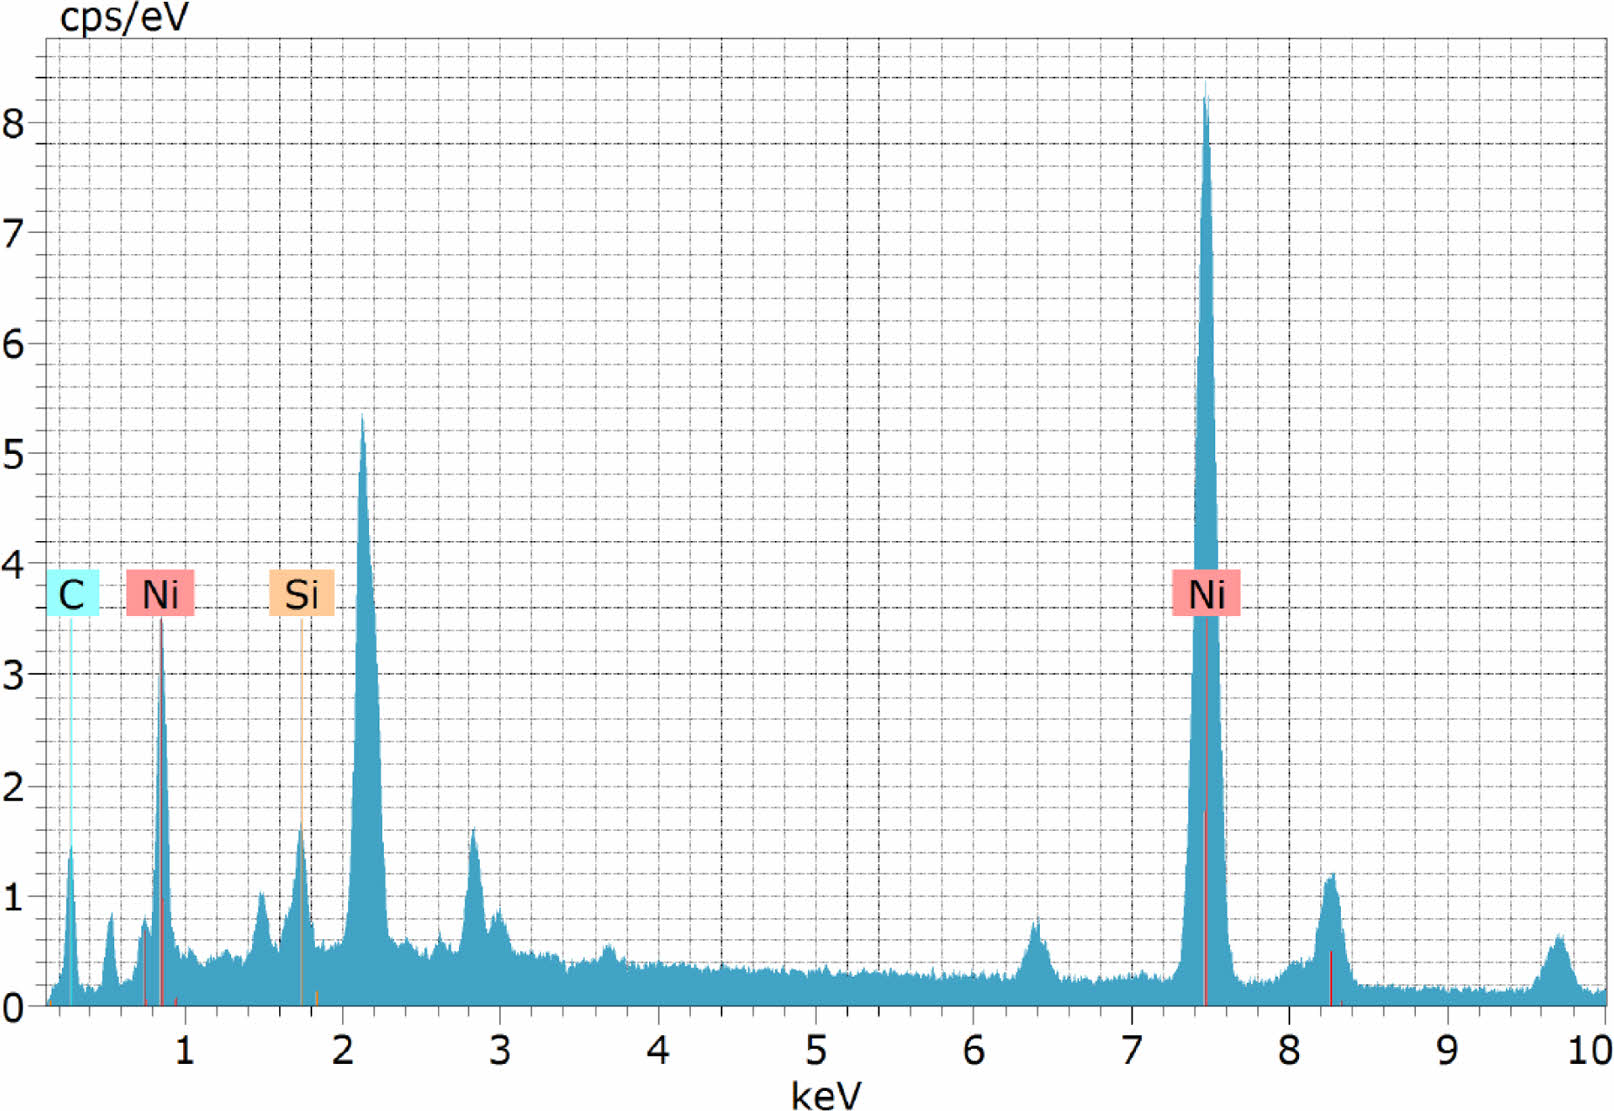
The reason for higher hardness value of 329.6 HV under optimized condition, is evidently due to the formation of denser and smooth coating with higher deposition of nickel and silicon carbide nano particles (Fig. 7). EDAX spectrum of the coating (Fig. 8) clearly reveal the presence of silica and carbon along with nickel in the coating. Refinement of nickel grains at lower duty cycle also significantly contributed to the improvement in micro hardness [14].
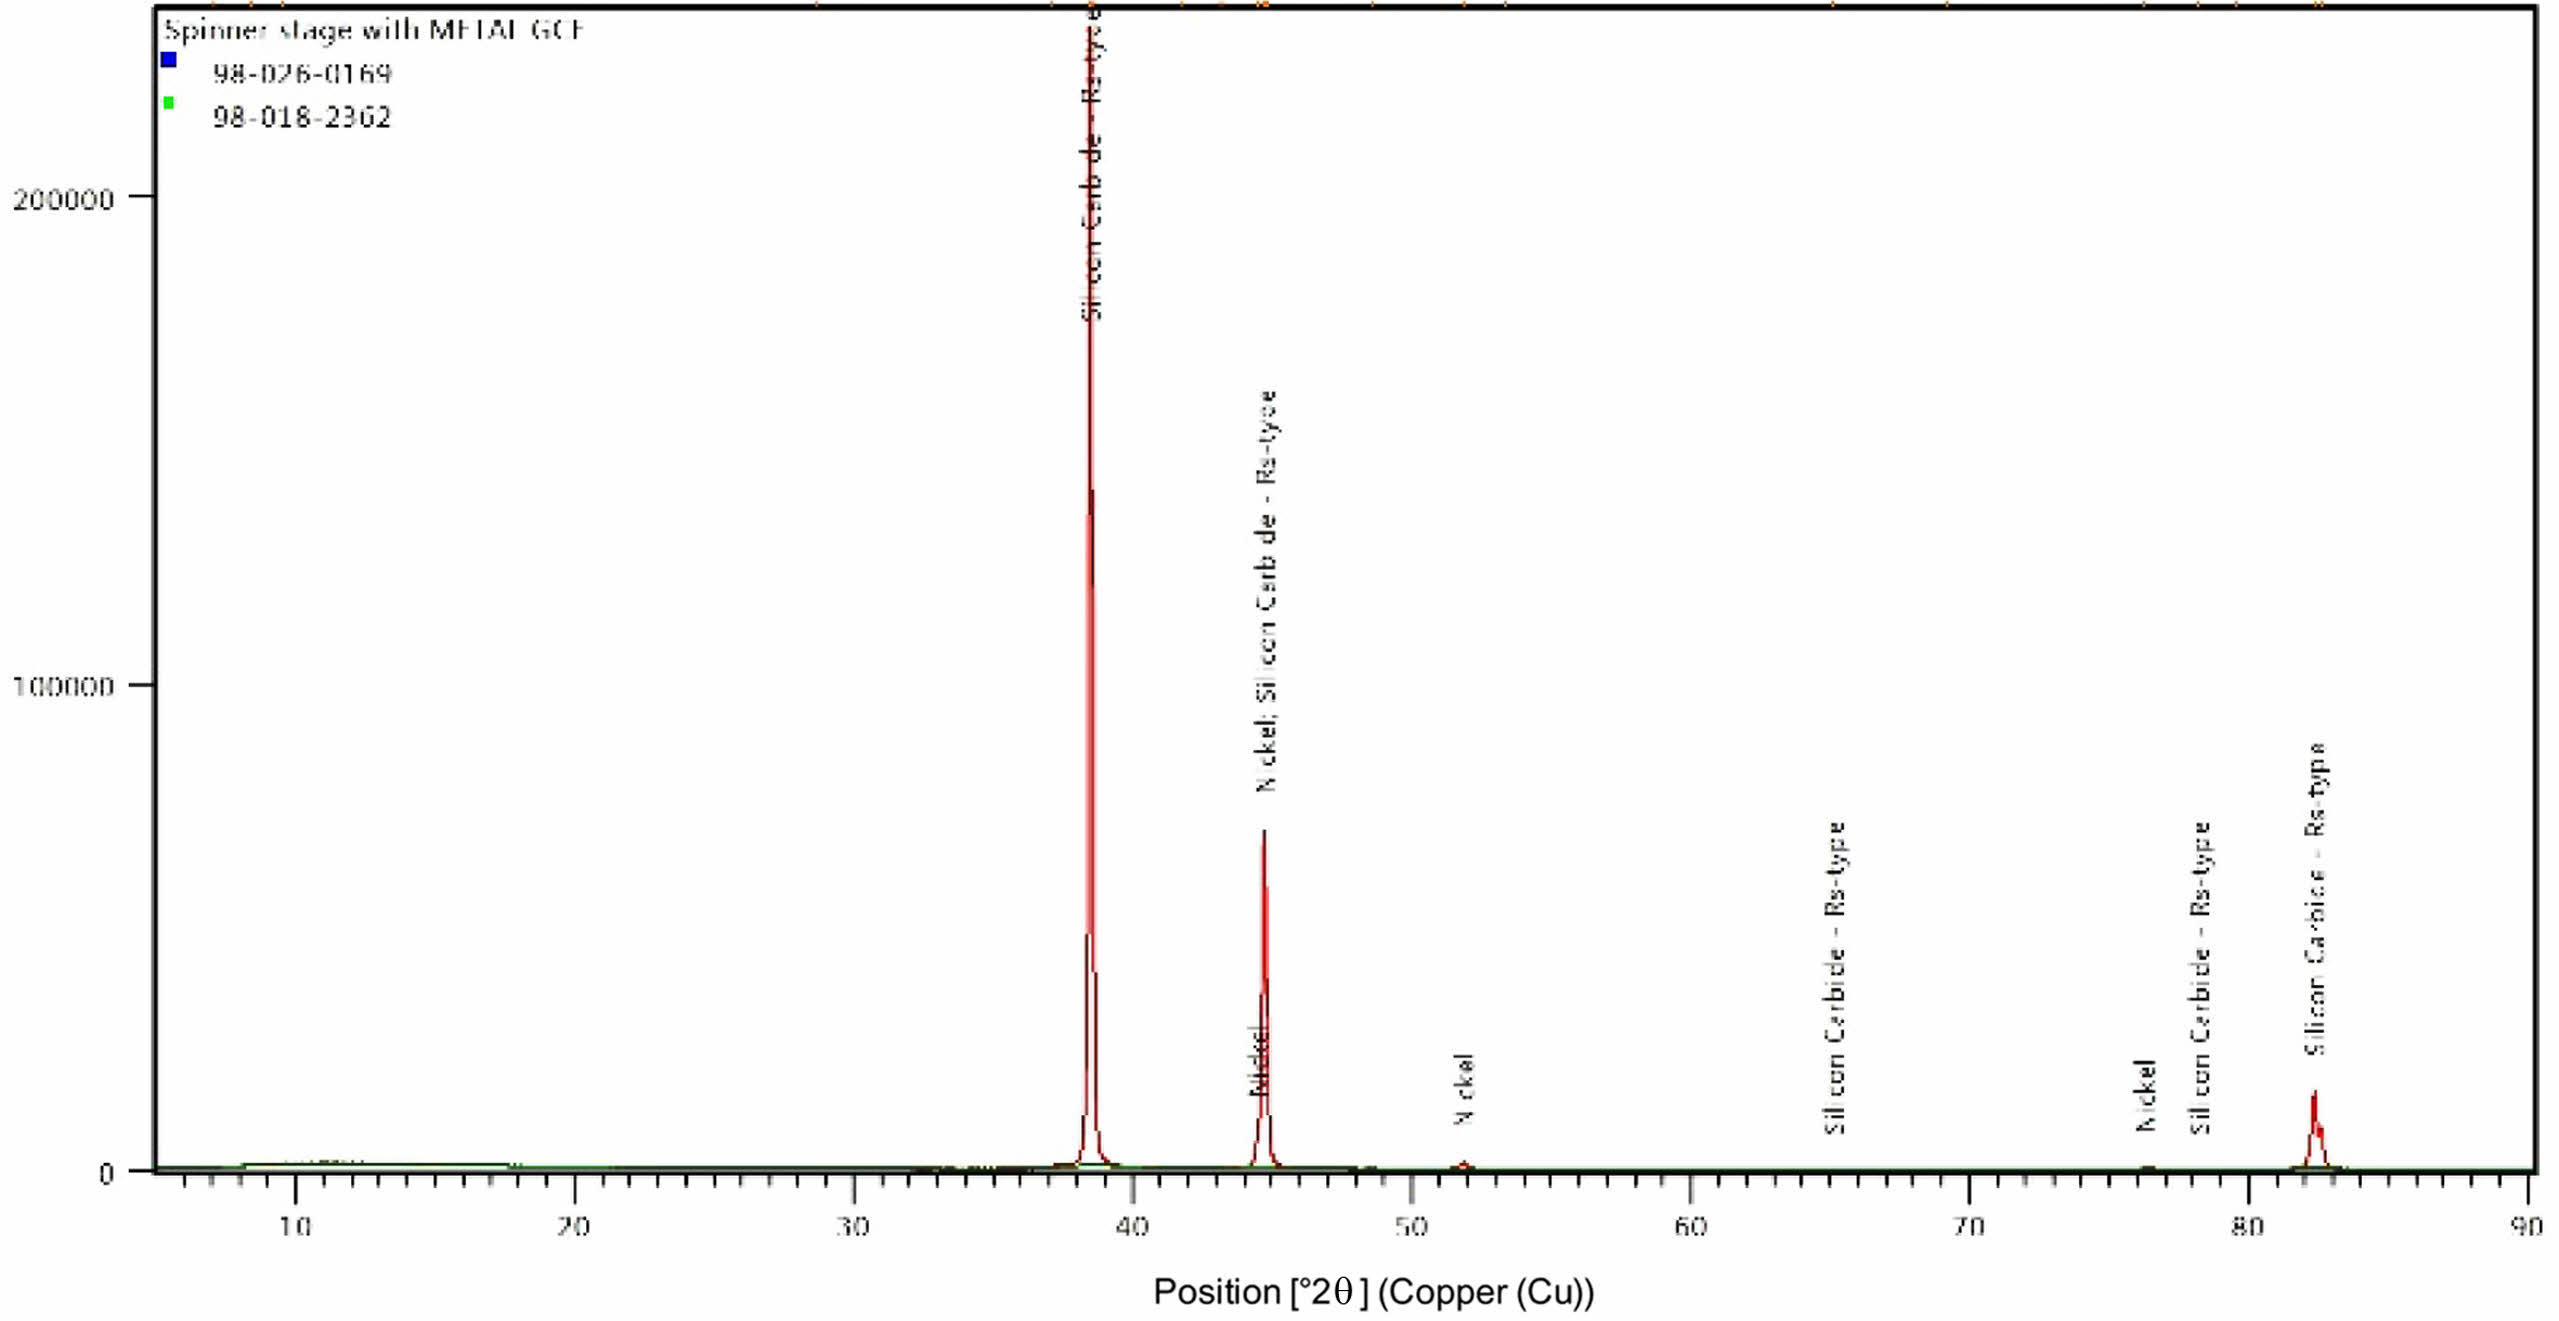
From EDAX analysis the percentage of elements in the coating is found out. Nickel dominates the content with 81.26 wt. % followed by carbon with 16.95 wt. % and silicon 1.80 wt. %. Higher content of carbon (16.95%) in the coating contributes for the enhancement in the mechanical properties. X ray diffractograms of the nano coating is shown in Fig. 9. discloses the crystalline orientation of the Ni-SiC coating is at [1 1 1] orientation at an angle of 42°. Gyftou et al. [15] observed when SiC particles were included into the nickel matrix, the [1 0 0] texture tended to change to a mixed orientation of nickel crystallites along the [1 0 0] and [2 1 1] texture which increases the hardness, which is in agreement with the current XRD results.
|
Fig. 1 3 D surface plot and contour plot for micro hardness as a function of frequency and duty cycle. |
|
Fig. 2 3 D surface plot and contour plot for micro hardness as a function of frequency and current density. |
|
Fig. 3 3 D surface plot and contour plot for micro hardness as a function of duty cycle and current density. |
|
Fig. 4 Coating thickness for the Ni- nano SiC coating. |
|
Fig. 5 Coated and Uncoated Al7075 samples. |
|
Fig. 6 (a) Tafel Plot and (b) Nyquist plot of Al 7075 alloy and Ni-nano SiC coating. |
|
Fig. 7 FESEM image of the Ni- nano SiC coating under different magnification (a) 10 µm (b) 2 µm and (c) 200 nm. |
|
Fig. 8 EDAX image of the Ni- nano SiC coating. |
|
Fig. 9 XRD image of the Ni- nano SiC coating. |
|
Table 5 ANOVA table for the micro hardness. |
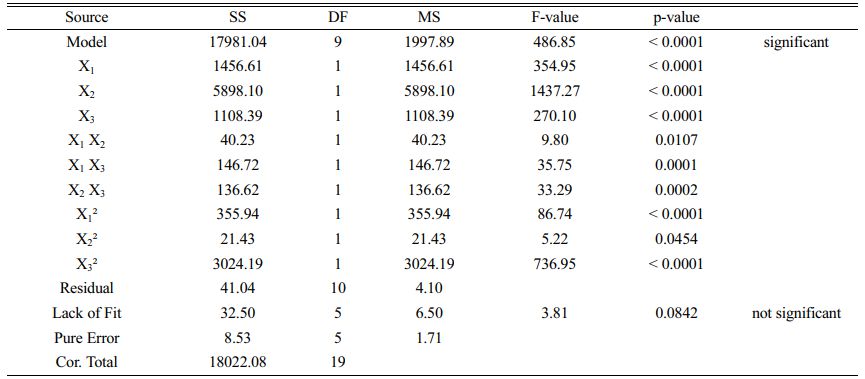
R² = 0.9977, Adj. R² = 0.9957, Pred. R² = 0.9837 |
Micro hardness and corrosion resistance of the pulse electrodeposited Ni-SiC nano coating were investigated and following conclusions were drawn.
FESEM and EDAX images reveals the uniform distribution of the SiC nano particles in the coating. EDAX spectrum shows 16.95% of carbon which substantially improves the micro hardness of the Ni-SiC coating to a maximum of 329.6 HV. The micro hardness of the composite coating is improved by 220% than that of the Al 7075 substrate.
Corrosion potential value of the composite coating improves from –0.92 V to –0.65 V which shows an improvement of 30% more than that of the base metal thereby achieves a considerable improvement in corrosion resistance.
The contribution of the duty cycle is more than the other primary factors and the developed regression equation shows good agreement with the experimental results. The optimum conditions proposed by the model for maximum response is at a frequency of 10.6 Hz, duty cycle of 10.9% and current density of 0.36 A/cm2.
- 1. Tolga Dursun and Costas Soutis, Mater. Des. 56 (2014) 862-871.
-

- 2. Mohan Kumar, S., Pramod, R., Shashi Kumar, M.E., and Govindaraju, H.K., Procedia Eng. 97 (2014) 178-185.
-
- 3. S. Dong, H. Wen, Q. Zhou, and Y. Ding, J. Ceram. Process. Res. 10[3] (2009) 278-285.
-
- 4. S.-J. Kim, J.-Y. Jeong, and J.-I. Kim, J. Ceram. Process. Res. 8[4] (2007) 296-299.
-
- 5. K. Arunsunai Kumar, G. Paruthimal Kalaignan, and V.S. Muralidharan, Ceram. Int. 39 (2013) 2827-2834.
-
- 6. M.S. Chandrasekar and M. Pushpavanam, Electrochim. Acta 53 (2008) 3313-3322.
-
- 7. Luisa peraldo Bicelli, Benedetto Bozzini, Claudio Mele and Lucia D'Urzo, Int. J. Electrochem. Sci. 3 (2008) 356-408.
- 8. Th. Lampke, A. Leopold, D. Dietrich, G. Alisch, and B. Wielage, Surf. Coat. Technol. 201 (2006) 3510-3517.
-
- 9. Y. Liu, S.-R. Yu, J.-D. Liu, Z.-W. Han, and D.-S. Yuan, Trans. Nonferrous Mat. Soc. China 21 (2011) s483-s488.
-
- 10. M. Kartal, I. Buyukbayram, A. Alp, and H. Akbulut, Mater. Today: Proc. 4 (2017) 6982-6989.
-
- 11. X.-Y. Xu, J.-M Han, W.-J. Li, Y.-F. Liu, and L.-M. Liu, J. Ceram. Process. Res. 7[2] (2006) 167-171.
- 12. A.F. Zimmerman, D.G. Clark, K.T. Aust, and U. Erb, Mater. Lett. 52 (2002) 85-90.
-
- 13. P. Narasimman, M. Pushpavanam, and V.M. Periasamy, Wear 292-293 (2012) 197-206.
-
- 14. M. Hajiali Fini, and A. Amadeh, Trans. Nonferrous Met. Soc. China 23 (2013) 2914-2922.
-
- 15. K. Komai and K. Minoshima, Compos. Sci. Technol. 46 (1993) 59-66.
-
- 16. P.-C. Huang, K.-H. Hou, J.-J. Hong, M.-H. Lin, and G.-L. Wang, Wear 477 (2021) 203772.
-
- 17. G.B. Veeresh Kumar, C.S.P. Rao, N. Selvaraj, and M.S. Bhagyashekar, J. Miner. Mat. Char. Engg. 9[1] (2010) 43-55.
-
- 18. A. Sharma, S. Bhattacharya, S. Das, and K. Das, Metall. Mater. Trans. 2014.
-
- 19. P. Gyftou, E.A. Pavlatou, and N. Spyrellis, Appl. Surf. Sci. 254 (2008) 5910-5916.
-
- 20. E.A. Pavlatou, M. Stroumbouli, P. Gyftou, and N. Spyrellis, J. Appl. Electrochem. 36 (2006) 385-394.
-
- 21. A. Jegan and R. Venkatesan, Int. J. Miner. Metall. Mater. 20[5] (2013) 479-485.
-
- 22. D.R. Joshua and A. Jegan, J. Ceram. Process. Res. 23[1] (2022) 69-78.
-
- 23. S.A. Lajevardi and T. Shahrabi, Appl. Surf. Sci. 256 (2010) 6775-6781.
-
- 24. D. Vijay praveen, D. Ranga raju, and M.V. Jagannandha raju, Mater. Res. Express 6 (2019) 126537.
-
- 25. Pradeep Devaneyan S., T. Senthilvelan, Int., J. Compos. Mater. 4[5] (2014) 197-203.
-
- 26. D. Thirumalaikumarasamy, V. Balasubramanian, and S. Sree Sabari, J. Magnes. Alloy. 5 (2017) 133-145.
-
- 27. R. Girimurugan, J. Bensamraj, and S. Karthick, J. Ceram. Process. Res. 23[4] (2022) 553-557.
-
- 28. H.R. Myers, D.C. Montgomery in “Response Surface Methodology: Process and Product Optimization Using Design Experiments” (John Wiley & Sons, New York, 1995)
- 29. Mukesh Kumar, S.K. Tamang, Dipika Devi, M. Dabi, K. K. Prasad, and R.Thirumalai, J. Ceram. Process. Res. 23[3] (2022) 373-382.
-
- 30. T. Pridhar, K. Ravikumar, B. Sureshbabu, R. Srinivasan, and B. Sathishkumar, J. Ceram. Process. Res. 21[2] (2020) 131-142.
-
- 31. C.R. Raghavendra, S. Basavarajappa, and I. Sogalad, Trans. Indian Inst. Met. 71 (2018) 2119-2132.
-
- 32. P. Natarajan, A. Jegan, and S. Sankar Ganesh, Mater. Res. Express 6 (2019) 085048.
-
- 33. R. Karunanithi, Supriya Bera, and K.S. Ghosh, Mat. Sci. and Eng. B 190 (2014) 133-143.
-
- 34. S.P. Devaneyan and T. Senthilvelan, Procedia Eng. 97 (2014) 1496-1505.
-
- 35. H.J. Biswal, P.R Vundavilli, and A. Gupta, IOP Conf. Ser.: Mater. Sci. Eng. 653 (2019) 012046.
-
- 36. M.R. Vaezi, S.K. Sadrnezhaad, and L. Nikzad, Colloids Surf. A: Physicochem. Eng. Asp. 315 (2008) 176-182.
-
- 37. F. Hu and K.C. Chan, Trans. Inst. Met. Finish. 84[5] (2006) 252-255.
-
- 38. S.I. Ghazanlou, A. Shokuhfar, S. Navazani, and R. yavari, Bull. Mater. Sci. 39[5] (2016) 1185-1195.
-
- 39. Y. Yang and Y.F. Cheng, Surf. Coat. Technol. 216 (2013) 282-288.
-
- 40. V. Suresh and A. Jegan, Mater. Res. Express 9[12] (2022) 126401.
-
 This Article
-
2023; 24(3): 486-494
Published on Jun 30, 2023
- 10.36410/jcpr.2023.24.3.486
- Received on Jan 24, 2023
- Revised on Apr 28, 2023
- Accepted on May 18, 2023
Services
Shared
Correspondence to
- S. Sankar Ganesh
-
Department of Mechanical Engineering, Government College of Engineering, Tirunelveli–627007, Tamilnadu, India
Tel : +91-8807266386 - E-mail: sankarganesh@gcetly.ac.in
Clean-Energy Research Institute(CRI), Hanyang University, 222, Wangsimni-ro, Seongdong-gu, Seoul, 04763, Korea
E-mail: jcpr@hanyang.ac.kr