


- Relaxor characteristics of PSLZT-BMT-based ferroelectric material ceramics
Nguyen Van Thinha,c, Le Dai Vuongb,*, Do Viet Ona, Truong Van Chuonga, Le Vu Truong Sond, Trinh Ngoc Datd, Le Van Thanh Sond and Vo Thanh Tunga
aUniversity of Sciences, Hue University, Hue City, Vietnam
bSchool of Engineering and Technology - Hue University, Hue City, Vietnam
cUniversity of Technology and Education, The University of Danang, Da Nang City, Vietnam
dUniversity of Science and Education, The University of Danang, Da Nang City, VietnamThis article is an open access article distributed under the terms of the Creative Commons Attribution Non-Commercial License (http://creativecommons.org/licenses/by-nc/4.0) which permits unrestricted non-commercial use, distribution, and reproduction in any medium, provided the original work is properly cited.
(1-x)[(Pb0.94Sr0.05La0.01)(Zr0.54Ti0.46)0.9975O3]-x[Bi(Mn1/2Ti1/2)O3] (PSLZT-BMT) ferroelectric material ceramics with x in the range of 0-0.05 mol were successfully synthesized following the conventional solid-phase route. The materials were thoroughly investigated to study their structural phase, microstructure, ferro-piezoelectric characteristics, and dielectric behavior. The experimental results show that the density of the samples decreased from 7.75 to 7.58 g/cm3, and the relative density decreased in the range of 98.48%-96.28%. However, with increasing contents of BMT, the dielectric and ferroelectric properties of PSLZT-BMT ceramics tend to decrease, specifically the maximum dielectric constant (εmax) of PSLZT-BMT decreased in the range of 23579-9991 and the residual polarization (Pr) decreases in the range of 22.54-7.87 µC/cm2 when the doping content increased in the range of 0.0-0.05 mol. The diffusivity values (γ) of the PSLZT-BMT material are 1.74, 1.78, 1.82, 1.84, 1.79, and 1.77 when the doping content x varies as 0.0, 0.01, 0.02, 0.03, 0.04, and 0.05 mol, respectively, which is characteristic of relaxor ferroelectric materials. Besides, the Tm, TB, TC-W, and C values depend on BMT concentration, and the trend decreases
Keywords: PSLZT-BMT, Ferroelectric materials, Dielectric materials, Relaxor materials, Ceramics
The Pb(Zr1-xTix)O3-based ceramics (PZT) are now essential functional materials for actuators, ultrasonic motors, and transducers [1-5]. PZT has attracted immense attention as they are characterized by a high electromechanical coupling factor (kp), mechanical quality factor (Qm), piezoelectric constant (d33), Curie temperature (Tc), and low loss values. This helps meet the demands of miniaturization and high power in practice. PZT ceramics often contain two types of doping: acceptor (hard) doping with lower-valence ions like Fe3+, Mg2+, Al3+, Sc3+, etc., and donor (soft) doping with higher-valence ions like La3+, Ta5+, Nb5+, etc. Donor doping has the potential to enhance the lead vacancies while decreasing the concentration of oxygen vacancies, which causes the ceramics to show high strain and strain hysteresis but low mechanical quality. While the ceramics show low strain, and strain hysteresis is still a good mechanical quality factor, acceptor doping can enhance oxygen vacancies. Some PZT ceramics have donor and acceptor ions co-doped into them to improve their electrical characteristics. In contrast, straining of the PZT lattice due to the substitution of a smaller Sr atom at the Pb site was thought to be the cause of analogous doping such as Sr2+, leading to an increased dielectric permittivity and a high electromechanical coupling factor [6]. Research on the dielectric and piezoelectric properties focuses on co-doping PSLZT with Sr and La by replacing the A site of the ABO3 perovskite structure [7-9].
Until now, numerous attempts have been made to enhance the electromechanical characteristics of PZT-based materials [5, 6, 10]. It is challenging to achieve high Qm, kp, and d33 simultaneously. The most popular approach to meet the aforementioned criterion is to introduce acceptor dopants into soft base materials [3, 11]. This is followed for the case of PZT, where Fe3+ ions are substituted for the Zr4+/Ti4+ sites by producing acceptor-oxygen vacancy defect dipoles (Fe′-V). The addition of perovskites with B-site multivalence ions, such as Pb(Mn1/3Nb2/3)O3 (PMN) or Pb(Mn1/3Sb2/3)O3 (PMS), is another common technique [12-14]. This method pins the domain walls using oxygen vacancies created by coexisting Mn2+/Mn3+ ions during high-temperature sintering [12, 15]. Unfortunately, the sintering temperature required for the aforementioned composition systems is typically higher than 1250 °C. For the use of multilayer piezoelectric devices, it is very challenging to find ceramics based on them that have excellent piezoelectric and electromechanical properties and lower sintering temperatures [5, 12, 15]. Furthermore, the use of Nb2O5 and Sb2O3 would definitely increase the cost of manufacture.
Bi-based perovskite compounds have high TC and good ferroelectric properties [2, 16, 17]. Additionally, the decrease in sintering temperature would benefit from the addition of Bi-based perovskites to PZT [2]. Bi(Mn1/2Ti1/2)O3 is expected to function similarly to PMN and PMS, as previously described. The effect of the addition on the electrical properties and densification of PZT ceramics has never been reported in the literature. In this study, a new ternary solid solution ceramic of PZT was developed following the conventional mixed-oxide method. Particular attention was paid to the variation of the ternary system's dielectric, ferroelectric, and electromechanical characteristics.
The piezoelectric ceramic system is represented by the formula (1-x)[(Pb0.94Sr0.05La0.01)(Zr0.54Ti0.46)0.9975O3]-x[Bi(Mn1/2Ti1/2)O3]. It is abbreviated as PLSZT-xBMT with x in the range 0.00-0.05 mol. The system was prepared following the solid phase reaction method. The initial components are oxides obtained from Daejung, Korea: PbO (99%), ZrO2 (99%), TiO2 (98%), SrCO3 (98%), La2O3 (99%), Bi2O3 (99%), MnO2 (98%). After being weighed according to the described procedure, the mixture of components was milled for 20 h with zirconia balls in an ethanol medium. Afterward, the powder was calcined for 2 h at 850 °C at a heating rate of 300 °C/h. Over the course of 20 h, zirconia balls and ethanol were used to re-mill the calcined powder. A uniaxial press was used, a load of 150 MPa was applied, and the discs were pressed in a hardened stainless steel die (diameter: 12 mm; thickness: 1.5 mm). The green ceramic discs were then sintered at 1150 °C for 2 h at a heating rate of 300 °C/h. Following this, the samples were cooled to room temperature at a rate of 300 °C/h.
The crystalline structure of sintered ceramics was analyzed using the X-ray diffraction (XRD) technique (D8-Advanced, BRUKER AXS) at room temperature. The surface morphology was studied using (SEM, JEOL-5300) the scanning electron microscopy technique. The grain size and size distribution of the samples were determined via SEM image analysis performed using ImageJ. The densities of the samples were measured following the Archimedes method using ethanol. The silver pastes were swept on both sides of the sample and heated at 500 °C for 30 min to develop an electrode for electrical measurements. Dielectric properties were obtained by measuring the temperature dependencies of the capacitance and phase angle (HIOKI 3532) of the samples in the temperature range of 30-350 °C. Ferroelectric properties were determined following the Sawyer-Tower circuit method.
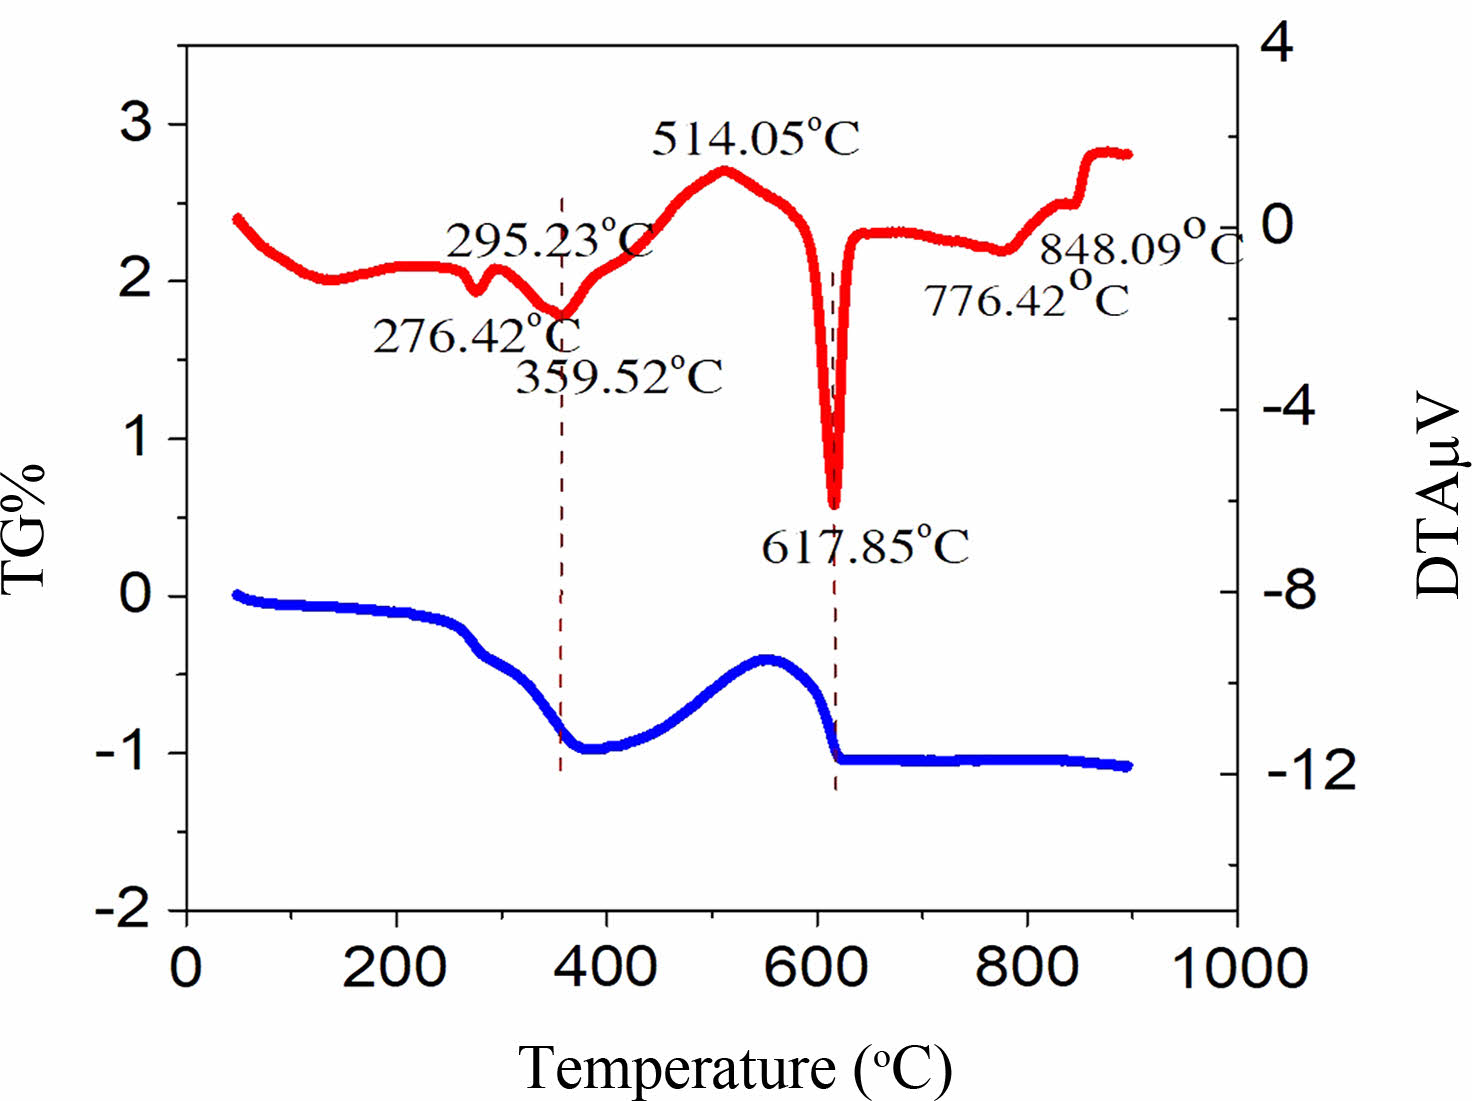
We examined the results obtained using the thermal gravimetric (TG) and thermal analysis (DTA) techniques. The PSLZT-BMT powder was analyzed to determine the calcination temperature (Fig. 1). The TG curve shows a linear decline in the overall mass of the powder under study. However, the DTA curve presents an endothermic peak between 776.42°C and 848.09 °C, which is associated with ion evaporation. The mixture of materials after grinding is calcined at different temperatures from 700 to 850 °C to accurately determine the phase formation temperature of PSLZT- BMT materials.
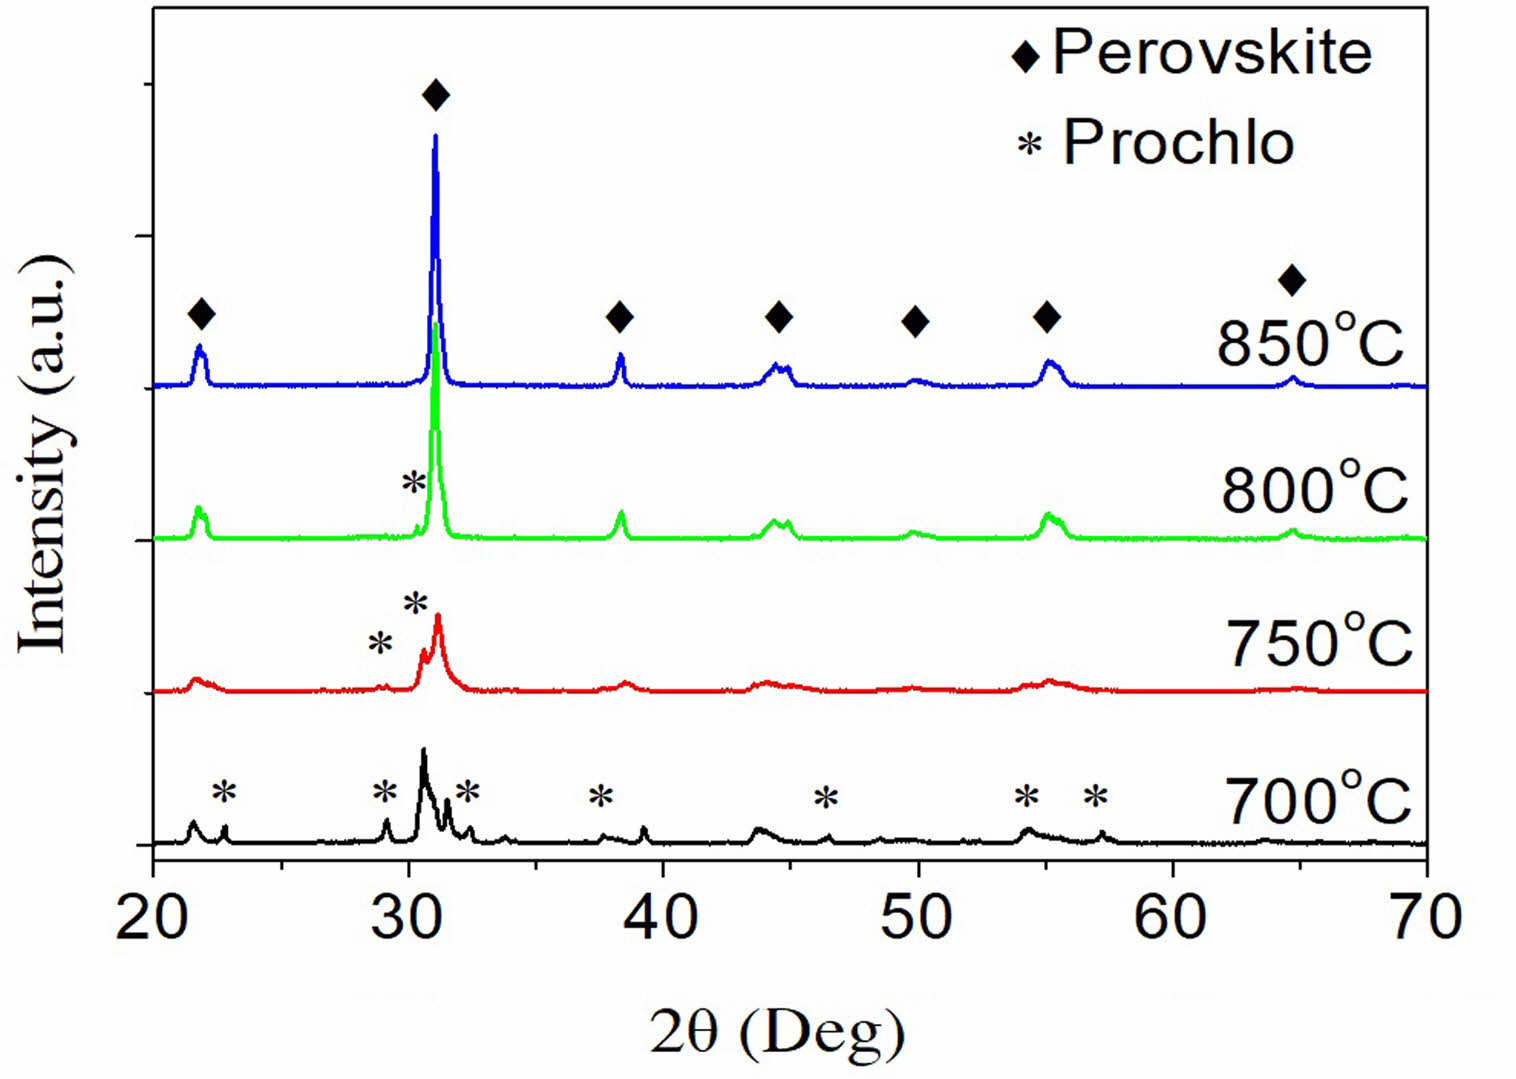
Fig. 2 depicts the material's structural phase in relation to the calcination temperature. The findings demonstrate that the material does not fully form at temperatures below 850 °C; the pyrochlore phase is present in the sample under these conditions. The material entirely transitioned into a peroskite structure when the temperature increased to 850 °C. As a result, 850 °C is selected as the preheating temperature for the PSLZT-BMT material, similar to the study of [16].
The densification factor (DF) of the PSLZT-BMT ceramics sintered at 1150 °C is calculated using equation (1) as follows:

where ρt is the theoretical density, ρm is the measured density, and ρg is the density of the unsintered green pellets [18]. Shrinkage measurements were conducted to check the diameters of both pre-sintered samples using equation (2) as follows:
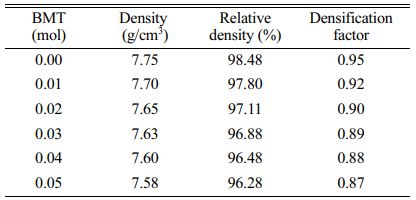
where (do) and (ds) are the diameters of the green and sintered pellets, respectively [18]. The density coefficient reaches the maximum value at the PSLZT composition without BMT, and it then decreases with an increase in the BMT content. The positive density coefficient represents the shrinkage of the ceramic system at the sintering temperature of 1150 °C [19, 20]. Table 1 shows the rate of shrinkage of the ceramic system as a function of the BMT content. The trend of density change of ceramic at different temperatures is similar to that of the density factor. As the BMT content increased, the density of the samples decreased from 7.75 to 7.58 g/cm3, and the relative density decreased in the range of 98.48%-96.28% consistent with studies with other ceramic systems as reported by Şahin et al. [21].
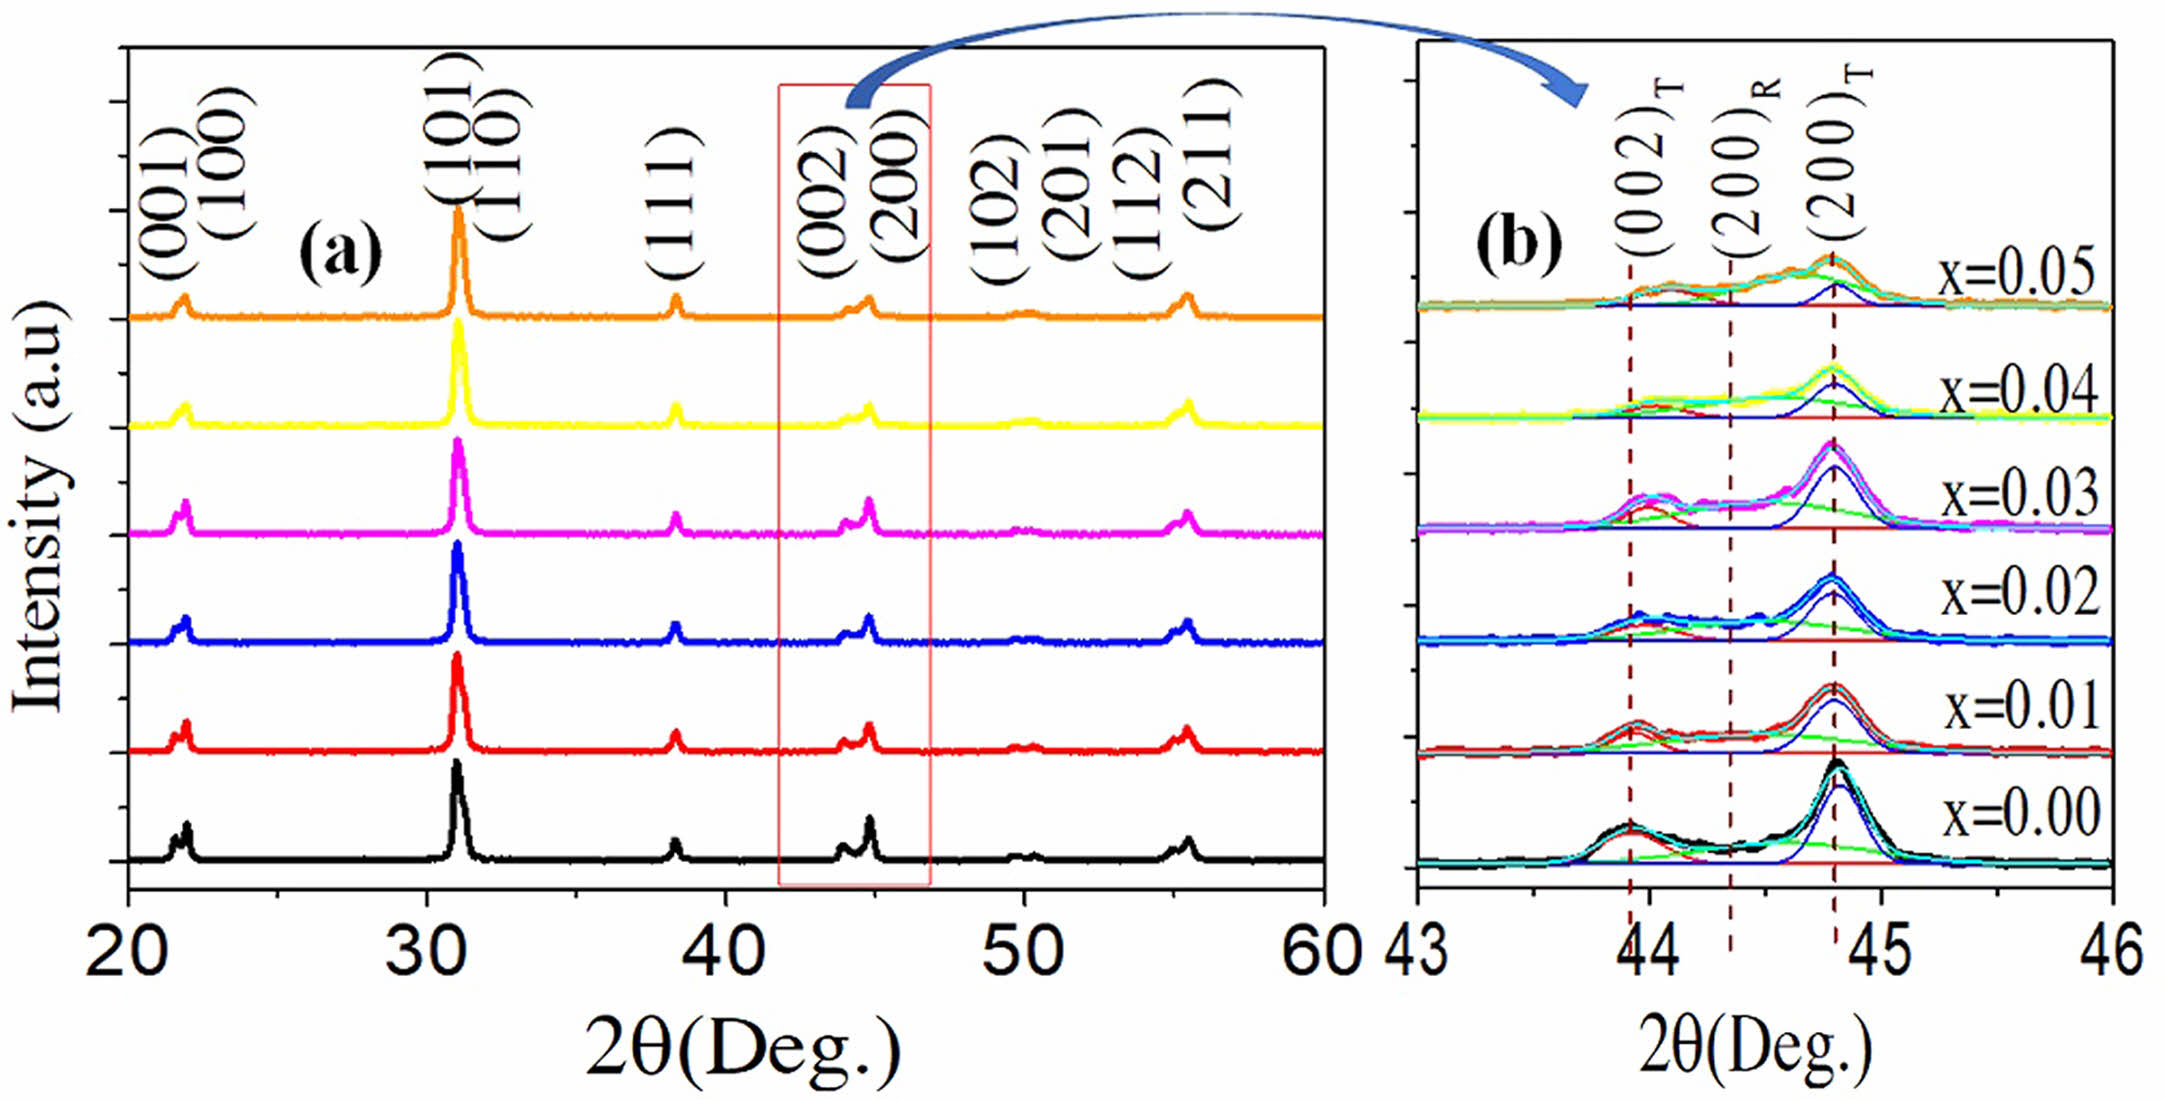
The crystal structures of the PSLZT-BMT samples are shown in Fig. 3(a) as a function of the BMT concentrations in the 2θ range of 20-60°. All samples exhibited typical perovskite structure without any impure phases, indicating that Bi3+ and (Mn1/2Ti1/2)3+ fully diffused into the lattice and formed solutions. Solid solutions were formed with PSLZT [22]. Analysis of the XRD patterns recorded in the ranges of 43-46° (Fig. 3(b)) revealed that in the BMT content range of 0-0.05 mol, the ceramics were characterized by a mixed rhombohedral (R3 m)- tetragonal (P4 mm) phase with (001)T, (100)R, (100)T, and (002)T, (200)R, and (200)T reflections, respectively. The results show that with an increase in the BMT content, the intensity of the (001)T, (002)T peaks decreases and the intensity of the (100)R, (200)R peaks increased. This indicated a phase shift (from tetragonal to rhombohedral) with an increase in the BMT content in the range of 0-0.05 mol. The change in the crystal structure could be related to the substitution of the Bi3+ ions for the A site ions in the perovskite structure. The radius of Bi3+ is smaller than that of Pb2+. Thus, the substitution of the Bi3+ ions for Pb2+ ions entering into the main crystal phase causes shrinkage of the crystal cell and distortion of the crystal lattice [23].
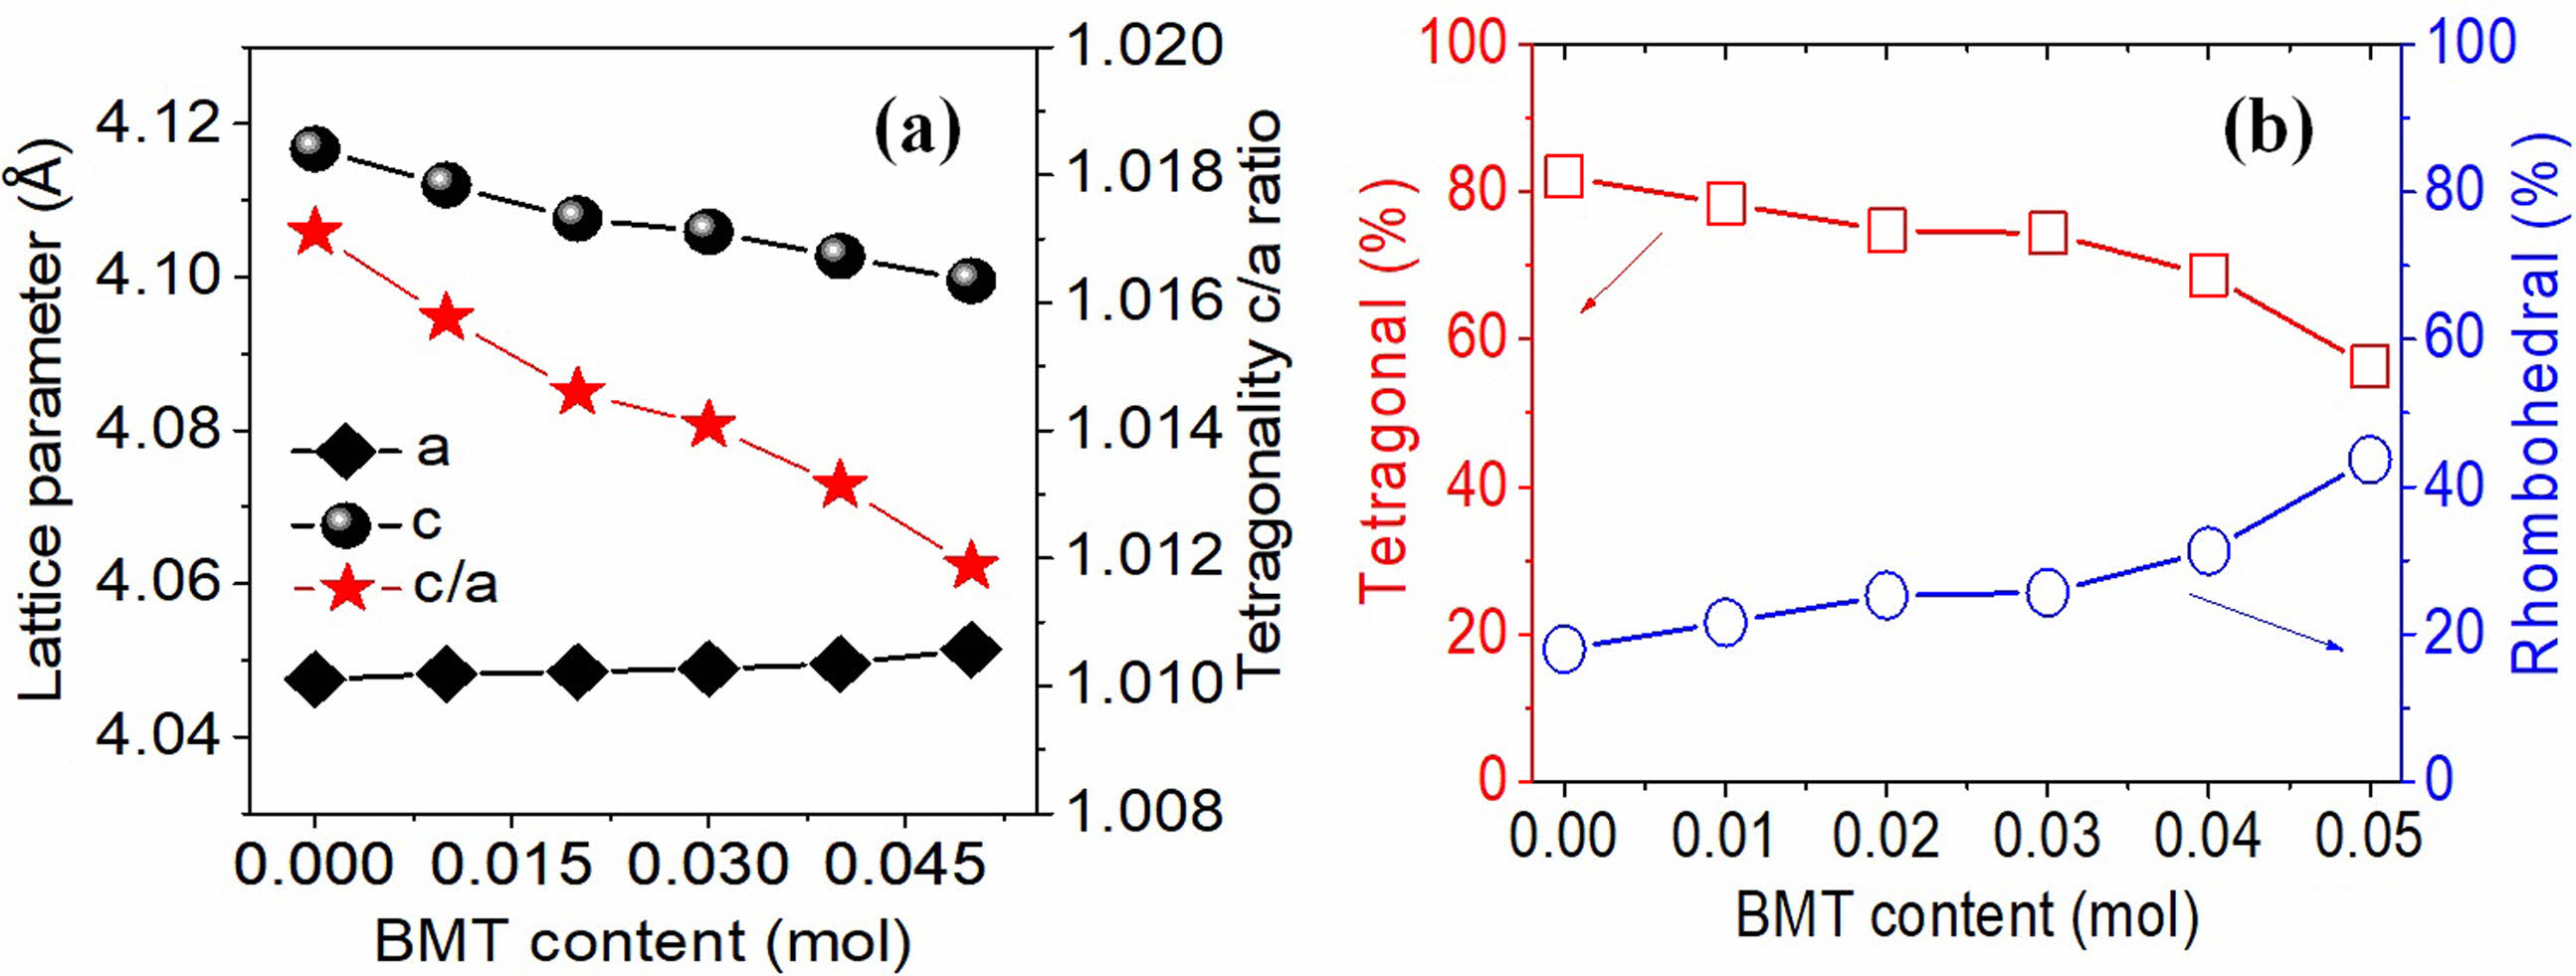
In addition, the lattice constants corresponding to the PSLZT-BMT materials obtained are shown in Fig. 4(a). The results show that the lattice constant (a) increases slightly in the range of 4.0475-4.0514 Å as the concentration of BMT increases from 0.00 to 0.05. The lattice constant (c) decreases under the same conditions. The ratio of the tetragonal phase (c/a) of the material decreases with an increase in the BMT content, which proves that the content of the tetragonal phase decreases under these conditions. The tetragonal and rhombohedral phase content of the PSLZT-BMT materials at different BMT values is shown in Fig. 4(b). The intensities of the overlapping triplet peaks range from (200)T, (200)R and I(002)T in the range 2θ = 43÷46° is used through expression (1) as follows:
The results presented in Fig. 4(b) show that the component without BMT is primarily the tetragonal phase and the rhombohedral phase content is approximately 17.96%. Similar results were reported by Volkan Kalem et al. [24], who co-doped Sr and La and the PbZr0.54Ti0.46O3 ceramics. The increased content of BMT doped into PSLZT induces an increase in the rhombohedral fraction. When the content of impurity in BMT reached x = 0.05 mol, the symmetry of the perovskite structure gradually changed from tetragonal to rhombohedral. The %T and %R were approximately 54.34% and 45.66%, respectively. From these results, it was concluded that the doping of (Mn1/2Ti1/2)3+ in the B site of the formulation of these ceramics shifted the morphological phase transition to the Ti-rich region. The incorporation of Mn2+ into the B site of the perovskite structure stabilized the rhombohedral phase against the tetrahedral phase [3, 11].
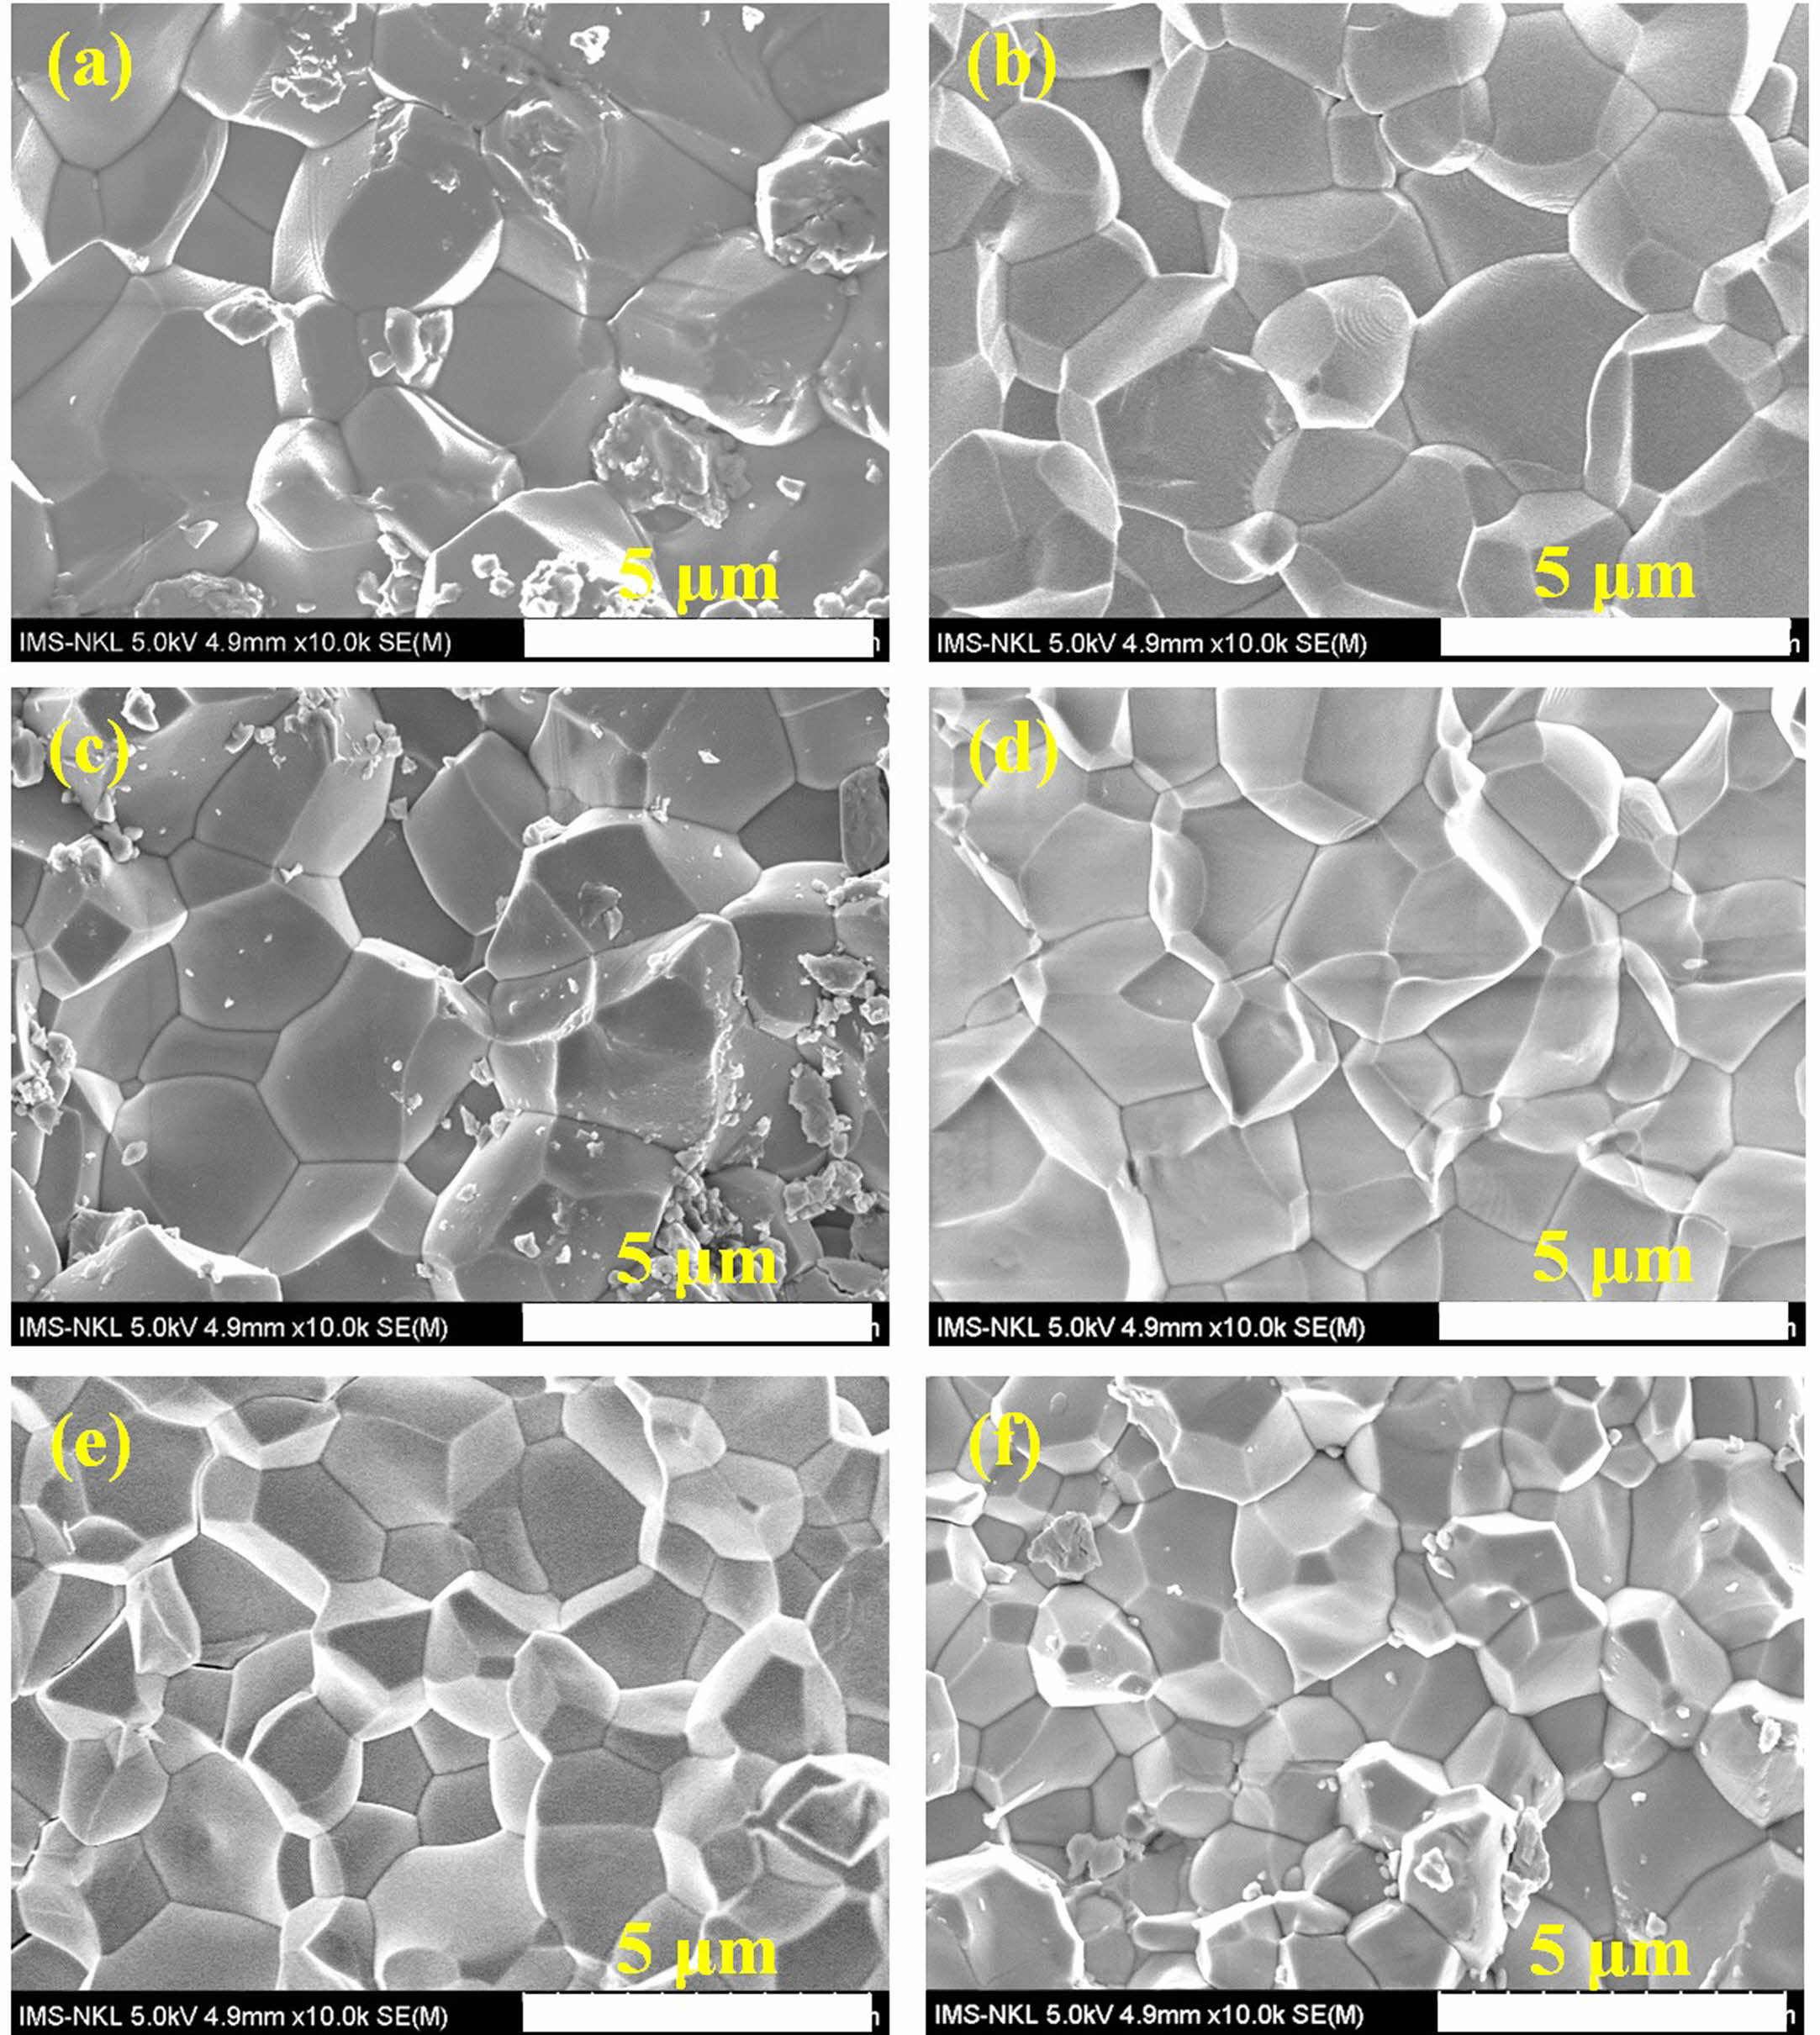
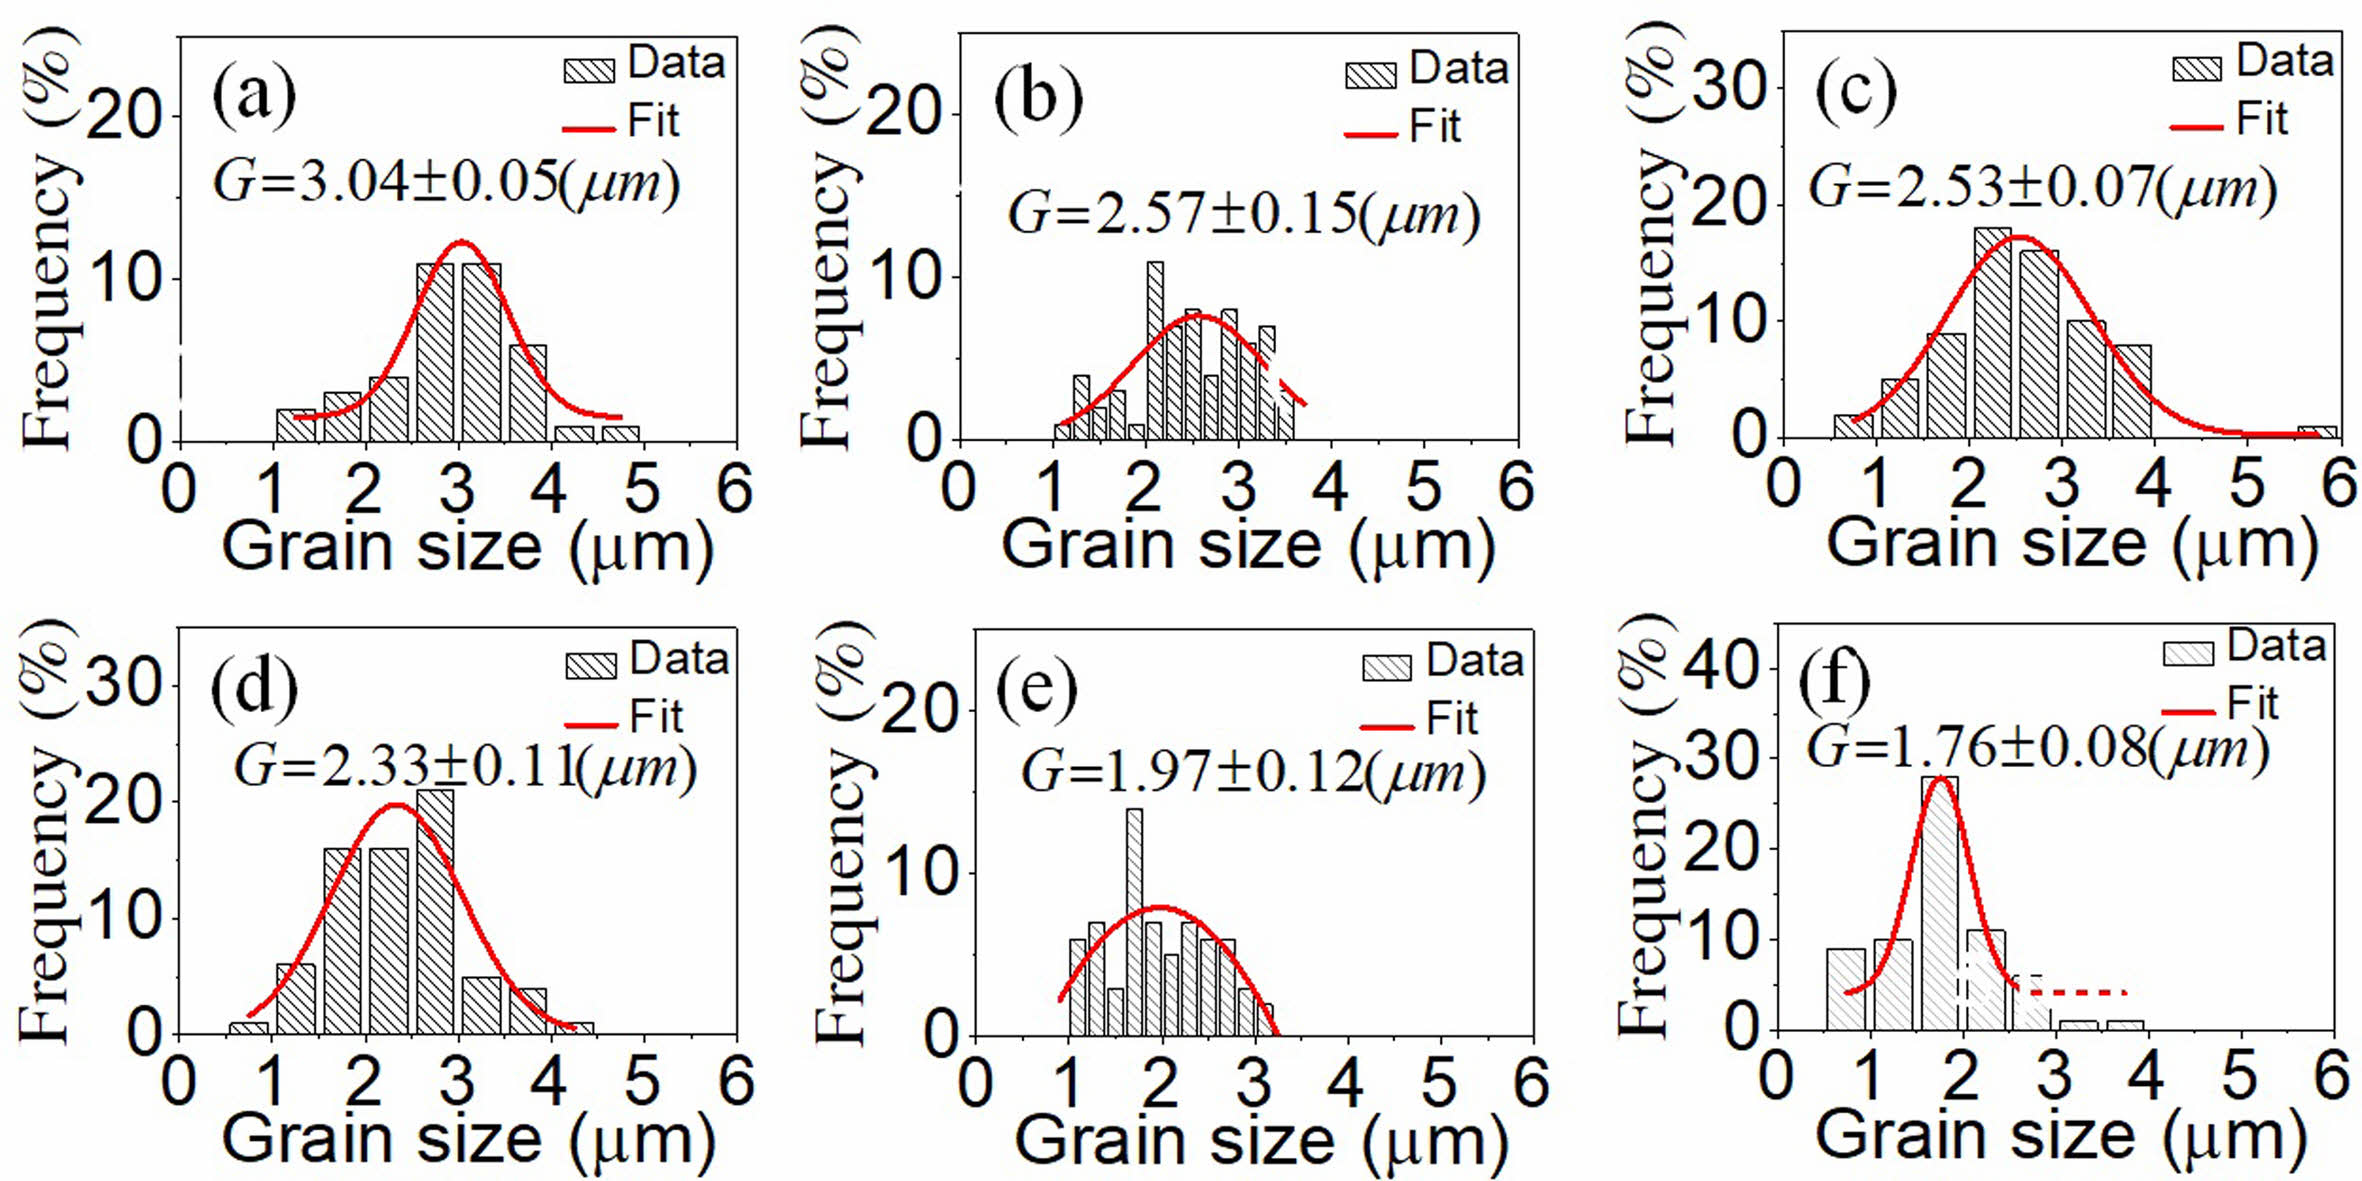
The microstructure and surface morphology of the PSLZT-BMT material components with x = 0-0.05 mol values are presented in Fig. 5(a-f). Simultaneous doping of Bi3+ and Mn2+ affected the microstructure and average grain size of PSLZT materials. PLSZT composition devoid of BMT impurities was studied, and it was observed that the ceramic has good crystallinity with clean grain boundaries. The average grain size was approximately 3.04 mm (Fig. 6(a)). As the impurity content increased, the microstructure of the particles changed, and the average particle size decreased from approximately 3.04 µm to 1.76 µm when x changed from 0.0 mol to 0.05 mol (Fig. 6(a)-(f)). The inhibition of grain growth is attributed to the difficult diffusion process that accompanies the process of Mn-induced lattice contraction [7]. The microstructure accurately reflects the density of the samples (Table 1). The relative density reached the maximum value of approximately 98.48% at the non-BMT component.
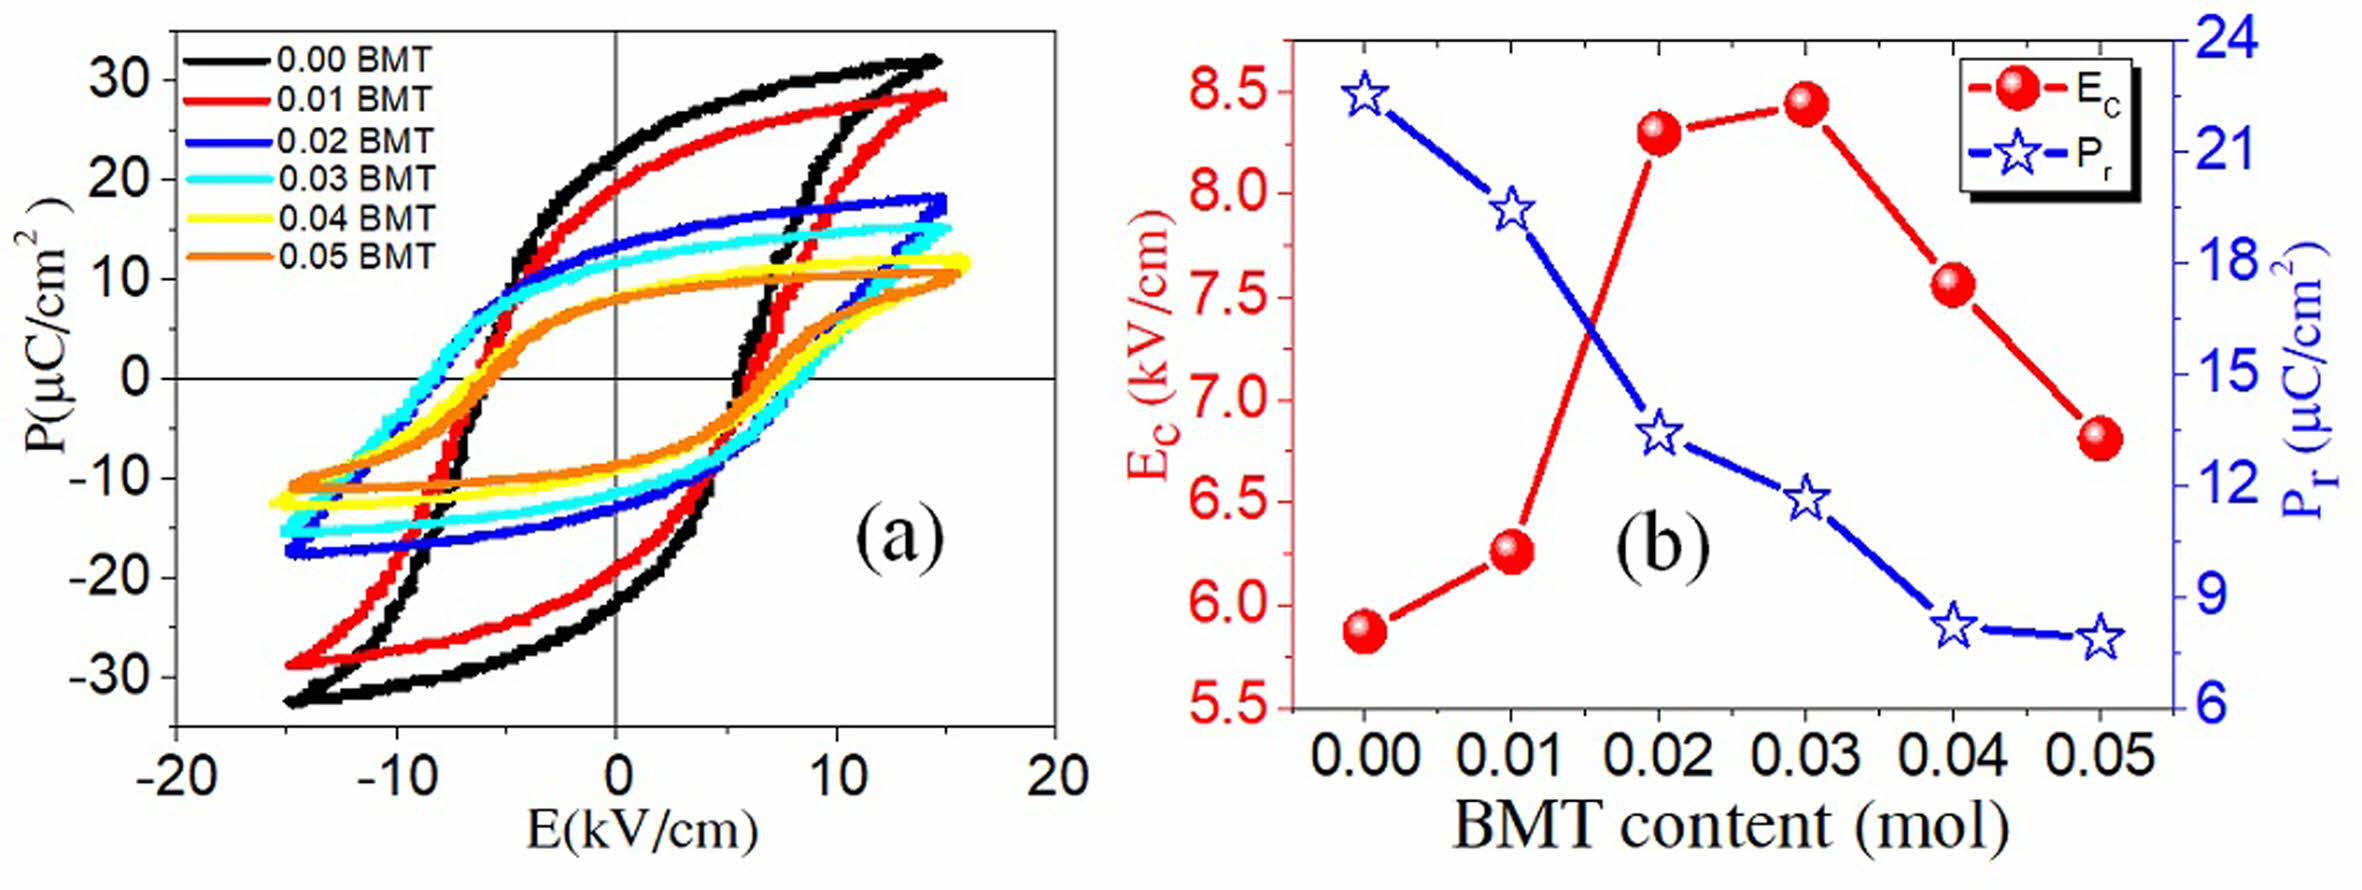
Fig. 7(a) presents the polarization loops versus field delay plots for PSLZT-BMT samples containing varying amounts of doped BMT. It can be seen that all hysteresis loops of the sample exist in a saturation state, which is characteristic of typical ferroelectric materials. For the PSLZT component not doped with BMT, the hysteresis loop is characteristic of soft piezoelectric material with a large residual bias and a small resistive electric field. The changing pattern of residual polarization decreases in the range of 22.54-7.87 µC/cm2 when the BMT concentration is in the range of 0-0.05 mol. At the same time, the resistive electric field value Ec initially increased to 8.44 kV/cm when the concentration was 0.03 mol. Following this, the value decreased as the doping content increased (Fig. 7(b)).
The change in the shape of the ferroelectric hysteresis ring corresponding to the PSLZT-BMT system with an increase in the doping content follows the characteristic of hard piezoelectric ceramics. This is related to the defect dipoles generated by the acceptor ions and the oxygen vacancy generated by the substitution of Bi3+ ions for the A site of Pb2+ and (Mn, Ti)3+ to the B site of (Zr, Ti)4+ ion. Thus, they prevent the orientation of the ferroelectric domains resulting in a reduction in the residual polarization of the material. In addition, oxygen vacancies can also be generated due to the loss of oxygen from the lattice during the process of high-temperature sintering. Oxygen vacancies trapped inside the domain-oriented pinning domain walls cause electrical surges in the resistance field of the material. The particle size reduction effect caused the pinning of the domain wall motion and the decrease in the polarization values.
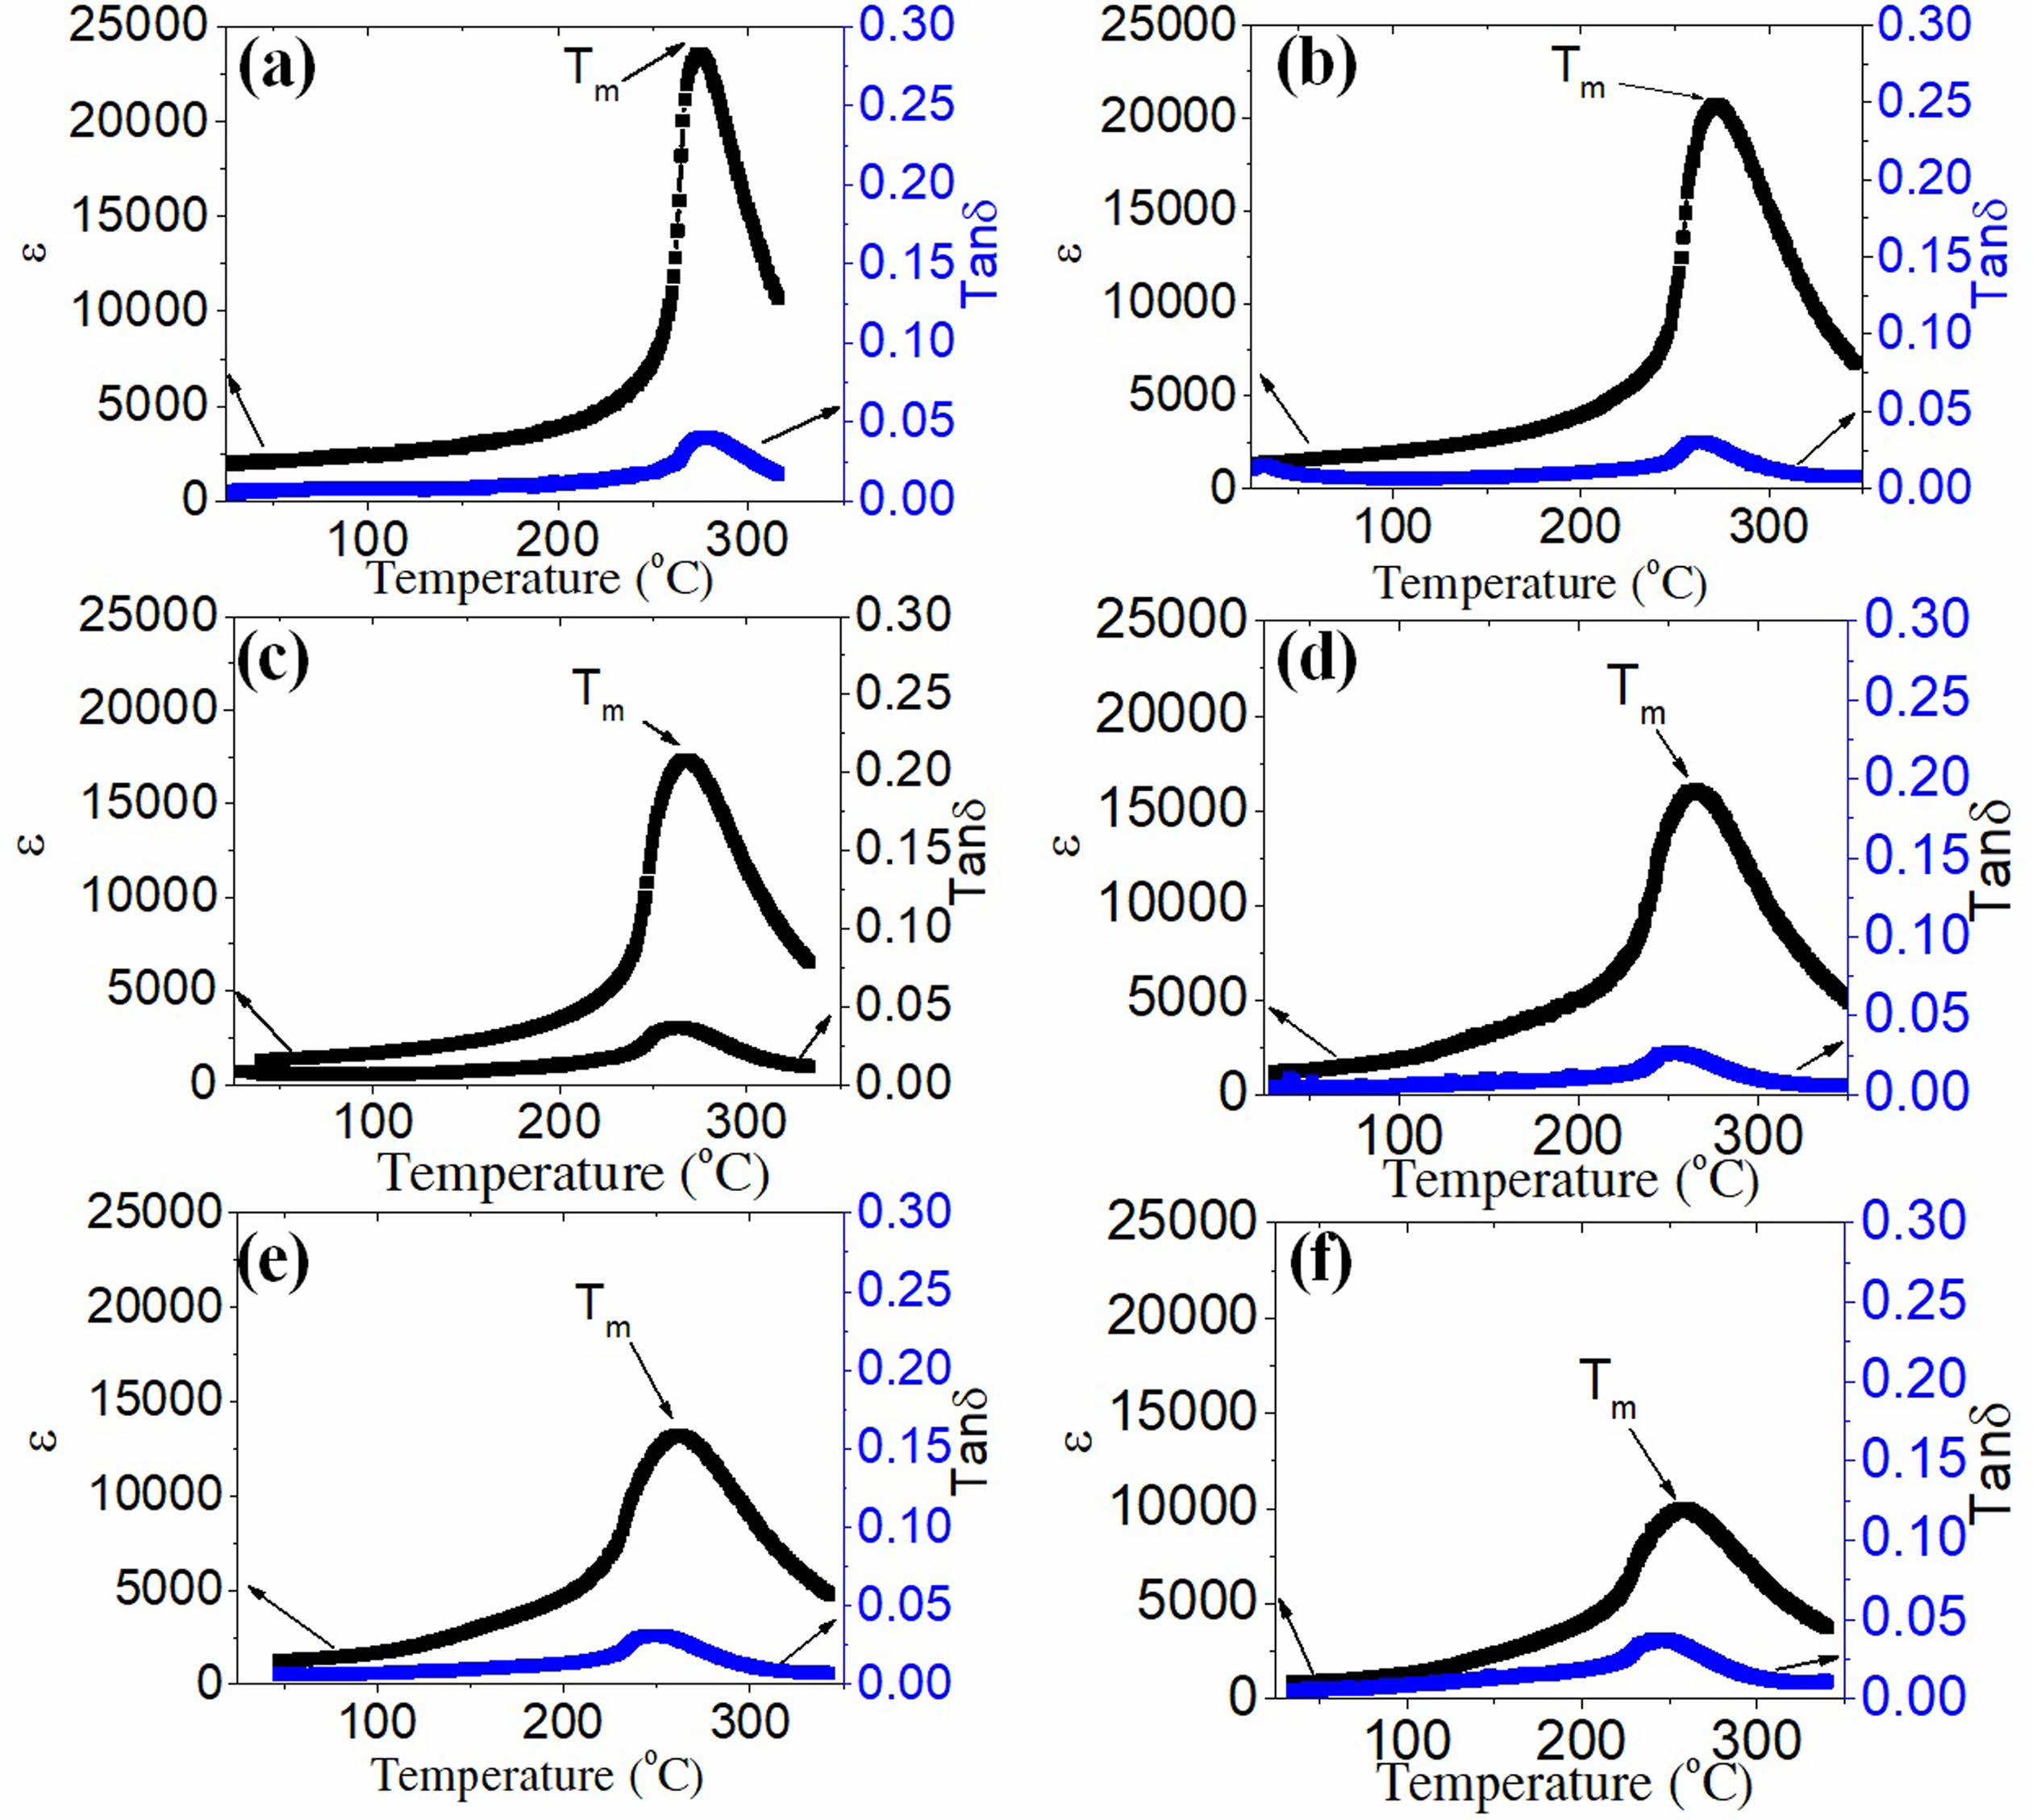
The temperature dependence of the dielectric constant (ε) and dielectric loss (tanδ) of the PSLZT-BMT ceramic samples at 1 kHz is presented in Fig. 8. At 1 kHz, the dielectric constant εmax of PSLZT reached the maximum value of 23579. Following this, the value decreased in the range of 20706-9991 when the doping content increased in the range of 0.01-0.05 mol (Fig. 8(a-f)). The decreasing trend of the dielectric constant ε is thought to be associated with the decrease in the mean grain size, degree of uniformity, and density of the ceramic samples. The high density, large grain size, and improved crystallinity of the ceramic samples result in high dielectric constant. In addition, the width of the peaks ε(T) can be explained by a diffuse phase transition, one of the key features of relaxed ferroelectrics [21]. According to Ullah et al. [34], the high density, large grain size, and improved crystallinity of the ceramic samples result in high dielectric constants.
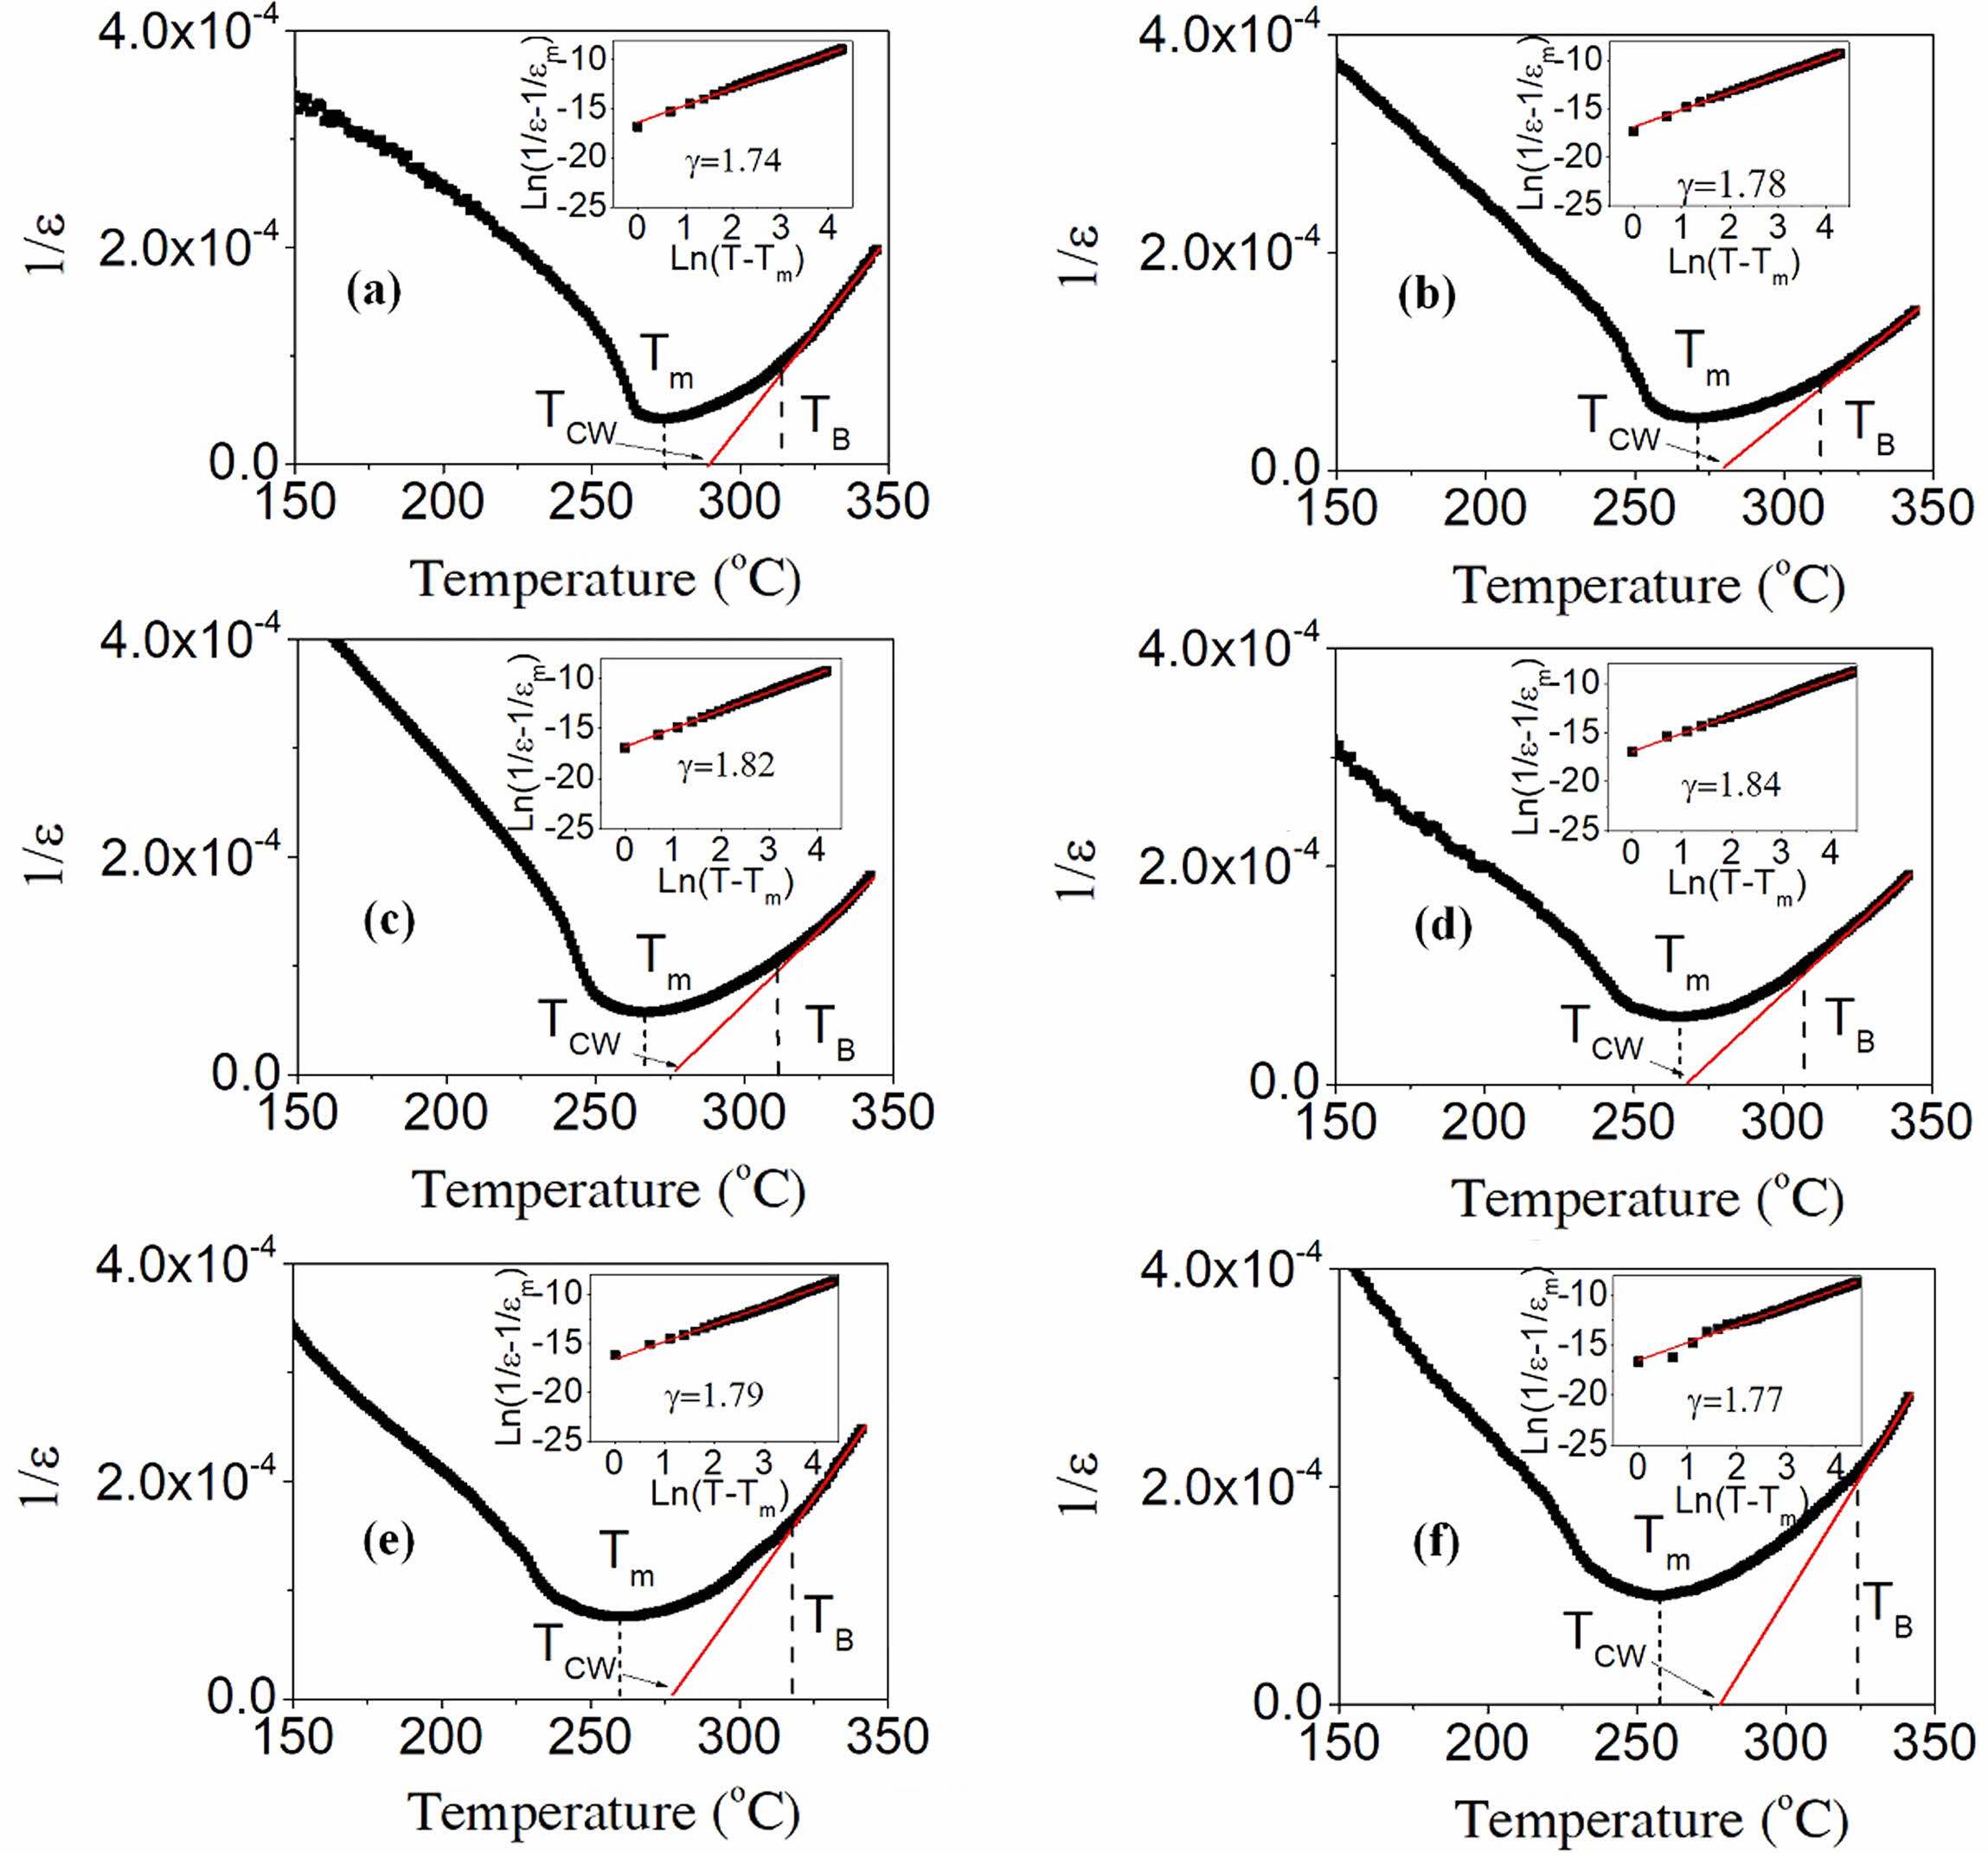
Fig. 9 presents the temperature dependence of the inverse dielectric constant associated with the PSLZT-BMT material. The corresponding matches were obtained using the modified Curie Weiss law as follows [35]:
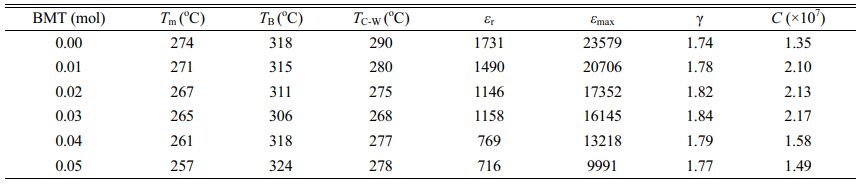
where εmax is the maximum value of the dielectric constant at the phase transition temperature Tm, γ is the degree of diffuseness, and C is the Curie constant. The right-hand corner of Fig. 9(a-f) shows the diffusivity values (γ) evaluated by plotting ln(1/ε - 1/εmax) versus ln(T - Tm) at 1 kHz. The γ values of the PSLZT-BMT material are 1.74, 1.78, 1.82, 1.84, 1.79, and 1.77 when the doping content x varies as 0.0, 0.01, 0.02, 0.03, 0.04, and 0.05 mol, respectively (Table 2). It can be seen that the value of γ increases as the BMT content increases to 0.03 mol. Thus, the process of phase transition becomes more diffuse with an increase in the BMT content, and this can be attributed to larger disturbances in the samples. The observations can be attributed to the diffuse paraelectric-ferroelectric phase transition occurring under conditions of increased γ values. However, the γ value decreased as the BMT content increased. This can be potentially attributed to the fact that the solubility limit of Bi3+ and Mn2+ ions in PSLZT-BMT-based ceramic is approximately 0.03 mol. As the BMT value increases, a fraction of ions located at the grain boundary inhibits grain growth, resulting in structural heterogeneity and a decrease in the γ values. Analysis Fig. 10 yields the values of Tm, TB, TC-W, and Curie constant (C) (Table 2). It can be seen that the values of TB, TC-W, and C depend on BMT concentration. The trend of dependence is the same as the trend observed for g values. The value of the C is calculated to be in the range of 1.35 × 10⁷–2.17 × 10⁷. The phase transition temperature Tm tends to decrease from 274 to 257 as the doping concentration increases in the range of 0-0.05 mol. This can be attributed to the particle size reduction effect of the material.
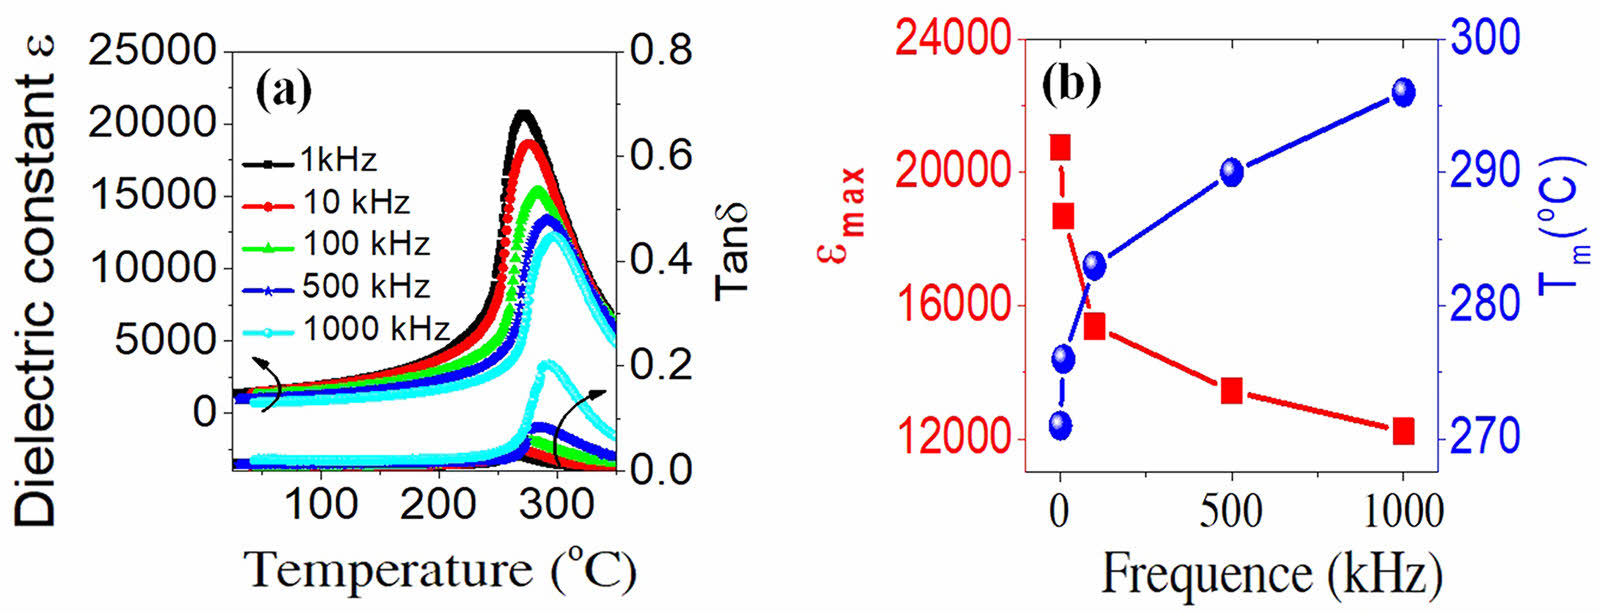
The temperature and frequency dependence of the dielectric constant of the PSLZT-BMT samples is shown in Fig. 10(a). The results show that when the frequency increases in the range of 1-1000 kHz, εmax tends to decrease, and the value moves to a higher temperature region. The dielectric loss increases and shifts toward Tm (Fig. 8). It can be seen that this effect is a typical feature of relaxor materials [2, 25, 26]. This can be potentially attributed to the fact that when the measurements are made at 1 kHz, the total dielectric constant is the sum of the different polarization mechanisms, including directional polarization, spatial charge polarization, electronic polarization, and recovery polarization. However, when the measurement frequency is high, the contributions of directional polarization, spatial charge polarization, and relaxation polarization decrease. Under these conditions, the electronic polarization primarily contributes to the total dielectric constant, resulting in a decrease in the ε value (Fig. 10(b)).
|
Fig. 1 TG/DTA curve of PSLZT-BMT powder. |
|
Fig. 2 X-ray diffraction pattern of PSLZT-BMT materials under different calcination conditions. |
|
Fig. 3 XRD patterns of PSLZT-BMT ceramics at various contents of BMT: (a) 2θ=20°÷60°, and (b) 2θ=43°÷46° |
|
Fig. 4 (a) The lattice constants (a, c) and the tetragonal ratio c/a; (b) the tetragonal and rhombohedral phase content as a function of the BMT content. |
|
Fig. 5 Surface morphologies of the PSLZT-BMT ceramics at various contents of BMT: (a) x = 0.00 mol, (b) x = 0.01 mol, (c) x = 0.02 mol, (d) x = 0.03 mol, (e) x = 0.04 mol, and (f) x = 0.05 mol. |
|
Fig. 6 The grain size distribution of the PSLZT-BMT ceramics at various contents of BMT: (a) x = 0.00 mol, (b) x = 0.01 mol, (c) x = 0.02 mol, (d) x = 0.03 mol, (e) x = 0.04 mol, and (f) x = 0.05 mol. |
|
Fig. 7 (a) Hysteresis loops of PSLZT-BMT samples and (b) Pr and Ec as a function of BMT content. |
|
Fig. 8 Temperature-dependent dielectric constant ε and dielectric loss tanδ recorded measured at 1 kHz for the PSLZT-BMT ceramics. |
|
Fig. 9 Curie-Weiss dependence of the dielectric constant of the PSLZT-BMT materials. |
|
Fig. 10 Temperature and frequency-dependence of dielectric constant and dielectric loss of the PSLZT-BMT materials at 1, 10, 100, and 1000 kHz. |
|
Table 1 Density, relative density, densification, and total shrinkage of PSLZT-BMT ceramics as a function of the BMT content. |
A group of piezoelectric ceramic components (1-x) [(Pb0.94Sr0.05La0.01)(Zr0.54Ti0.46)0.9975O3]-x[Bi(Mn1/2Ti1/2)O3] with x in the range of 0-0.05 mol was successfully synthesized;
The content of BMT contributes to the changes in the phase structure of the material. The mixed tetrahedral phase transformed into the rhombohedral phase, and the dominant tetrahedral phase transformed into the dominant rhombohedral phase;
The experimental results show that the dielectric and ferroelectric properties of PSLZT-BMT ceramics tend to decrease, specifically the εmax o decreased in the range of 23579-9991 and the Pr decreases in the range of 22.54-7.87 µC/cm2 when the doping content increased in the range of 0.0-0.05 mol;
The diffusivity values (γ) of the PSLZT-BMT material are 1.74, 1.78, 1.82, 1.84, 1.79, and 1.77 when the doping content x varies as 0.0, 0.01, 0.02, 0.03, 0.04, and 0.05 mol, respectively, which is characteristic of relaxor ferroelectric materials. Besides, the Tm, TB, TC-W, and C values depend on BMT concentration, and the trend decreases.
This work was carried out in the framework of the National Project in Physics Program until 2025 under No. ÐTÐLCN.34/23.
- 1. .A. Quang and L.D. Vuong, J. Sci. Adv. Mater. Dev. 7 (2022) 100436.
-

- 2. L.D. Vuong, J. Mater. Sci. Mater. Electron. 33 (2022) 6710-6721.
-
- 3. A. Sachdeva, Aarushi, J.K. Anand, and R.P. Tandon, J. Ceram. Process. Res. 23 (2022) 817-822.
-
- 4. B. Cherdhirunkorn, B. Pidthong, P. Jeamwutthisak, D.A. Hall, M. Shuaib, and T. Tunkasiri, J. Ceram. Process. Res. 13 (2012) s323-s327.
- 5. K.-M. Kim, S.-H. Lee, B.-J. Park, J.-S. Park, and S.-G. Lee, J. Ceram. Process. Res. 23 (2022) 29-32.
-
- 6. H.-T. Kim, J.-H. Ji, B.S. Kim, J.S. Baek, and J.-H. Koh, J. Eur. Ceram. Soc. 9 (2021) 1083-1090.
-
- 7. V. Kalem and M. Timucin, J. Eur. Ceram. Soc. 33 (2013) 105-111.
-
- 8. L.D. Vuong, P.D. Gio, N.D.V. Quang, T.D. Hieu, and T.P. Nam, J. Mater. Sci. 47 (2018) 5944-5951.
-
- 9. L.D. Vuong and P.D. Gio, J. Mod. Phys. 05 (2014) 1258-1263.
-
- 10. B. Cherdhirunkorn, S. Surakulananta, J. Tangsritrakul, D. Hall, and S. Intarasiri, Results Phys. 16 (2020) 102851.
-
- 11. A. Sachdeva, Aarushi, J.K. Anand, and R.P. Tandon, J. Ceram. Process. Res. 23 (2022) 99-108.
-
- 12. S.-W. Kim and H.-C. Lee, Mater. 15 (2022) 7070.
-
- 13. J. Ye, G. Ding, X. Wu, M. Zhou, J. Wang, Y. Chen, and Y. Yu, Mater. Today Commun. 34 (2023) 105135.
-
- 14. N.T. Tho and Hu. U. J. Sci. Nat. Sci. 129 (2020) 5-13.
- 15. K.P. Rema and V. Kumar, J. Amer. Ceram. Soc. 91 (2008) 164-168.
-
- 16. N. Truong-Tho and D. Le Vuong, J. Mater. Sci. Mater. Electron. 32 (2021) 16601-16611.
-
- 17. N. Truong-Tho and L.D. Vuong, J. Adv. Dielect. 10 (2020) 2050011.
-
- 18. M.S. Alkathy, A. Hezam, K.S.D. Manoja, J. Wang, C. Cheng, K. Byrappa, and K.C. James Raju, J. Raju, J. Alloy. Compd. 762[25] (2018) 49-61.
-
- 19. L.D. Vuong and P.D. Gio, J. Alloy. Compd. 817 (2020) 152790.
-
- 20. L.D. Vuong, V.T. Tung, and P.D. Gio, IntechOpen, 2020.
- 21. E. Şahin, J. Ceram. Process. Res. 24 (2023) 190-196.
-
- 22. W. Liu, Y. Cao, J. Wang, Y. Wang, X. Xi, and J. Yang, Mater. Sci. Eng. B 263 (2021) 114847.
-
- 23. J. Chen, Z. Xu, and X. Yao, Mater. Res. Innov. 14 (2010) 234-237.
-
- 24. V. Kalem, I. Çam, and M. Timuçin, Ceram. Int. 37 (2011) 1265-1275.
-
- 25. L.D. Vuong, D.A. Quang, V.T. Tung, N.H. Chuc, and N.N. Trac, J. Mater. Sci. Mater. Electron. 31 (2020) 18056-18069.
-
- 26. D.A. Tuan, L.D. Vuong, V.T. Tung, N.N. Tuan, and N.T. Duong, J. Ceram. Process. Res. 19 (2018) 32-36.
-
 This Article
-
2023; 24(3): 478-485
Published on Jun 30, 2023
- 10.36410/jcpr.2023.24.3.478
- Received on Jan 19, 2023
- Revised on Apr 3, 2023
- Accepted on Apr 5, 2023
Services
- Abstract
introduction
experimental
results and discussion
conclusions
- Acknowledgements
- References
- Full Text PDF
Shared
Correspondence to
- Le Dai Vuong
-
School of Engineering and Technology - Hue University, Hue City, Vietnam
- E-mail: ldvuong@hueuni.edu.vn, thinhdhdn@gmail.com
Clean-Energy Research Institute(CRI), Hanyang University, 222, Wangsimni-ro, Seongdong-gu, Seoul, 04763, Korea
E-mail: jcpr@hanyang.ac.kr