


- Design and optimization of turbonator using blade element theory
K. Selvarasua,* and R. Mohanb
aResearch Scholar, Department of Mechanical Engineering, Sona College of Technology, Salem, Tamilnadu, India
bAssociate Professor, Department of Mechanical Engineering, Sona College of Technology, Salem, Tamilnadu, IndiaThis article is an open access article distributed under the terms of the Creative Commons Attribution Non-Commercial License (http://creativecommons.org/licenses/by-nc/4.0) which permits unrestricted non-commercial use, distribution, and reproduction in any medium, provided the original work is properly cited.
Due to the quick increase in automobile usage, there is currently an ecological imbalance brought on by air pollution that is getting worse by the hour. Car exhaust gas emissions must be reduced, and better fuel combustion is a necessity. Despite the short amount of time needed for combustion, no fuel is burned, and all of the fuel returns as exhaust. In order to prevent this, the burning of diesel engines results in a sufficient mass of air in the air-fuel mixture (lean mixture), which leads to cheap fuel intake and greater volumetric efficiency. A supercharger, more specifically a turbocharger, increases the diesel engine's volumetric efficiency. However, installing a turbocharger in a vehicle engine demands extra room, size, and maintenance. As a result, a Turbonator is added to the diesel engine's air intake manifold, creating swirl in the cylinder-air flow. The enhancement of IC engine efficiency has been conceded by the reduction of fuel consumption and emission levels. Many researchers worked in the alternate fuel system, design modification in the intake manifold, piston, engine cylinder, turbocharger system, etc. The turbocharger system helps to reduce the emission level of diesel engines in current trends. In this research, emission reduction and engine performance are improving by introducing turbonator fitted into the intake manifold. The design of turbonator is designed by Blade Element Theory (BET), which generates a swirl in the flow of air into the cylinder. The number of blades in turbonator has varied as 4, 8, & 12 respectively for a better outcome. The experimental load test is carried out in the KIRLOSKAR TV-I engine for 10 cc of fuel consumption to prove the turbonator performance. The turbonator with 4 blades gives a better performance than it suitable to implement into the diesel engine intake
Keywords: Diesel engine, Turbonator, Engine efficiency, Emission parameters, Performance test, Emission test
People's need for transportation is increasing, thus more vehicles are running on the roadways. As a result, there were many emissions from vehicles. In order to boost the air flow during suction strokes, vehicle engines are typically connected with turbochargers. When the turbine, which is connected to a compressor by the turbine shaft, is driven by exhaust fumes. Variations in flow are caused by the reduction in turbine and compressor speed that occurs during combustion and power strokes. Since the compressor is more susceptible to changes in mfr (mass flow rate) and pressure ratios than the turbine, compressor surge can lead to instability issues with turbochargers. Operating an IC engine while there is a compressor surge is known to cause the flow to cylinders to cease, which results in a loss of power and can also generate engine knocks. Additionally, compressor surge can damage engine parts and generate vibrations, which raises the cost of maintenance. The air intake manifold modification alternatives were researched using Turbonator to avoid this issue. The purpose of a turbonator is to charge an engine by creating a swirl that expands the engine's air intake. Air with the highest velocity rushes into the engine as a result of the pressure drop inside the cylinder, which causes turbulence that lowers the velocity in the air-intake manifold. In a turbonator, a number of static blades are arranged in a configuration that is opposite to that of aero-fan turbines. These blades are made to produce an air vortex in the air-intake manifolds, with the swirly air being created during the suction and compression strokes. The efficiency of the combustion of the intake fuel should be increased in this way. Today, diesel engines have been used in heavy-duty applications; because of their higher fuel efficiency, it has only become common in light-duty applications over the past decade. However, the development of diesel engine design continues due to its emission factor. This research deals with the implementation of turbonator device instead of a turbocharger to reduce emissions and improve engine efficiency as well. In order to prove this, the load test and emission test were carried out in the single-cylinder IC engine (KIRLOSKAR TV-1) for different blades of turbonator attachment. The type of flow entering through the inlet manifold also depends on the combustion occurring in the cylinder. Chirag V. Kapuria and Dr. Pravin P. Rathod [1] investigated this leads to uniform complete combustion thereby improving performance and emission reduction by modified intake manifold [900]. There are options to adjust the geometry of the inlet manifold to increase the engine's efficiency and emissions. Dipak C. Talele et al. [2] The effects of air induction system architecture on the efficiency of compression ignition engines has been checked. [3] K. Kannan and M. Udayakumar have reported that the effect of the combustion of water-emulsified diesel fuel on the thermal performance of the brakes, the basic fuel consumption of the brakes and the emissions of NOx and hydrocarbons in the diesel engine. Also Ganesan et al were investigated the emission characteristics of HC, CO, NOx, etc by AVL smoke meter in single cylinder four-stroke engine. The same diesel engine emission and performance were analyzed for alternate fuel, Mohan et al.
Prasad and Pandurangadu focused on the impact of air swirl produced by directing air flow in the intake manifold on engine performance. By changing the pitch of the helical groove inside the intake manifold from 2 mm to 10 mm in increments of 2 mm, several configurations are tested. In comparison to other diesel engine layouts, the MM8 arrangement improves turbulence and, as a result, the process of mixing air and fuel. Soot emission and SFC are decreased, and thermal efficiency is raised as a consequence. Murali Krishna et al studied that the features of a single-cylinder engine's in-cylinder fluid flow field to examine the impact of intake manifold tilt at equivalent rated engine speed under various static intake valve lift situations. The engine's metal cylinder was swapped out with a transparent one to make the PIV tests more convenient. 50 picture pairs were taken and put via DAVIS software processing for each operational test circumstance. According to the findings, intake manifold inclinations independent of intake valve lift have a significant impact on the in-cylinder flow structure. Regardless of inclination, complete intake valve lift produced the most maximum turbulent kinetic energy (TKE).
The flow parameters emanating from the entrance of the intake port in the cylinder were experimentally analyzed by yasar et al. High-image-density PIV enabled the collection of instantaneous and averaged vorticity and velocity patterns, showing the specifics of the flow parameters in the cylinder cavity. This measurement method makes it feasible to investigate how intake valve shape affects flow characteristics. The outcomes demonstrated that the conceptual layout of the intake valve port was responsible for the significant changes in flow structure during the cylinder stroke.
• The focus of this study is to enhance engine performance and reduction of emission levels by turbonator fitted into the suction of the cylinder. The turbonator should be designed and developed for various geometry based on the aerodynamics Blade Element Theory (BET).
• The diesel engine performance test to be carried out in the KIRLOSKAR engine for maximum load conditions. The emission test also to be carried along with load tests.
• The smoke analyzer should be interface with engine exhaust to find the level of emission norms of CO, CO2, HC, NOx, etc.
• The emission range should be tested 10 cc of fuel consumption at each load condition.
• To validate the results of 6 different blades of turbonator and predict the best alternative.
Turbonator is a device to charge the engine that increases the breadth of the engine by inducing a swirl into the engine. Due to pressure drop inside the cylinder, air with maximum velocity enters into the engine; hence, turbulence effect would reduce the velocity in the air-intake manifold. To overcome this problem, the modification option in the air-intake manifold is studied and suggested a Turbonator. In Turbonator a series of static blades places diametrically similar to aero-fan turbines, blade is designed to produce a vortex flow of air in Air-Intake Manifolds.
Design Theory of Turbonator
Turbonator design begins with a selection of twist angle, height and number of blades by using BET (Blade Element Theory), which emphasizes the procedure relevant to aerodynamic parametric concerns. The way objects move through the air is called aerodynamics. Aerodynamic principles describe how an aeroplane can fly. Aerodynamics affects everything that moves through the air, from a rocket taking off to a kite flying. Even automobiles are impacted by aerodynamics since they are surrounded by air. A theory called blade element momentum theory combines momentum theory with blade element theory. It is employed to compute the regional forces acting on a wind turbine or propeller blade. The calculation of the induced velocities at the rotor is made easier by combining momentum theory and blade element theory. Although the focus of this article is on ground-based wind turbines, propellers can also use BEM. A wind turbine expands the stream tube area while a propeller contracts it. The Rankine-Froude "momentum" or "actuator disc" model is a highly simplified but usable approximation for either application. In this article, the "Betz limit" is applied to the effectiveness of a ground-based wind turbine.
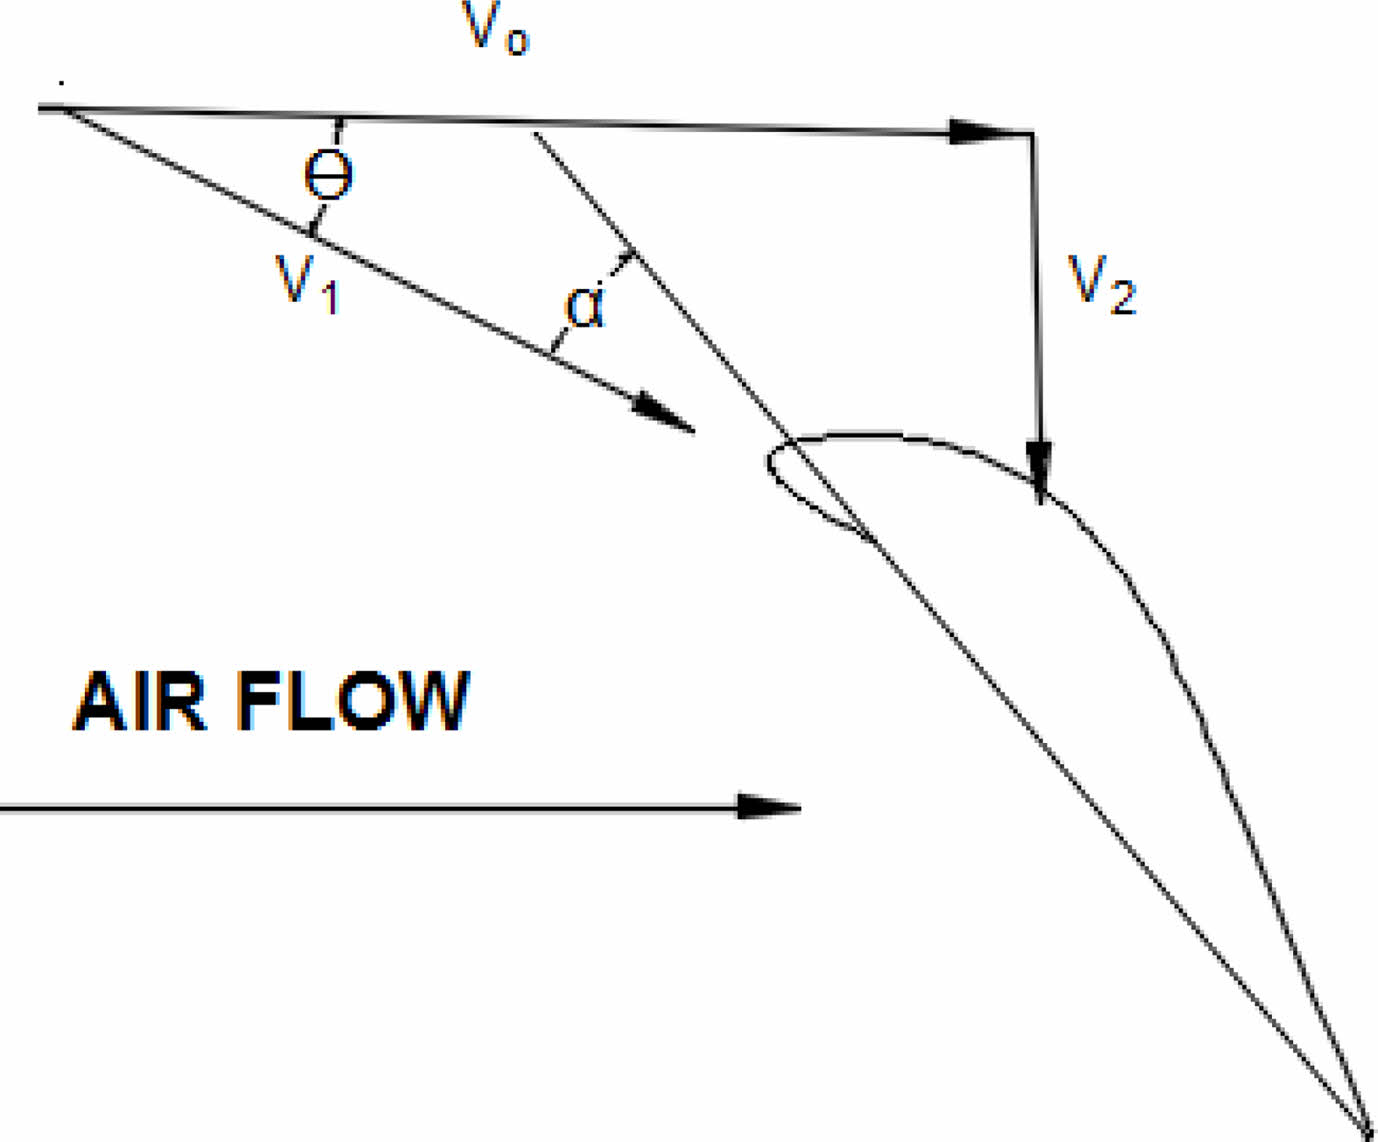
The Blade Element Theory highlights a simple method of predicting the performance of a Turbonator blade, in this theory the blades are divided into several impartial sections along the length and parameters is shown in Fig. 1.
Therefore, the selection of blade parameters is the primary work involved to complete the design process, which is followed by the structural concern.
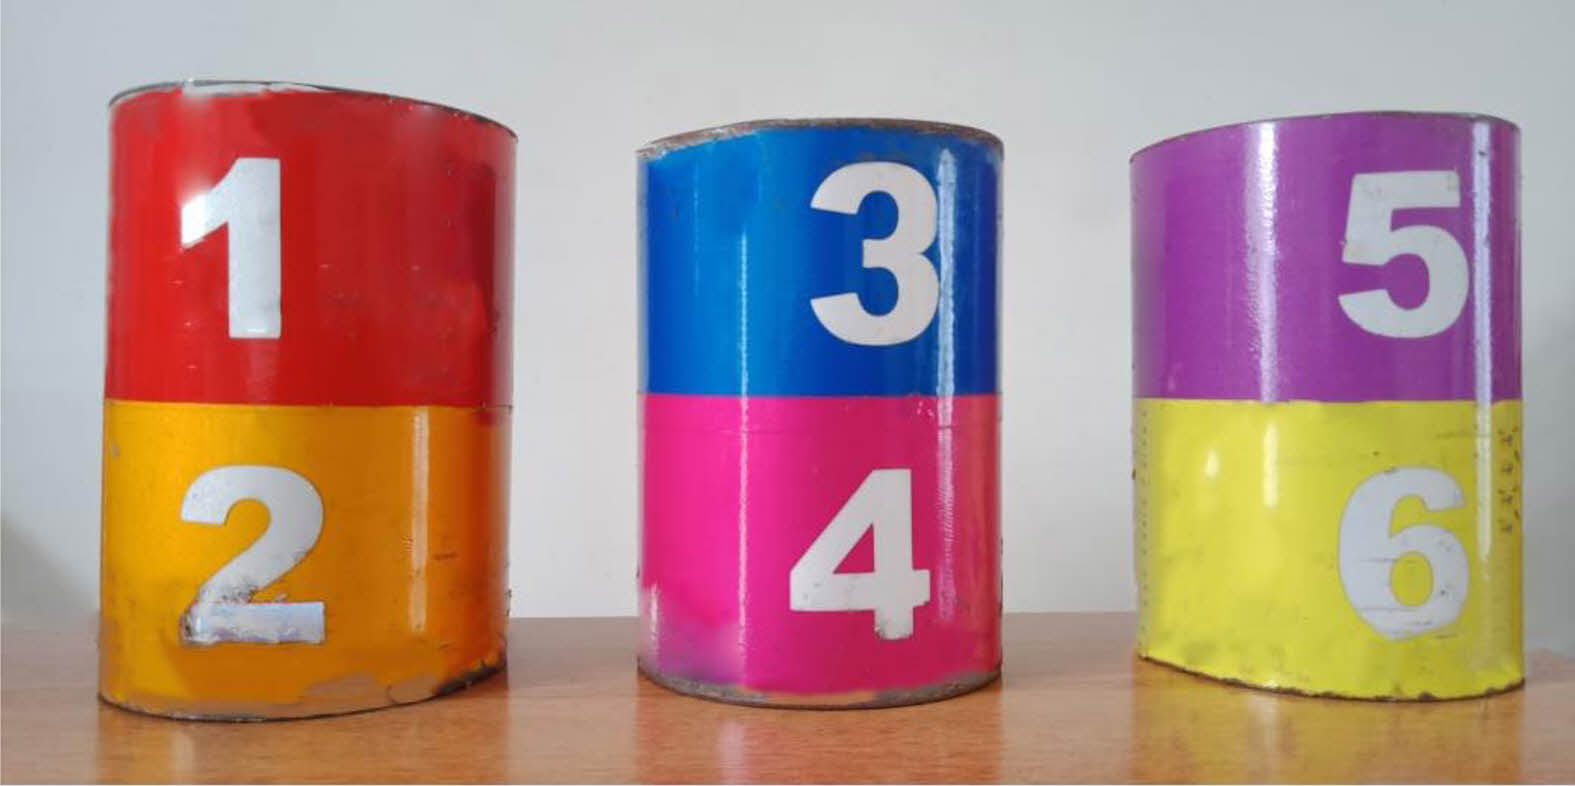
• Turbonator 1 (8 blades O-C)
• Turbonator 2 (8 blades C-O)
• Turbonator 3 (4 blades C-O)
• Turbonator 4 (4 blades O-C)
• Turbonator 5 (12 blades O-C)
• Turbonator 6 (12 blades C-O)
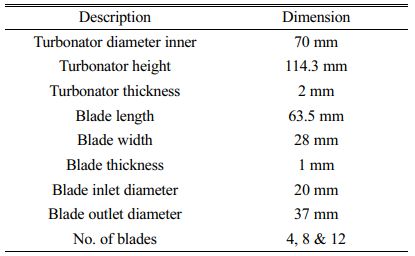
Based on this condition, the turbonator model has been fabricated which represents in Fig. 2 and dimension of turbonator in Table 1.
|
Fig. 1 Resultant Flow Vectors of Turbonator Blade. |
|
Fig. 2 Turbonator. |
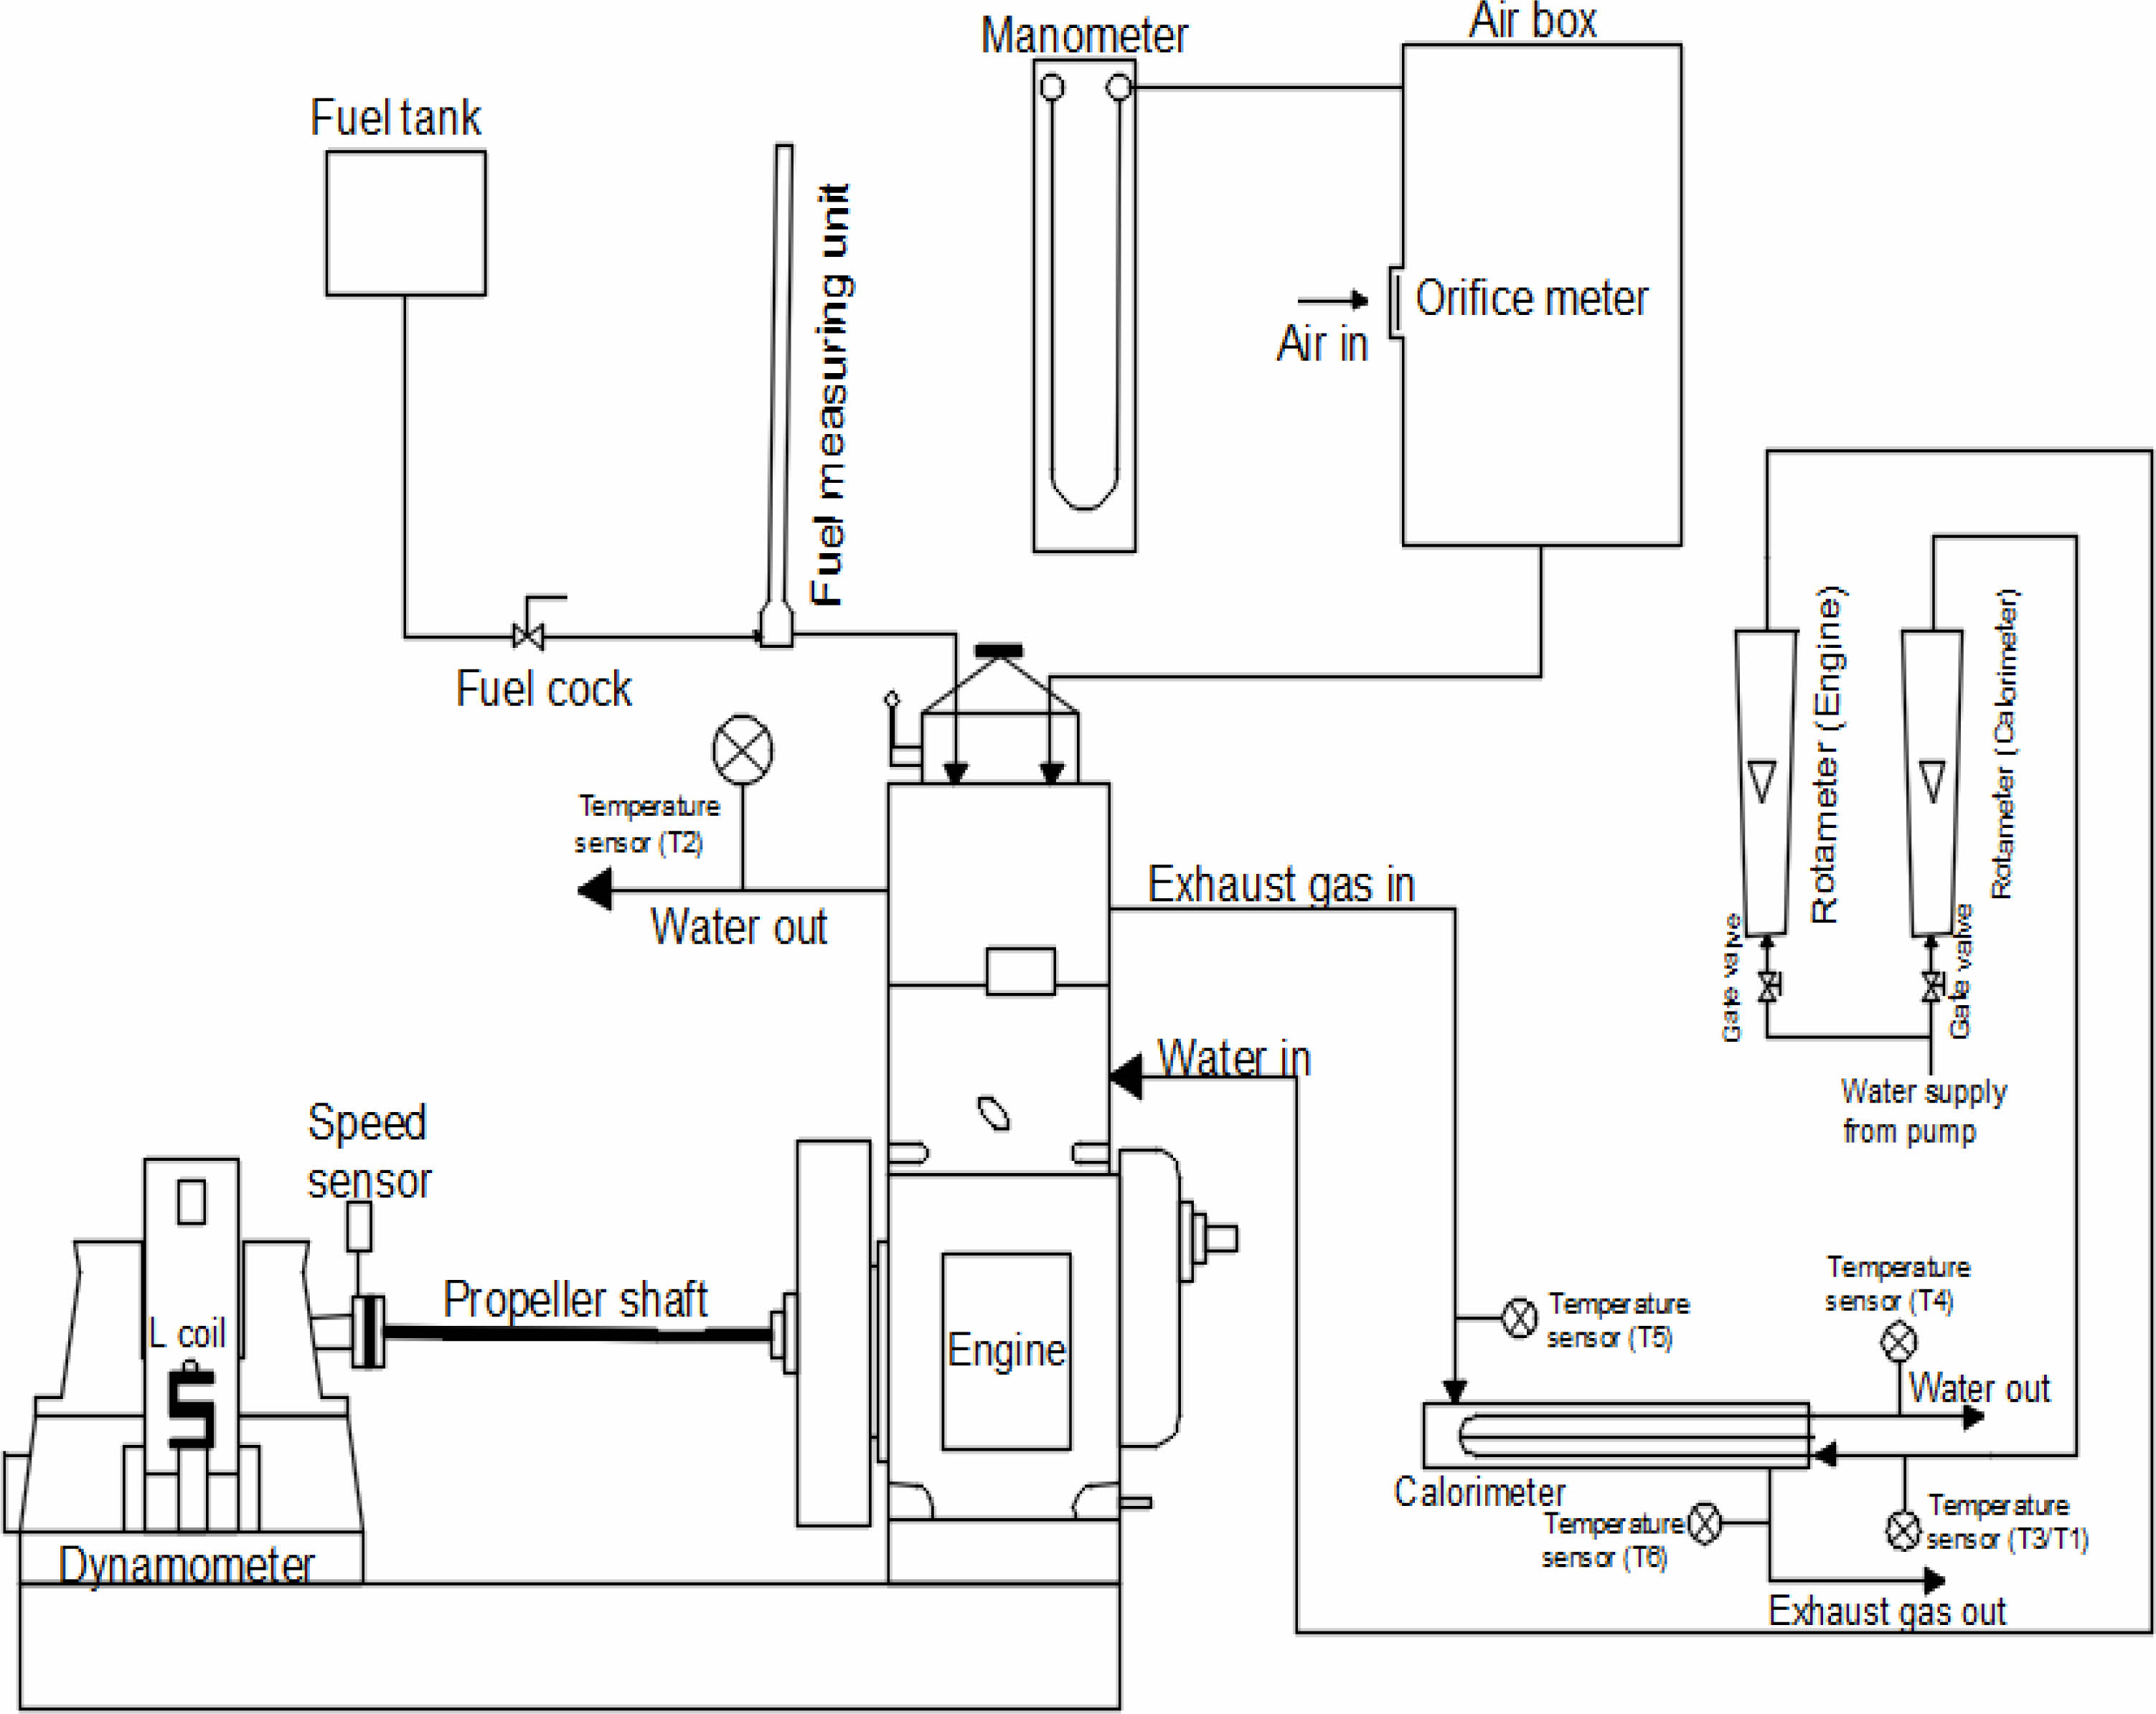
A single-cylinder four-stroke engine (Kirloskar TV-I) naturally aspirated direct-injection water-cooled diesel engine test rig will perform the experimental test. The turbine is directly coupled to the dynamometer of the Eddy current. A control panel is attached to the engine and the dynamometer. It states the time taken for 10 ml of fuel consumption. The engine parameter Brake thermal efficiency are determined by the use of fuel mass, fuel calorific value and time per 10 ml consumption, the brake specific energy consumption. Exhaust gas is passed through an ice path to separate moisture as per the test procedure given in the AVL gas analyzer. The experimental setup configuration is seen in
Fig. 3. For calculating pollution parameters and smoke volume, an AVL exhaust gas analyzer and an AVL smoke meter are used. To test exhaust temperature, coolant temperature, and inlet air temperature, thermocouples are used. The specifications are listed below:
Engine name – Kirloskar TV-I Engine
Engine type – Single Cylinder, 4 – Stroke
Fuel - Diesel
Speed - 1500 RPM
BP - 5.2 kw
Bore Diameter - 87.5 mm
Stroke length -110 mm
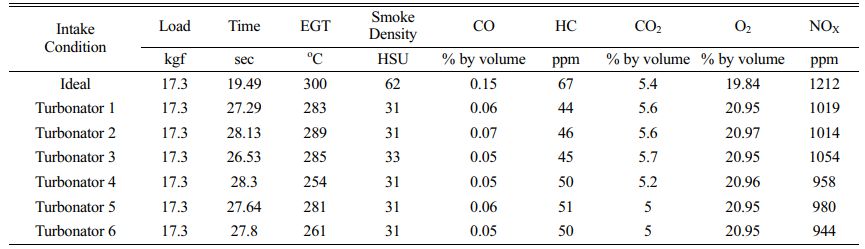
The emission parameters of CO, HC, CO2, O2, NOX has found for implementation of turbonator at the different suction condition. The emission analysis and amount of fuel consumption have been observed for a maximum engine load of 17.3 kgf. The observed emission parameters of various turbonator blades have been tabulated in Table 2. The exhaust gas temperature and time are taken for 10cc fuel consumption also note down in the table.
The following formulas are the fundamental data to determine brake power and brake thermal efficiency of the diesel engine. By diesel engine specification, the brake thermal efficiency to be calculated for the applied load.
The Mass flow rate of Fuel (Diesel) Mf

Brake Specific Fuel Consumption (BSFC):
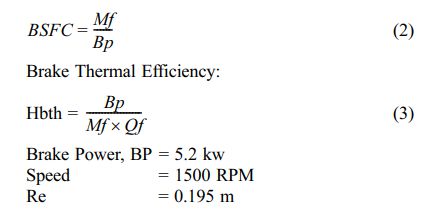
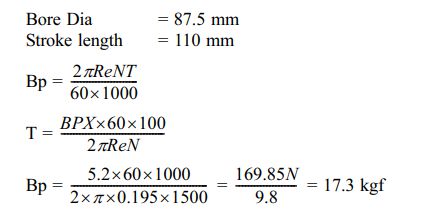
Break thermal efficiency

For 20% load, the brake thermal efficiency is 14%.
|
Fig. 3 Experimental Setup of Kirloskar Engine. |
By modelling the air foil booster blade, exhibiting the blade wall, and demonstrating the housing, the Computer aided design (CAD) demonstration is divided into three parts.
The booster-Grid Generation's specifics The point-by-point CAD display is configured in CAD software and meshing is done using two different programmes, one for surface meshing and the other for volume meshing, respectively.
The IGES format file must be imported into the CFD code preprocessor in order for it to comprehend the flow circumstances. These include representations of the flow area such as a moving inner zone and stationary strong walls that take into account the inlet air mass flow, outlet pressure, liquid characteristics, and flow area. The next step is to create a 3-D turbulence issue that represents the recreation process.
Following the simulation, the CFD code prepares the specifics, applies the fundamental liquid mechanics theory by changing the mass coherence and force conditions numerically, and then makes numerical predictions of the flow factors moving forward. Characterizing the boundary conditions, solver controls, and viewable screens completes the problem setup procedure. The boundary conditions include a solid wall, a moving inner zone, stationary zero pressure in the CFD code at the outlet, and variable mass flow rate at the intake. These assumptions assume that the flow is dry, perfect air flowing at standard atmospheric pressure. During the cycle operation, the residual estimates of every item addressed are noted.
If the numerical mistake conditions are not met, this emphasis technique should be followed for conferencing and repeated. The yield information is separated as the final advancement, and it is then shown as a speed streamline.
The effects of diesel engine emission tests are resulting in the graphical representation method. From experimental observation, the emission factors of CO, HC, CO2, O2, NOX, smoke density and exhaust gas temperature has represented in the following graphs (Fig. 4 to 11). The time taken for fuel consumption of maximum load condition of engine for various turbonator conditions.
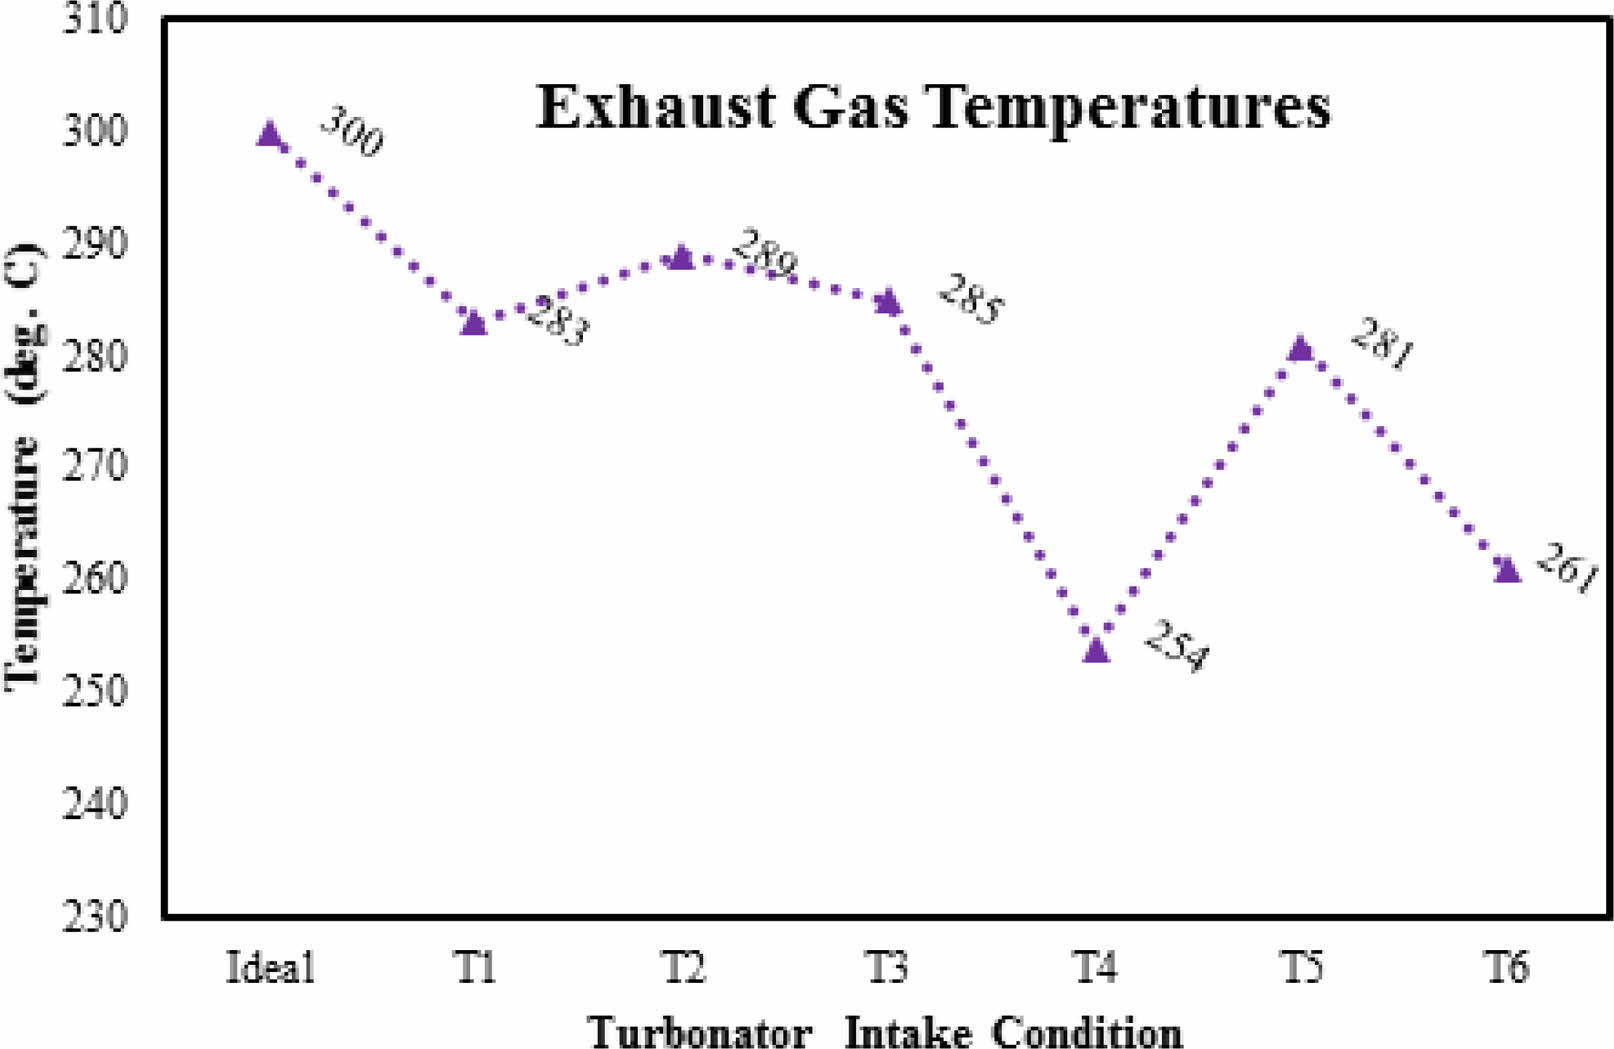
Effects of exhaust gas temperature
The effects of exhaust gas temperature (EGT) are representing in Fig. 4 through graphically for the various number of turbonator blades. The graph (Fig. 4) shows that the exhaust temperature has decreased for the implementation of turbonator when compared ideal engine. The turbonator 4 achieves a lower temperature compared to other turbonator (254 oC).
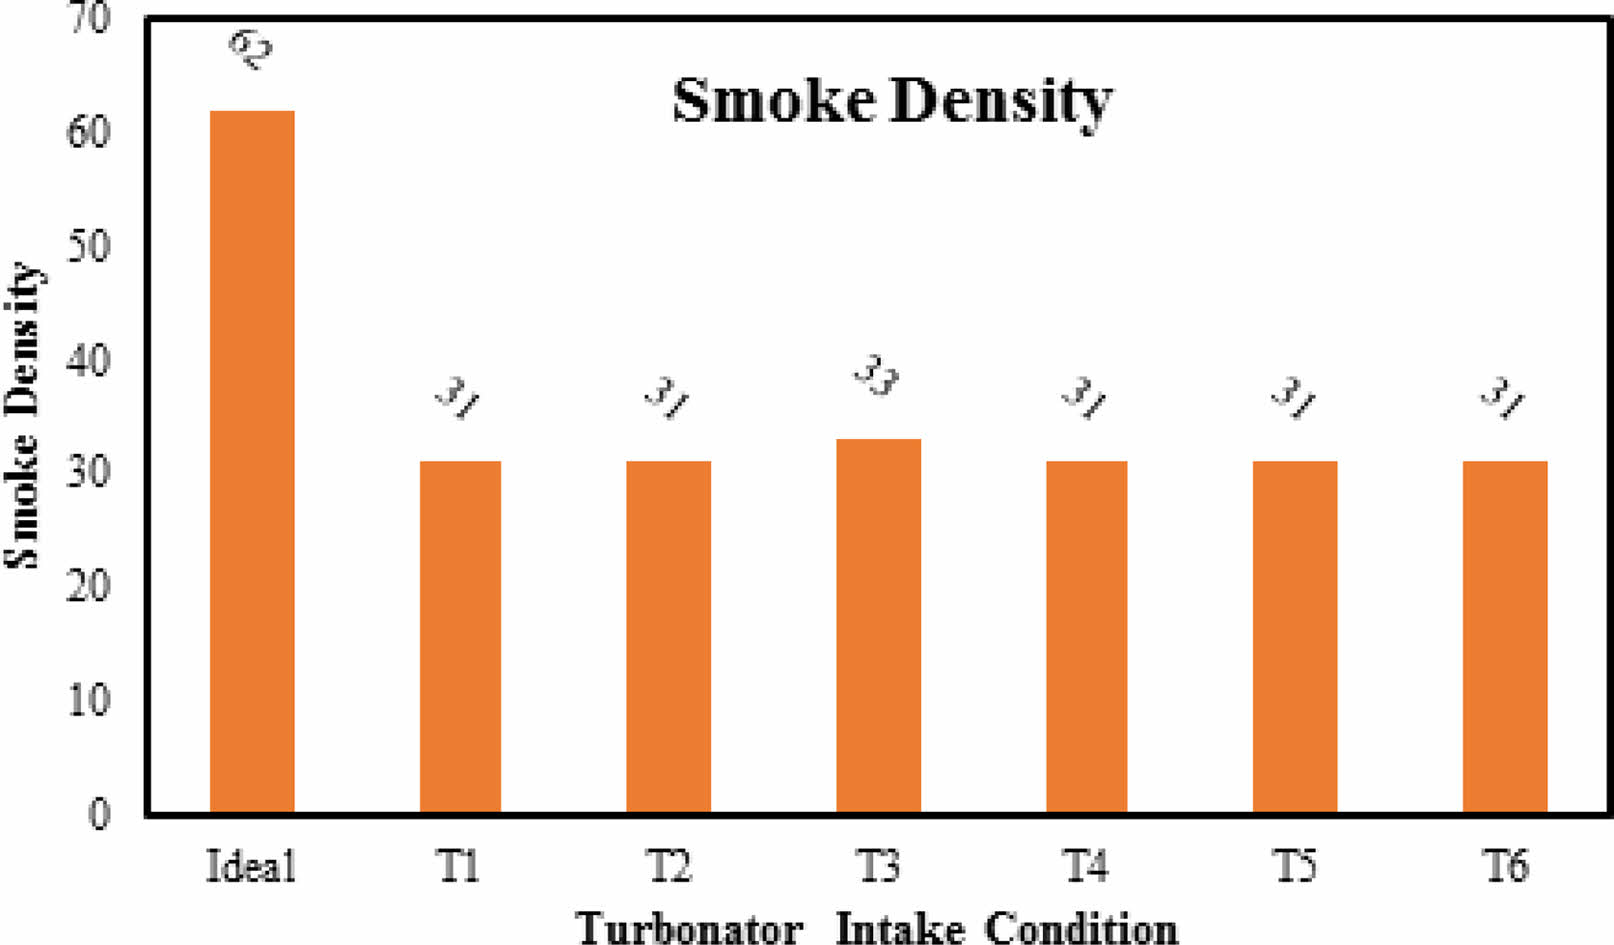
Effect of smoke density
The effect of exhaust gas density is representing through the graphical method for attachment of turbonator with a different number of blades. The graph shows that the smoke density in emission has decreased after the implementation of turbonator when compared to the ideal engine. The smoke density difference is shown in Fig. 5.
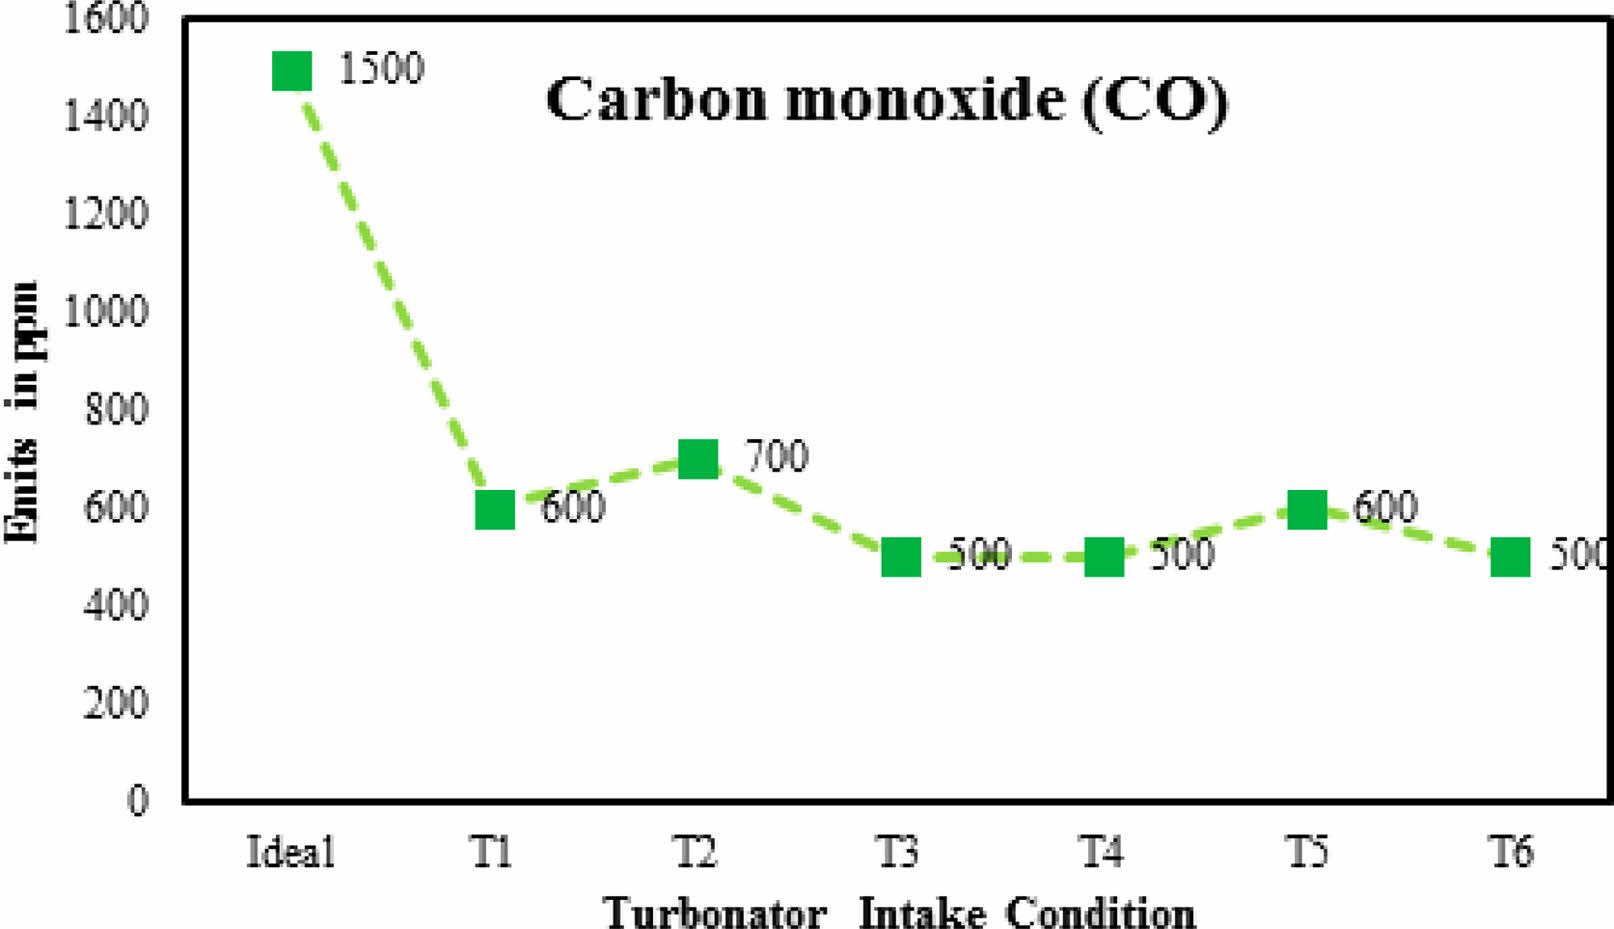
Effect of Carbon monoxide (CO) level
The effects of carbon monoxide (CO) in engine emissions are representing in Fig. 6 graphically for different turbonator. The results of emissions show that the amount of carbon monoxide (CO) has decreased for the implementation of turbonator when compared to the ideal engine. In an ideal engine, the amount of CO emits 1500 ppm whereas it decreases up to 500 ppm after turbonator implements.
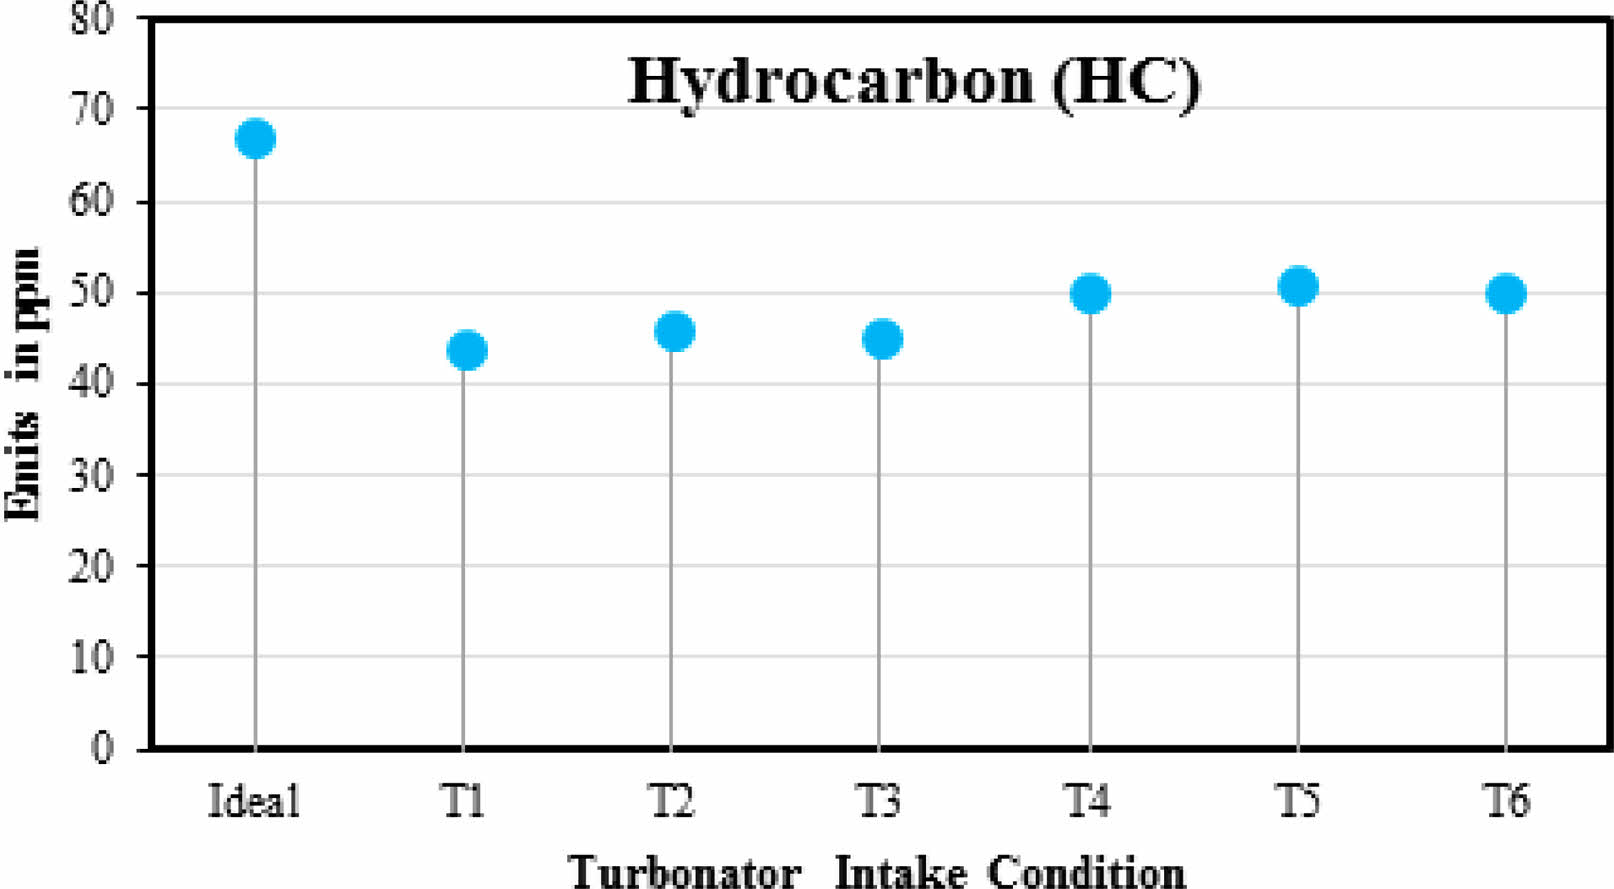
Effect of Hydrocarbon (HC)
The effects of hydrocarbon (HC) in engine emissions is representing through the graphical method (Fig. 7) for a various number of blades of turbonator. The graph shows that the amount of hydrocarbon (HC) has decreased for the implementation of turbonator when compared ideal engine. In an ideal engine, the amount of HC emits 67 ppm whereas it decreases up to 44 ppm after turbonator implements.
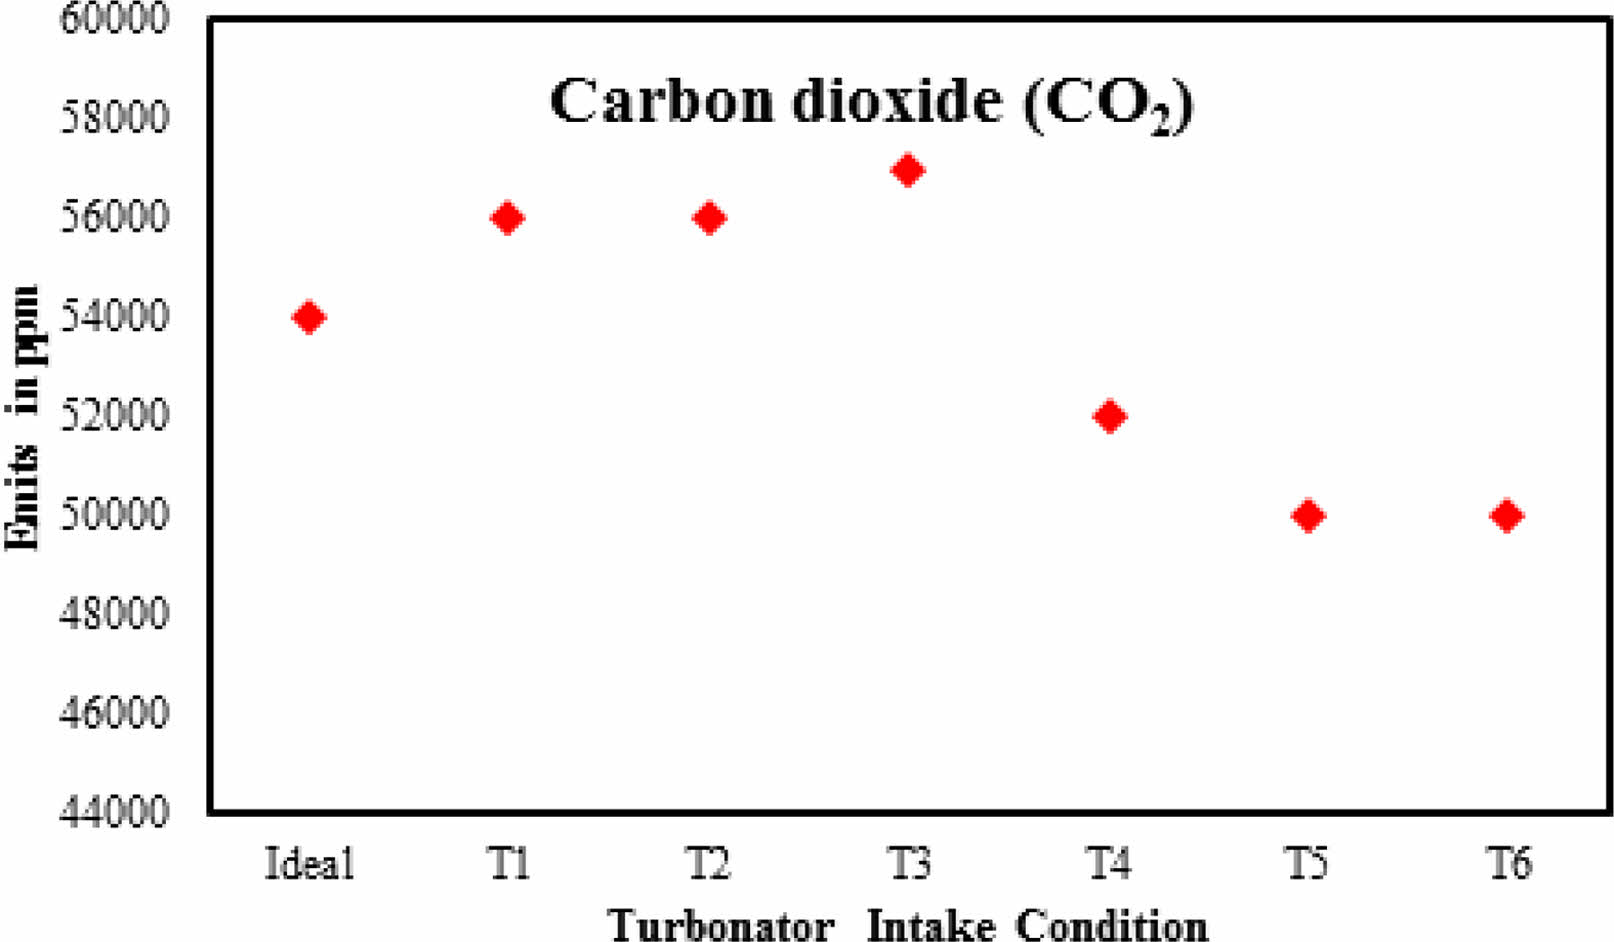
Effect of Carbon dioxide (CO2)
The carbon dioxide (CO2) level from diesel engine emission is observed and represented graphically (Fig. 8) for turbonator with a different number of blades. The results show that the amount of carbon dioxide (CO2) has decreased for the implementation of the turbonator when compared to the ideal engine. In an ideal engine, the amount of CO2 emits 54000 ppm whereas it decreases up to 50000 ppm after turbonator fitted into the intake.
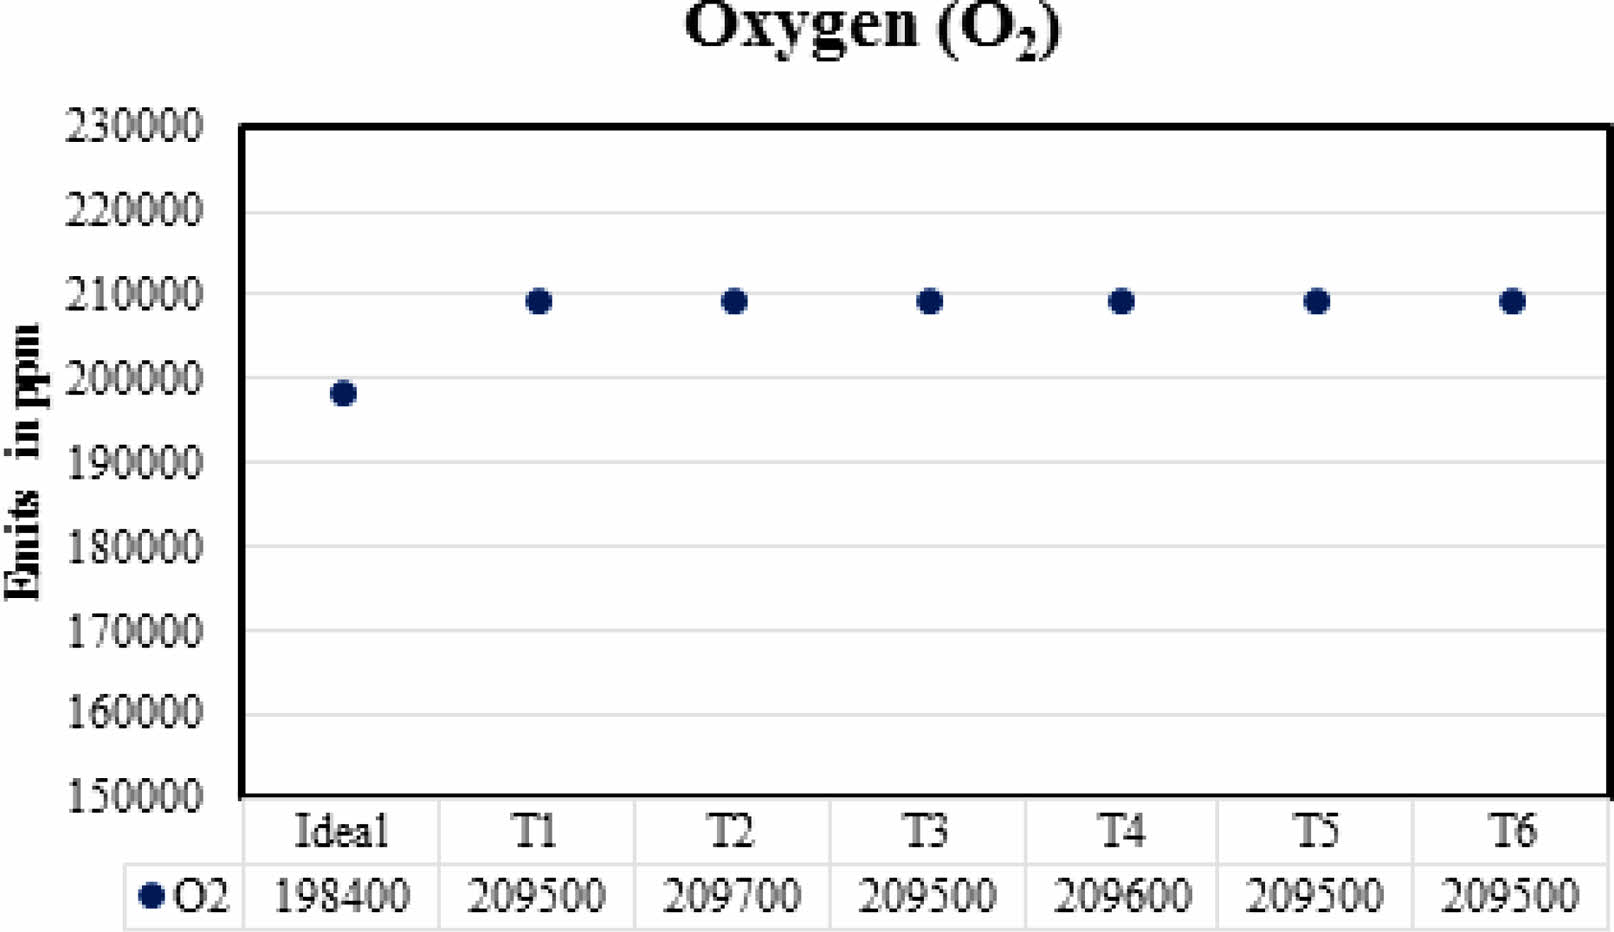
Effects of Oxygen (O2)
The effects of oxygen (O2) in engine emission are representing through the graphical method (Fig. 9). The results of the O2 level are measured for turbonator with various blades and the amount of oxygen (O2) has increases for implementation of turbonator when compared ideal engine. In an ideal engine, the amount of O2 emits 198400 ppm whereas it increases up to 209700 ppm after turbonator implements.
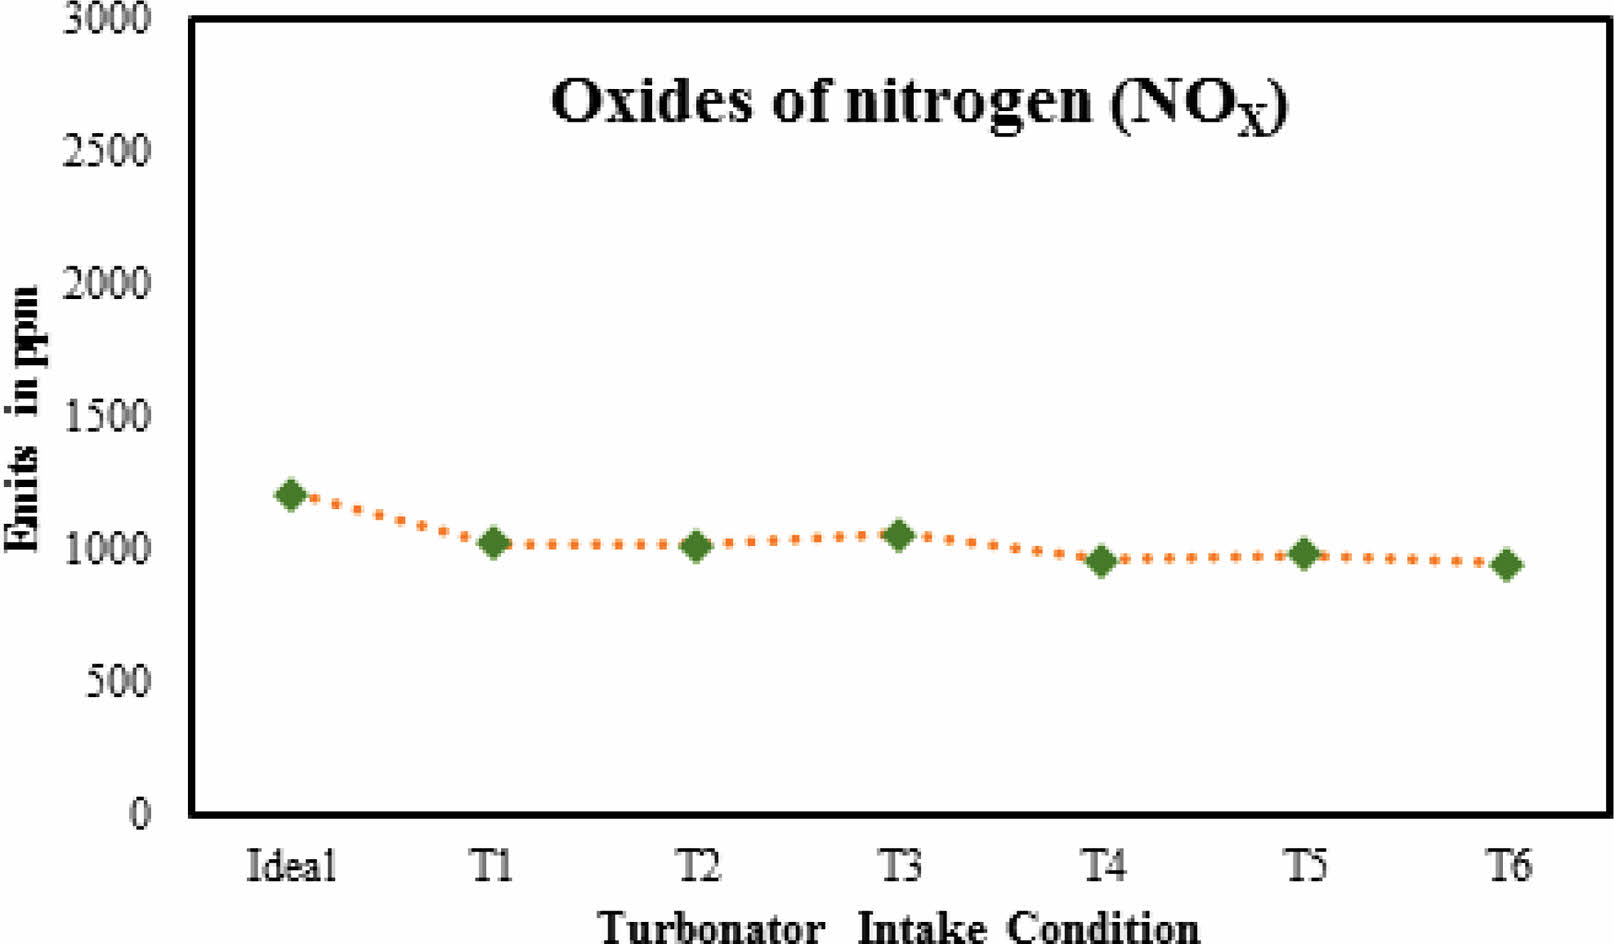
Effects of Oxides of nitrogen (NOX)
The effects of NOx in engine emission are representing through graphical method (Fig. 10) for the various suction condition. The graph (Fig. 10) shows that the number of oxides of nitrogen (NOx) has decreased for the implementation of turbonator when compared ideal engine. In an ideal engine, the amount of NOx emits 1212 ppm whereas it decreases up to 944 ppm after turbonator implements.
|
Fig. 4 Exhaust Gas Temperatures |
|
Fig. 5 Exhaust Smoke Density range. |
|
Fig. 6 CO level in exhaust gas. |
|
Fig. 7 HC level in exhaust gas |
|
Fig. 8 CO2 level in exhaust gas. |
|
Fig. 9 O2 level in exhaust gas. |
|
Fig. 10 NOX level in exhaust gas. |
From this experimental study, diesel engine performance has been enhanced by implementing the turbonator device fitted in the air intake. The effects of emission parameters in engine exhaust conclude the performance level. This investigation results that the diesel engine emission has reduced when compared with existing. Comparatively, the better outcome of the emission parameter for turbonator with 4 numbers of blades the results as listed below:
• The time taken for fuel consumption of 10 ml has been raised for turbonator implements. The maximum time for fuel consumption of diesel is 28.3 seconds.
• The emission of carbon monoxide (CO) becomes low from 1500 ppm-500 ppm. The carbon dioxide (CO2) level gets low (50000 ppm) for turbonator–6 condition.
• The hydrocarbon (HC) reduces up to 44 ppm for turbonator 1 suction condition.
• The oxides of nitrogen (NOX) level become low from 1212 ppm to 944 ppm.
• The oxygen content from exhaust gas gets increases by reducing carbon content. It exists for 198400 ppm for ideal engine condition whereas 209700 ppm for turbonator–2 condition.
• The exhaust gas temperature in engine has decreased maximum for turbonator–4 condition i.e., the exhaust temperature (EGT) is 254 oC.
• In addition, the exhaust gas density level becomes low from 62 HSU to 31 HSU.
Thus, the above results conclude that the diesel engine with the implementation of turbonator device improved its efficiency and reduced exhaust gas. Comparatively, the turbonator with 4 numbers of blades gives better performance of all.
No participation of humans takes place in this implementation process
No violation of Human and Animal Rights is involved.
No funding is involved in this work.
Conflict of Interest is not applicable in this work.
There is no authorship contribution
There is no acknowledgement involved in this work.
- 1. Chirag V. Kapuria, Pravin P. Rathod, March, Int. J. Adv. Eng. Res. Dev. 2[3] (2015) 384-389.
- 2. C.T. Dipak, Deshmukh, D. S., P. Prashant, and Bornare, Int. J. Sci. Spiritual. Bus. Technol. 4[2] (2016) 31-34.
- 3. K. Kannan and M. Udayakumar, ARPN J. Eng. Appl. Sci. 4[8] (2009) 59-62.
- 4. K. Selvarasu and R. Mohan, Tierarztl. Prax. 40 (2020) 357-367.
- 5. L. Jeremy, R. Sebastian, and S. Julien, SIAM J. Appl. Math. Soc. Ind. Appl. Math. 81[6] (2021) 2596-2621.
-

- 6. A. Ning, Struct. Multidiscip. Optim. 5 (2021) 410-422.
-
- 7. M. Hani, Wael, A.-K., and K. Waqar, Symmetry 12[1] (2020) 18.
-
- 8. T. Ahmed, E. Mohamed, R. Zakariya, B. Nagi, and K. Ashraf, Wind Eng. 43[3] (2019) 299-310.
-
- 9. N.R. Abdullah, N.S. Shahruddin, A.M.I. Mamat, S. Kasolang, A. Zulkifli et al., Procedia Eng. 68 (2013) 278-284.
-
- 10. M.F. Hushim, A.J. Alimin, M.A. Razali, A.N. Mohammed, A. Sapit et al., ARPN J. Eng. Appl. Sci. 11[12] (2016) 7565-7571.
- 11. V. Raga Deepu and R. P. Kumar, Int. J. Math. Eng. 13[2] (2020) 1603-1612.
- 12. V.M. Sai, International Int. J. Mech. Prod. Eng. 3[11] (2015) 120-125.
- 13. P. Shubham, Jagdish, and B.R. Lokavarapu, Int. J. Performability Eng. 14[1] (2018) 9-16.
-
- 14. M.I. Soliman, A.A. Emara, R.E.M. Abdel, and H.A. Moneib, 18th International Conference on Aerospace Sciences & Aviation Technology, Cairo, Egypt, (2017) pp. 1-15.
-
- 15. S. Acharya, A. Pokhrel, B. Bohara, and B. Shrestha, 2017 International Conference on Smart grids, Power and Advanced Control Engineering (ICSPACE), Bangalore, India, (2017) pp. 75-80.
-
- 16. T. Ganesan, K. Murugan, R. Prakash, and N. Kathiravan, J. Ceram. Process. Res. 23[5] (2022) 625-628.
-
- 17. P.M. Kumar, V.C. Uvaraja, and P. Madhu, J. Ceram. Process. Res. 23[5] (2022) 647-655.
-
- 18. S.L.V. Prasad and V. Pandurangadu, Int. J. Appl. Eng. Tech. 1[1] (2011) 18-23.
- 19. B. Murali Krishna, A. Bijucherian, and J. M. Mallikarjuna, Int. J. Eng. Appl. Sci. 6[2] (2010) 119-125.
- 20. A. Yasar, B. Sahin, H. Akilli, and K. Aydin, J. Mech. Eng. Sci. 220[73] (2006) 73-82.
-
 This Article
-
2023; 24(3): 422-428
Published on Jun 30, 2023
- 10.36410/jcpr.2023.24.3.422
- Received on Jun 17, 2022
- Revised on Sep 3, 2022
- Accepted on Sep 3, 2022
Services
- Abstract
introduction
objective of this study
turbonator
experimental procedure
post processing
results and discussion
conclusion
- Ethics Approval and Consent to Participate
- Human and Animal Rights
- Funding
- Conflict of Interest
- Author Contributions
- Acknowledgements
- References
- Full Text PDF
Shared
Correspondence to
- K. Selvarasu
-
Research Scholar, Department of Mechanical Engineering, Sona College of Technology, Salem, Tamilnadu, India
Tel : 9842877023 - E-mail: selvarasuk974@gmail.com
Clean-Energy Research Institute(CRI), Hanyang University, 222, Wangsimni-ro, Seongdong-gu, Seoul, 04763, Korea
E-mail: jcpr@hanyang.ac.kr