


- Molecular dynamics simulation of nanoindentation influence of indenter velocity on 3C-SiC ceramics
Yu Donglinga,c, Liu Donglianga,c, Yi Jiaqia,b, Zhou Jianzhena,b and Wu Nanxinga,b,*
aSchool of Mechanical and Electronic Engineering, Jingdezhen Ceramic University, Jingdezhen 333403, PR China
bNational Engineering Research Center for Domestic & Building Ceramics, Jingdezhen 333001, PR China
cLaboratory of Ceramic Material Processing Technology Engineering, Jiangxi province, Jingdezhen 333403, PR ChinaThis article is an open access article distributed under the terms of the Creative Commons Attribution Non-Commercial License (http://creativecommons.org/licenses/by-nc/4.0) which permits unrestricted non-commercial use, distribution, and reproduction in any medium, provided the original work is properly cited.
To investigate the effect of nanoindentation velocity on dislocation nucleation, development and elastic deformation of 3C-SiC ceramic specimens, the nanoindentation loading process of 3C-SiC ceramic specimens under a diamond indenter is simulated. The molecular dynamics models of diamond indenter and 3C-SiC amorphous layer are constructed, and the nanoindentation conditions such as potential function, relaxation synthesis and time step are optimized. The dislocation analysis method and the identify diamond structure method are used to analyze the internal structure change of the specimen and the dislocation generation, change and transfer of different positions after nanoindentation simulation. It is found that with the increase of indenter velocity, the elastic threshold decreases and the plasticity increases, and tends to be stable at a certain stage. The load fluctuation tends to be flat, the total amount of dislocation generated continues to decrease, and the diffusion rate of dislocation slows down. The length of 1/2<110> and 1/6<112> type dislocation becomes shorter, indentation formation of the 'lotus' shape more regularly. The elastic-plastic threshold of 3C-SiC ceramic material also changes with the change of indenter velocity, and the dislocation formation rate and total amount also affect while show a certain regularity
Keywords: molecular dynamics nanoindentation, 3C-SiC ceramic, deformation mechanism, indenter velocity
As an important ceramic material, 3C-SiC has excellent properties such as high thermal conductivity [1, 2], excellent wear resistance and healing ability [3, 4], good thermal resistance stability and large band gap [5-7], and is widely used in extreme environments such as high temperature, high pressure and strong magnetic field [8], medical treatment, aerospace and other fields [9]. The analysis of mechanical properties, deformation and dislocation mechanism of silicon carbide at nanometer scale is conducive to the improvement and further utilization of silicon carbide materials [10-12]. Nanoindentation test method is one of the common methods to test the micro mechanical properties of materials, which can measure the stiffness, hardness, fracture toughness, creep characteristics and other material properties of materials[13-15]. Usually, hard materials such as diamond with specific shape are used as the indenter to press the material samples. Due to the extremely high hardness of silicon carbide material, the test of its mechanical properties is limited. Meanwhile, nano-indentation technology cannot observe the local high temperature action inside the specimen under compression [16], and the deformation and damage behaviors such as the generation, deformation and stacking of internal dislocations under load [17, 18]. Using molecular dynamics method to simulate nano-indentation experiment, the internal changes of the specimen can be tracked in real time.
Nano-simulation method [19] is used to simulate nanoindentation experiment of material, which is convenient to analyze dislocation change and deformation mechanism of material internal structure. IMRAN et al. [20] studied Ni nanoindentation loading rate and simulated diamond indenter experiments on Ninano- indentation with FCC lattice by molecular dynamics method, and found that the maximum indentation load and hardness of the system increased with the increase of speed. Hu et al. [21] studied pressure head speed of Ni3Al nanoindentation process, the influence of the molecular dynamic method is used to simulate the pressure head and single crystal diamond Ni3Al film nanoindentation experiments of the specimens, the study found that the pressure into the initiation and growth speed of matrix internal dislocation has remarkable effect on the occurrence of the time but the overall trend of para wrong movement does not produce significant effect. Zhou et al. [22] studied the influence of temperature and loading rate on dislocation emission, and simulated the dislocation emission experiment of Al with molecular dynamics method. The simulation found that with the increase of loading rate, the width of layer dislocation decreased and the dislocation velocity increased. Wu et al. [23] studied the indentation deformation and mechanical properties of gold/copper multilayers at nanoscale, and simulated the indentation experiment of gold/copper multilayers with rigid silicon indenter by molecular dynamics method. The experiment found that dislocation expansion was more significant at lower indentation speed. At relatively high indentation velocities, the number of disordered atoms increases significantly. Due to the small research scope of IMRAN et al., the change of the internal microstructure of the workpiece is not obvious during the simulation, and the lack of relevant experimental analysis on the loading rate of 3C-SiC ceramics under nanoindentation, it is necessary to further study the influence of the speed range of the indenter.
Based on the above analysis of nanoindentation loading rate, molecular dynamics method is used to simulate the nanoindentation process of 3C-SiC ceramics at different loading rates. DXA and IDS et al. [24] post-processing methods are used to analyze the load, dislocation generation and the change of dislocation number of 3C-SiC ceramic material specimens. The simulation experiment is significant to study the microstructure of 3C-SiC under different loading rates, which is conducive to the wider application of 3C-SiC in the field of extreme environment.
Establishment of molecular dynamics model
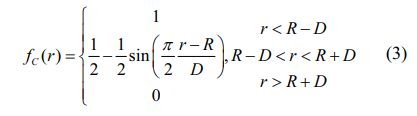
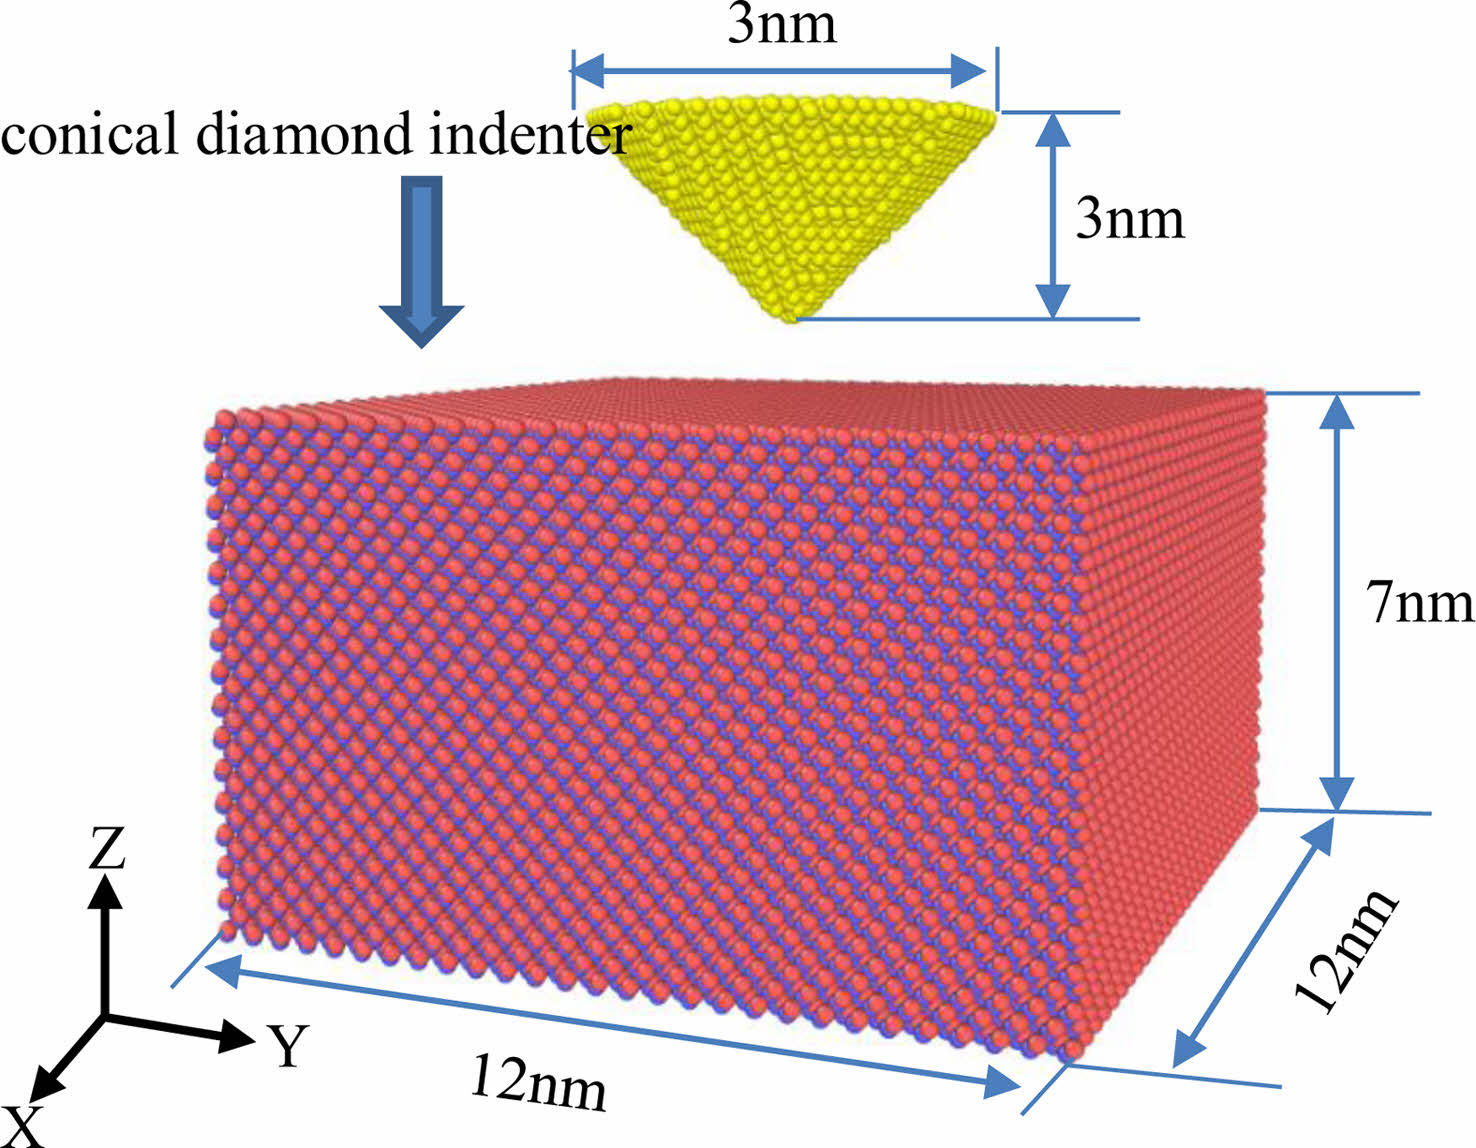
Fig. 1 shows a three-dimensional molecular dynamics model of 3C-SiC ceramic nanoindentation. The indenter style is simulated as conical diamond indenter, and the compression part is simulated as 3C-SiC cuboid specimen. Boundary layer, thermostatic layer and Newtonian layer were set for the indenter and the specimen. In order to prevent the base movement during the indentation process, the atom with the bottom depth of 1nm in the simulated box was set as the boundary layer. The boundary conditions in X and Y directions were set as periodic boundary conditions, and the boundary conditions in Z direction were set as fixed boundary conditions. The indenter was set at 1nm above the central surface, and the indenter was set to press down from the Z direction straight line. The indentation process ends when the indenter contacts the bottom surface of the specimen, that is, the pressing depth is 7 nm. Minimize energy optimization is used in the simulated indentation process, and the loading speed of nanoindentation is set to 10 m/s, 50 m/s, 100 m/s, 200 m/s, 300 m/s, 400 m/s, and 500 m/s, respectively.
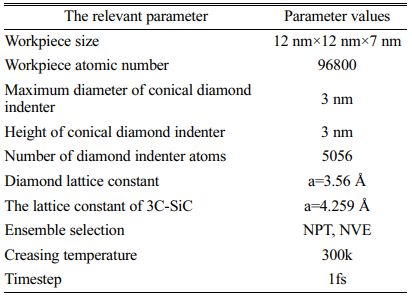
The total number of atoms in the model is 101856, the indenter contains 5056 atoms, and the 3C-SiC specimen contains 96,800 atoms. The maximum radius of the diamond conical indenter is set at 1.5 nm and the height is set at 3 nm. The geometric size of the 3C-SiC cuboid specimen is set at 12 nm, 12 nm and 7 nm. The lattice constant of diamond is a=3.56 Å, and that of 3C-SiC is a=4.259 Å. The constant timestep of the molecular dynamics indentation simulation process was set to 1fs, and the isothermal-isobaric ensemble (NPT) [25] is selected in the simulated relaxation process. The pressure head temperature of the nanoindentation relaxation process is set to 300 K using a Gaussian thermostatic heat bath. When the relaxation is completed and the indentation process is entered, the ensemble is changed to a microregular ensemble (NVE) [26]. Relevant parameters and parameters of 3C-SiC molecular dynamics are shown in Table 1.
Molecular dynamics simulation calculation
Vashishta potential function and Tersoff potential function are the most commonly used in the molecular dynamic simulation of silicon carbide. Vashishta potential function is the result of simulation calculation by Vashishta et al. [27]. Tersoff potential function is the result of simulation by Tersoff et al. [28]. However, due to the inaccurate description of the Tersoff potential function for the interaction between carbon and silicon atoms and the graphitization of diamond by Tersoff potential function, Erhart et al. [29] improved the traditional Tersoff potential function, which is called the analytical bond order potential (ABOP). In order to accurately describe the mechanical action on the workpiece at the nanometer scale, the first thing is to determine the interatomic interaction potential. ABOP potential function and Vashishta potential function are more accurate in describing the interaction between diamond and silicon carbide. The potential function combined with ABOP potential and Vashishta potential is used to simulate the interatomic interaction force. The expression formula of ABOP potential is as follows:
The parameters of the potential function depend on the physical properties of the material itself. Generally, the lattice constant, elastic constant, internal energy and bond Angle of the material are obtained through quantum mechanical method or experimental data fitting, and the accuracy is ensured through repeated correction [30]. E represents the total energy of the system, fA represents the attractive pair potential, fC represents the smooth truncation function, and rij represents the distance between atoms I and J:
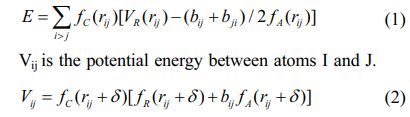
The fC(r) is a truncation function that restricts the range of potential energy. Parameters R and D specify the position and width of the cutoff region.
VR(r) is the repulsive dual potential and VA(r) is the attractive dual potential.
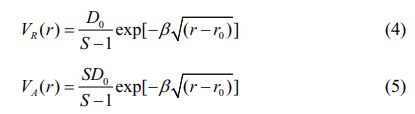
The bij is the bond angle term, which depends on the local coordination of I atom and the angles between i, j and k atom, g(θ) is the bond angle function, ζij is the effective coordination number, θijk is the bond angle relationship between ij atom and ik atom, l , c and d are the three-body potential parameters, which are the parameters of the bond angle function g(θ).

|
Fig. 1 Molecular dynamics model of 3C-SiC nano-indentation. |
Effect of velocity on load of 3C-SiC ceramics
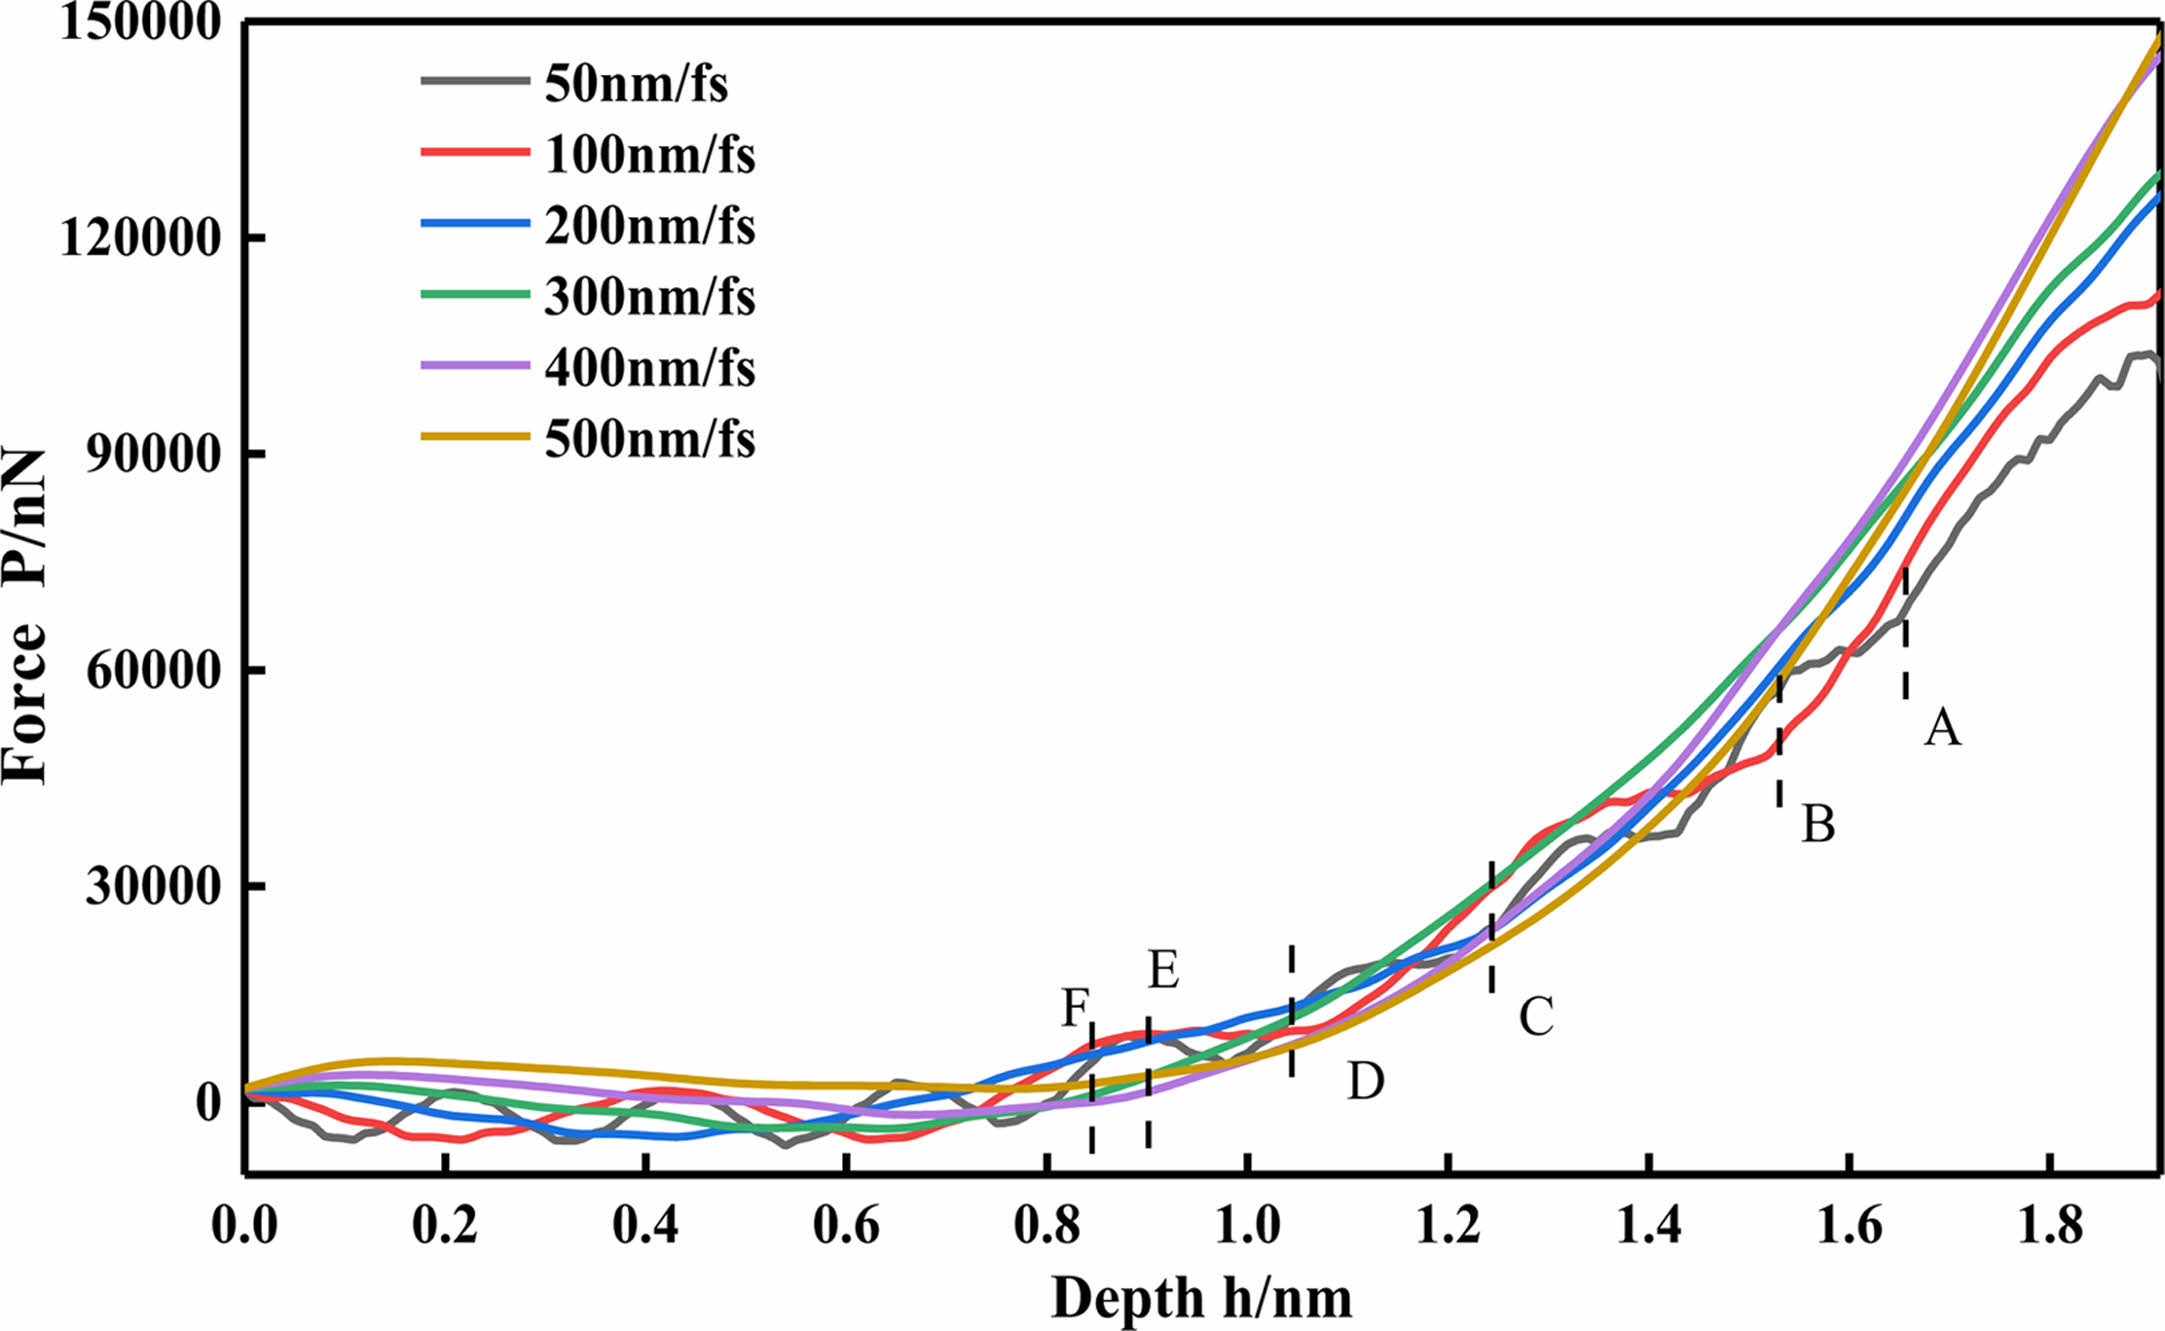
As shown in Fig. 2, A~F respectively represent the turning point from elastic deformation to plastic deformation in the spline curves with speeds of 50 m/s, 100 m/s, 200 m/s, 300 m/s, 400 m/s and 500 m/s. According to the results of molecular dynamics nanoindentation simulation experiment combined with Fig. 2, it is found that with the increase of the velocity, the elastic deformation of the workpiece will be transformed into plastic deformation earlier. With the increase of the speed, the elastic deformation threshold decreases, and the plastic deformation threshold increases. As the velocity increases, the fluctuation in the elastic deformation region will become more and gentler. When the indenter velocity is 50 m/s, the load on the simulated workpiece sample is rising in waves. When the indentation depth h is close to 1.7 nm (as shown in A in the Fig. 2), the curve rises in A relatively smooth trend after that. Compared with the spline with a pressure speed of 50 m/s, the ‘wave’ of the curve with a speed of 100 m/s is more stable when rising, and it can be seen that the growth trend of the spline with a higher speed is more and more stable when the load increases. At 400 m/s, the ‘wave’ basically disappears. When the pressure depth h=1.64 nm, the 50 m/s spline curve showed a process of transition from elastic deformation to plastic deformation; when the pressure depth H=1.52 nm, the 100 m/s spline curve began to show the transformation of two forces. With the increase of the velocity, the transformation position of the spline curve was more and more forward. When the indenter velocity is 500 m/s, the turning point appears at the indentation depth h=0.85 nm. It can also be observed in Fig. 2 that after exceeding the elastic deformation threshold, the load on the workpiece increases rapidly, and the plastic deformation threshold on the workpiece increases with the increase of the speed, but when the speed increases to a certain extent, the plastic deformation threshold increases and tends to be stable.
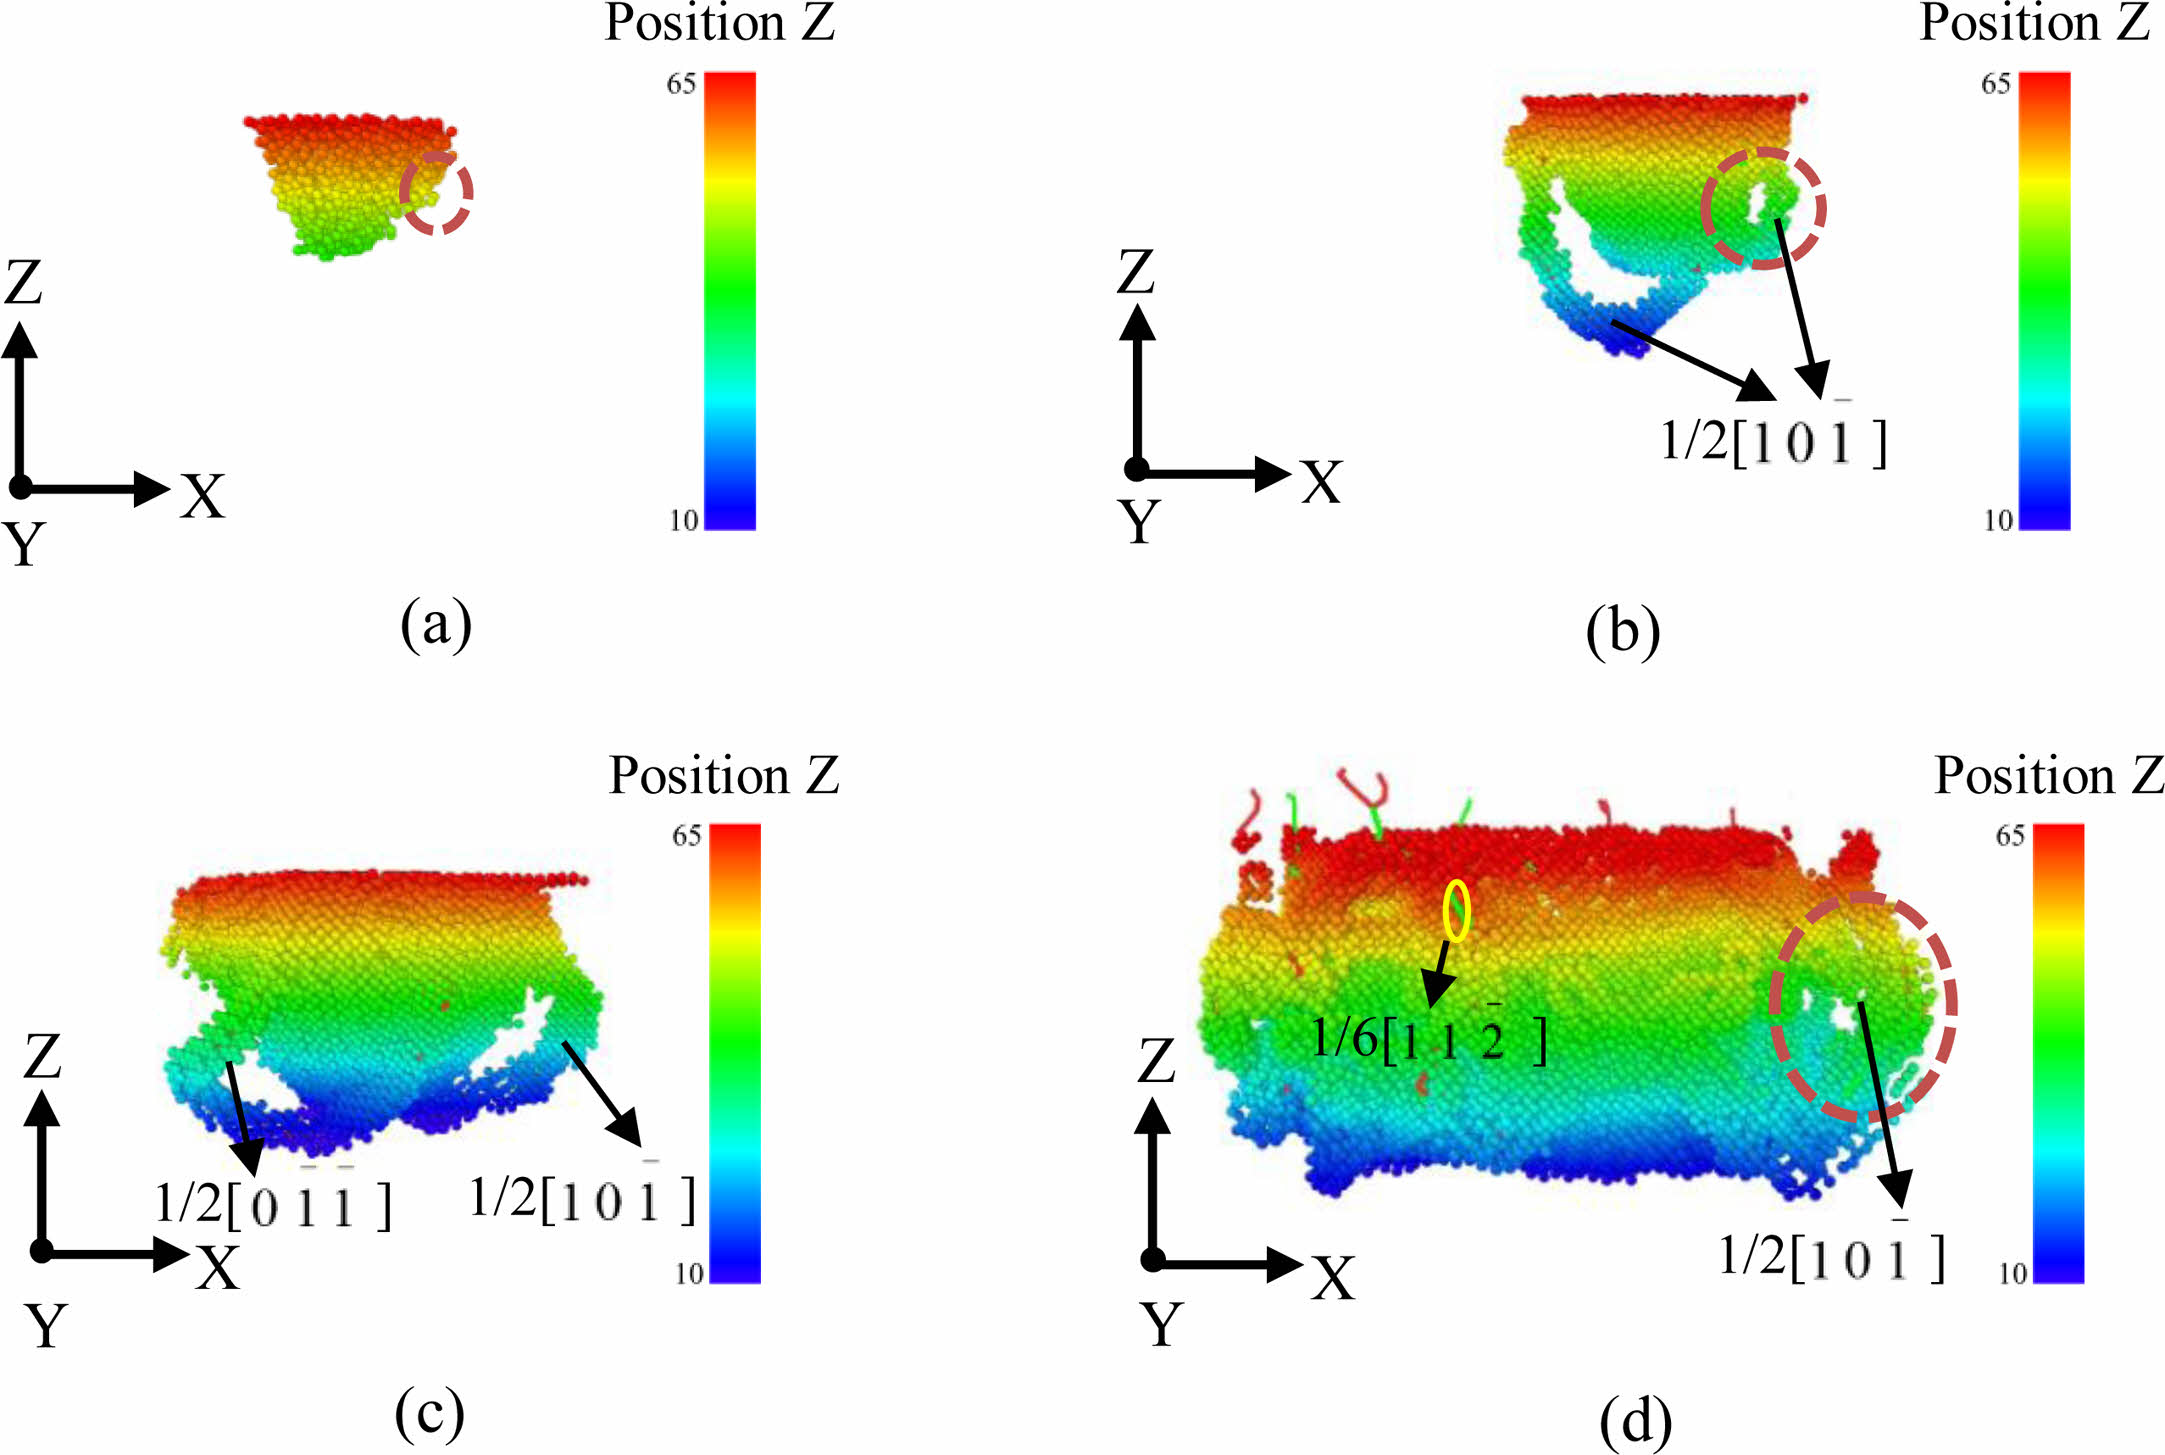
Fig. 3 shows the dislocation variation of the workpiece under load when the indenter velocity is 50 m/s. The model is established by molecular dynamics simulation, and then through visualization processing, the dislocation pattern can be obtained by Identify Diamnd Structure (IDS) and blight analysis (DXA). From the beginning, when the indenter presses down on the workpiece to the end that the indenter presses down on the bottom of the workpiece, four representative passes are selected. Fig. 3(a) shows the stage when the workpiece is compressed but no plastic deformation occurs. At this time, the internal changes of the workpiece start from the position next to the indenter, as shown in the red circle. Fig. 3(b) represents a stage just after the transformation of the workpiece from elastic deformation to plastic deformation, when the workpiece produces a relatively obvious U-shaped dislocation ring and a smaller one; (c) represents only a stage of plastic deformation, when the workpiece produces two relatively obvious “U-shaped” displacements. (d) represents the stage when the indenter is pressed fast and close to the bottom of the workpiece. At this time, the internal changes of the workpiece are particularly drastic and many dislocations are generated, and the length of the dislocations is also longer. It can be clearly seen that the dislocations in this stage are not limited to the dislocations around the indenter, but also more dislocations appear in the upper part of the workpiece. With the pressure of the indenter, the type and length of the dislocation will change.
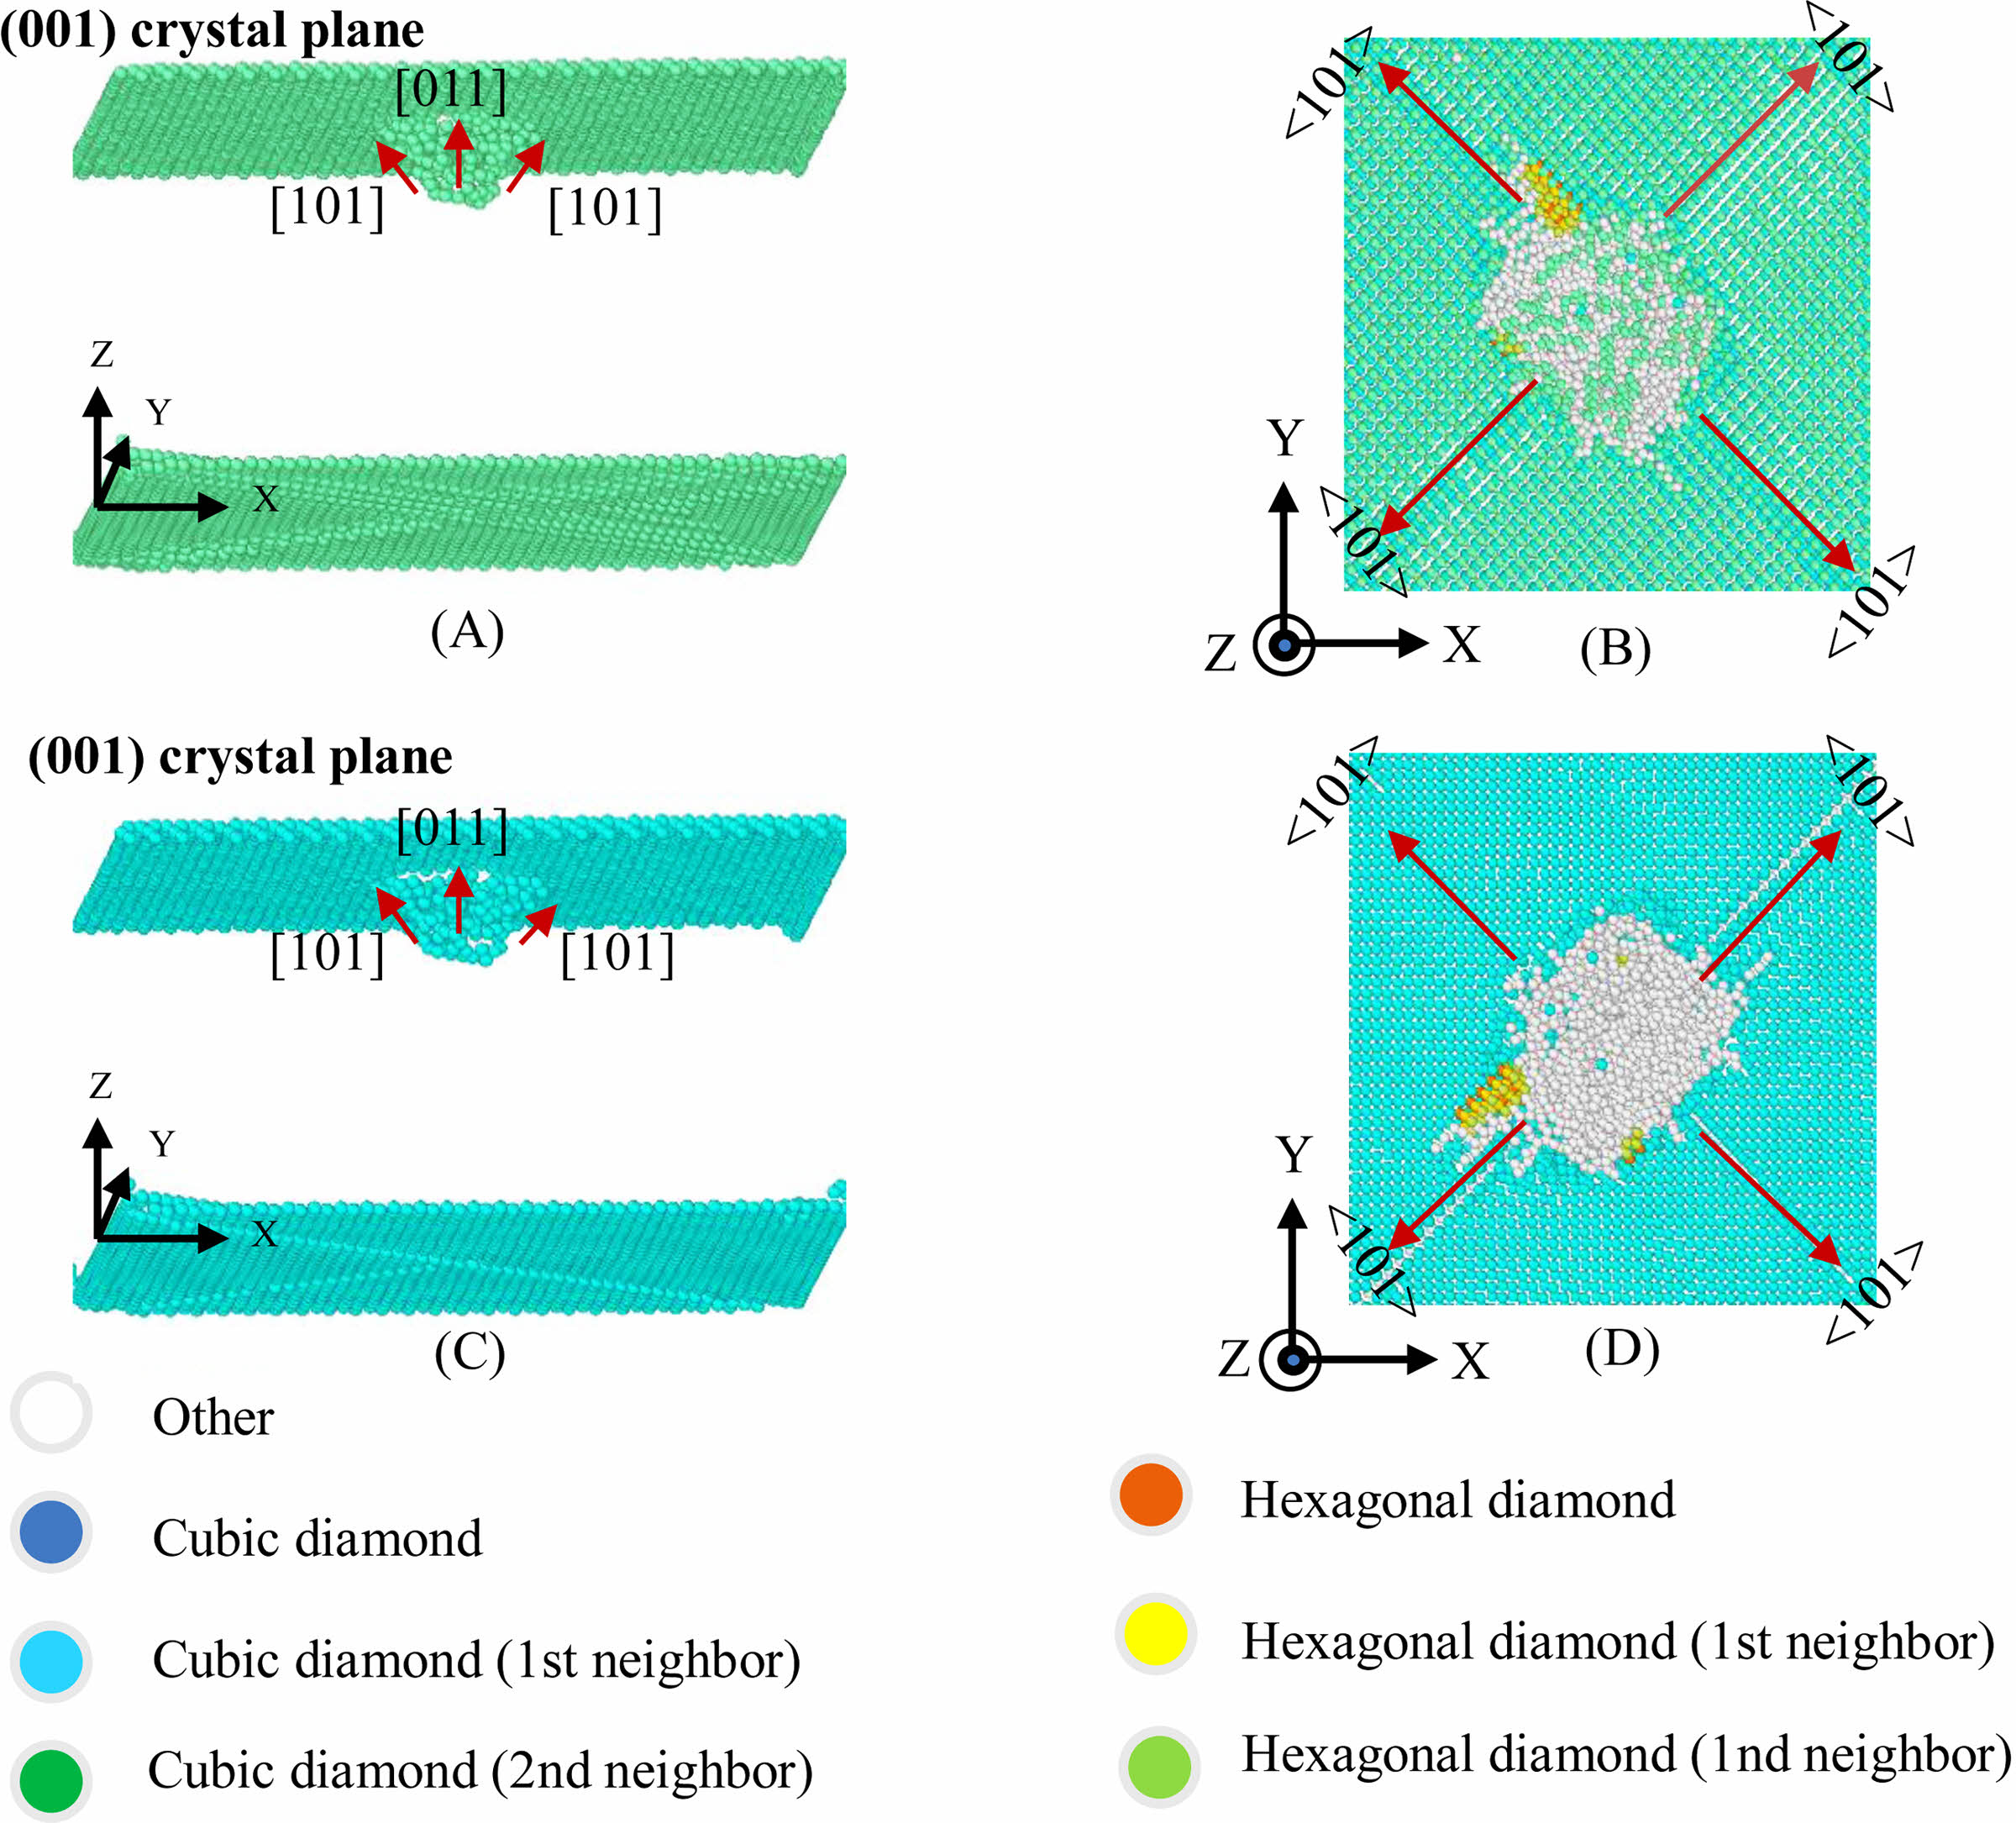
The occurrence of dislocation of the workpiece must first go through a period of elastic deformation. At this stage, the pressing depth of the indenter is small, and there is no dislocation and slippage inside the workpiece. In order to further understand the elastic deformation stage, the silicon atoms and the carbon atoms of the cubic diamond structure in the molecular dynamics model are hidden, and the 3C-SiC cubic diamond crystal structure is left. The 3C-SiC of the first and the 3C-SiC of the second cubic diamond structures were respectively displayed. The downward pressure indenter is a conical indenter, and the shape of the indentation tends to be spherical. The atoms that cause structural changes of the workpiece are mainly accumulated around and directly under the indenter. The spherical area that crystal orientations beside them are [101], [011], [101] and [011], and the deformed surface enclosed by them is the {111} crystal plane family. As shown in Fig. 4(B) and Fig. 4(D), it is a top view of the indentation area of the workpiece. From the indentation traces, it can be seen that the indentation diffusion shape is circular, but the direction of extension is toward the four endpoints, namely the deformation zone will expand along the <101> crystal direction on the (001) crystal plane as the indenter is pressed down.
Effect of velocity on dislocation of 3C-SiC ceramics
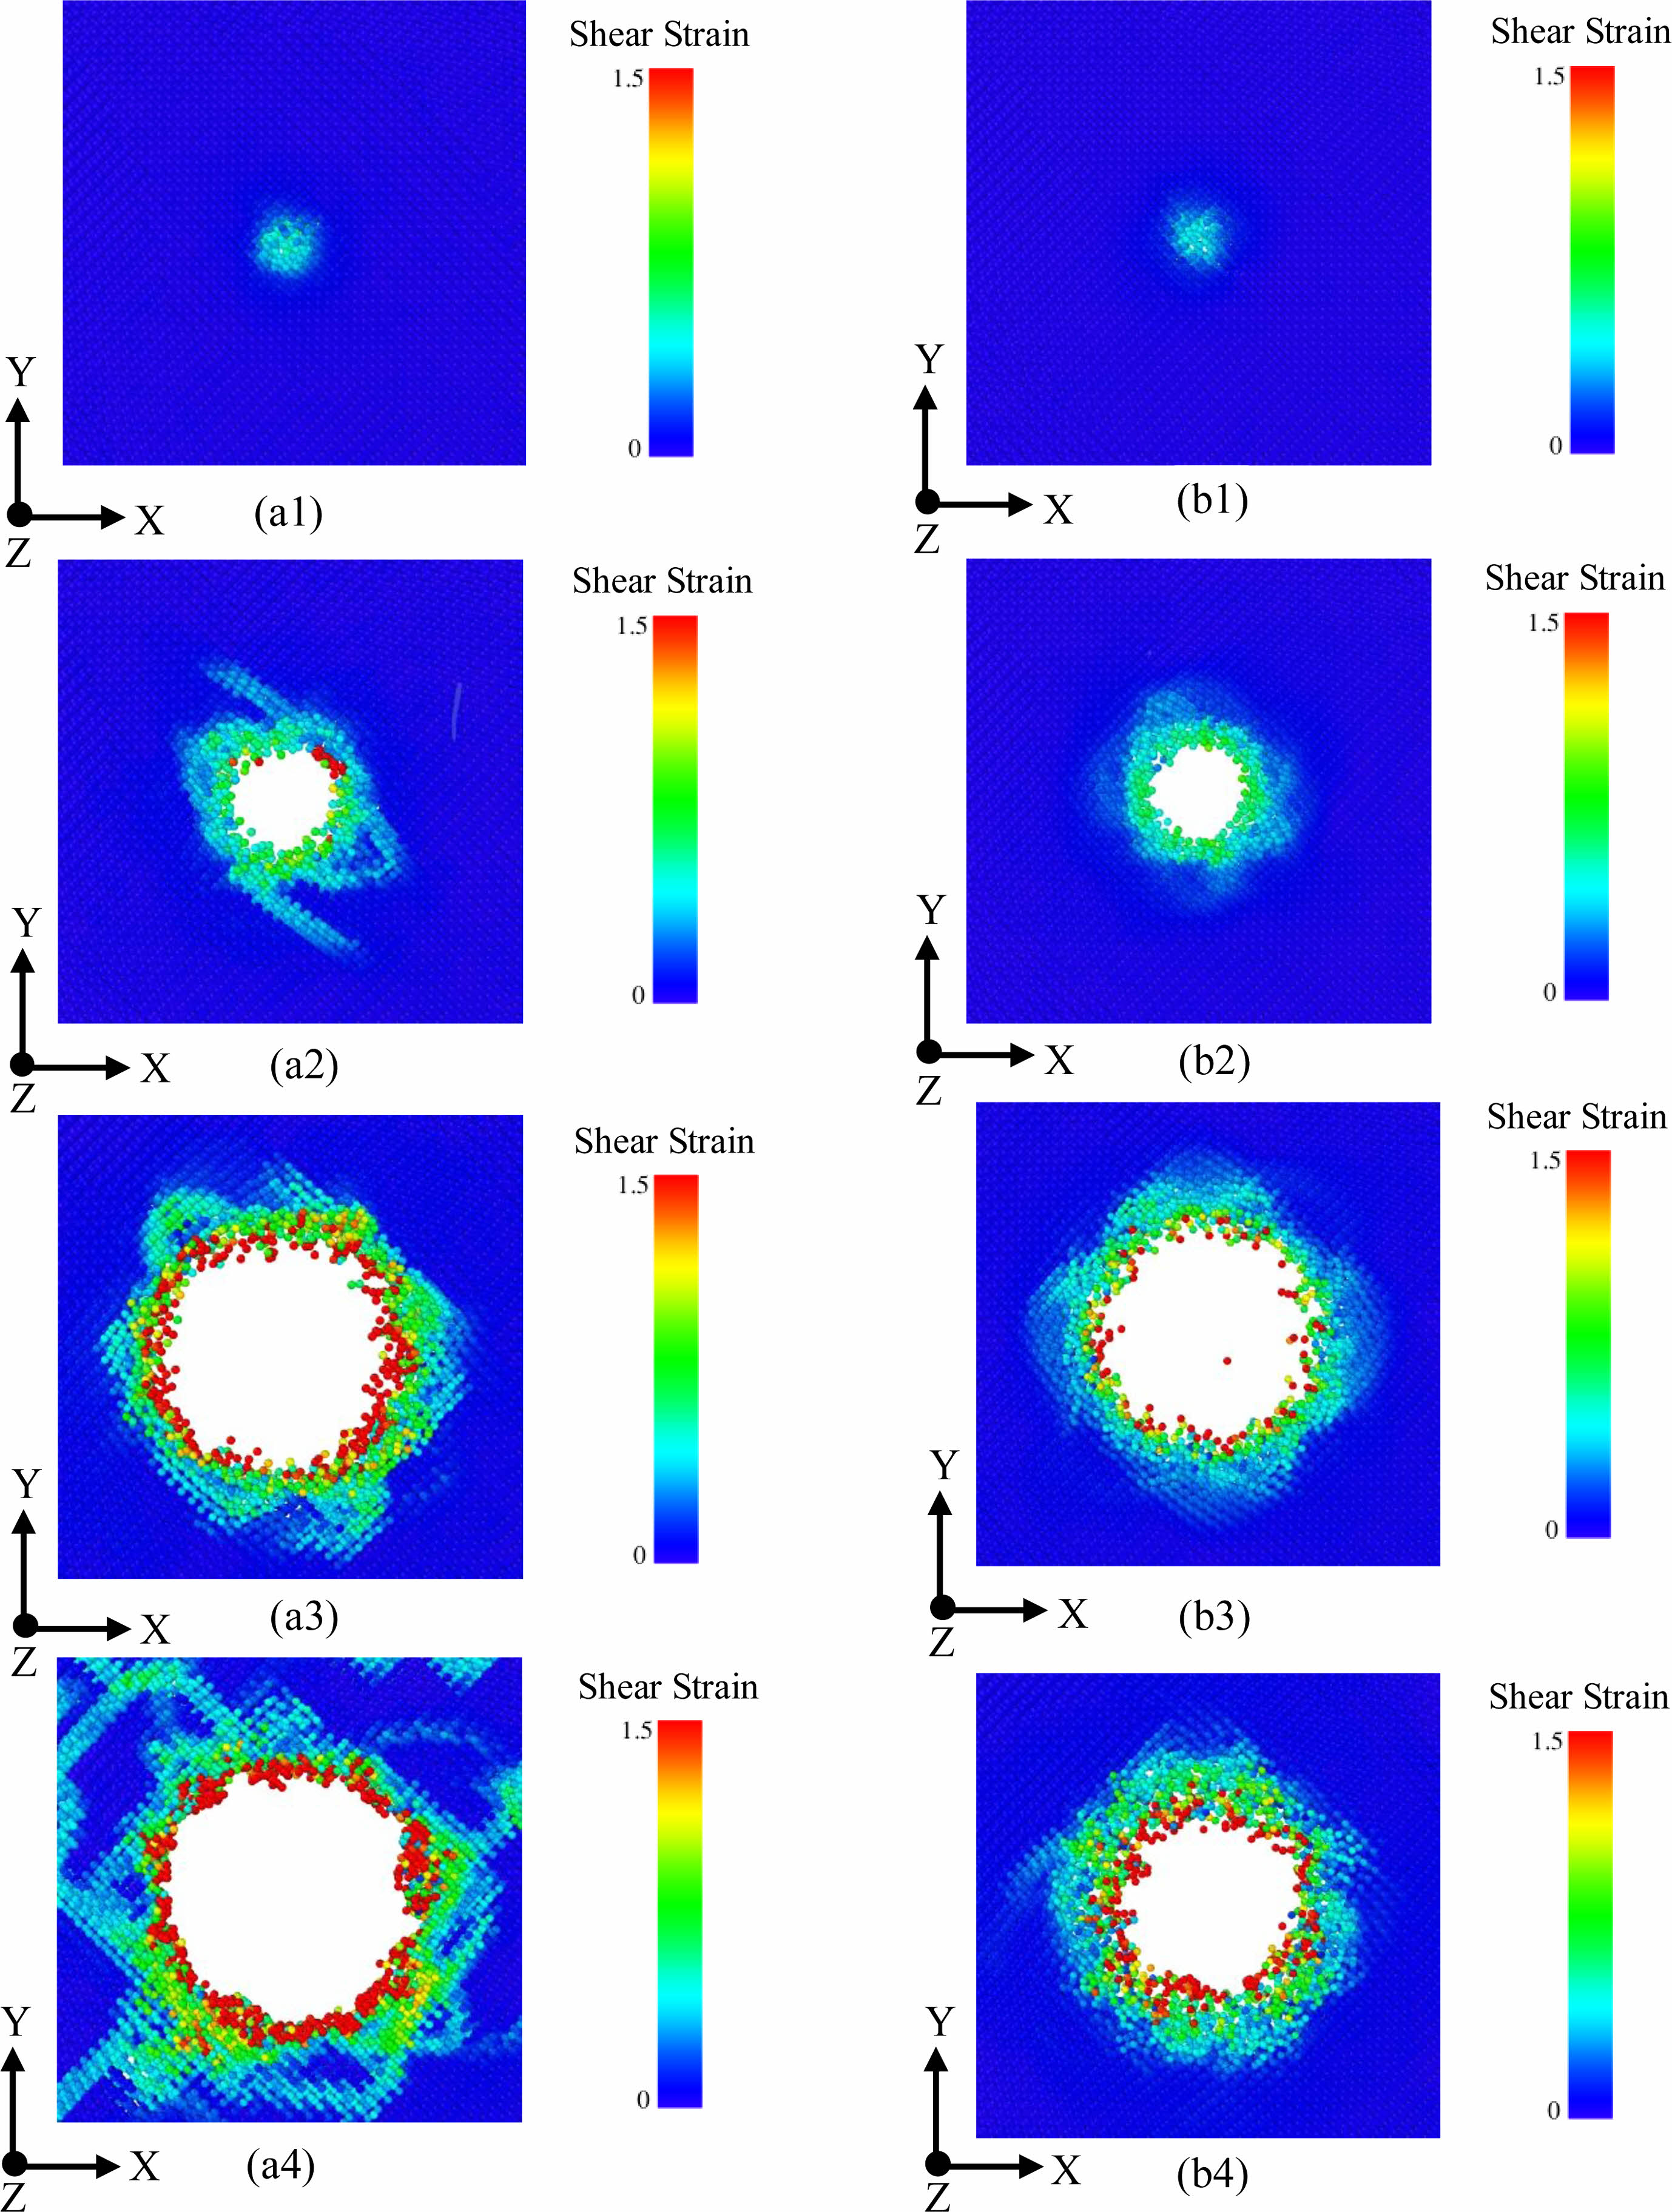
Fig. 5 shows the stress nebulides around the indenter when the indenter is pressed down at speeds of 50 m/s and 500 m/s. In Fig. 5 (A1) and (b1) show the effect of the two heads on the workpiece when the indentation depth h=0.9 nm. At this time, the stress range of the two heads is basically similar. (A2) and (B2) in Fig. 5 show the stress around the head when the indentation depth is h=2.25 nm. The dislocation formed around the head with a speed of 50 m/s is more complex than that around the head with a speed of 500 m/s. Lotus shaped dislocation is formed around the head with a speed of 500 m/s, and there are not only lotus flowers around the head with a speed of 50 m/s Like, and there is a bit spread to the endpoints. In Fig. 5 (A3) and (b3) are the conditions around the indenter when the indentation depth h=4.06 nm. At this time, the dislocations around the indenter with a speed of 50 m/s are relatively complex, while the dislocations around the indenter with a speed of 500 m/s can be clearly seen, and the dislocations spread outward around the conical indenter. Compared with the shear strain stress around 500 m/s, the shear strain stress around 50 m/s is larger (A4) and (B4) in Fig. 5 show the situation around the indenter when the indentation depth h=5.42 nm. At this time, more dislocations are generated around the indenter with a speed of 50 m/s and basically spread to the edge of the workpiece, while fewer dislocations are generated around the indenter with a speed of 500 m/s and continue to spread around the indenter. The diffusion rate is lower than that of the dislocation around the 50 m/s indenter, and the atoms around the indenter tend to fill the compression position of the indenter.
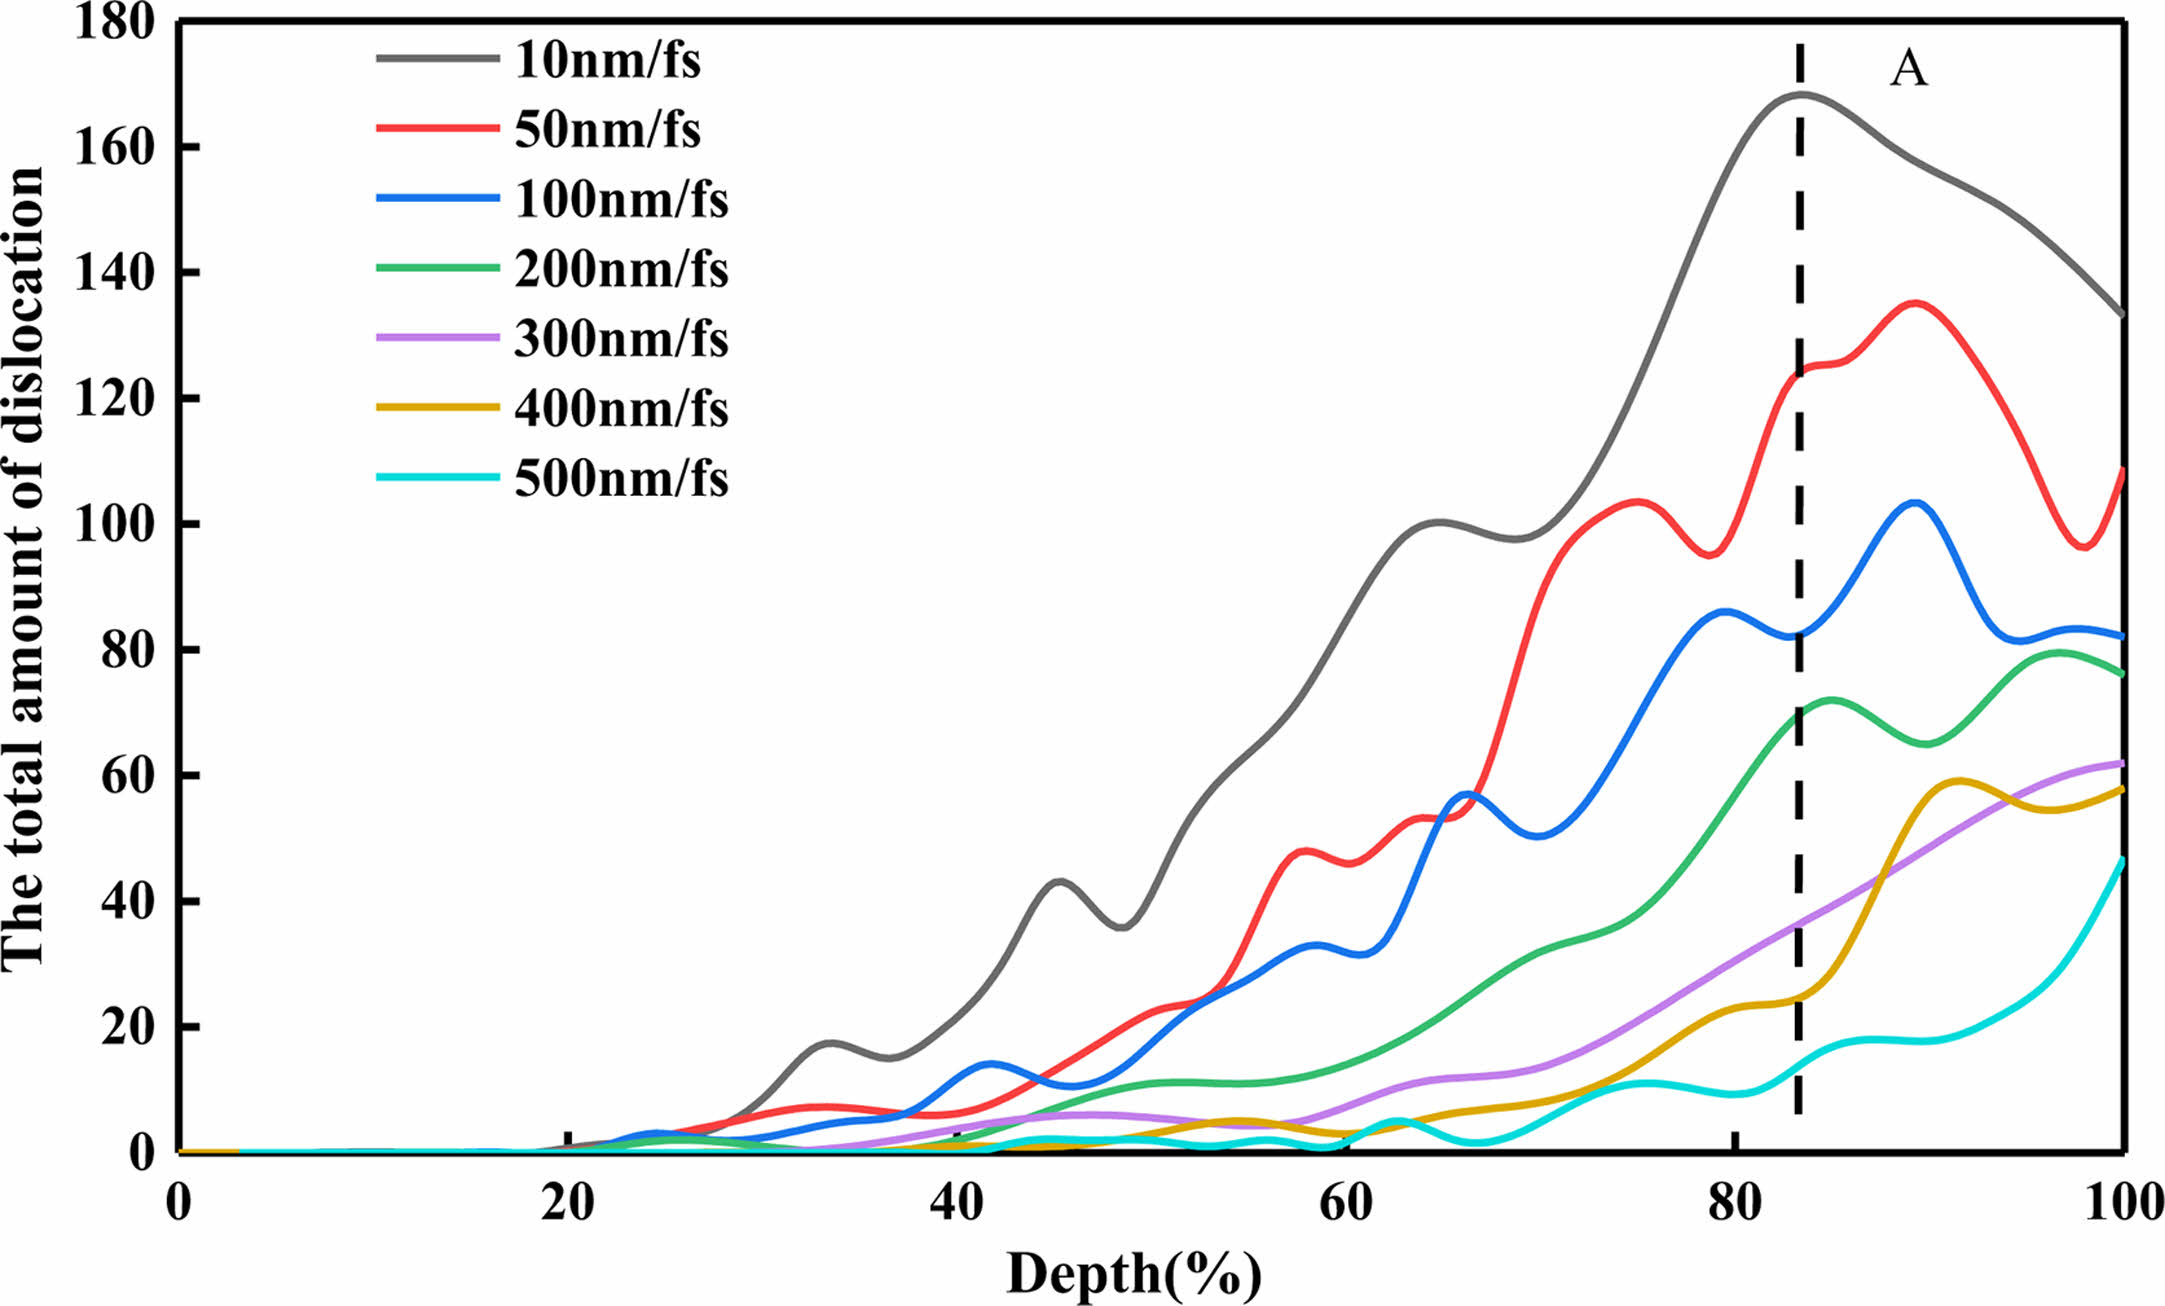
As shown in Fig. 6, the indenter at different speeds has a certain influence on the dislocation of the workpiece. From the vertical coordinate of the total amount of dislocation, there is a trend in the change of the total amount of dislocation: the lower the speed, the more the total amount of dislocation produced by the indenter on the workpiece. The different speed of the indenter leads to the different location of the dislocation caused by the pressing depth of the workpiece. The higher the speed, the deeper the dislocation of the workpiece. When the indenter with a speed of 10 m/s is pressed down to 20% of the height of the workpiece, the dislocation will be generated. When the indenter with a speed of 50 m/s is pressed down to 22% of the height of the workpiece, the dislocation will be generated. When the indenter velocity reaches 300 m/s, the dislocations begin to appear when the depth reaches 34% of the workpiece height. When the speed of the indenter reaches 500 m/s, the dislocations begin to appear when the depth reaches 43% of the workpiece height. Since the interaction between dislocations can be transformed into each other, the spline curve fluctuates during statistics.
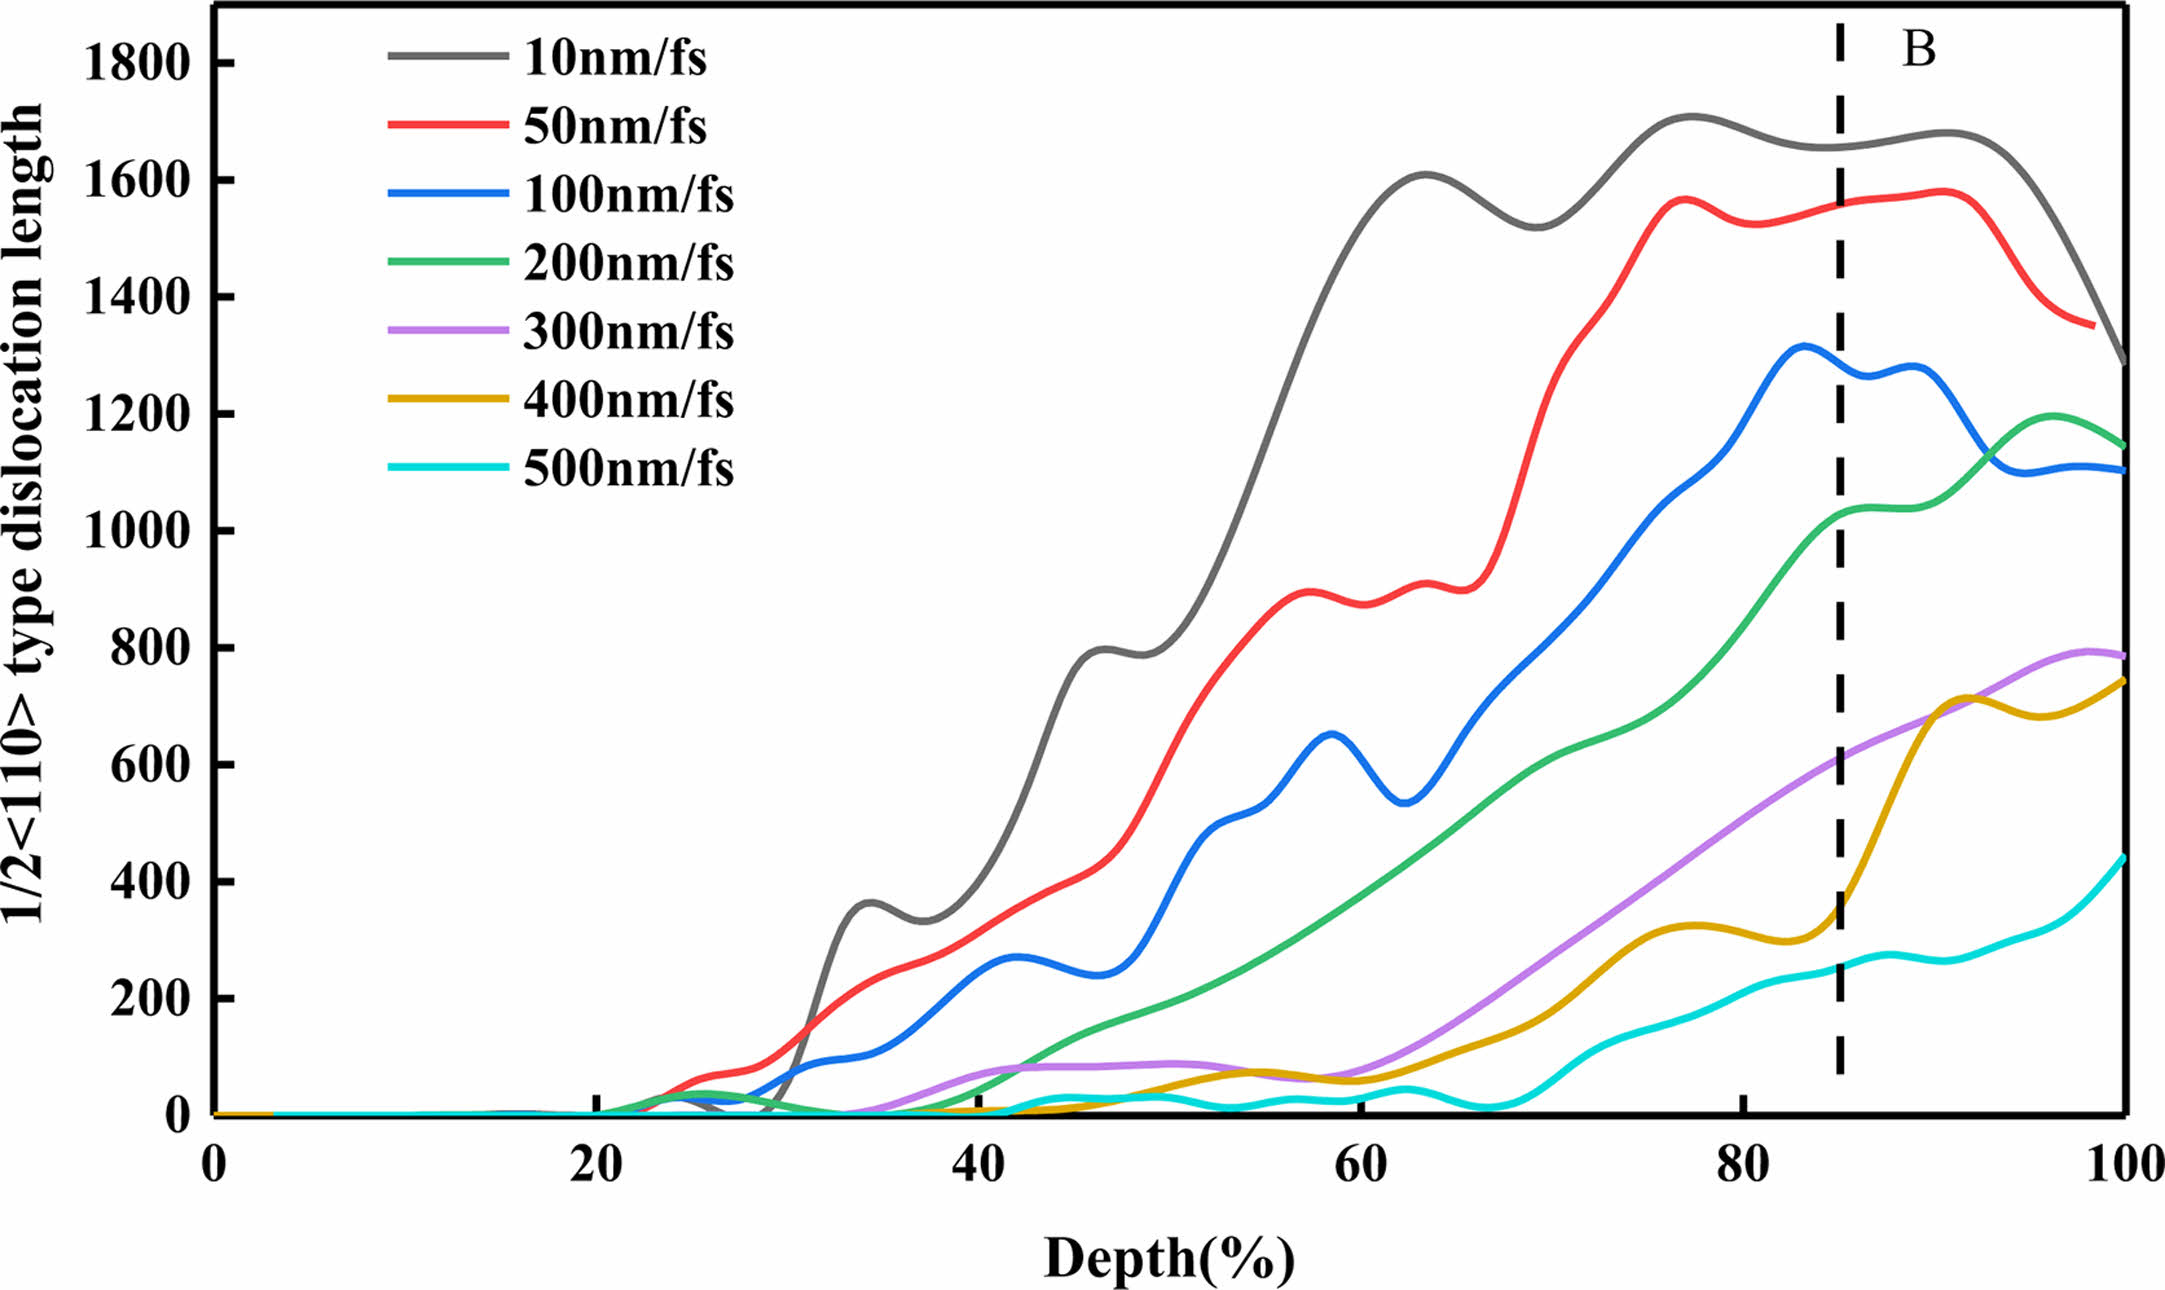
As shown in Fig. 7, the inpressor at different speeds produces 1/2<110> type dislocation accounts for the main part of the dislocation, so the spline curve reflected by this type of statistics is similar to the spline curve of total dislocation: the lower the speed of the pressure head, the more 1/2<110> types of dislocations, as shown in B; At the same time, the higher the speed, the deeper 1/2<110> type dislocation is; When the indenter speed is low, the indenter first produces 1/6<112>. With the increase of speed, the 1/2<110> type dislocations prior to the 1/6<112> type dislocation generate, and the length of the dislocation is shorter and shorter.
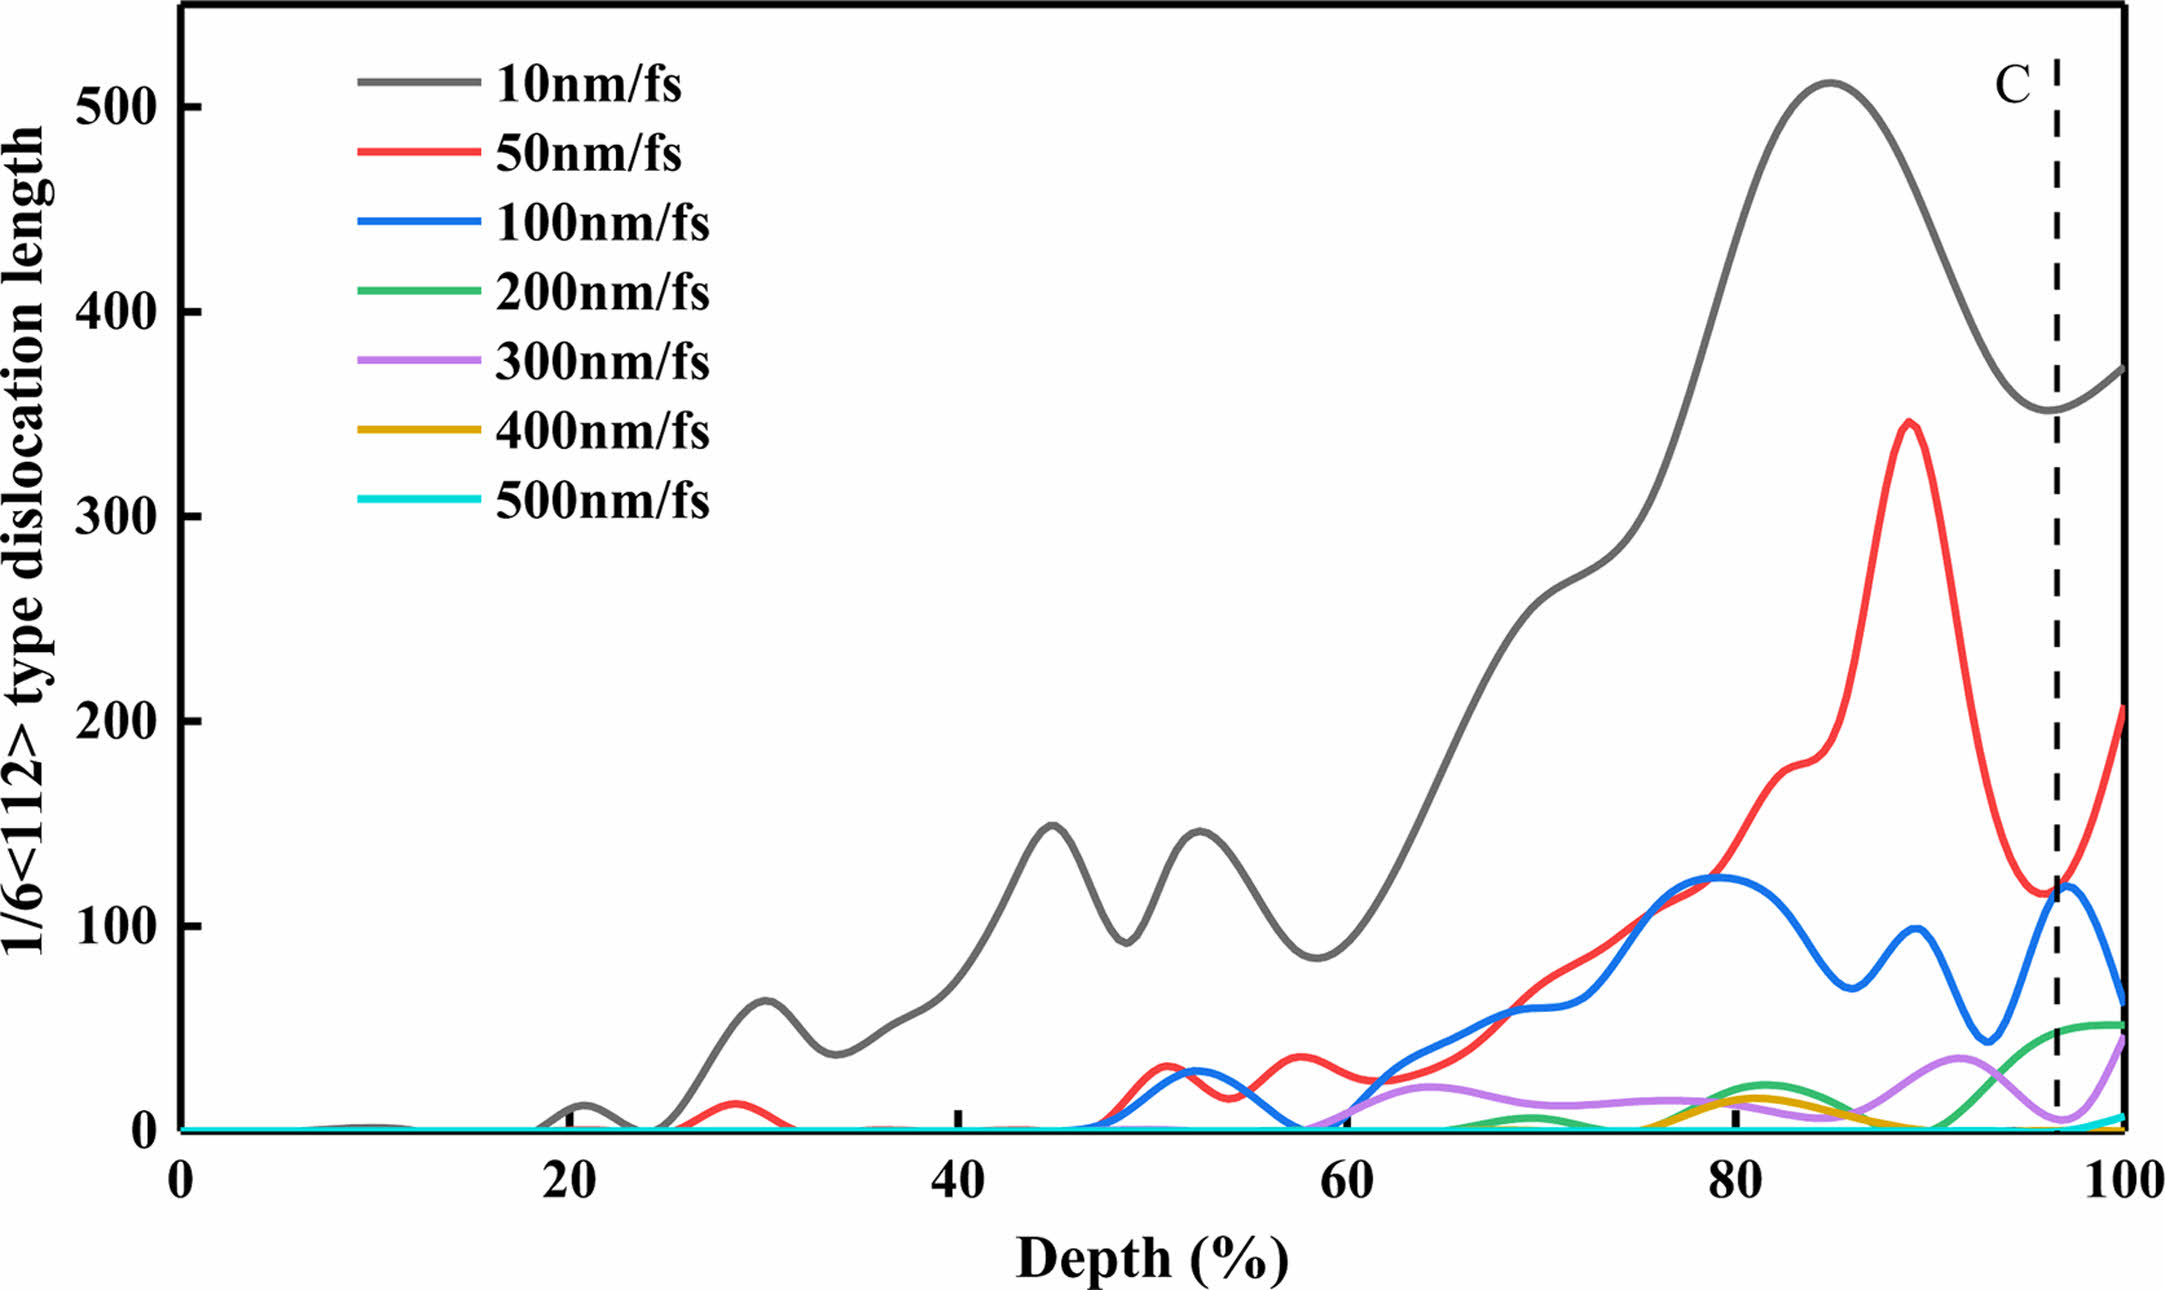
As shown in Fig. 8, incompressors at different speeds have a 1/6<112> type dislocation effect on the workpiece, and the proportion of this type of dislocation is second only to 1/2<110> type dislocation. This type of dislocation also reflects the variation trend of 1/2<110> type dislocation: With the increase of the indenter speed, the 1/6<112> type dislocation generated by the indenter becomes deeper and deeper. When the indenter speed is 10 m/s, the 1/6<112> type dislocation generated by the indenter is 14% of the workpiece height, and the 1/2<110> type dislocation generated by the indenter is 17%. When the speed of the indenter is 50 m/s, the depth of the indenter is 28% of the height of the workpiece when the workpiece is pressed with 1/6<112> type dislocation. When the speed of the indenter is 300 m/s, the indenter lowers the workpiece to produce 1/6<112> type dislocation, and the pressing depth is 63% of the height of the workpiece; When the speed of the indenter is 500 m/s, the depth of the indenter is 98% of the height of the workpiece when the workpiece is pressed with 1/6<112> type dislocation. And with the increase of speed, the length of 1/6<112> type dislocation becomes shorter and shorter. When the speed of the inpressor is 10 m/s, the length of 1/6<112> type dislocation generated when the inpressor presses the workpiece is 373.19. When the speed of the inpressor is 500 m/s, the 1/6<112> type dislocation only appears when the inpressor presses the bottom. At this time, the length of 1/6<112> dislocation is 7.19.
|
Fig. 2 Relationship between indentation depth and load under different loading speed. |
|
Fig. 3 Dislocation variation in the specimen at 50 m/s indenter velocity. |
|
Fig. 4 Schematic diagram of elastic deformation of 3C-SiC nanoindentation. |
|
Fig. 5 Dislocation generation at different velocities. |
|
Fig. 6 The total number of dislocations produced by the workpiece under different speed indenter |
|
Fig. 7 The number of dislocations of type 1/2<110> can be generated in the workpiece under different speed indenter. |
|
Fig. 8 The workpiece produces 1/6<112> type dislocations under different speed indenter |
(1) Compared with the results of molecular dynamics simulation, it can be seen that with the increase of the indenter velocity, the elastic deformation of the workpiece will be transformed into plastic deformation earlier. The threshold value of the elastic deformation stage is reduced, and the threshold value of the plastic deformation stage is increased, but when the velocity reaches a certain degree, the threshold value of the plastic deformation stage is basically unchanged. And with the increase of the velocity, the fluctuation in the elastic deformation region will become more and more gentle.
(2) With the increase of the speed, the total amount of dislocations generated by the indenter on the workpiece is less and less. The different velocity of the indenter leads to the different position of the dislocation caused by the depth of the workpiece. The higher the velocity is, the deeper the position of the dislocation is.
(3) The greater the loading rate , the shorter the length of various dislocations, and the dislocations will spread around the indenter. The diffusion rate will also change with the speed of the indenter. The higher the speed of the indenter, the lower the diffusion rate, and the more regular the dislocation diffusion.
This work is supported by the National Natural Science Foundation of China [grant number: 51964022].
The authors declare that they have no known competing financial interests or personal relationships that could have appeared to influence the work reported in this paper.
- 1. Z. Zhang, B. Guo, and F.J. Wang, IEEE Trans. Power Electron. 34[9] (2019) 9082-9094.
-

- 2. N. Yun, J. Lynch, and W.J. Sung, Appl. Phys. Lett. 114[19] (2019) 192104.1-192104.5.
-
- 3. H. Nam and K.-W. Nam, J. Ceram. Process. Res. 22[1] (2021) 66-73.
-
- 4. H.S. Nam, J. Ceram. Process. Res. 20[4] (2019) 379-387.
-
- 5. S. Xiao-Ye and W. Tao, Electronics & Packaging 12[05] (2012) 5-10.
- 6. H.L. Dong, C.K. Jong, and J.K. Deug, J. Journal of Ceramic Processing Research 14[3] (2013) 322-326.
-
- 7. F. Giorgis, F. Giuliani, C.F. Pirri, E. Tresso, J.P. Conde, and V. Chu, J. Journal of Non-Crystalline Solids. 227[part-P1] (1998) 465-469.
-
- 8. B. Zhang, X.C. Deng, and Y.R. Zhang, J. Journal of China Academy of Electronics and Information Technology 4[2] (2009) 111-118.
- 9. R. Wu, K. Zhou, C. Y. Yue, J. Wei, and Y. Pan, J. Progress in Materials Science 72[1] (2015) 1-60.
-
- 10. M. Mishra and I. Szlufarska, Acta Materialia 57[20] (2009) 6156-6165.
-
- 11. G. Xiao, S. To, and G.J. Zhang, Int. J. Mach. Tools Manuf. 88[1] (2015) 214-222.
-
- 12. S. Goel, X. Luo, and R.L. Reuben, Comput. Mater. Sci. 51[1] (2012) 402-408.
-
- 13. S. Naderi, M.A. Hassan, and A.R. Bushroa, J. Materials & Design. 67[1] (2015) 360-368.
-
- 14. K.Q. Liu, Z.J. Jin, N.A. Zakharova, L.B. Zeng, H.S. Meysam, A. Adedoyin, and S. Saurabh, J. International Journal of Rock Mechanics and Mining Sciences 162[1] (2023) 105282.
-
- 15. P.C. Zhu, Y.J. Zhao, S. Agarwal, J. Henry, and S.J. Zinkle, J. Materials & Design 213[1] (2022) 110317.
-
- 16. L. Zhang and I. Zarudi, Int. J. Mech. Sci. 43[9] (2001) 1985-1996.
-
- 17. P.Z. Berke and T.J. Massart, Tribol. Int. 47 (2012) 167-174.
-
- 18. M. Mata and J. Alcalá, J. Mech. Phys. Solids 52[1] (2004) 145-165.
-
- 19. R. Li, T. Liu, X. Chen, S.-C. Chen, Y.-H. Fu, and L. Liu, Acta Physica Sinica 67[19] (2018) 51-61.
-
- 20. M. Imran, F. Hussain, M. Rashid, and S.A. Ahmad, J. Chin Phys B. 21[11] (2012) 116201.
-
- 21. H.U. Tengyue and Z. Bailin, Comput. Aided Eng. 22[05] (2013) 105-107.
- 22. Z. Guohui, J. Zhijie, and W. Jun, Journal of University of Science and Technology Beijing 02[01] (1999) 26-28.
- 23. C.-D. Wu and W.-X. Jiang, J. Mol. Model. 24[9] (2018) 253-259.
-
- 24. R.-Q. Han, H.-Y. Song, M.-R. An, W.-W. Li, and J.-L. Ma, Acta Physica Sinica 70[06] (2021) 275-283.
-
- 25. H.J.C. Berendsen, J.P.M. Postma, G.W.F. Van, A. DiNola, and J. R. Haak, J. Journal of Chemical Physics. 81[8] (1984) 3684-3690.
-
- 26. W.G. Hoover, Phys. Rev. A 34[3] (1986) 2499.
-
- 27. P. Vashishta, R.K. Kalia, A. Nakano, and J.P. Rino, J. Journal of Applied Physics. 101[10] (2007) 103515.
-
- 28. J. Tersoff, Phys. Rev. B 37[12] (1988) 6991-7000.
-
- 29. P. Erhart and K. Albe, Phys. Rev. B - Condens. Matter Mater. Phys. 71[3] (2005) 1-14.
-
- 30. J. Yan, T. Asami, H. Harada, and T. Kuriyagawa, J. Precision Engineering 33[4] (2009) 378-386.
-
 This Article
-
2023; 24(2): 397-405
Published on Apr 30, 2023
- 10.36410/jcpr.2023.24.2.397
- Received on Sep 26, 2021
- Revised on Mar 31, 2023
- Accepted on Apr 3, 2023
Services
- Abstract
introduction
experimental
results and discussion
conclusion
- Acknowledgements
- Declaration of Interest
- References
- Full Text PDF
Shared
Correspondence to
- Wu Nanxing
-
aSchool of Mechanical and Electronic Engineering, Jingdezhen Ceramic University, Jingdezhen 333403, PR China
bNational Engineering Research Center for Domestic & Building Ceramics, Jingdezhen 333001, PR China
Tel : 139 7981 1390 Fax: 139 7981 1390 - E-mail: ldhjdz1987@163.com
Clean-Energy Research Institute(CRI), Hanyang University, 222, Wangsimni-ro, Seongdong-gu, Seoul, 04763, Korea
E-mail: jcpr@hanyang.ac.kr