


- Effects of Zn content on microstructure and magnetic properties of MnZn ferrite
Yingming Zhang, Yujie Yang*, Dongyang Chen, Congliang Chen and Yuting Meng
Engineering Technology Research Center of Magnetic Materials, Anhui Province, School of Materials Science and Engineering, Anhui University, Hefei 230601 P. R. China
This article is an open access article distributed under the terms of the Creative Commons Attribution Non-Commercial License (http://creativecommons.org/licenses/by-nc/4.0) which permits unrestricted non-commercial use, distribution, and reproduction in any medium, provided the original work is properly cited.
The Mn1-xZnxFe2O4 (x = 0.46, 0.47, 0.48, 0.50, 0.51) ferrite materials were prepared by solid-state reaction. The effects of varying Zn concentration on the magnetic characteristics and microstructure of MnZn ferrites were investigated. All of these ferrites are one spinel phase, according to XRD analysis, and no additional heterogeneous phases are generated. The diffraction peaks of the samples appear to be shifted to a higher angle compared to the standard cards. The sample's very big and irregular grain development caused the sample's grain size to vary as the zinc level increased. The power loss of MnZn ferrite can be decreased because to this phenomena. The PCV value decreases as the Zn level of the samples increases. The PCV of this ferrite is as high as 242.6 mW/cm3 at a frequency of 150 kHz with a Zn concentration of x = 0.46. Under the same test circumstances, ferrite's PCV value is only 115.2mW/cm3 when the Zn concentration is x = 0.48. The complex permeability of the samples rises with an increase in Zn concentration. In the ferrite sample with the highest Zn content (x = 0.51), its μ' value keeps at a high level with the change of frequency. When the frequency is 10 kHz, the μ' value is as high as 260.9. Additionally, all of these ferrite samples demonstrated stability against interference at frequencies lower than 150 kHz
Keywords: MnZn ferrite, Zn content, Microstructure, Magnetic properties, Complex permeability
The relationship between the magnetic properties and the crystal structure of spinel is being studied. Chemistry demonstrates how a crystal's internal structure, chemical composition, and physical characteristics are related [1]. Spinel ferrite research has always been in the theoretical and practical research stages due to the dielectric and magnetic characteristics of spinel ferrite being highly different from bulk materials and their applicability in diverse sectors [2, 3].
MnZn ferrites, which are spinel ferrites, stand out from the others due to their high permeability, low coercivity, low power consumption and high resistivity. Transformers, inductors, magnetic heads, memory devices, and other electronic equipment frequently employ MnZn ferrites [4, 5]. Unique physical and chemical characteristics of MnZn nanoparticles make them advantageous for the creation of prospective therapeutic agents, environmentally safe antiviral sprays based on nanomaterials, medication delivery, and antiviral surface coatings. This results from the synthesis technique selection, which determines the size and charge capacity of MnZn ferrites. A lot of medications can access the virus's active site because to the size tunability, and the charge tunability makes it easier for pharmaceuticals to penetrate the virus' charged section [6]. MnZn ferrites might also be utilized to create biosensors that can identify viral strains like COVID-19 early on. MnZn ferrites, for instance, might be utilized to create sensors based on the enormous magnetoresistance that have been used to detect viruses [7]. This means that whether MnZn ferrite is utilized in bulk form or in powder form, it must first be prepared into a high-quality powder.
Solid-state reaction [8], chemical coprecipitation [9], microemulsion method [10], hydrothermal method [11], sol-gel method [12], and others are methods for creating high-performance MnZn soft magnetic ferrite. Dhiman et al. [13] prepared Zn substituted Mn ferrites with ceramic method. The unit cell parameter "a" of a single crystal reduces linearly with the replacement of Zn content because the radius of the Zn2+ ion is tiny. Vibrating sample magnetometer (VSM) measurements of the saturated magnetization of the samples at 300 K revealed a linear reduction in saturation magnetization with increasing Zn concentration. With a rise in Zn content, the saturation magnetic moment of the molecular formula drops, indicating the presence of collinear magnetic structure. Gopalan et al. [14] investigated the impact of Zn substitution on MnZn ferrites with relation to MnZn spinel ferrites. They discovered that the magnetic and structural characteristics are altered by the Zn content. The rate of grain size decline progressively obscures the first abrupt fall as Zn concentration rises, and saturation magnetization increases initially before declining.
However, the power loss and permeability of Mn1-xZnxFe2O4 ferrites were not analyzed. The effects of Zn concentration on the microstructure and magnetic characteristics of Mn1-xZnxFe2O4 ferrites were investigated in this work.
The method of solid-phase preparation was used to create the MnZn ferrites. The Fe2O3 with purity of 99.9%, nano-ZnO (particle size is about 30 ± 10 nm), and Mn3O4 are used. The components were weighed in accordance with the formula ratio of the chemical compound Mn1-xZnxFe2O4 (x = 0.46, 0.47, 0.48, 0.50, and 0.51). The ball was then pulverized in a QM-QX1L omnidirectional planetary ball mill at 200 rpm for six hours after the addition of deionized water. The bulk material was crushed to a powder in a mortar once the ball milling material had dried. The powder was cured for three hours at a flow rate of 2 L/min at 850 °C in a nitrogen atmosphere in an ASGL-1400 tubular atmosphere furnace. The desired material was mixed with SiO2 (0.05 wt%), CaCO3 (0.015 wt%), and Co3O4 (0.01 wt%) before being ball-milled in an omnidirectional planetary ball mill at 200 rpm for six hours. The slurry was dried and processed into powder. One weight percent of polyvinyl alcohol (PVA) was used as a binder to aid with powder press molding later on, and one weight percent of zinc stearate was employed as a release agent. The annular samples were placed in a nitrogen-filled tubular environment furnace and heated to 1150 °C for 3 hours before being fired, molded, and cooled in the furnace. The samples were maintained in a flowing nitrogen environment throughout the sintering and cooling procedure.
A Japanese Smart Lab type X-ray diffractometer running at 40 kV and 100 mA was used to characterize the phases of MnZn ferrites. The S-4800 cold field emission scanning electron microscope (SEM), manufactured by the Japanese company Hitachi High-tech, was used to examine the sample microstructures. The magnetic permeability and power loss of the magnetic ring samples were examined using the IE-1125 B-H ac magnetic characteristic analyzer.
Phase analysis
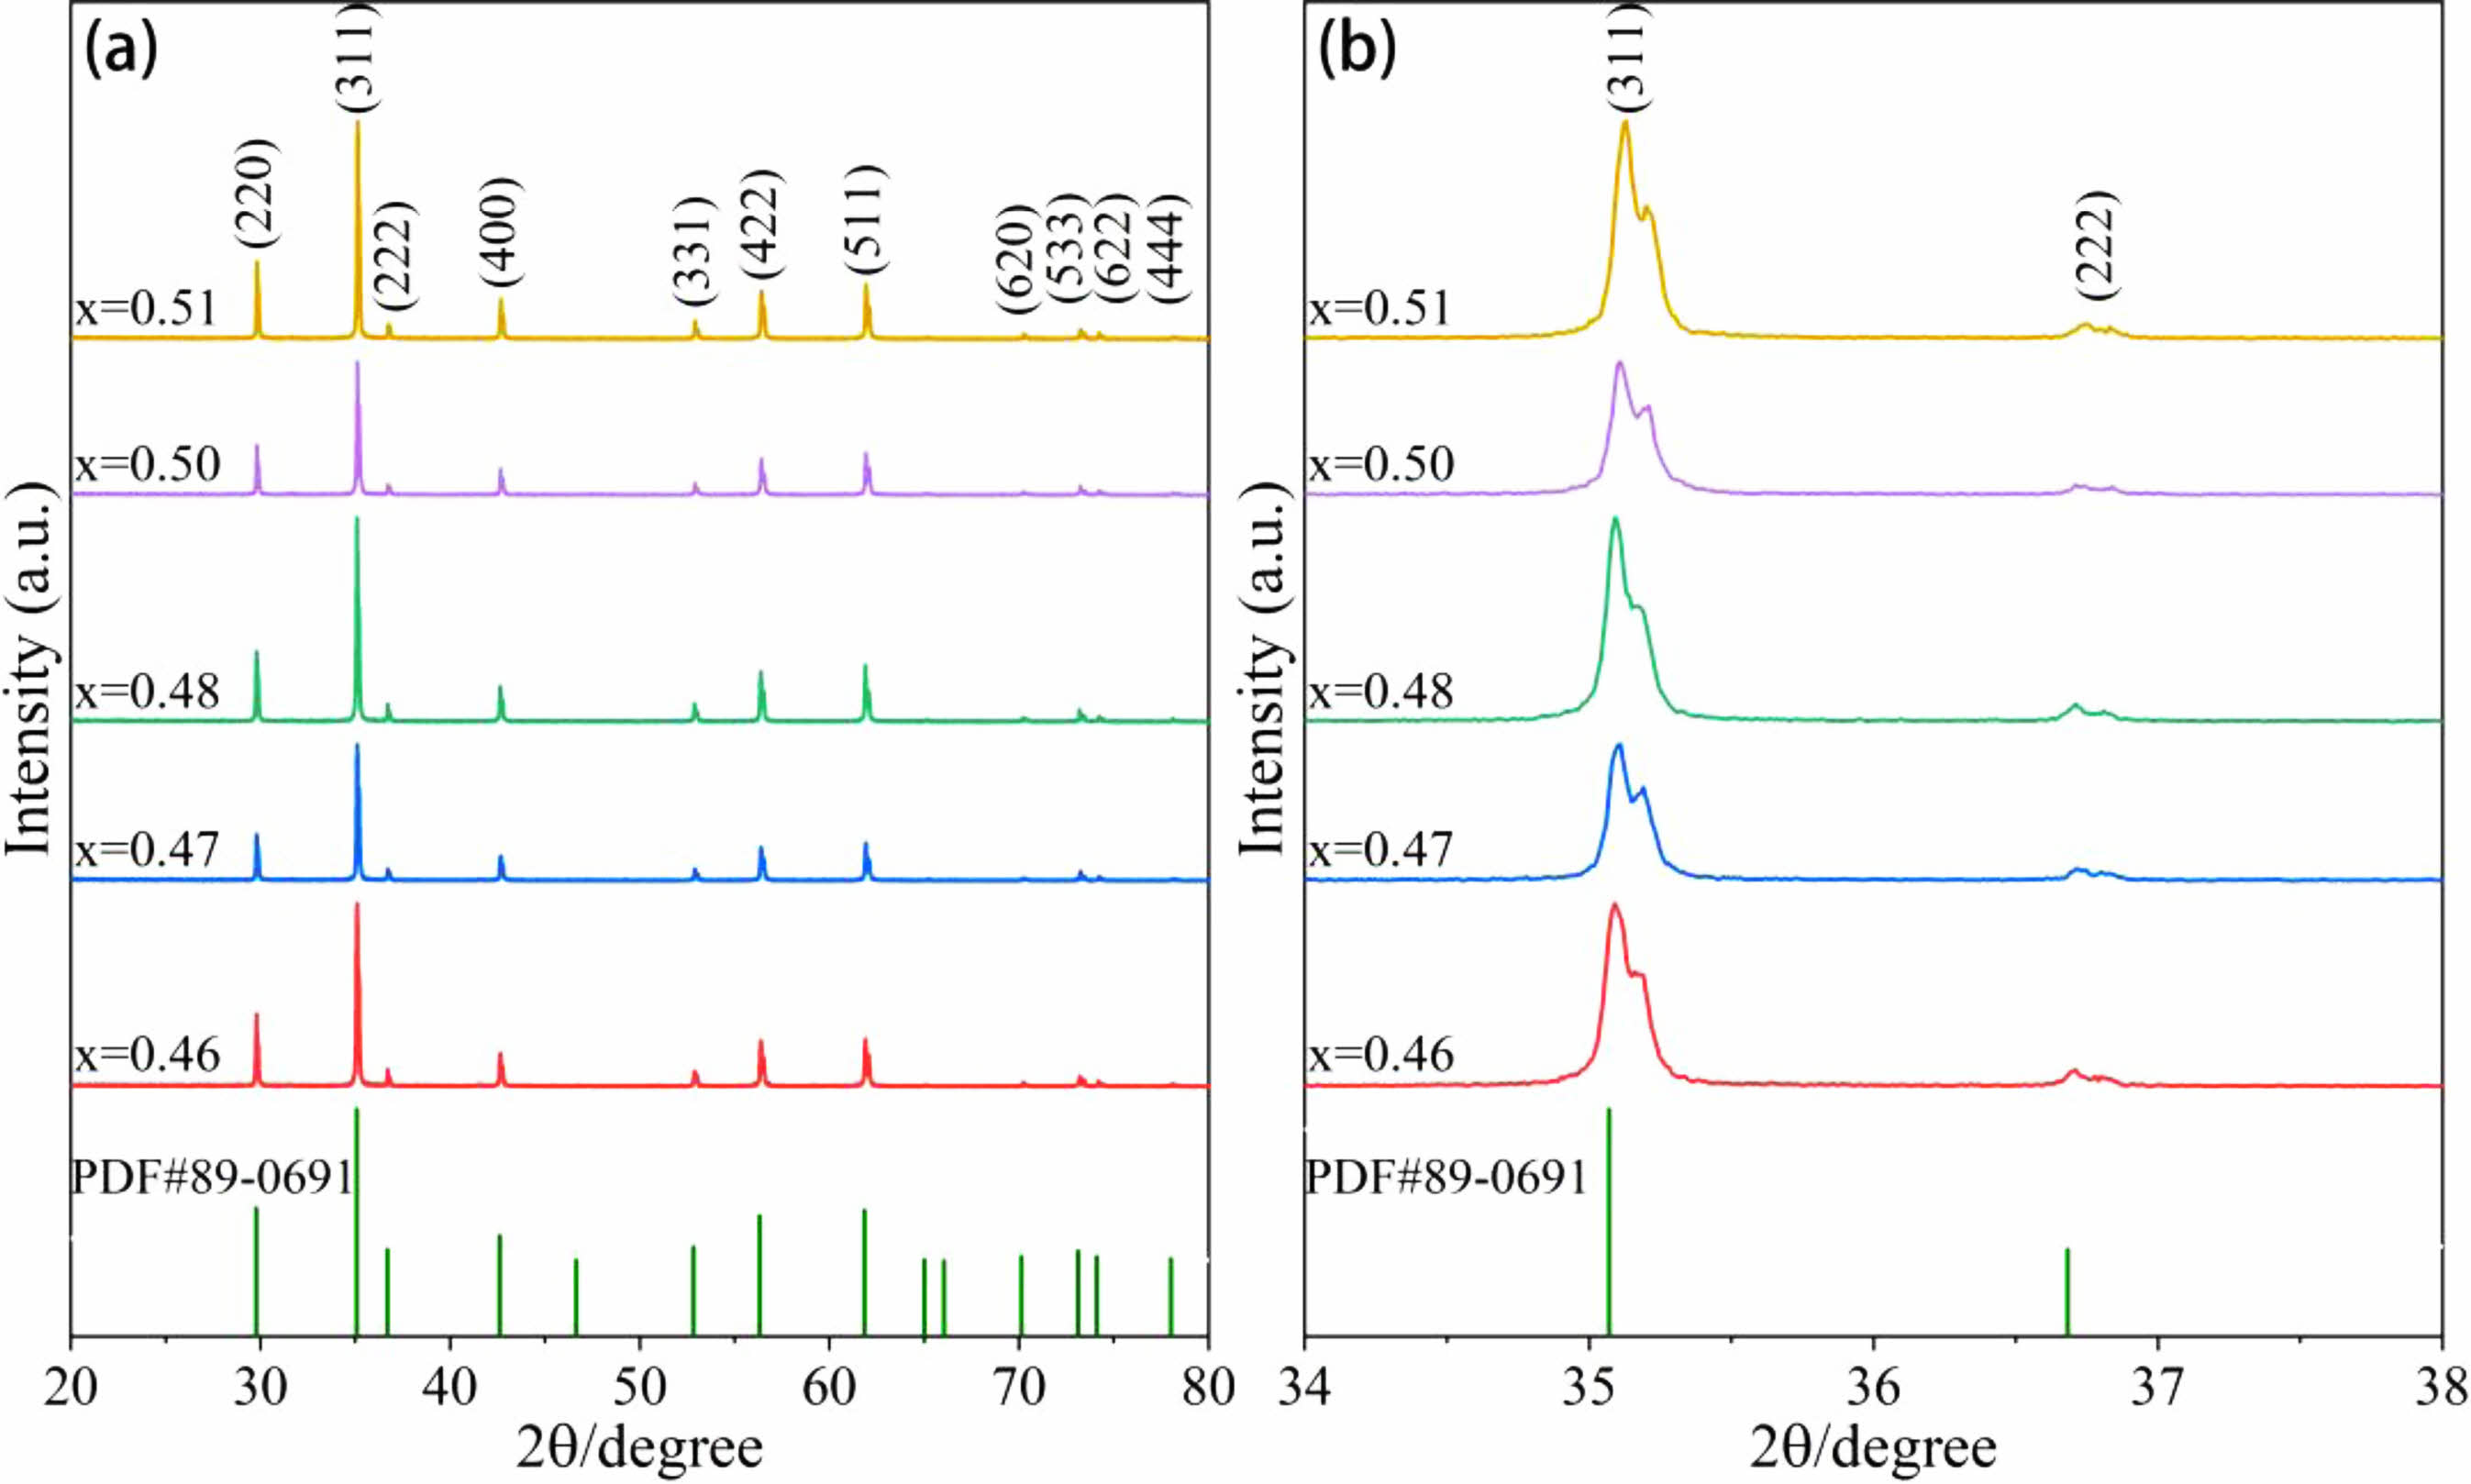
The XRD patterns of MnZn ferrites with various Zn concentrations are shown in Fig. 1, along with a somewhat expanded view of the diffraction angles between 34° and 38°. The MDI-jade 6 program is used to study the XRD patterns of MnZn ferrites. As demonstrated in Fig. 1(a), the conventional PDF card (74-2400) with spinel structure and the MnZn ferrite generated by altering Zn concentration have essentially the same diffraction peaks and share a single spinel structure. The crystallinity is excellent, the diffraction peak intensity is strong, and no further impurity phases are developing. The principal crystal planes for diffractive light are (220), (311), (400), (422), (511) and so on. The primary peak is the (311) diffraction peak. The diffraction peaks of the samples shift to the right in relation to the standard card, as seen by the partial enlargement of Fig. 1(b). The diffraction peak shifts upward, in other words. As a result of this event, the cell contracts and the lattice constant drops. The major cations Mn2+ (0.89 Å) [15], Zn2+ (0.74 Å) [16] and Fe3+ (0.64 Å) [17], in the doped SiO2, have lower ionic radius values than Si4+ (0.40 Å) [18]. According to Bragg's formula [19] :

Here, d is the spacing between crystal planes, θ is the angle between the incident X-ray and the corresponding crystal plane, λ is the wavelength of the X-ray, and n is the diffraction order. As can be observed, a change in unit cell causes a change in the diffraction peak angle, and a big angle diffraction peak is more noticeable than a small angle diffraction peak. The high angle peak also travels to the right, as seen in Fig. 1(a). Ca2+ (1.06 Å) [20] is also doped, although while having a greater ionic radius and lower concentration than Si4+, it has essentially little impact on the diffraction peak migration.
Microscopic morphology analysis
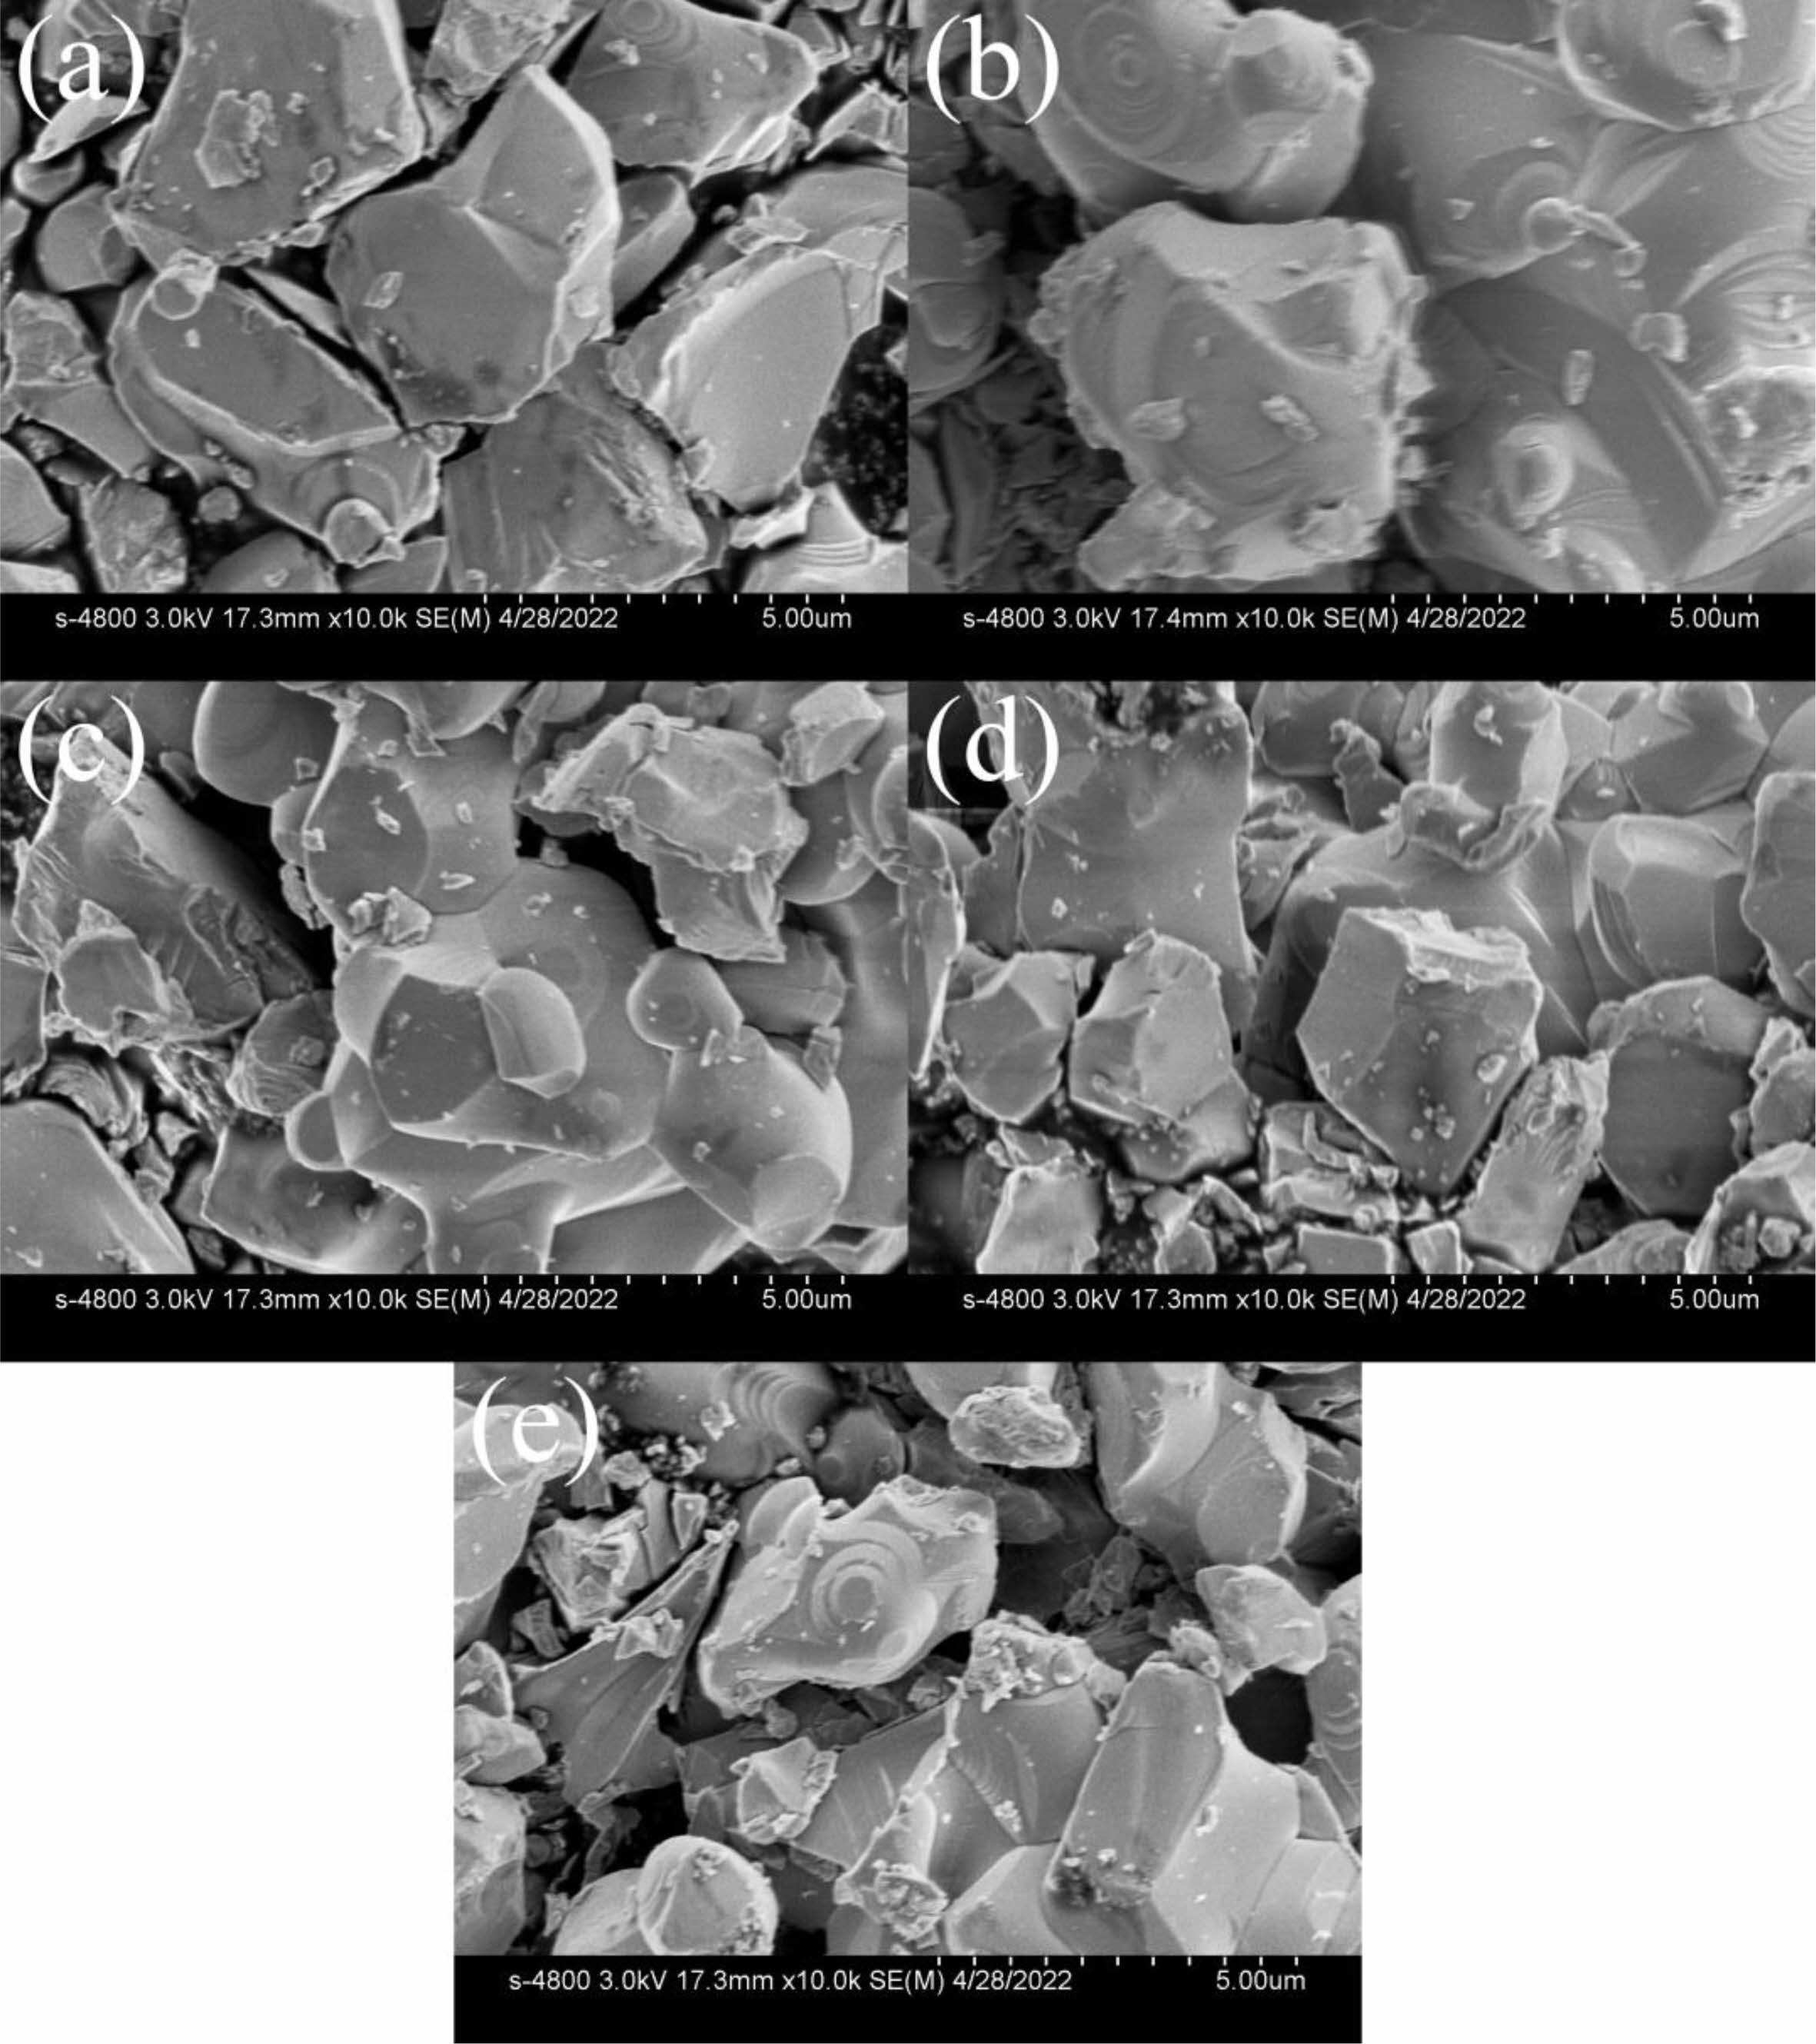
SEM pictures of MnZn ferrite cross sections with various Zn contents are shown in Fig. 2. When the Zn concentration varies significantly, the grain size is not uniform, and the development is discontinuous, the spinel crystal shape of Mn1-xZnxFe2O4 ferrites may be seen. A little quantity of doping can lead to discontinuous grain development in MnZn ferrite because the additional SiO2 is an impurity [21]. On the other hand, it has been demonstrated that silicon enrichment in the grain boundary layer increases the material's resistivity [22-24].
Magnetic properties
It is generally known that hysteresis loss (Physt), eddy current loss (Ped), and excess loss (Pexc) make up the majority of the total loss (PT) [25]. The two primary components are Physt and Ped at low frequencies. The key players at low frequencies are Physt and Ped. Consequently, a formula may be used to roughly compute the total loss [26] :
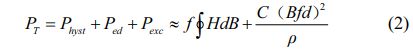
Here, f is the frequency, H is the magnetic field intensity, B is the magnetic induction density, C is the proportional constant, d is the height and ρ is the resistivity of the sample.
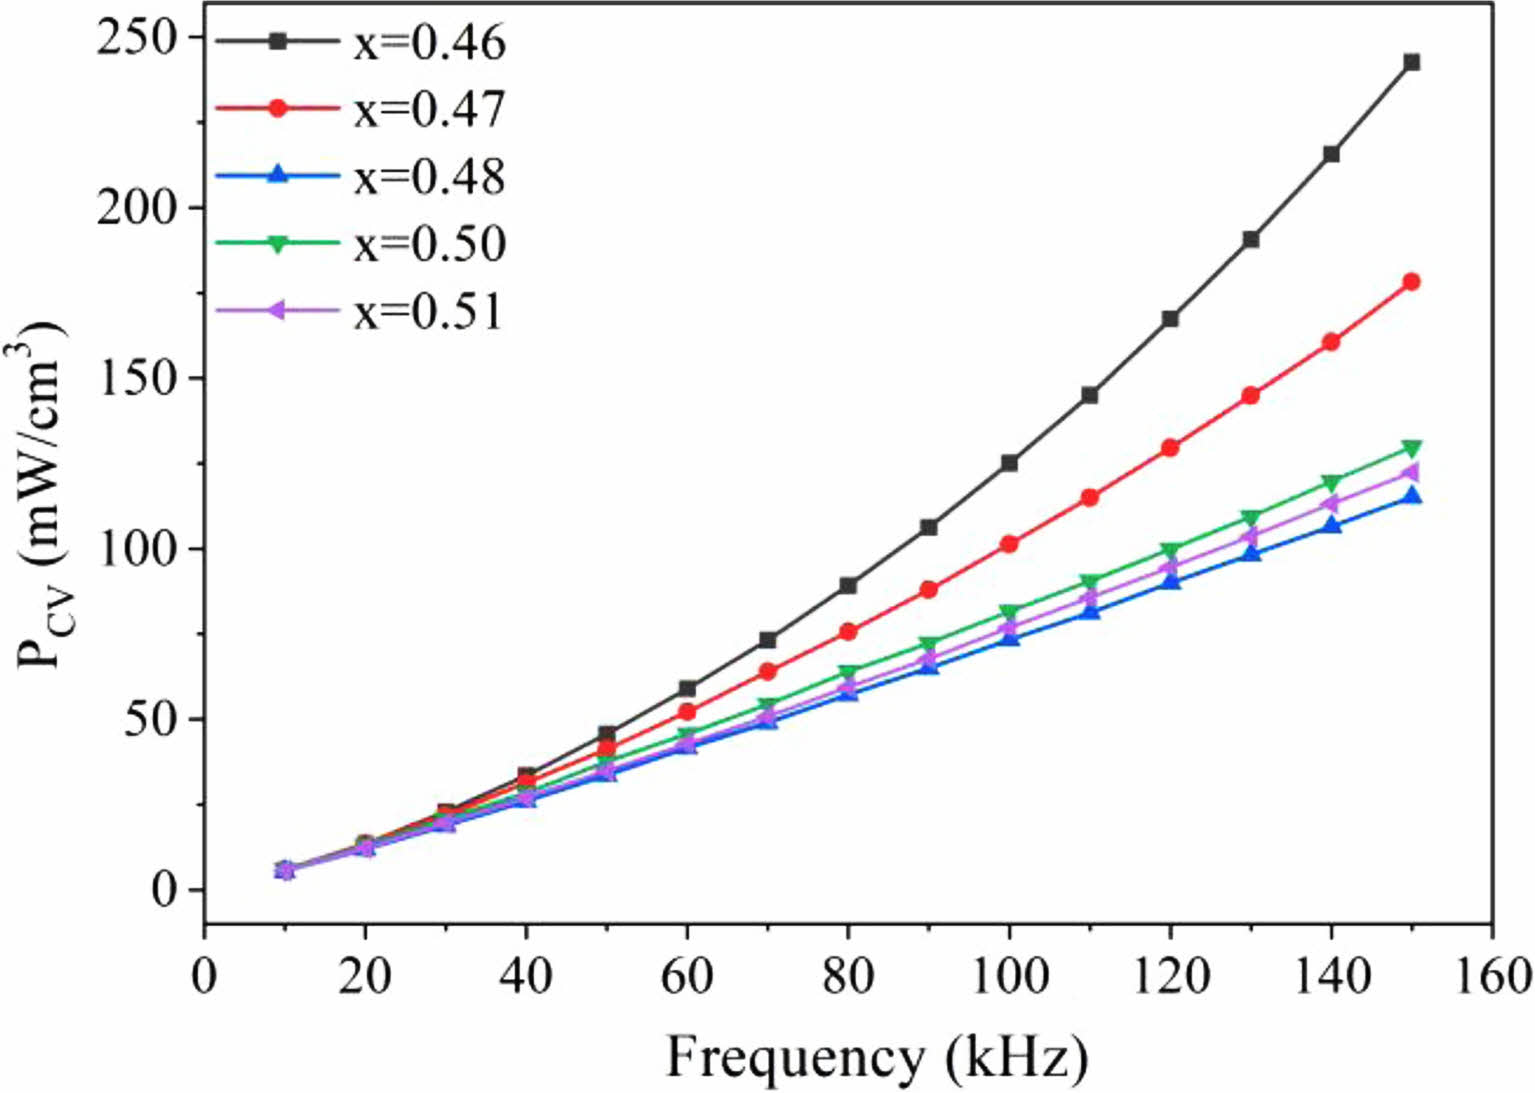
In test settings with magnetic induction intensity Bm = 20 mT, Fig. 3 displays the frequency characteristic curves of the power loss PCV of the MnZn ferrite magnetic rings. As can be observed, the PCV of all samples increases as frequency increases in the studied frequency band. The loss difference is quite slight at lower frequencies, though. Each sample's loss starts to exhibit a different growing pattern as frequency continues to rise. In instance, at a Zn content of x = 0.46, the loss rises the quickest. The PCV of this sample reaches a maximum of 242.6 mW/cm3 at 150 kHz. As demonstrated in the figure, the power loss for MnZn ferrite with x = 0.48, 0.50, and 0.51 Zn concentration increases in the studied frequency bands virtually in lockstep. Zn concentration is at 0.48 when the power loss starts to gradually rise. The PCV is 115.2 mW/cm3 at 150 kHz, the same frequency. When the temperature climbs over 680 °C during the sintering process of MnZn ferrite, ZnO and Fe2O3 progressively produce ZnFe2O4. Following that, recombination with MnFe2O4 produces MnZn ferrite. In other words, ZnO volatilization and ZnFe2O4 synthesis and breakdown have a significant impact on the production of spinel MnZn ferrite. Low Zn content samples experience more power loss because to their low Zn content and the volatilization of ZnO during sintering. However, for ferrites with higher Zn concentration, the PCV is significantly smaller.
The correlation between frequency and the complex permeability of soft ferrites made of Mn1-xZnxFe2O4 is shown in Fig. 4. In alternating magnetic fields and magnetization states, MnZn soft magnetic ferrite is frequently utilized. Hysteresis vortices and magnetic aftereffects are responsible for energy loss in magnetic materials. Due to the presence of these losses, a phase difference between the magnetic induction intensity (B) and the magnetic field intensity (H) is produced during the transition from static or quasi-static to dynamic, changing the magnetic permeability from real numbers to complex numbers.
Let the external magnetic field H=H0cosωt, B lags δ compared with H, that is, B=B0cos (ωt-δ), then:
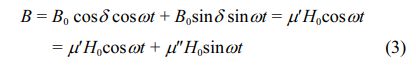
Here, μ' = (B0/H0)cosδ is the real part of the complex permeability of magnetic medium, and μ" = (B0/H0)sinδ is the virtual part of the complex permeability of magnetic medium [27].
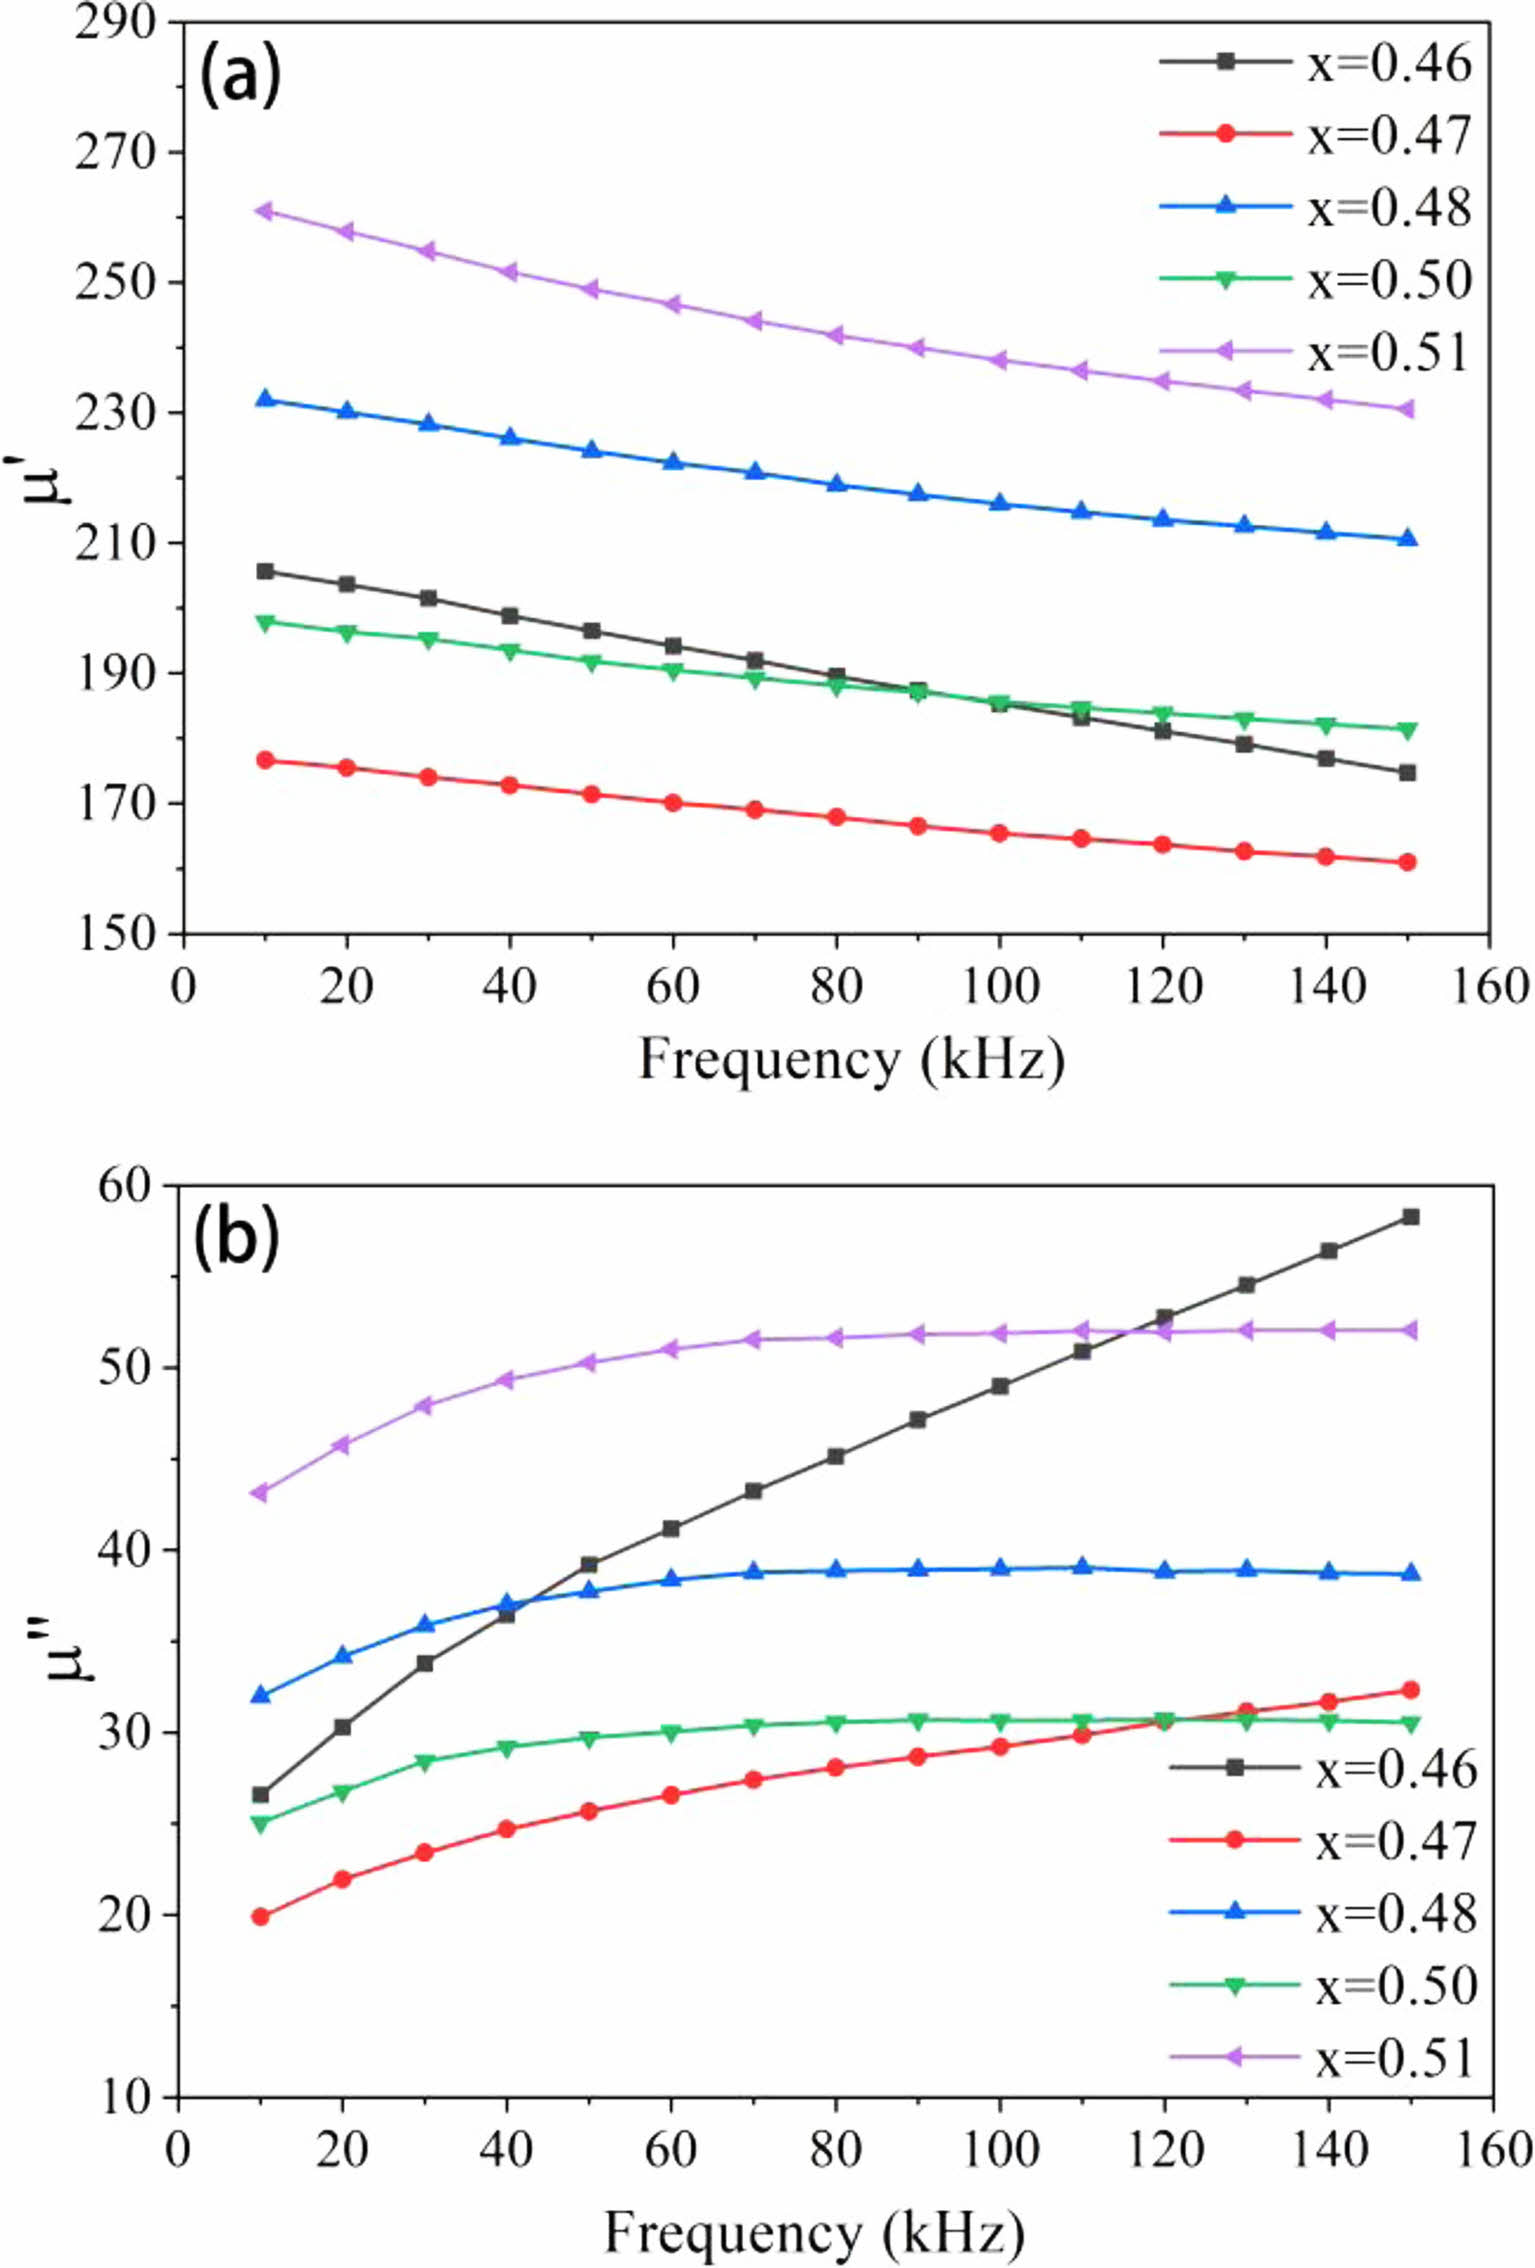
The link between the actual component of the complex permeability μ' and frequency change is depicted by the curve in Fig. 4(a). The μ' of five samples dropped with an increase in frequency, as indicated in the picture, and this pattern progressively flattens out. This suggests that the sample's permeability is steady despite the frequency variation. The connection between the μ' curves of samples with x = 0.46 and x = 0.50 moves back and forth between 80 kHz and 100 kHz, as can be seen clearly from the figure. The μ' value of the ferrite sample with the highest Zn concentration (x = 0.51) maintained at a high value regardless of how the frequency changed. The magnetic permeability of the material maintains a high level at low frequencies, with μ' = 260.9 at the initial frequency of 10 kHz. The average grain size for MnZn ferrites grows as the Zn concentration rises. Additionally, the number of grain boundaries is decreased, which lowers the material's magnetization resistance and helps to increase magnetic permeability.
The experiment's additions of SiO2, CaCO3, and Co3O4 have a significant impact on how well MnZn ferrite performs. Ca2+ (1.06), which is relatively big for spinel structure, can only solubilize in the crystal lattice of spinel. The ferrite's resistivity, losses, and Q value can all be enhanced as a result of Ca2+ accumulating at the grain boundary and forming an amorphous mesophase. In the experiment, adding a tiny bit of calcium doesn't significantly change the initial permeability, hysteresis loss, or excess loss. However, it contributes significantly to lowering eddy current loss, which significantly raises the Q value [28]. The amount of SiO2 injected shouldn't be too high. If it's less than 0.05 weight percent, crystal grains won't form normally. On the contrary, it will encourage grains to develop in irregular patches. Therefore, when CaO and SiO2 are properly combined, the CaSiO3 phase is created during high-temperature sintering. This concentrates on the grain boundaries and makes them thicker, creating a barrier layer with a high resistance. In addition, CaSiO3 is a type of flux that may reduce the sintering temperature and has a low melting point. It has been investigated how Co2+ affects the composition and magnetic characteristics of MnZn ferrite. Some Fe3+ ions are discovered to be forced into tetrahedral orientations when Co2+ ions replace Fe3+ ions in the spinel lattice [29]. Additionally, certain Fe2+ ions have been shown to preferentially favor the octahedral configuration [30]. Reduced eddy current loss and increased resistivity are the results of fewer electrons transitioning from Fe3+ to Fe2+ (Ped). The findings indicate that when Co content rises, the overall power loss reduces. The addition of Co2+ has minimal impact on the MnZn ferrite's initial permeability, but it significantly increases the stability of its power loss. Spinel ferrite has a significant normal crystal anisotropy constant because the ground-state orbital moment of the Co2+ ion is not zero and it exhibits a substantial spin-orbit coupling. After adding the proper quantity of Co2+, MnZn ferrites exhibit minimal power loss over a wide range of service temperatures and spinel ferrites typically have negative anisotropy constants.
The imaginary component (μ") of the complex permeability's frequency characteristic curve is shown in Fig. 4(b) below. The whole curve first rises in the low frequency range, and as the frequency increases, μ" eventually reaches saturation, resulting in a nearly smooth straight line. Only when the Zn concentration is between x = 0.46 and 0.47, specifically for the sample with x = 0.46, does μ" continually grow throughout the measuring frequency range. In Fig. (a), μ' generally falls rapidly whereas μ" drastically increases. The cut-off frequency of the material is often described as the frequency that decreases by μ' to 1/2. As of right now, μ" is the greatest, that is, the loss of the material is the largest. The maximum value of μ" is not reached, as can be seen in Fig. (b). The cut-off frequency of the ferrite with x = 0.46 wasn't measured since the measurement's frequency range was constrained.
|
Fig. 1 (a) XRD patterns and (b) local magnifications of Mn1-xZnxFe2O4 ferrite materials. |
|
Fig. 2 (a) x=0.46, (b) x=0.47, (c) x=0.48, (d) x=0.50, (e) x=0.51, SEM images of Mn1-xZnxFe2O4 ferrite samples. |
|
Fig. 3 Frequency characteristics of magnetic loss (PCV) in Mn1-xZnxFe2O4. |
|
Fig. 4 Frequency characteristics of complex permeability of samples: (a) real permeability μ', (b) imaginary permeability μ". |
By using the solid phase approach, Mn1-xZnxFe2O4 (x = 0.46, 0.47, 0.48, 0.50, 0.51) ferrite materials were created. There are no additional heterogeneous features in these materials and they are pure spinel. The sample's grain development is irregular due to impurities or material pores, and the fine modification of the Zn concentration has essentially little impact on it.
The volume loss (PCV) of MnZn ferrite samples is dramatically decreased with increasing Zn concentration in the low Zn content region. It ranges from 242.6 mW/cm3 at its maximum point to 115.2 mW/cm3. Their PCV frequency characteristic curves exhibit negligible variation with increasing Zn content.
The actual portion (μ') of complex permeability exhibits stability at various frequencies when the Zn concentration is adjusted. The samples with the lowest Zn concentration differ from other groups when assessing the complex permeability's frequency characteristics, which may be the result of experimental mistakes.
- 1. D.S. Mathew and R.S. Juang, Chem. Eng. J. 129[1-3] (2007) 51-65.
-

- 2. T. Dippong, F. Goga, E.A. Levei, and O. Cadar, J. Solid State Chem. 275 (2019) 159-166.
-
- 3. Y. K. Sun, D.Y. Li, P.Z. Gao, Z.L. Lu, and H.L. Ge, J. Ceram. Process. Res. 17[5] (2016) 499-503.
-
- 4. M.R. Syue, F. Wei, C.S. Chou, and C.M. Fu, Thin Solid Films. 519[32] (2011) 8303-8306.
-
- 5. J.A. Hwang, B.K. Ju, and M.P. Chun, J. Ceram. Process. Res. 21 (2020) S28-S32.
-
- 6. L. Singh, H.G. Kruger, G.E.M. Maguire, T. Govender, and R. Parboosing, Ther. Adv. Infect. Dis. 4[4] (2017) 105-131.
-
- 7. V.D. Krishna, K. Wu, A.M. Perez, and J.P. Wang, Front. Microbiol. 7 (2016) 400.
-
- 8. G. Kogias and V.T. Zaspalis, Ceram. Int. 42[6] (2016) 7639-7646.
-
- 9. H. Anwar and A. Maqsood, Mater. Res. Bull. 49 (2014) 426-433.
-
- 10. A. Kosak, D. Makovec, A. Znidarsic, and M. Drofenik, J. Eur. Ceram. Soc. 24[6] (2004) 959-962.
-
- 11. P.T.P. Phong , P.H. Nam, D.H. Manh, D.K. Tung, I.J. Lee, and N.X. Phuc, J. Electron. Mater. 44[1] (2015) 287-294.
-
- 12. J. Azadmanjiri, J. Non-Cryst. Solids 353[44-46] (2017) 4170-4173.
-
- 13. R.L. Dhiman, V. Singh, S.P. Taneja, and K. Chandra, AIP Conf Proc. 2093[1] (2019) 1-4.
-
- 14. E.V. Gopalan, I.A. Al-Omari, K.A. Malini, P.A. Joy, D.S. Kumar, Y. Yoshida, and M.R. Anantharaman, J. Magn. Magn. Mater. 321[8] (2009) 1092-1099.
-
- 15. R.H. Kadam, K. Desai, S.R. Kadam, and S.E. Shirsath, Solid State Sci. 26 (2013) 31-37.
-
- 16. Y. Liu, F.F. Min, T. Qiu, M.X. Zhang, and C.Y. Xu, J. Wuhan Univ. Technol.-Mat. Sci. Edit. 25[3] (2010) 429-431.
-
- 17. R.D. Shannon, Acta Crystallogr. A. 32[5] (1976) 751-767.
-
- 18. Q.H. Meng, J.G. Li, Q. Zhu, X.D. Li, and X.D. Sun, J. Alloy. Compd. 797 (2019) 477-485.
-
- 19. G.E.M. Jauncey, Proc. Natl. Acad. Sci. U.S.A. 10[2] (1924) 57-60.
-
- 20. Y.P. Li, D.X. Bao, Z.Z. Wang, Y.J. Zhang, L.Z. Chen, G.C. Zha, and M.L. Wu, J. Alloy. Compd. 734 (2018) 130-135.
-
- 21. F.J.C.M. Toolenaar, J. Mater. Sci. 23 (1988) 3144-3150.
-
- 22. T. Li, Z.N. Tang, Z.X. Huang, and J. Yu, Chem. Phys. Lett. 685 (2017) 349-353.
-
- 23. G. Utlu, Int. J. Mod. Phys. B. 25[28] (2011) 3773-3783.
-
- 24. Y.D. Li, D.C. Zhu, X. Xiang, and J.S. Wang, J. Mater. Sci.-Mater. Electron. 27[4] (2016) 3355-3360.
-
- 25. F. Luo, Z.X. Duan, Y.Y. Zhang, and Y.J. Shang, J. Mater. Sci.-Mater. Electron. 32[12] (2021) 15633-15642.
-
- 26. M. Lauda, J. Füzer, P. Kollár, M. Strečková, R. Bureš, J. Kováč, M. Baťková, and I. Baťko, J. Magn. Magn. Mater. 411 (2016) 12-17.
-
- 27. K.M. Chowdary and S.A. Majetich, J. Phys. D-Appl. Phys. 47[17] (2014) 175001.
-
- 28. D. Liu, X.P. Chen, Y. Ying, L. Zhang, W.C. Li, L.Q. Jiang, and S.L. Che, Ceram. Int. 42[7] (2016) 9152-9156.
-
- 29. Q.Y. Zhang, P. Zheng, L. Zheng, J.J. Zhou, and H.B. Qin, J. Electroceram. 32[2-3] (2014) 230-233.
-
- 30. B.G. Liu, M. Tang, X. Wei, and H.J. Li, J. Ceram. Process. Res. 23[6] (2021) 770-773.
-
 This Article
-
2023; 24(2): 342-347
Published on Apr 30, 2023
- 10.36410/jcpr.2023.24.2.342
- Received on Nov 15, 2022
- Revised on Jan 25, 2023
- Accepted on Jan 27, 2023
Services
Shared
Correspondence to
- Yujie Yang
-
Engineering Technology Research Center of Magnetic Materials, Anhui Province, School of Materials Science and Engineering, Anhui University, Hefei 230601 P. R. China
Tel : +86 63861172 Fax: +86 63861172 - E-mail: loyalty-yyj@163.com
Clean-Energy Research Institute(CRI), Hanyang University, 222, Wangsimni-ro, Seongdong-gu, Seoul, 04763, Korea
E-mail: jcpr@hanyang.ac.kr