


- Experimental fabrication and analysis of AA1050-Cu of dissimilar fsw joint
A. Mahabubadshaa and K. Anandavelub,*
aAssistant Professor, Department of Mechanical Engineering, MRK Institute of Technology, Kattumannarkoil - Tamilnadu 608301
bProfessor, Department of Mechanical Engineering, MRK Institute of Technology, Kattumannarkoil - Tamilnadu 60830This article is an open access article distributed under the terms of the Creative Commons Attribution Non-Commercial License (http://creativecommons.org/licenses/by-nc/4.0) which permits unrestricted non-commercial use, distribution, and reproduction in any medium, provided the original work is properly cited.
In the present work, dissimilar aluminum AA1050 alloy and oxygen-free copper Cu-OF were joined together by friction stir welding. The joints were prepared under varying welding speeds at a tool offset of 1 mm towards aluminum alloy to facilitate better mixing of materials and to improve tool life. The morphology of the welded specimens was evaluated using SEM, and their mechanical properties were investigated using tensile testing, fractography, a micro-hardness survey, and wear analysis. The phases of the joint morphology were evaluated by EDS and the presence of intermetallics was analyzed by XRD analysis. Among the tested specimens, the joint fabricated at 220 mm/min exhibited the highest tensile strength of 106.4 MPa under ductile fracture, and the maximum observed micro-hardness of 124 HV. The specimen welded at 220 mm/min demonstrated ductile fracture in the weld nugget zone (WNZ). The wear analysis revealed that the 220 mm/min joint specimen had a lower wear percentage (3.43%) than the other specimens (4.06% and 4.20%). The EDS morphology and XRD analysis of the 220 mm/min joint revealed the presence of intermetallic compounds composed of thin layers of aluminum-copper compounds such as Al2Cu and Al4Cu, which could improve the joint's mechanical performance
Keywords: AA1050, Cu-OF, FSW, Wear analysis, SEM
The electrical and electronics industry has seen its material requirements increase greatly over the years with increasing technological advancements in the generation of power and transmission of electric current. Copper has been a long-associated material in the electrical and electronics sectors, while other conductive elemental materials such as Aluminum, and rare materials such as Gold, Silver, and Platinum have also been used in specific applications. Gold and Platinum have excellent conductive properties but are severely limited in their usage due to their prohibitive cost and availability. Copper is a cornerstone in electrical applications but oftentimes its higher density causes components such as coil windings, bus bars, circuit contacts, electromagnets, electronic connectors, etc., to be much heavier. Aluminum is another material that has a density of just one-third of copper while retaining more than 60% of its conductivity, meaning it has similar or lesser electrical resistance at half the weight of copper, and it is also less expensive. However, aluminum is prone to higher thermal expansion than copper in heat-affected areas. A bimetallic joint between aluminum and copper could compensate for the weight issue of copper and the heat sensitivity of aluminum. A fastened joint could enter thermal deformation during service life which could result in reduced joint strength and possibly failure. Welded joints are inherently stronger than fastened joints and a weld joint of aluminum and copper could form a bimetallic joint capable of exhibiting its best performance characteristics. Welding techniques for dissimilar joints have been largely investigated in recent years and with the advent of newer techniques, this trend has only increased. Modern joining techniques such as solid-state welding involve joining the constituent material surfaces to be joined without melting by application of heat and pressure (Friction stir welding, forge welding, diffusion welding, ultrasonic welding, seam welding, etc.). In a study evaluating the mechanical performance of laser brazing joined aluminum-copper joints, it was found the that the joining process has to be controlled precisely to ensure that intermetallic compounds were not formed. They reported that regulation of process parameters can greatly enhance joint strength and morphological characteristics [1]. A review of studies exploring dissimilar friction stir welding reported that Friction stir welding (FSW) is capable of forming energy-efficient joints between dissimilar materials without greatly upending the parent material characteristics [2]. In a study that evaluated the joining of aluminum-copper-steel in sheet metal form by friction crush welding, it was reported that the axial force or the crushing force of the welding process influenced the reduction of intermetallic and enhancement of the joint strength. The resultant joint exhibited a finer grain structure and reduced distortions in the weld line [3]. Square pin profiled tools are capable of exerting effective material mixing effect in the stir zone and while the the softening of material in the stir zone can be influenced by the stirring speed [4]. During friction stir welding, the tensile strength and modulus of the weld joint can be greatly influenced by tool rotational speed and tool offset. Furthermore, a thin layer of continuous IMC layer at the weld interface can result in an effective joint [5]. Most of the conventional welding methods have been proven inadequate in providing effective dissimilar joints with convincing enhancements in morphological, mechanical, and thermal characteristics. FSW has become an established modern soled-state joining process to fabricate dissimilar joints with sufficient improvements. A study investigating the joint strength and influence of parameters on an AA2219-copper FSW joint, reported that the fatigue strength of the dissimilar joint was enhanced due to the influence of the tool offset and welding speed, as measured by micro-tensile strength tests and fatigue tests [6]. An analysis of microstructural features of a copper-aluminum FSW joint reported the observation of copper-rich particles in the weld interface twinned in the aluminum matrix; the presence of several IMCs of varying aluminum-copper combinations caused by the aging process was also observed [7]. An analysis of an AA2060-copper-lithium FSW joint by mechanical and microstructural characterization revealed contrasting coarse grains at the parent metals and finer grains in the nugget zone; it was also observed that the strengthening precipitates dispersed within the nugget zone [8]. An experimental analysis of the AA5086-copper FSW joint reported the use of varying tool rotational speeds and tool offsets to determine their respective influence on the weld joint. It was found that the tool offset and rotational speed caused the inclusion of copper particles in the nugget zone and a higher aluminum diffusion rate toward the weld interface [9]. The evaluation of microstructural characteristics of an AA2198-copper-lithium FSW joint and found a kissing bond defect in the joint. This defect was found to be the starting point of fracture during tensile fracture. It was reported that the thickness of the weld interface and tool offset could be varied to effectively mitigate this issue [10]. An analysis of the influence of FSW parameters on a copper-aluminum butt joint reported that the maximum improvement of tensile properties of the joint was for a tool offset of 1 mm and travel speed of 20 mm/min, which caused strengthening of the dispersion of copper particles in aluminum [11]. Tool offset, tool rotational speed, and welding speed are some of the significant parameters that influence the weld joint of dissimilar FSW joints. Tool offset is an FSW parameter that can greatly influence the joint characteristics when one of the materials is harder than the other. Tool offset typically means moving the tool near the softer parent material on the retreating side during the welding process [12]. This is due to the consideration that if the contact area of the tool is higher on the harder metal, the tool wear is higher [13, 14]. An investigation on the mechanical and microstructural properties of an AA1060-annealed pure copper FSW joint found intercalation of copper particles within the weld nugget zone. It was reported that the superficial bonding and interfacial diffusion had increased due to this effect, but the corrosion resistance was drastically reduced to weak internal bonding. The joint was observed to exhibit a mixed brittle-ductile failure mode during tensile testing [15].
Optimization techniques have also been explored to various extents in establishing better combinations of process parameters to obtain enhanced performance metrics for FSW joints involving similar and dissimilar materials. Friction stir welding of aluminium is highly susceptible to process parameters such as tool rotation speed and welding speed. By optimizing these parameters, it is possible to aluminium FSW joint with finer grains in the microstructure of the stir zone. Precise control of tool speed could allow for better excess frictional heat mitigation, thus enhancing the weldability of the material [16-18]. A study investigating the friction stir welding of aluminium metal matrix composites noted that process parameters are influential in affecting the grain growth, phase transition, and variation of microstructure arrangement in the various zones of the weldment. A lower tool rotation speed (800 rpm) with a 5 kN axial load yielded enhanced joint strength and ductility of the joint [19]. A study analyzing the dissimilar aluminium-magnesium FSW joint analyzed the effects of axial force, tool tilt angle, tool rotational speed and welding speed on the weld joint. It reported that an optimized combination of welding process parameters is capable of yielding a high-quality weld joint with enhanced mechanical properties [20]. A study reported that the joining of aluminium-copper is more experimental and FSW has made such experiments approachable. It reported that tool-related parameters are especially influential in producing good aluminium-copper joints. Tool design, wear, and microstructural stability are also vital due to their ability to affect the frictional heat and rotational torque [21]. It was reported that specialized fixtures could offer better material support and aid in effective friction stir welding of dissimilar aluminium-copper joints. It was described that the tool design and tool tilt angle as significant parameters that determine the intermetallic compounds and microstructure of the joints [22].
As inferred from the literature survey, the studies regarding dissimilar FSW joints are highly imperative related to their high industrial usage and increasing application potential. Furthermore, studies dealing with dissimilar metal joints capable of being employed in key applications such as electrical and electronic conductors, thermal couplings, mechanical joints, etc., are imperative and existing studies are limited in this regard. In the present novel study, aluminum alloy 1050 and oxygen-free-high conductivity copper (Cu-OF) plates, both with dissimilar thicknesses were butt-joined by FSW. For the present study, the experimental welding methodology was adapted an existing study [23]; however, the values of the parameters were varied. By the findings of the existing study [23], which stated that a 1 mm tool offset yielded better mechanical performance than zero tool offset, the present work had undertaken to fabricate the dissimilar FSW joint under the same tool offset parameter with varying welding travel speeds. The obtained joints were evaluated for their tensile, micro-hardness properties, and fractography to ascertain their performance [23]. The present work, however, has expanded upon the results and has evaluated the wear performance of the dissimilar FSW specimens by subjecting them to high-temperature wear analysis.
Materials
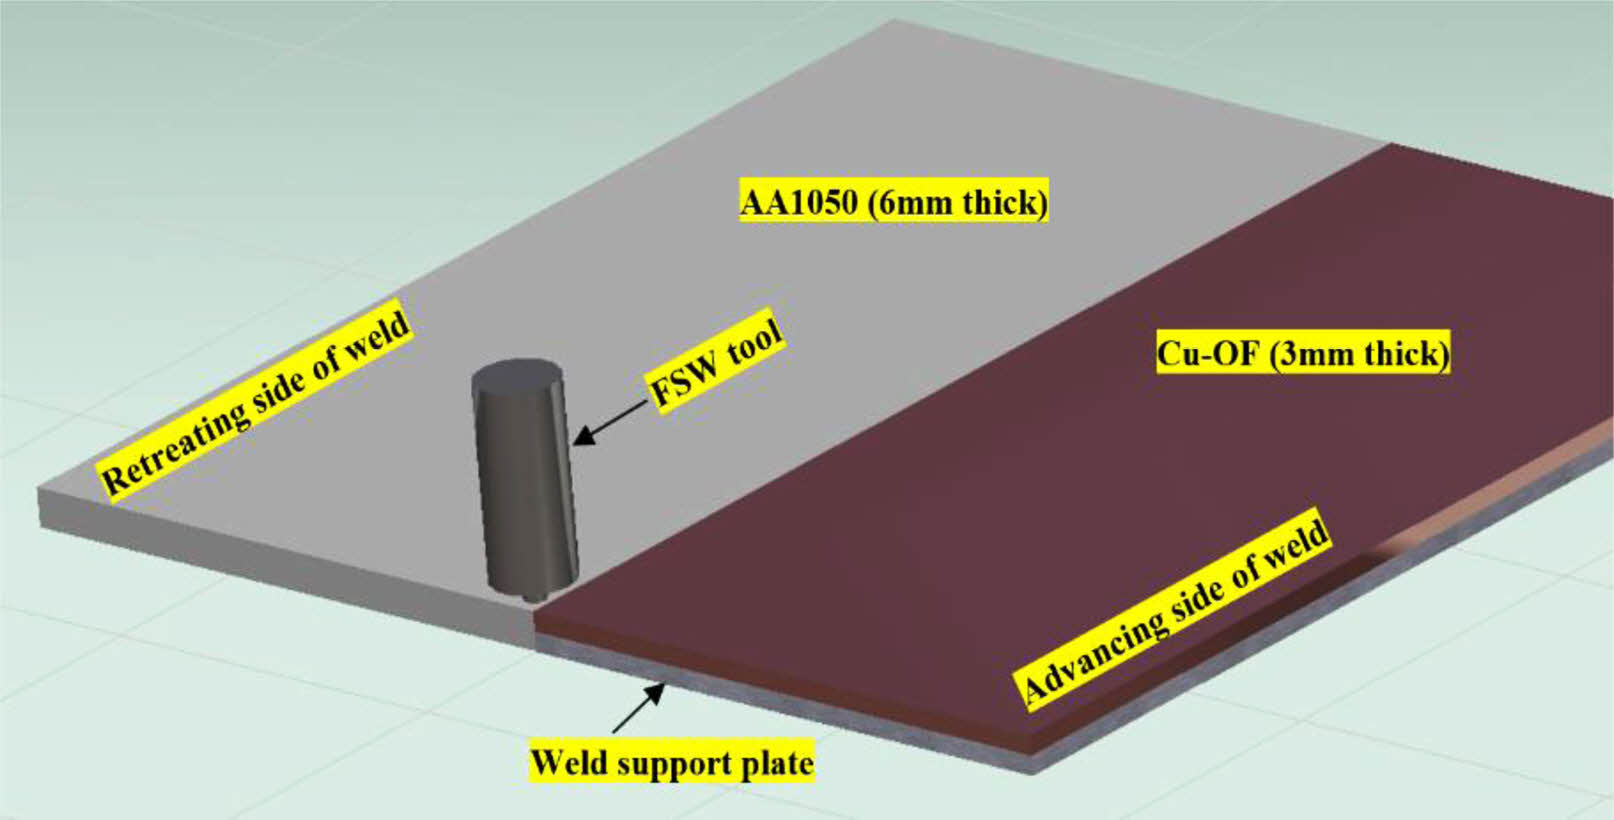
In the present work, aluminum AA1050 and oxygen-free copper Cu-OF (Table 1) were used in the fabrication of a dissimilar FSW joint. Their dimensions were 200 × 100 mm in length and width, but the AA1050 plate was 6 mm thick while the Cu-OF plate was 3 mm in thickness. A metal sheet of similar dimensions was used underneath to support the thinner copper plate and to reduce distortions during welding, as illustrated in Fig. 1. The aluminum was on the retreating side and copper was on the advancing side during the experimental FSW butt joint welding process. The FSW process was performed by using an FSW machine (make: Bond Technologies; model: RM10, 100 kN forging capacity) with an FSW tool made of AISI H13 tempered tool steel. The tool was a threaded tapered profile tool with a 24 mm tool shoulder and the diameter at the tip was 4.2 mm, with a pin length of 2.9 mm which was lesser than the copper plate to ensure a smooth weld surface.
Methods
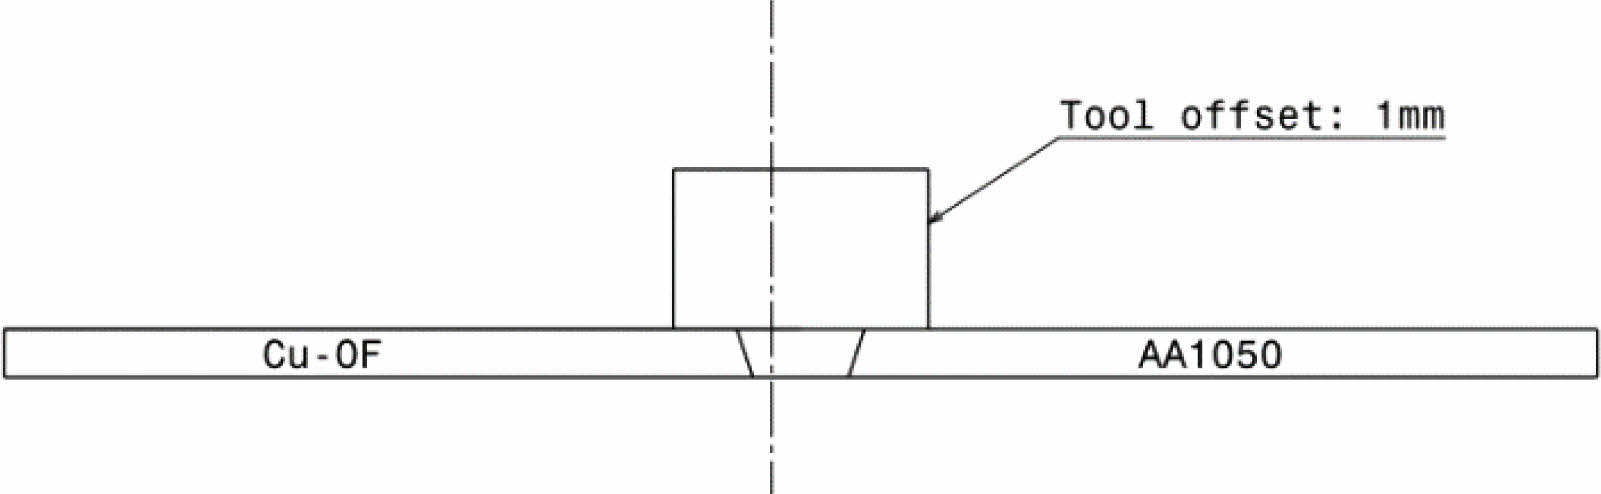
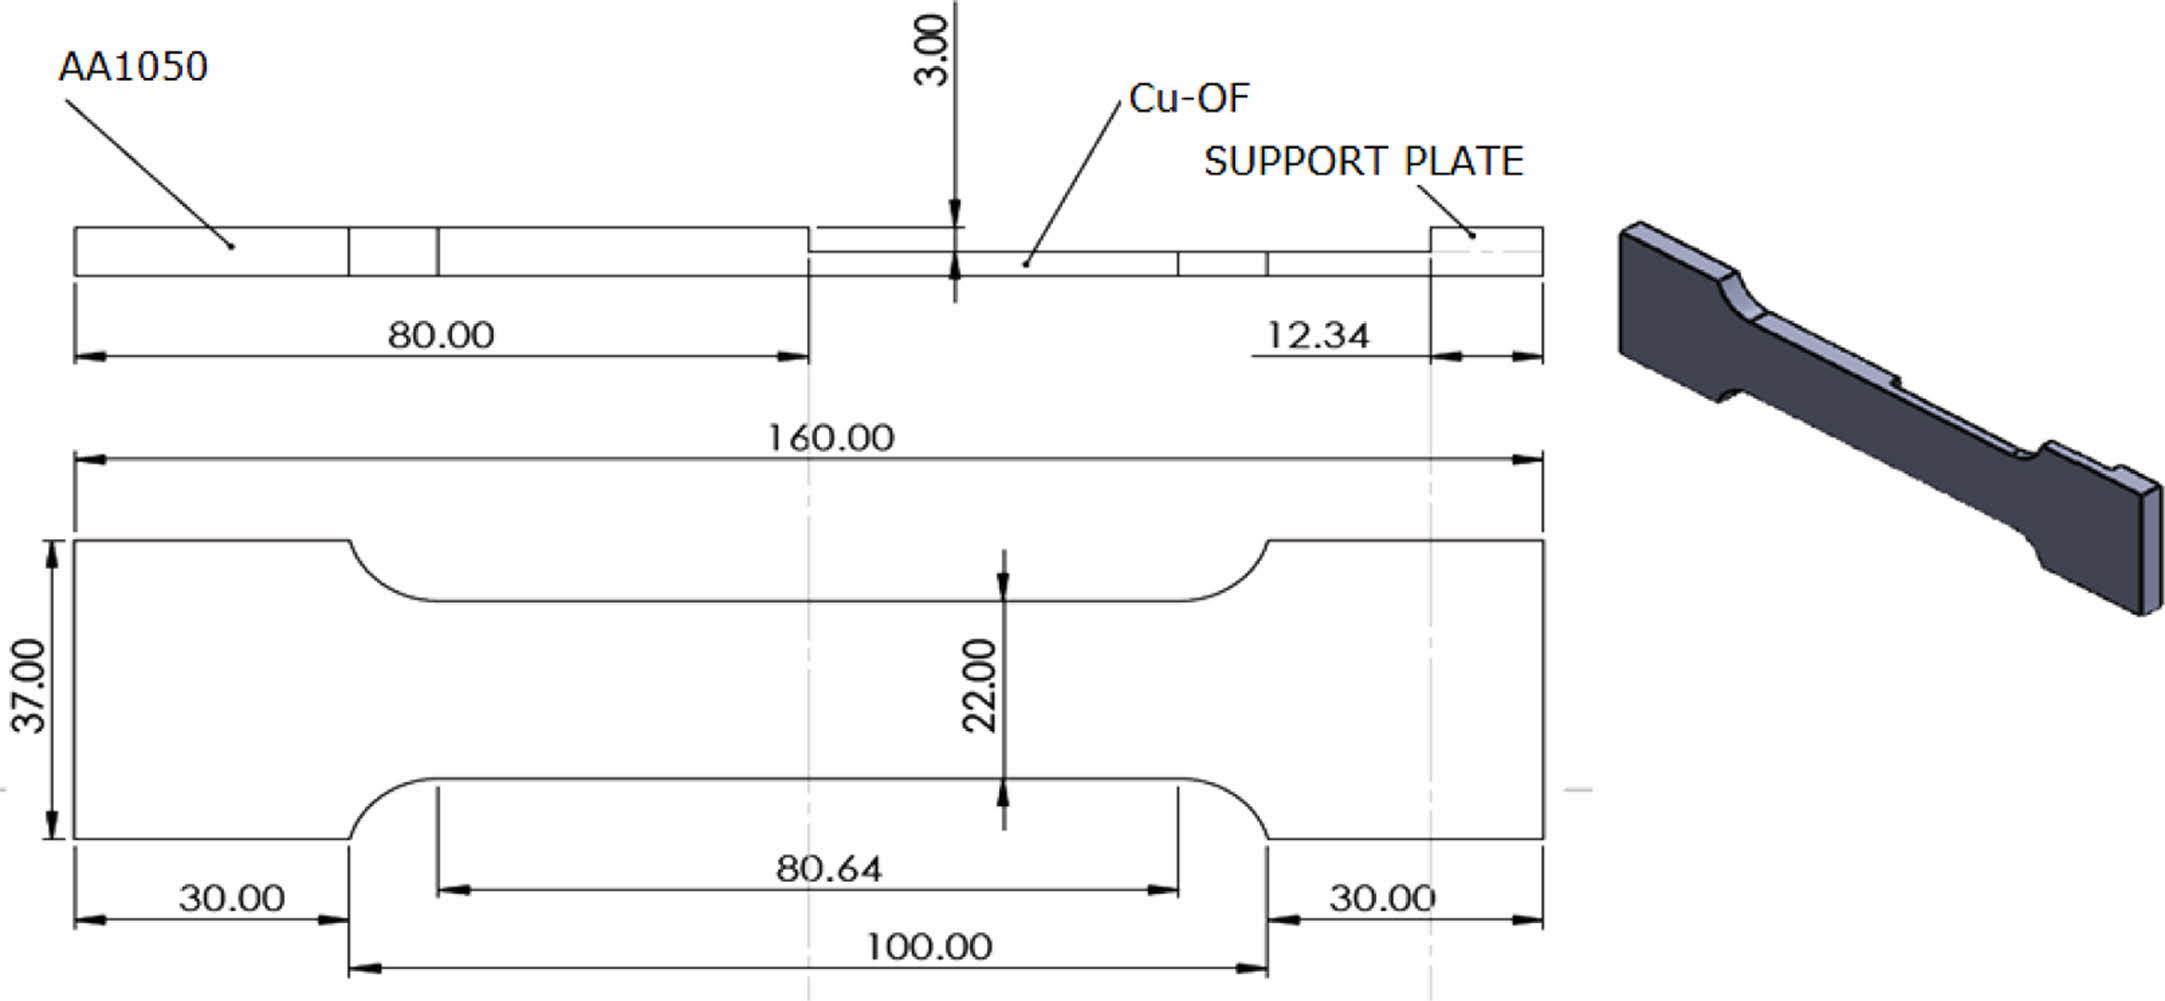
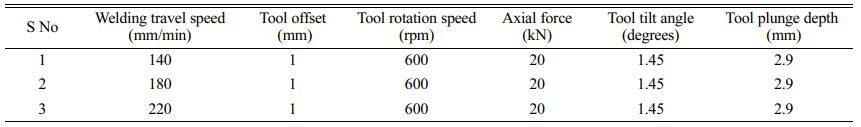
The FSW parameters considered in the analysis were the tool rotation speed (rpm), welding travel speed (mm/min), and tool offset; to determine the weld joint performance under varying parametric conditions, the tool offset was set at a constant 1 mm, while the welding travel speed was varied (Fig. 2) for each experimental trial. During the experimental trials, the tool rotation speed, axial force, and tool tilt angle were kept at a constant 600 rpm, 20 kN, and 1.45o, respectively. Excessive heat generated by the FSW tool shoulder during the welding process was cooled by a constant water supply during welding. The welded specimens were fabricated into samples for micro- structural evaluation as per ASTM E3 standards. The samples were surface polished by separate surface etchants to offer better interfacial structure revelation during illumination in microscopy. For AA1050, Keller’s reagent (95 volume percentage of distilled water, remaining 1% hydrofluoric acid, 1.5% hydro- chloric acid, and 2.5% nitric acid) was used and for Cu-OF, a mixture of 10 g Ferric Chloride, 30 ml Hydrochloric acid in 120 ml distilled water was used. The microstructural characteristic and fractography were investigated by using a scanning electron micro- scopy instrument (Make: ThermoFisher Scientific Inc, model: Thermoscientific APREO S, resolution: 0.9 nm at 1 kV). Energy-dispersive X-ray spectroscopy (EDS) was used in evaluating the chemical composition of the interfacial regions of the FSW specimens. X-ray diffraction analysis was performed to evaluate the phases in the weld joint interface. The welded specimens were cut into standard tensile test specimens as per ASTM E8M standard (Fig. 3) for testing in a universal testing machine (UTM) (make: Instron, model: 3382, maximum load: 100 kN). The micro-hardness levels of the specimens were evaluated by a Vickers micro-hardness testing machine (make: Mitutoyo, model: HV-110, maximum load: 20 kg) performed as per ASTM E384 standard. The specimens were tested for wear by dry sliding wear testing method using a high-temperature tribometer (Make: CSM Instruments, model: CSM Nano-tribometer, depth range: 20 nm-100 µm). The testing method used a ball-on-disc configuration, having a ball made of alumina with a sliding speed of 5 mm/s for a total sliding distance of 600 m on the specimen surfaces. The testing loads were varied under a contact pressure of 1 GPa, while the wear testing temperature was set at a constant 150 oC. The initial and the final weights of the tested specimens were recorded and the worn surfaces were analyzed by SEM analysis.
Establishing the Joint Arrangement
The experimental weld joint specimens were fabricated by butt joint configuration to achieve good formability and weld quality. The tool offset was configured as per existing literature and the tool offset was set towards the softer parent metal. The potential application of the dissimilar joint investigated in the present work is electrical conduction and thus the joint was to be designed as a demonstrator for a bimetallic electrical conducting bar.
A governing equation was formed to determine the thickness of the dissimilar parent materials from Joule’s law of electrical heating [23]. By the same electrical current to be conducted by the joint, the parent metal plates and the heat generated in the plates were determined by Equation (1)

Now Equation (1) can be expressed as Equation (2)
Since the length of the parent materials are similar, Equation (3) can be expressed as,
Cross-section area ‘A’ of the parent materials is the product of their thickness ‘t’ and width ‘w’; since the width of the parent materials are similar, Equation (4) can be written as,

where, I = constant current flow; RCu, RAl = Electrical resistances of copper and aluminum; ρ = Electrical resistivity of the parent materials; L = Length of the parent materials; A = Cross section area of parent materials; t = thickness of parent materials; s = Material conductivity; ρCu = 100% IACS conductivity; ρAl = 61% IACS conductivity. Equation (6) was used to determine the thickness of the copper plate compared to the 6mm thick aluminum AA1050 plate.
|
Fig. 1 FSW process schematic. |
|
Fig. 2 FSW tool offset position. |
|
Fig. 3 Tensile test specimen. |

Macrostructural Characterization
The dissimilar FSW joints were fabricated at 140, 180, and 220 rpm of welding travel speeds (WTS), constant tool offset (TO), tool rotation speed (TRS), axial force (AF), and tool plunge depth (TPD) as listed in Table 2.
The macrographs showing the weld bead appearances of the welded specimens are shown in Fig. 4. It can be observed that the weld nugget zone (WNZ) between the copper and aluminum metals differ much in comparison with each other. The strength and quality of the weld joint are signified by its appearance and the presence of defects [24]. From Fig. 4, the interaction of aluminum with copper can be observed within the weld zone. In Fig. 4(a), the weld nugget zone indicates the agglomeration of copper and the presence of a noticeable void defect. Furthermore, the top surface of the welded joint is characterized by an unbonded copper and aluminum layer. The heat-affected zone of the aluminum side indicates the presence of numerous micro-void defects. The weld joint in Fig. 4(b) indicates the weld joint fabricated at 180 mm/min WTS, and it shows a relatively smoother top surface in comparison to the former. The weld zone (WZ) also indicates a better particle mixing between the copper and aluminum, however, the joint also includes a noticeable tunnel defect. On the bottom side of the weld zone, the joint also has kissing bond defects. Nonetheless, the weld joint demonstrated improved particle mixing within the weld zone. From Fig. 4(c), the weld joint can be seen to have a significantly better material interaction in the weld zone. Furthermore, the copper and aluminium mixture is denser and more uniform, with no major flaws. From the figure, it was observed that the aluminum was transported to the copper side and vice-versa during all the welding travel speeds. The lack of sufficient heat might have resulted in the inadequate interaction between the dissimilar materials and voids and tunnel defects are characteristics of higher frictional heat [25].
Microstructural Characterization
Influence of Welding travel speed and Tool Offset
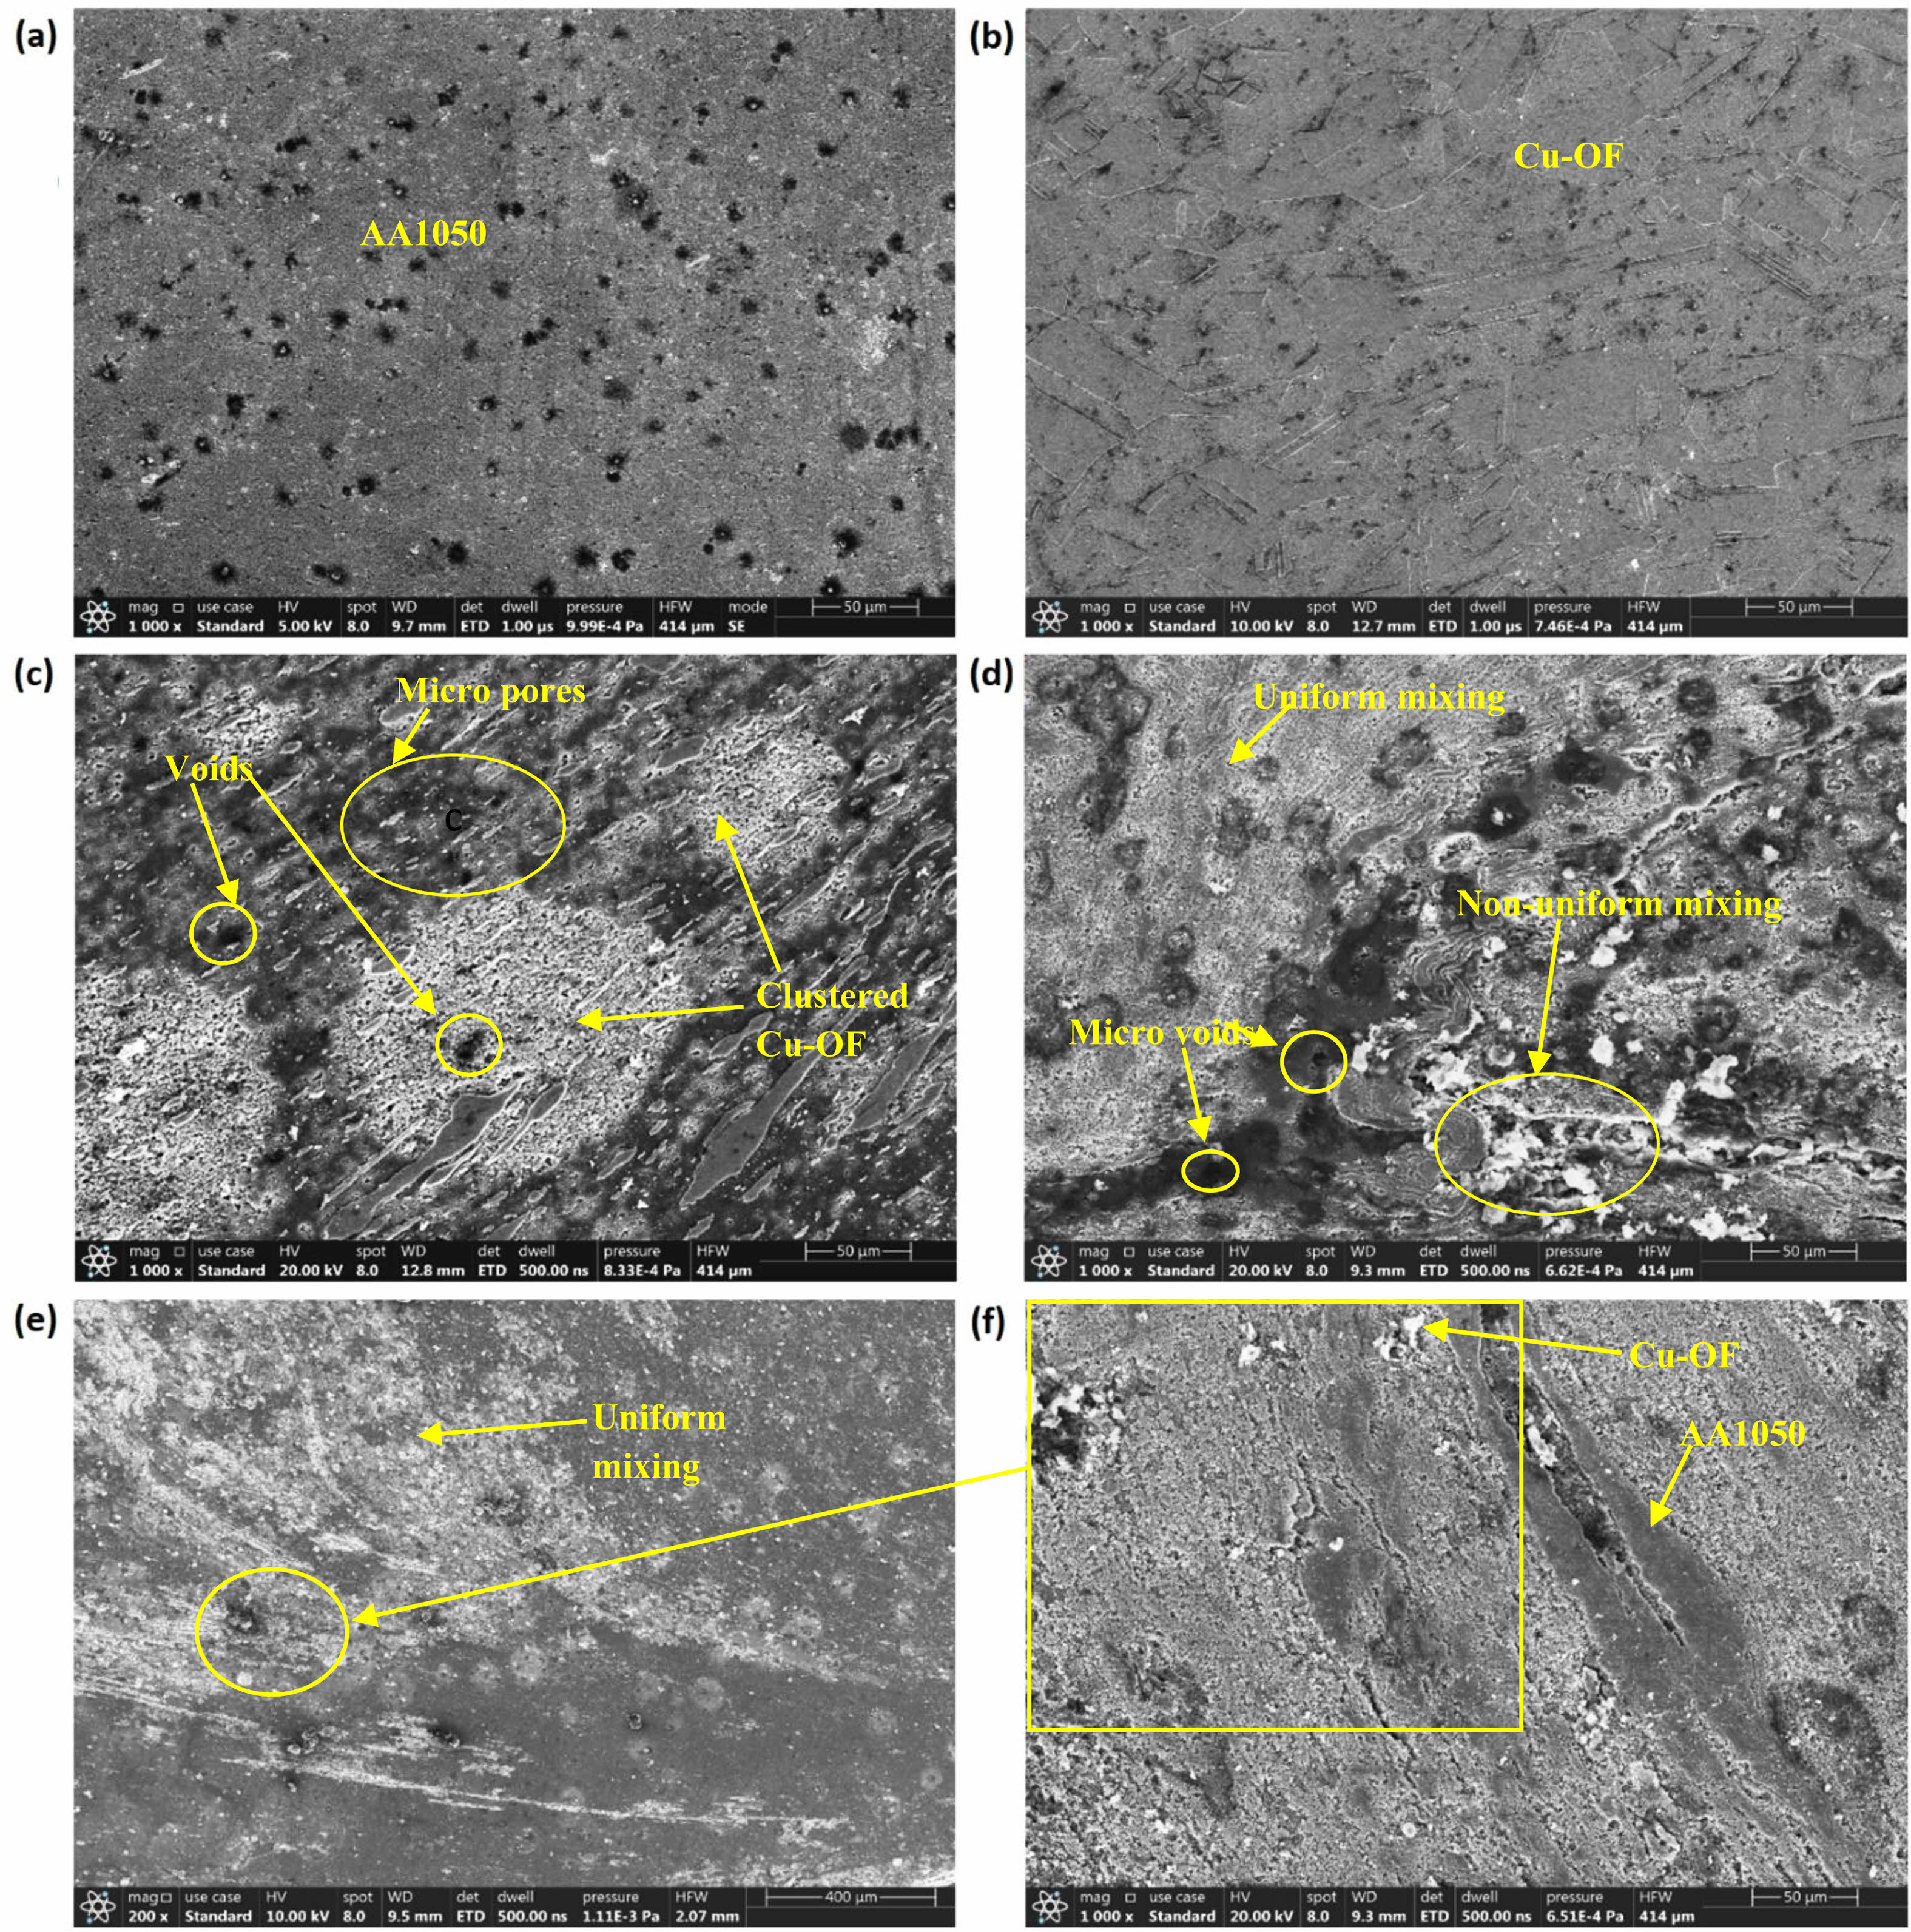
The microstructures of the parent materials and the friction stir welded specimens at varying WTS were observed by scanning electron microscopy (SEM). The microstructures of the parent materials AA1050 and Cu-OF can be observed in Figs. 5(a) and 5(b), respectively. As indicated by the literature, the stir zone of the weld joint was primarily in the aluminum part of the joint [26], and it is a combination of copper and aluminum particles. The 1 mm tool offset towards the copper had caused the breakdown of copper particles and mixing with an aluminum particle in the WZ. The size of the constituent particles in the WZ is influenced by the tool offset and as indicated by the findings from the existing work [23], the tool offset of 1 mm towards copper caused a reduction in particle cluster size. This, in effect, could theoretically aid better metallurgical bonding between dissimilar copper-aluminum materials [12]. Fig. 5(c) shows that the WNZ is composed of agglomerated copper amid an aluminium matrix and non-uniform particle dispersion during WTS of 140 mm/min. This is consistent with the observation from the corresponding macrograph, which showed a partial distribution of copper particles in the WZ, resulting in a composite microstructure with visible void defects. From Fig. 5(d), it can be observed that the WNZ of the FSW specimen welded at 180 mm/min, shows a comparatively improved copper dispersion with clusters of copper particles scattered among the aluminum matrix. The copper dispersion is non-uniform, and the micrograph shows signs of micro defects such as voids and porosities. The comparative improvement in dispersion indicates a potential increase in weld joint tensile properties, which are typically influenced by stirring action and particle distribution [25]. At an even higher WTS of 220 mm/min, as seen in Figs. 5(e) and 5(f), the microstructure indicates a more uniform mixture between copper and aluminum with the formation of comparatively smaller grains due to more controlled heat generated by a faster WTS than the former specimens. The weld joint was devoid of major defects and with a potential increase in tensile strength.
Tensile Strength
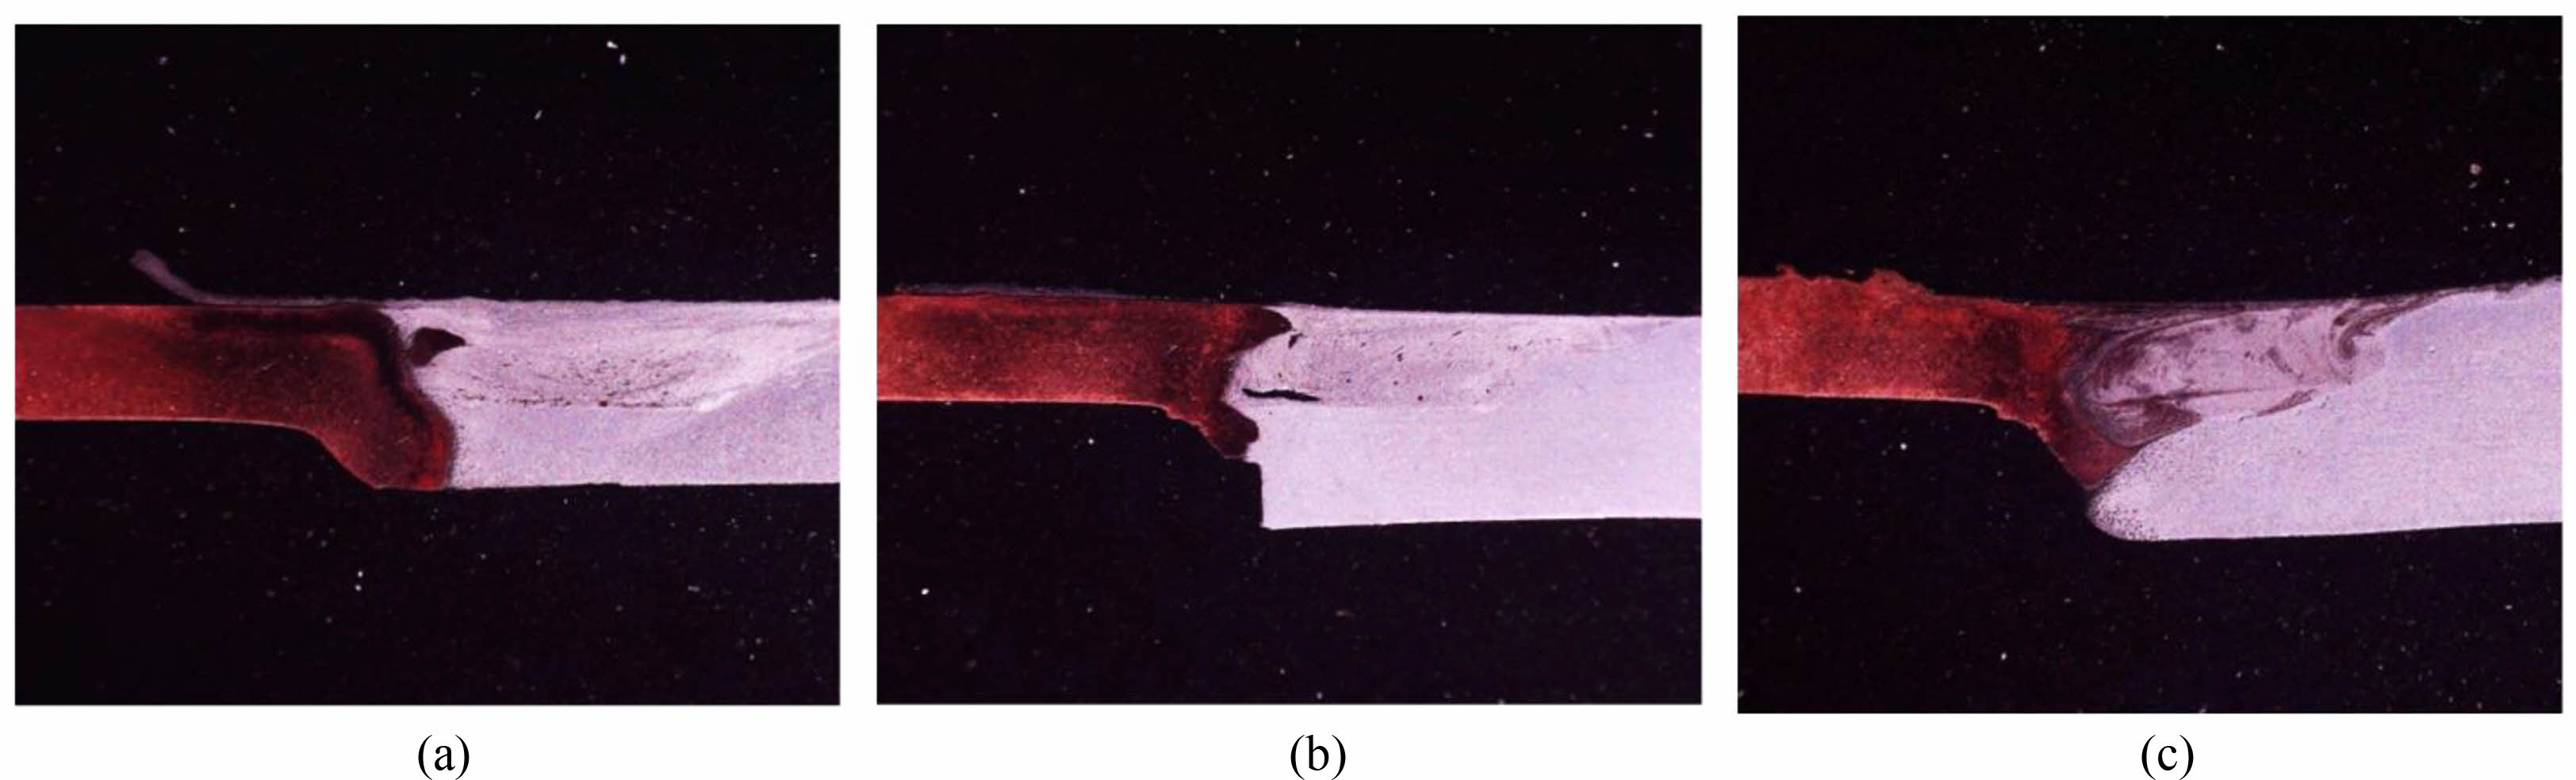
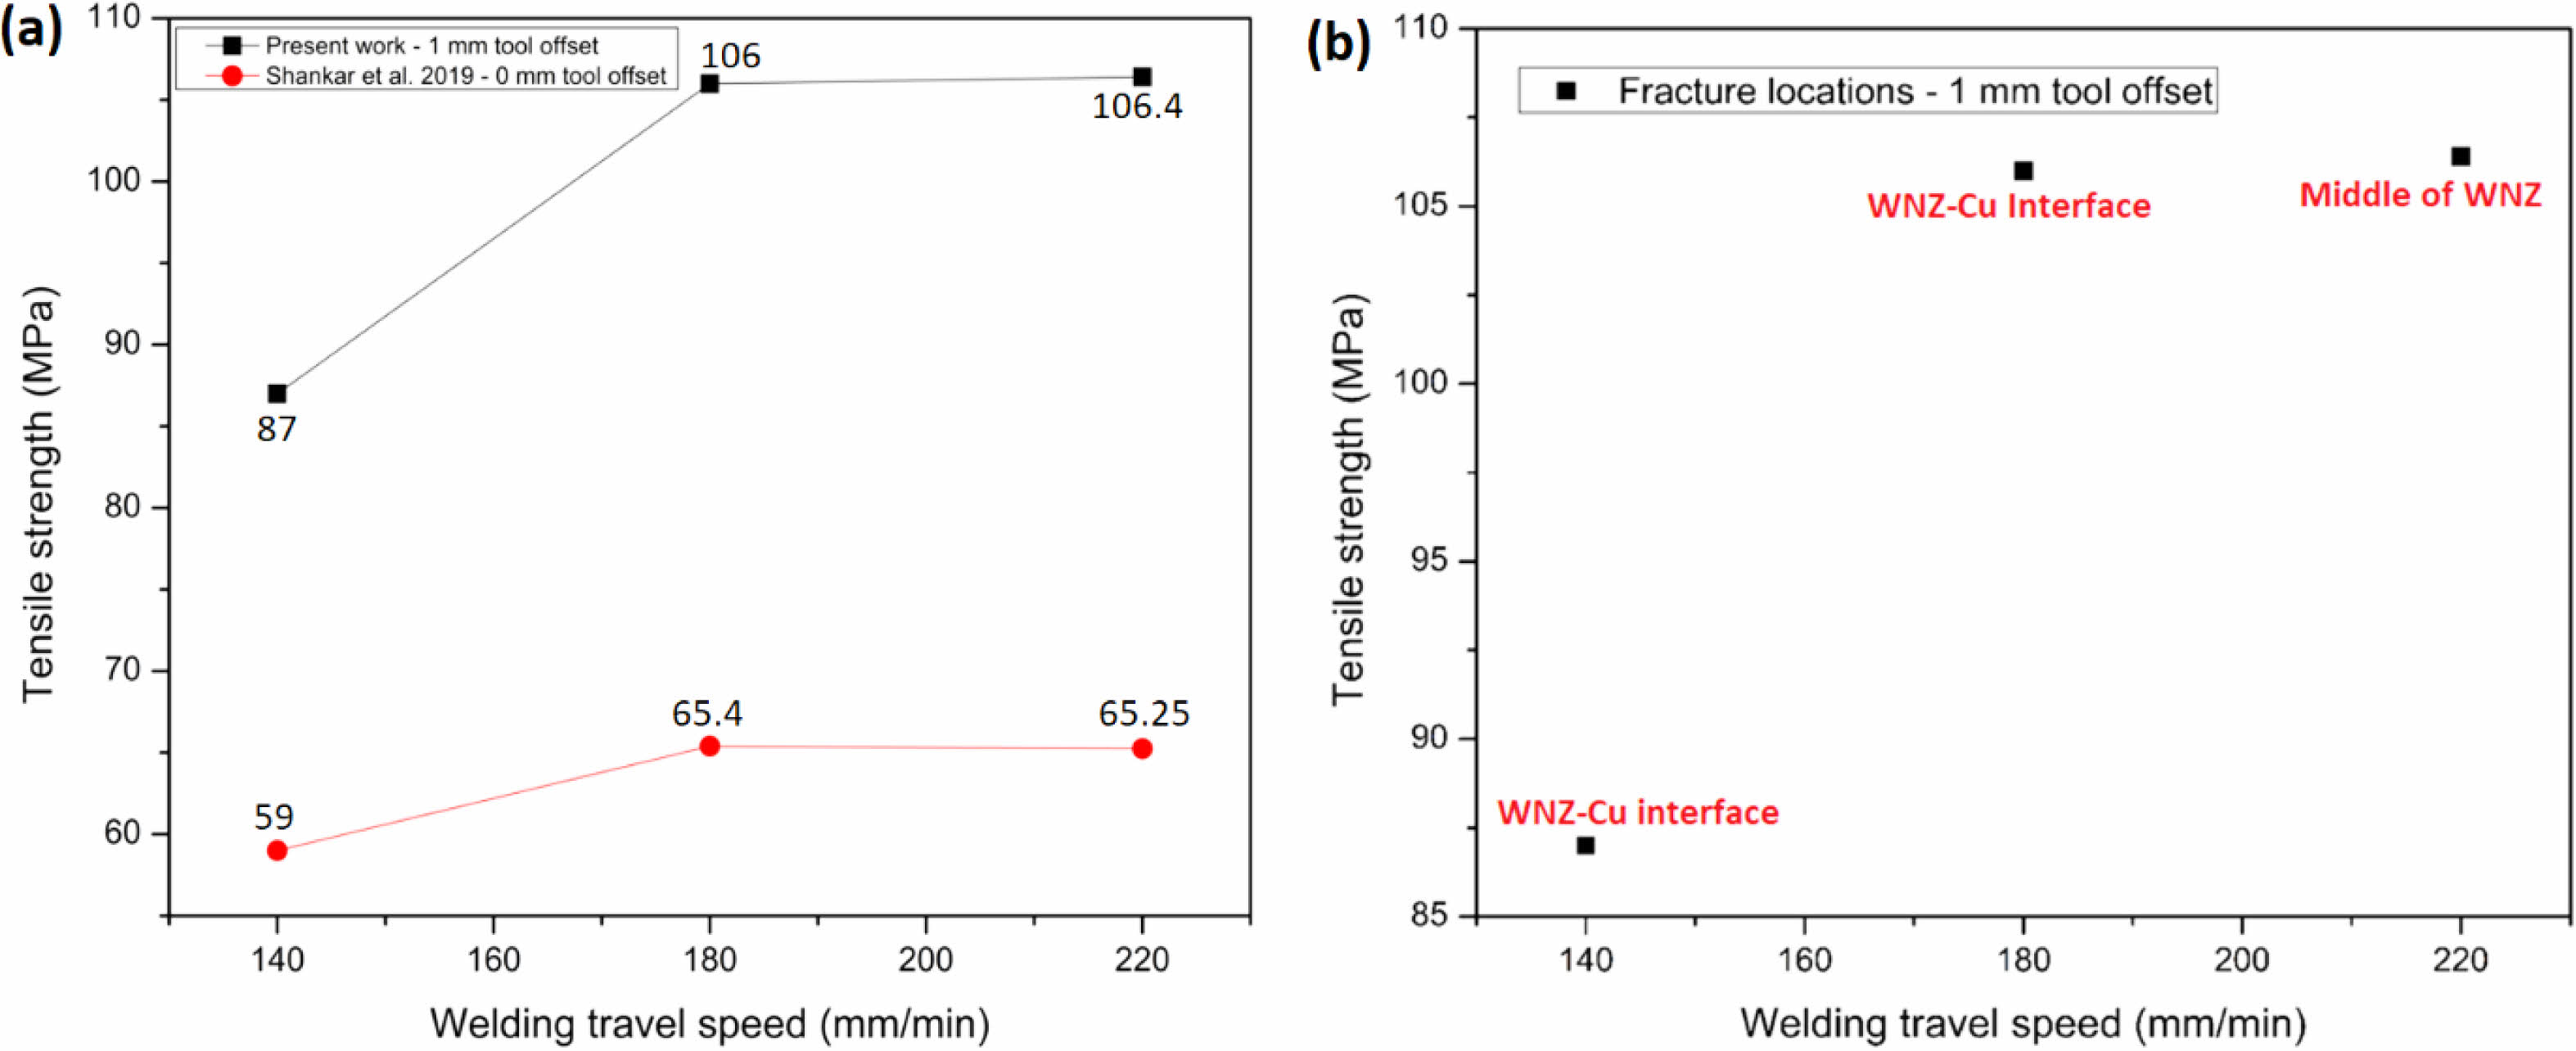
The different FSW specimens were subjected to standard tensile testing until fracture and their tensile strengths were observed. The observed tensile strengths of the tested specimens are shown in Fig. 6(a). The specimens prepared under constant TO (1 mm), TRS (600 rpm), and varying WTS (140, 180, and 220 mm/min), the FSW specimens indicated increases of 47.4%, 38.3%, and 38.7% than the respective tensile strengths observed previously in the existing study [23] during their tests with 0 mm TO, 640 rpm TRS and varying WTS of 128, 160 and 213 mm/min. As observed from the tensile tests, the tensile strengths of the FSW specimens gradually increased from the 140 mm/min specimen to the 180 mm/min specimen, from where it exhibited a marginal increase to the 220 mm/min specimen. This trend indicates that the tensile strength was highly influenced by the welding travel speed during the FSW process. The joint efficiency of an FSW joint is, at all times, lesser than the base metal [14], in this case, the aluminum AA1050 has a tensile strength of 113 MPa. However, the increased weld joint efficiency is capable of enabling the weld joint to exhibit tensile properties almost similar to the base metals [6]. Studies have indicated that the presence of intermetallic compounds (IMCs), material flow in the stir zone, and mixing of base materials are some of the factors that might affect the performance of a dissimilar weld joint. The FSW dissimilar joints were prepared at WTS of 140, 180 and 220 mm/min and exhibited tensile strengths of 87, 106, and 106.4 MPa, respectively. During the tensile tests, the specimens welded at 140 and 180 mm/min WTS exhibited fracture initiating at the weld interface between the copper and weld nugget zone (WNZ), indicating that area within this zone is a weak area prone to fracture (Fig. 6(b)). The specimen welded at a higher WTS of 220 mm/min, exhibited fracture amid WNZ. It is estimated that the joint fractured on the WNZ exhibited ductile fracture while the joints fractured in the WNZ-Cu interface was a brittle fracture.
Fractography
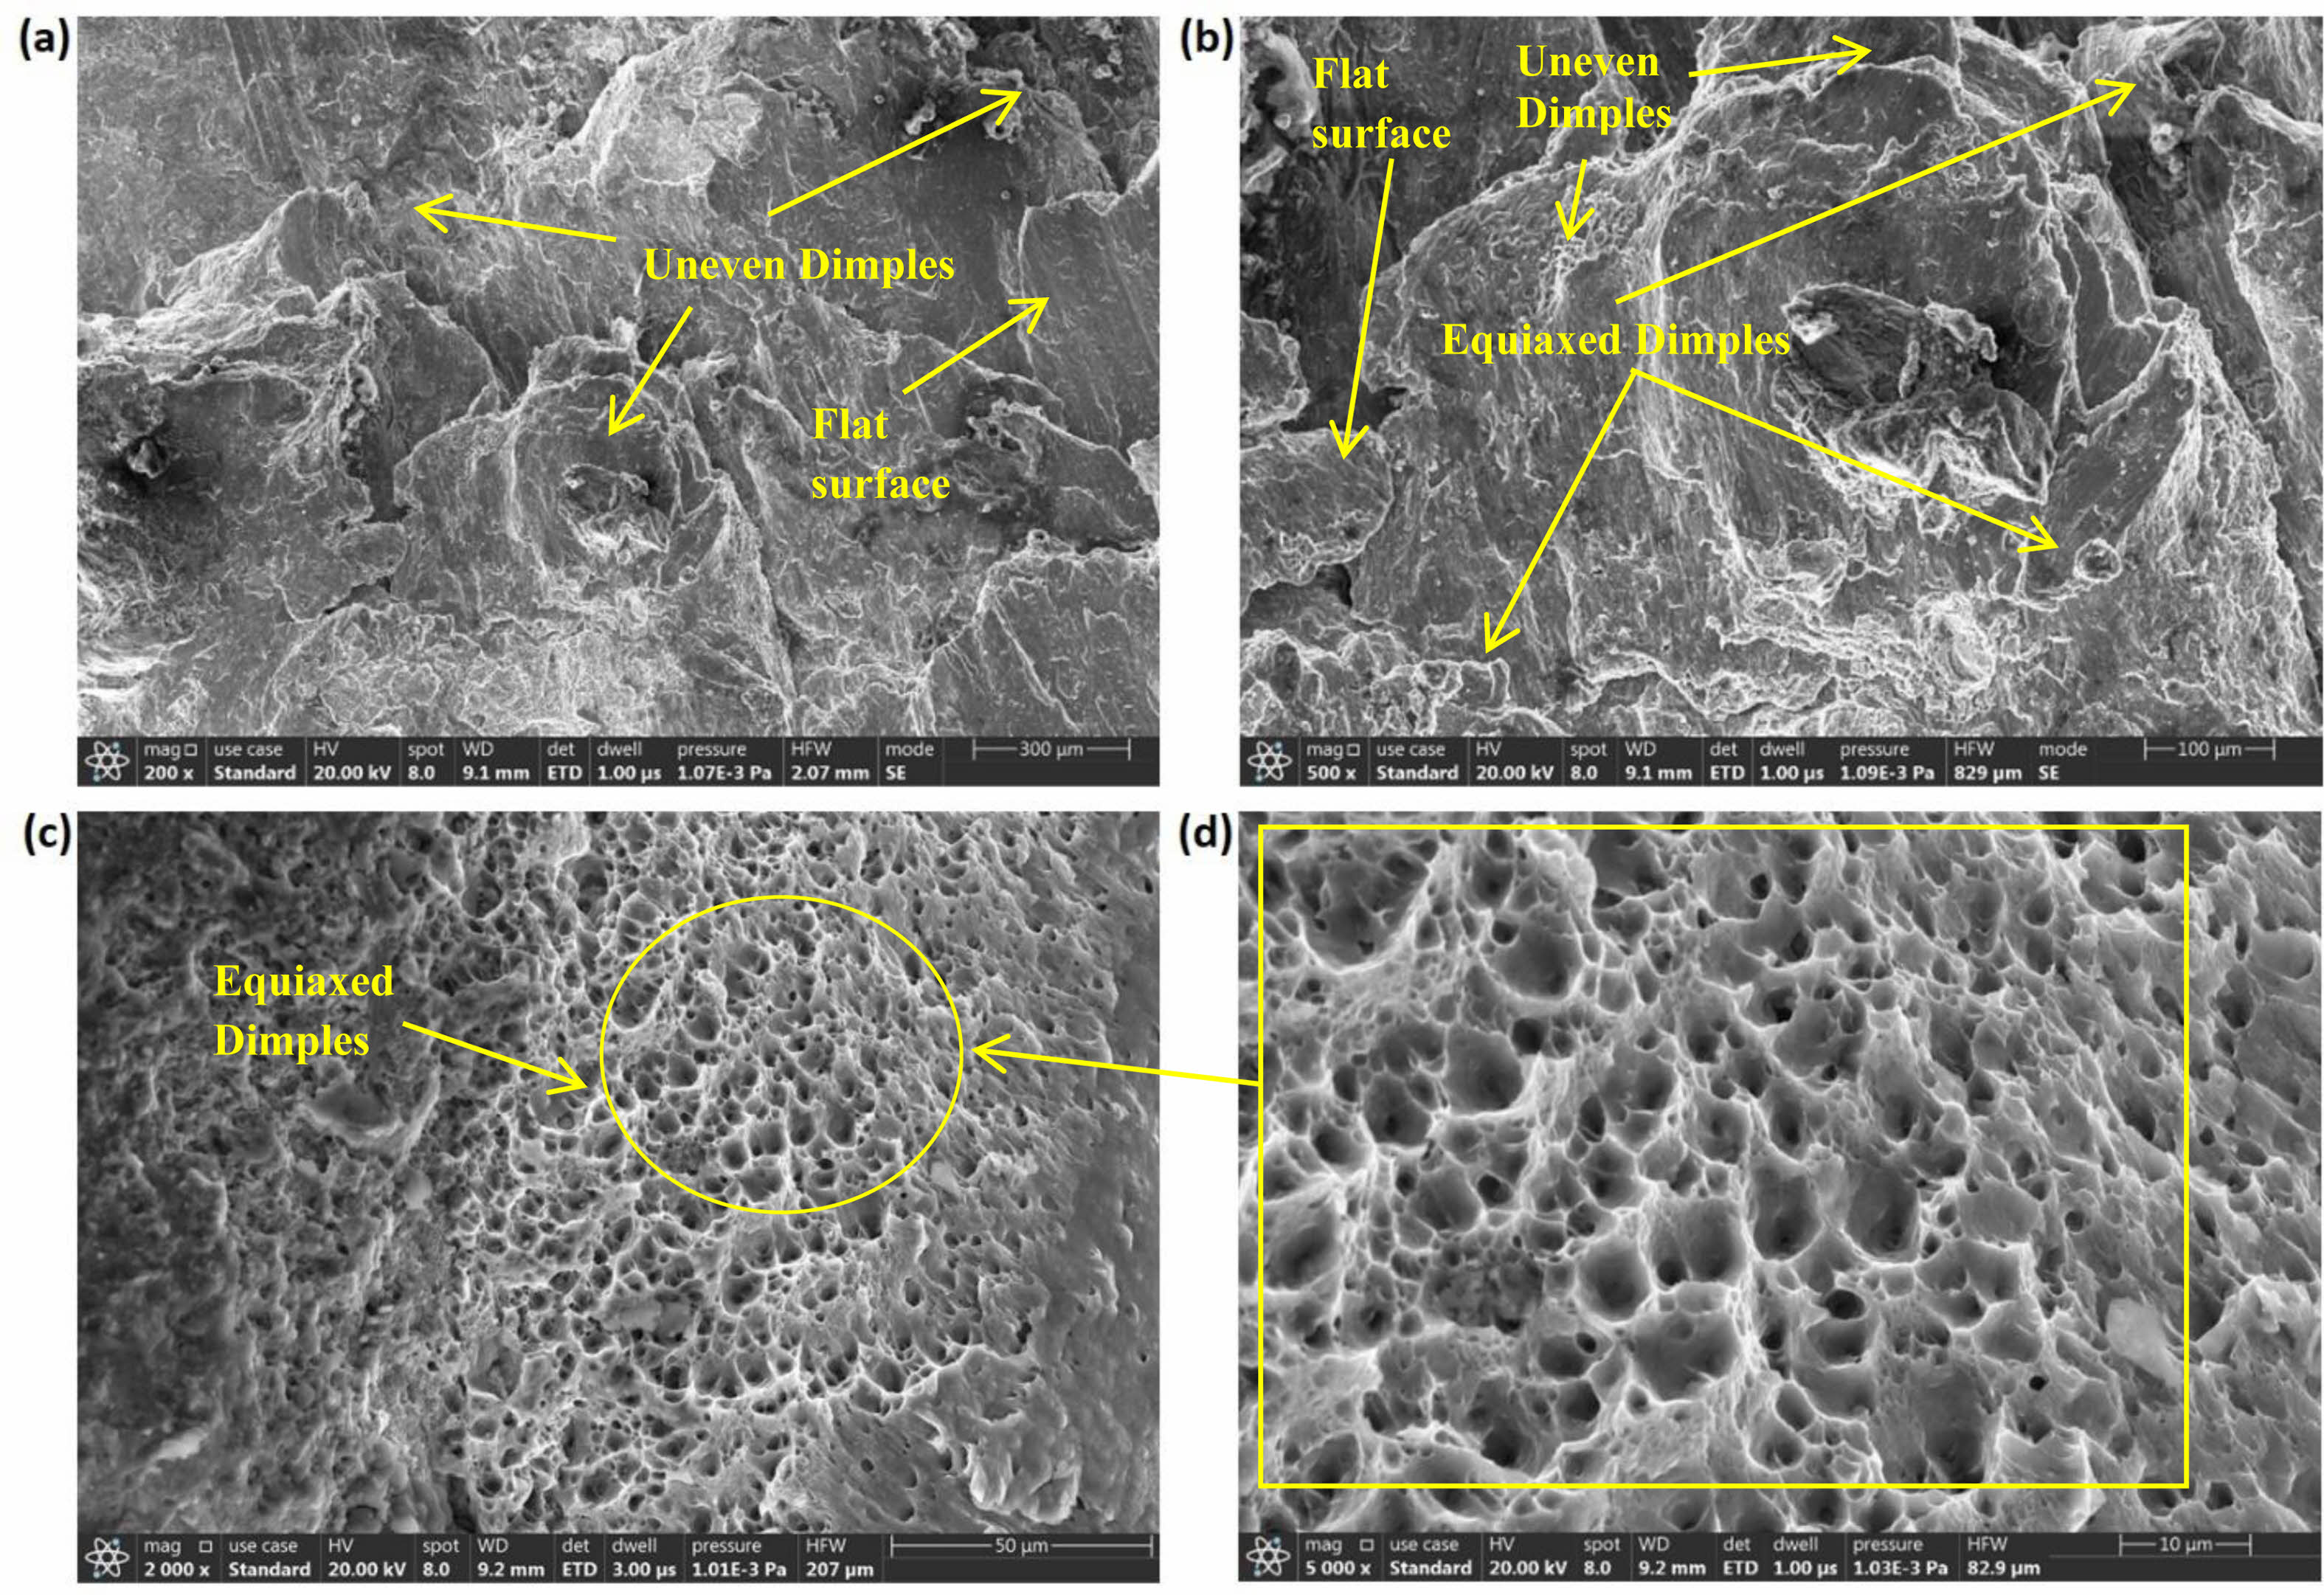
The fractured surfaces were evaluated for their morphologies by FESEM analysis to determine the failure modes. Figure 7 shows the fracture morphologies of the tensile-tested specimens. Figure 7(a) depicts a specimen welded at 140 mm/min WTS that fractured at the WNZ-Cu area. The fractured surface indicates the presence of uneven-sized dimples and a few flat surfaces in the microstructure. Brittle fracture is indicated by the presence of flat surfaces with uneven dimples. Figure 7(b) shows a shear fracture during testing due to the presence of equiaxed dimples alongside uneven dimples. Furthermore, the morphology indicates the presence of flat surfaces as opposed to uneven dimples, indicating a brittle fracture. The fracture morphology of the specimen welded at 220 mm/min WTS is shown in Fig. 7(c) which shows the presence of equiaxed dimples. The number of equiaxed dimples in the morphology indicates stronger interaction between copper and aluminum. These dimples are observed to be elongated towards the tensile loading direction (Fig. 7(d)) and there are signs of voids near the dimples. The elongated dimples are indicative of plastic deformation and hence ductile fracture.
Microhardness Analysis
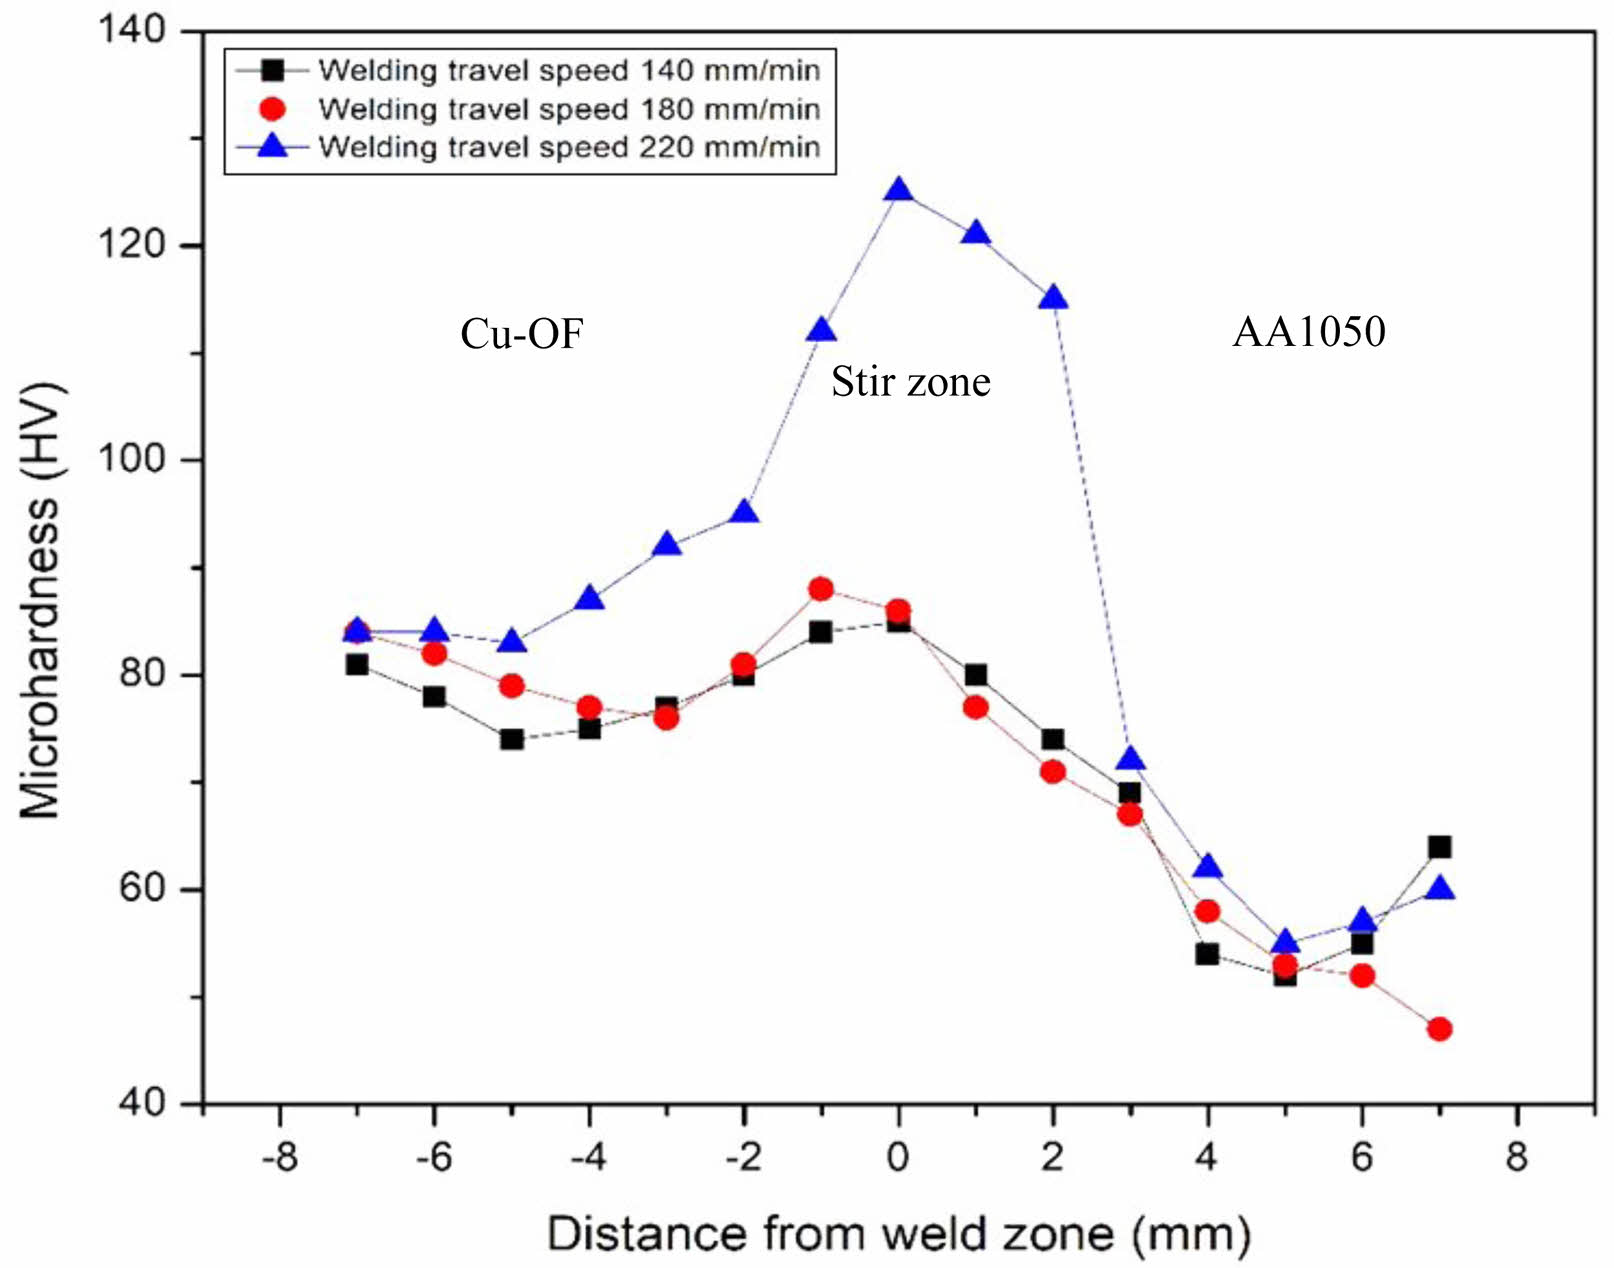
The different welded specimens were subjected to a Vickers microhardness survey to evaluate their surface hardness levels in the various areas near the weld joints. The survey was performed as per the ASTM E384 standard on the different zones of the welded specimen surfaces (Fig. 8). The surface microhardness levels were measured by using a pyramidal-based diamond indentor on the weld nugget zone, thermomechanically affected zone, heat affected zone, and base metal. The microhardness of the base metals, Cu-OF and AA1050 were 100 HV and 45 HV, respectively. As can be observed from the figure, the specimens welded at WTS of 140 mm/min and 180 mm/min exhibited a gradual decline in microhardness level from their respective heat-affected zones from the copper side. However, they showed a gradual increase near the stir zone, reaching their peak values between the WNZ-Cu interface, where the fracture occurred when they were tensile tested. Furthermore, the specimen welded at 220 mm/min of WTS showed similar increasing trends in microhardness levels as seen in the figure. The specimen exhibited the highest microhardness level within the weld nugget zone, reaching 124 HV, which can be observed to decline towards the aluminum side of the joint.
Wear Analysis
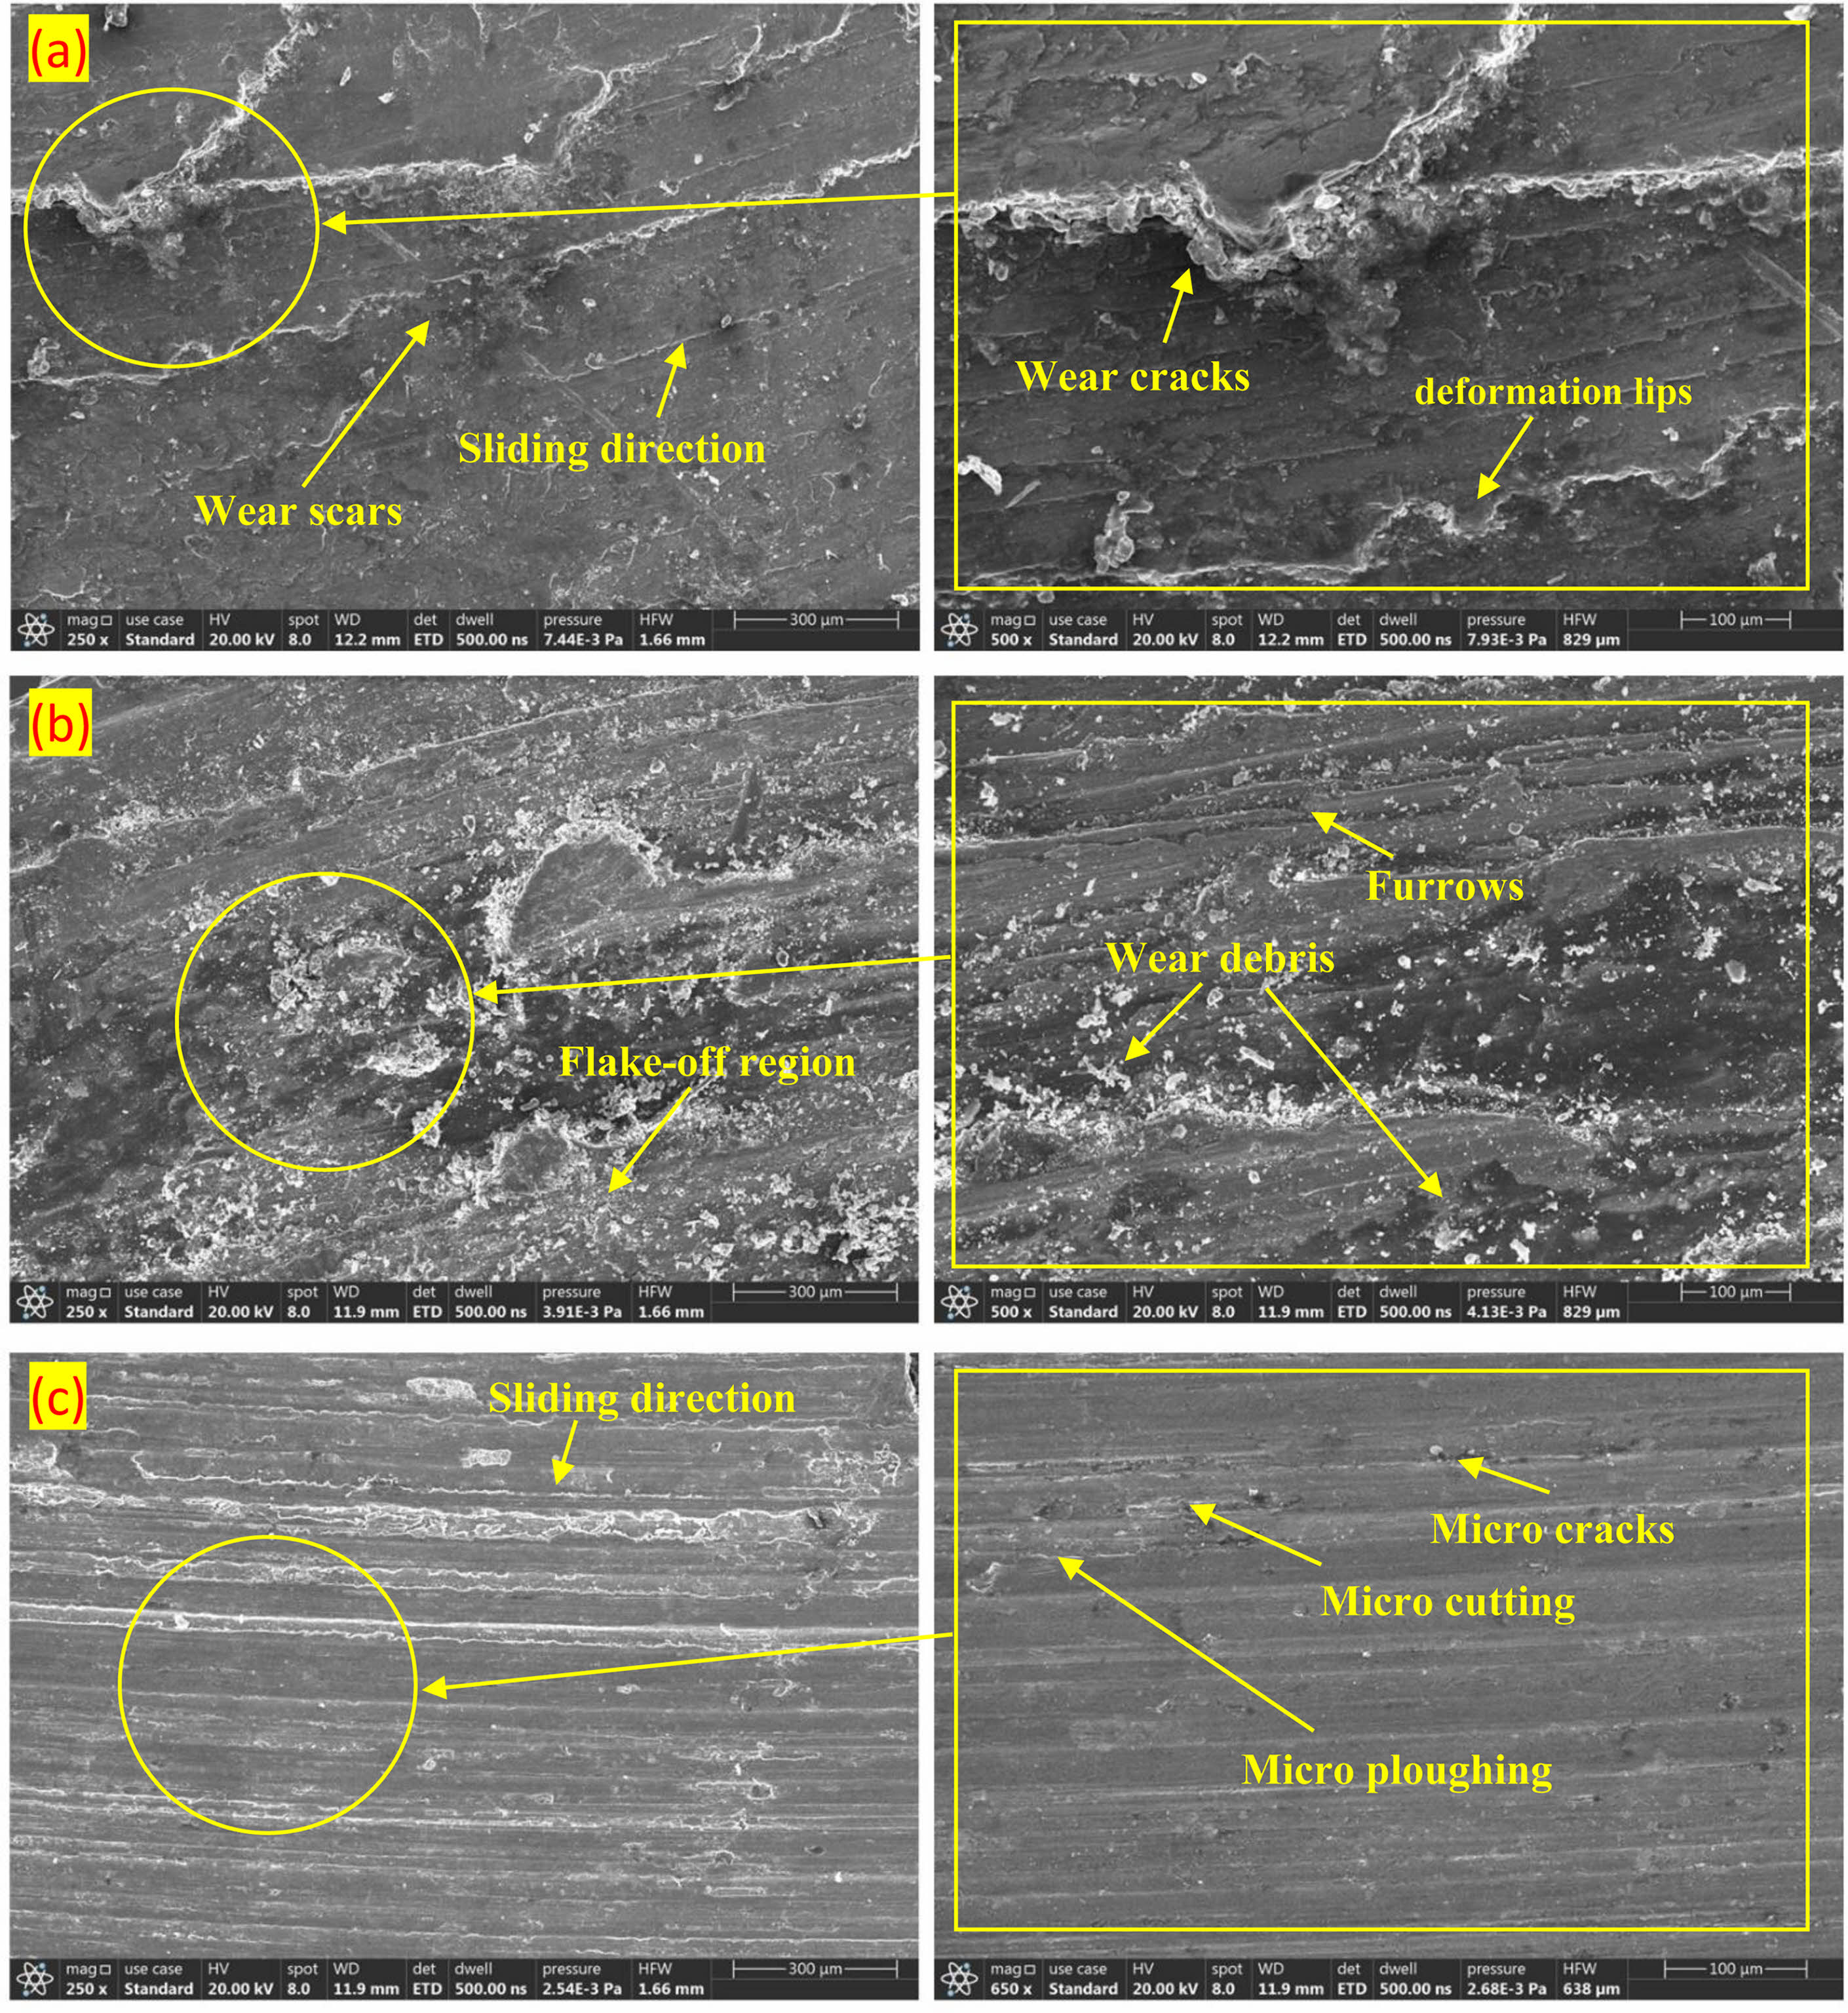
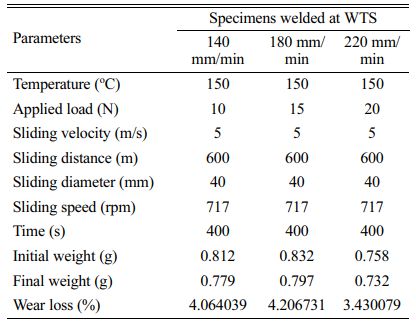
The wear analysis was performed for the specimen prepared under different WTS under varying loading conditions of 10, 15, and 20 N. The other wear testing parameters were set as per the values listed in Table 3. The wear test specimens were preheated to a temperature of 150 oC, to evaluate their high-temperature performance in a hard-wearing environment. The wear testing duration was for 400 s for each trial and the initial and the final weights of the specimen were recorded. From the wear results, it can be observed that during the first trial, the specimen had a material loss of 4.06%, while the specimen in the second trial exhibited an increased wear loss of 4.20%. During the third wear trial, the specimen exhibited a lower wear rate of 3.43%. The worn surfaces of the tested specimens can be inferred from Fig. 9. The micrograph in Fig. 9(a) indicates the worn surface of the specimen welded at 140 mm/min WTS. The surface of the specimen can be observed to sustain distinct wear scars and cracks. There are also characteristic signs of deformation lips on the worn surface along the direction of the sliding direction. There are also indications of fractured ridges on the worn surface adjacent to the wear scars in the morphology. Figure 9(b) indicates the worn surface morphology of the specimen welded at 180 mm/min WTS. The surface exhibits noticeably fewer delaminations compared to the former, while the surface is indicative of a distant flake-off region. There is also multiple wear debris observed in the morphology while the surface also shows the presence of furrows and deformation. The morphology in Fig. 9(c) indicates the worn surface morphology of the specimen welded at 220 mm/min WTS. The surface indicates the sliding direction and there are few deformation lips observed. The surface is not subjected to pronounced wear as observed in the former specimens, due to the higher surface micro- hardness of the specimen. Furthermore, the specimen also exhibited the lowest wear loss percentage among the tested specimens due to the improved micro- structure caused by the increased WTS during welding.
Interface microstructure
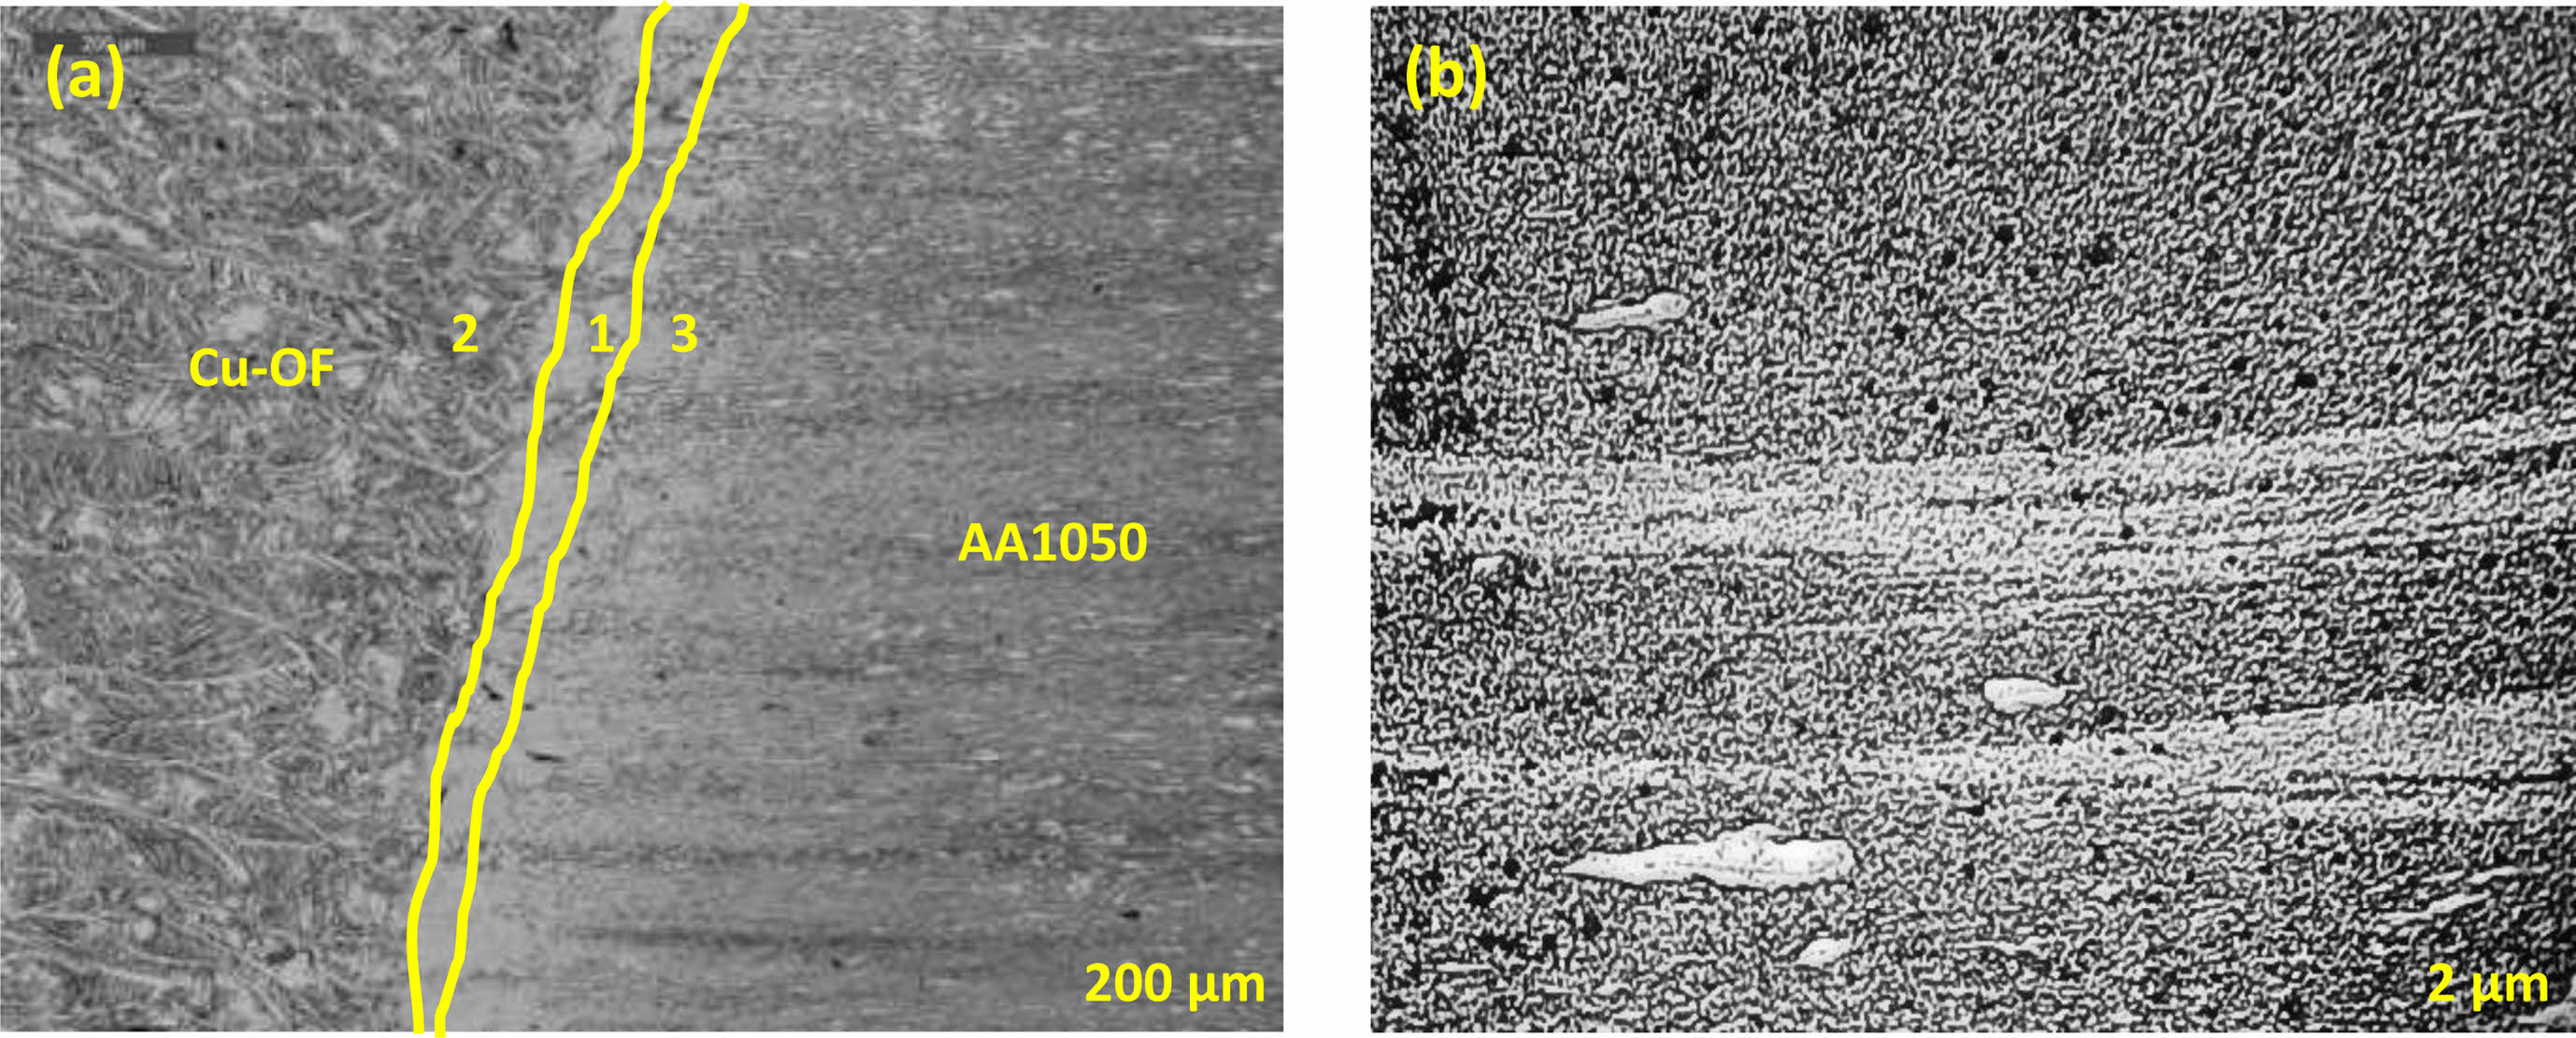
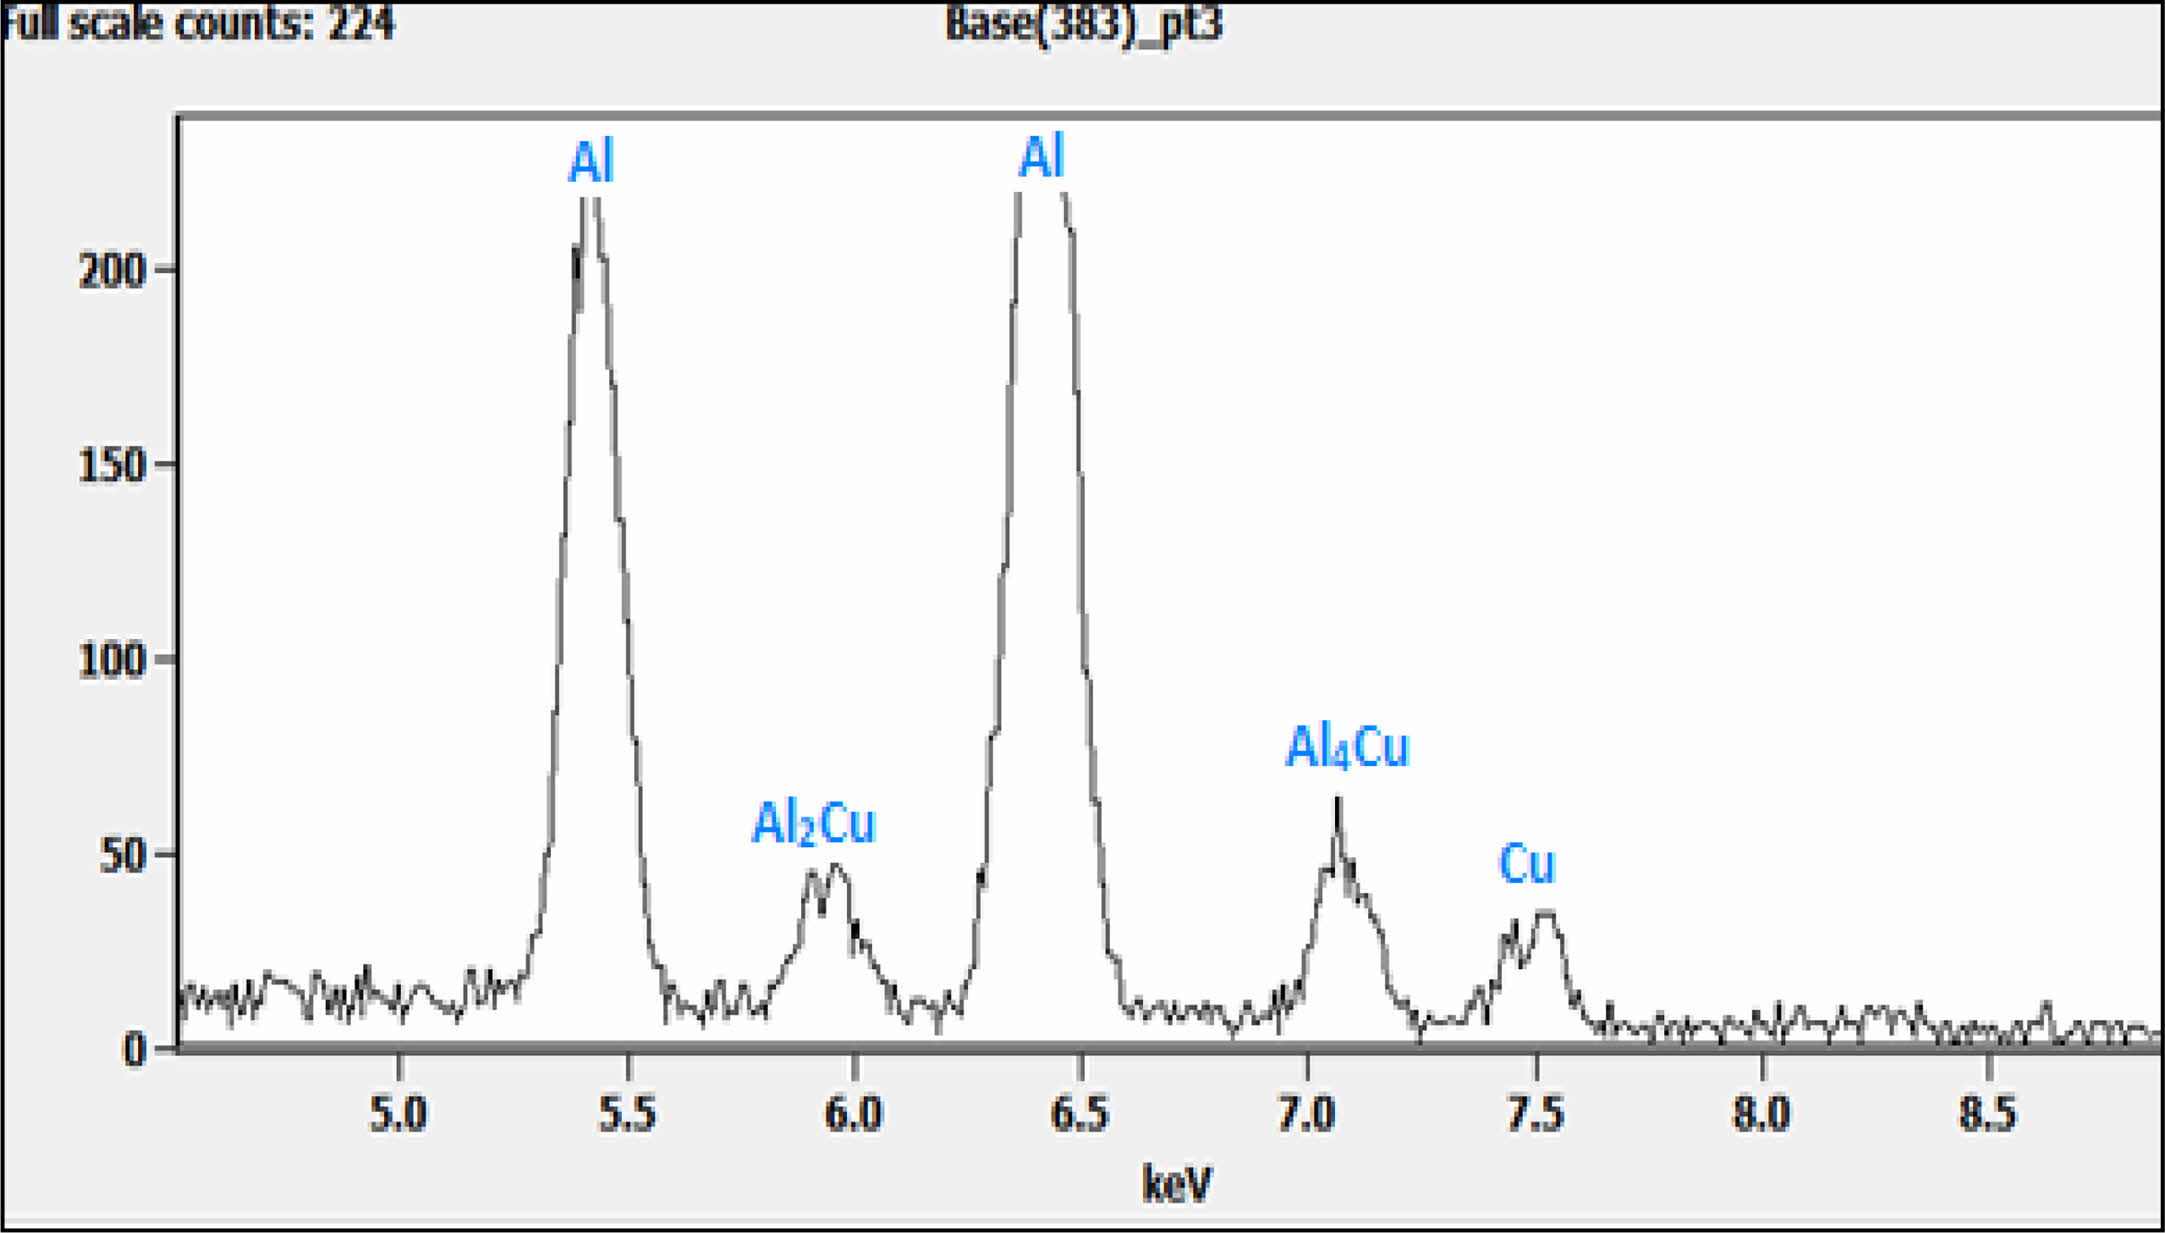
The microstructure of the weld interface was analyzed by EDS analysis for the specimen with better tensile, microhardness, and wear performance (220 mm/min FSW joint). In solid-state welding, the interactions of two dissimilar materials produce a remarkable compositional gradient at the weld interface that is capable of promoting element diffusion while welding. During friction stir welding, interfacial diffusion, which depends on the temperature rise, may take place, which causes the formation of intermetallic compounds (IMCs). Characteristics of aluminum in dissimilar metal joints are negatively impacted by the abundance of IMCs at the welded interface [27, 28]. At temperatures above 120 °C, the Aluminum-copper interface is susceptible to the formation of intermetallic compounds [29, 30]. The aluminum matrix and the copper particles are capable of interacting, which could form layered structures after the copper particles were detached from the copper plate [31]. As can be seen from Fig. 11, the XRD result at the interface indicates the composition is close to Al2Cu, whereas the composition further from the interface is close to the aluminum-copper solution denoted by points 1, 2, and 3 in Fig. 10(a). The EDS result reveals that the composition was near to Al4Cu and AlCu designated as points 4 and 5 in the interface zone (Fig. 10(b)). The interface layer's XRD measurement reveals the presence of Al2Cu and Al4Cu IMCs (Fig. 11). The phases that developed after the samples were friction stir welded are visible in the diffraction pattern. The joint failed at the weld nugget zone while the welding speed was 220 mm/min. This indicates a solid interface joint and confirms that the interface joint was more stable than the weld nugget, which is why it failed at WNZ [31-35].
|
Fig. 4 FSW samples produced at welding travel speeds (a) 140 rpm; (b) 180 rpm; (c) 220 rpm. |
|
Fig. 5 SEM Micrographs of (a) AA1050; (b) Cu-OF; (c) WNZ of FSW at 140 mm/min; (d) WNZ of FSW at 180 mm/min; (e) WNZ of FSW at 220 mm/min at scale of 400 µm; (f) WNZ of FSW at 220 mm/min at scale of 50 µm. |
|
Fig. 6 (a) Tensile strength; (b) Fracture locations of tensile tested specimens. |
|
Fig. 7 Fractography of tensile tested specimens welded at (a) 140 mm/min; (b) 180 mm/min; (c, d) 220 mm/min. |
|
Fig. 8 Vickers microhardness survey of FSW specimens. |
|
Fig. 9 Wear analysis of FSW specimens |
|
Fig. 10 EDS micrograph at (a) Interface zone; (b) Mixed zone. |
|
Fig. 11 Interfacial zone FSWed XRD analysis. |
In the present work, a dissimilar AA1050/Cu-OF joint was welded by the FSW process. The joints were characterized by microstructural, tensile, fractographical, microhardness, wear and interface morphological characteristics. The observations made from the analysis are:
The macrographs of the joints welded at 140 mm/min and 180 mm/min indicated agglomeration of copper, the presence of noticeable microvoids, and noticeable tunnel defects respectively. The joint welded at 220 mm/min exhibited comparably better material interaction in the weld zone.
The micrographs of the joints indicated agglomerated copper, observable void defects, non-uniform dispersion of copper and the presence of micro defects such as voids and porosities in the microstructures of the joints welded at 140 mm/min and 180 mm/min, respectively. The 220 mm/min FSW joint exhibited a more uniform mixture between copper and aluminum with comparatively smaller grains.
Among the tested joints, the specimen welded at 220 mm/min exhibited peak tensile strength of 106.4 MPa. The specimens welded at 140 and 180 mm/min WTS exhibited brittle fracture initiating at the weld interface between the copper and weld nugget zone while those welded at 220 mm/min, exhibited ductile fracture amid WNZ.
The microhardness results were supportive of the results obtained with the tensile strengths, wherein the peak microhardness observed was 124 HV in the WNZ of the specimen welded at 220 mm/min. The fracture of the specimen occurred in the region with the highest microhardness. Similar observations were made for the 140 and 180 mm/min specimens whose microhardness levels peaked at the WNZ-Cu interface where their fracture had occurred.
The wear analysis indicated the wear percentage of the 220 mm/min joint specimen was lower (3.43%) than the remaining specimens (4.06% and 4.20%). The specimen with the lowest wear exhibited the least observed wear scars with characteristics of micro-cutting and micro-ploughing noted in the morphology. The wear morphologies of the other specimens indicated the presence of deformation lips, multiple wear debris, wear scars, and cracks contributing to their higher wear rates.
The EDS morphology and XRD analysis of the 220 mm/min joint indicated the presence of intermetallic compounds consisting of thin layers of Aluminum-copper compounds such as Al2Cu and Al4Cu, which provided the potential enhancement of the mechanical performance of the joint.
There is no conflict of interest reported by the authors(s).
- 1. T. Solchenbach and P. Plapper, Opt. Laser. Technol. 54 (2013) 249-256.
-

- 2. M.S.M. Isa, K. Moghadasi, M.A. Ariffin, S. Raja, M.R.b. Muhamad, F. Yusof, M.F. Jamaludin, N.b. Yusoff, and M.S. Ab Karim, J. Mat. Res. Tech. 15 (2021) 2735-2780.
-
- 3. F.A. Besler, P. Schindele, R.J. Grant, and M.J.R. Stegmüller, J. Mater. Process. Technol. 234 (2016) 72-83.
-
- 4. N. Sharma, A.N. Siddiquee, Z.A. Khan, and M.T. Mohammed, Mat. Manuf. Process. 33[7] (2018) 786-794.
-
- 5. P. Xue, B.L. Xiao, D.R. Ni, and Z.Y. Ma, Mater. Sci. Eng. A. 527[21] (2010) 5723-5727.
-
- 6. G. Sun, J. Niu, D. Wang, and S. Chen, Fatigue. Fract. Eng. Mater. Struct. 38[4] (2015) 445-455.
-
- 7. P. Carlone, A. Astarita, G.S. Palazzo, V. Paradiso, and A. Squillace, Int. J. Adv. Manuf. Technol. 79[5] (2015) 1109-1116.
-
- 8. B. Cai, Z.Q. Zheng, D.Q. He, S.C. Li, and H.P. Li, J. Alloys Compd. 649 (2015) 19-27.
-
- 9. A.Q. Al-Roubaiy, S.M. Nabat, and A.D.L. Batako, Int. J. Adv. Manuf. Technol. 71[9] (2014) 1631-1642.
-
- 10. T. Le Jolu, T.F. Morgeneyer, A. Denquin, M. Sennour, A. Laurent, J. Besson, and A.-F. Gourgues-Lorenzon, Metall. Mater. Trans. A. Phys. Metall. Mater. Sci. 45[12] (2014) 5531-5544.
-
- 11. S. Celik and R. Cakir, Metals. 6[6] (2016) 133.
-
- 12. N.A. Muhammad, C. Wu, and H. Su, J. Mater. Res. Technol. 14 (2021) 1035-1051.
-
- 13. D.K. Yaduwanshi, S. Bag, and S. Pal, Mater. Manuf. Process. 33[3] (2018) 277-287.
-
- 14. A.G. Wiedenhoft, H.J.d. Amorim, T.d.S. Rosendo, M.A.D. Tier, and A.J.M.R. Reguly, Mat. Res. 21[4] (2018) e20170983.
-
- 15. Q.-Z. Zhang, W.-B. Gong, and W. Liu, T. Nonferr. Metal. Soc. 25[6] (2015) 1779-1786.
-
- 16. P. Muthurasu and M. Kathiresan, J. Ceram. Process. Res. 22[6] (2021) 697-704.
-
- 17. A.N. Salah, H. Mehdi, A. Mehmood, A.W. Hashmi, C. Malla, and R. Kumar, Mater. Today: Proc. 56[4] (2022) 1675-1683.
-
- 18. X. Wang and D.A. Lados, J. Adv. Joining Process. Res. 22[1] (2021) 16-24.
- 19. R. Pandiyarajan and M.P. Prabakaran, J. Ceram. Process. Res. 21[6] (2020) 690-698.
-
- 20. C. Chanakyan and S. Sivasankar, J. Ceram. Process. Res. 21[6] (2020) 647-655.
-
- 21. N. Sharma, Z.A. Khan, A.N. Siddiquee, and T. Nonferr. Metal. Soc. 27[10] (2017) 2113-2136.
-
- 22. K.P. Mehta and V.J. Badheka, Mater. Manuf. Proc. 31[3] (2016) 233-254.
-
- 23. S. Shankar, P. Vilaça, P. Dash, S. Chattopadhyaya, and S. Hloch, Measurement. 146 (2019) 892-902.
-
- 24. P. Gopi Krishnan, B. Suresh Babu, and K. Siva, J. Ceram. Process. Res. 21[2] (2020) 157-163.
-
- 25. K. Periasamy, N. Sivashankar, R. Viswanathan, and J. Balaji, J. Ceram. Process. Res. 23[3] (2022) 335-343.
-
- 26. P. Xue, D.R. Ni, D. Wang, B.L. Xiao, and Z.Y. Ma, Mater. Sci. Eng. A. 528[13] (2011) 4683-4689.
-
- 27. Y. Wei, H. Li, P. Xiao, and J. Zou, Adv. Mater. Sci. Eng. 2020 (2020) 6845468.
- 28. R. Crushan and P. Ashoka Varthanan, J. Ceram. Process. Res. 22[6] (2021) 620-628.
-
- 29. R. Girimurugan, J. Bensamraj, and S. Karthick, J. Ceram. Process. Res. 23[4] (2022) 553-557.
-
- 30. W. Tian, H. Su, and C. Wu, Int. J. Adv. Manuf. Technol. 107[1] 2020 59-71.
-
- 31. S.A.A. Dilawary, A. Motallebzadeh, E. Atar, and H. Cimenoglu, Tribol. Int. 127 (2018) 288-295.
-
- 32. A. Kanakaraj, R. Mohan, and R. Viswanathan, J. Ceram. Process. Res. 23[3] (2022) 268-277.
-
- 33. G. Rajaram, S. Kumaran, and T.S. Rao, Mater. Sci. Eng. A. 528[1] (2010) 247-253.
-
- 34. A.M. Dubey, A. Kumar, and A.K. Yadav, J. Mater. Process. Technol. 240 (2017) 87-97.
-
- 35. R. Srinivasan, B. Suresh Babu, P. Prathap, R. Whenish, R. Soundararajan, and G. Chandramohan, J. Ceram. Process. Res. 22[1] (2021) 16-24.
-
 This Article
-
2023; 24(2): 274-284
Published on Apr 30, 2023
- 10.36410/jcpr.2023.24.2.274
- Received on Aug 15, 2022
- Revised on Oct 14, 2022
- Accepted on Nov 19, 2022
Services
- Abstract
introduction
materials and methods
results and discussion
conclusion
- Conflict of Interest
- References
- Full Text PDF
Shared
Correspondence to
- K. Anandavelu
-
Professor, Department of Mechanical Engineering, MRK Institute of Technology, Kattumannarkoil - Tamilnadu 60830
Tel : 9444206138 - E-mail: anandavel01@yahoo.com
Clean-Energy Research Institute(CRI), Hanyang University, 222, Wangsimni-ro, Seongdong-gu, Seoul, 04763, Korea
E-mail: jcpr@hanyang.ac.kr