


- Synthesis, characterization, and dielectric properties of SBN ferroelectric matrix doped with Eu2O3
Anasser Imane*, Zegzouti Abdelouahad, Noureddine Elbinna, Elaatmani Mohamed and Daoud Mohamed
Laboratory of Materials Sciences and Processes Optimization, Chemistry Department, Faculty of Sciences Semlalia, Cadi Ayyad University, Marrakech 40000, Morocco
This article is an open access article distributed under the terms of the Creative Commons Attribution Non-Commercial License (http://creativecommons.org/licenses/by-nc/4.0) which permits unrestricted non-commercial use, distribution, and reproduction in any medium, provided the original work is properly cited.
Recently, ferroelectric behaviors have been optimized to suit some ecological and electronic applications, such as nonvolatile random-access memories. Throughout this study, europium has been proposed to enhance the structure density of SrBi2−xEuxNb2O9 ceramics (0 ≤ x ≤ 0.50). Indeed, to examine their suitability as layered perovskite ferroelectric materials in the electronic industry, the effect of europium on phase structure, grain size and morphology, and mainly dielectric behaviors, were investigated. Distinct solid-solutions were prepared for which bismuth was substituted in a small proportion by europium via solid-state thermal treatment at 900 °C. The characterization of samples has been done by X-Ray diffraction, Raman spectroscopy, FTIR spectroscopy, density measurements, and dielectric behavior studies. Substitution of bismuth by europium reduced dielectric loss and constant, owing to the lower chemical bonds of europium (Eu–O) compared to bismuth (Bi–O). This study demonstrated that SrBi2−xEuxNb2O9 with x up to 0.40 had an electrical profile adequate for ferroelectric application and could be used in FeRAM applications
Keywords: SBN, Ferroelectric, Ceramics, Dielectric, Aurivillius
Ferroelectric materials have been studied in the past decades; they are extensively applied in electronic components as capacitors or dielectric resonators in microwave applications due to their low dielectric loss and high dielectric constant [1], nonvolatile ferroelectric random access memories (NVFRAM), pyroelectric infrared detectors, piezoelectric sensors, and optical switches [2]. Put on one's account their particular physical properties (including spontaneous polarization, piezoelectricity, pyroelectricity), high read-write speed, low operating power, non-volatility, and radiation hardness [3].
Various compounds have been exhibited as promising candidates for this use, such as perovskites based on bismuth and niobates, pyrochlores, etc [4]. Nonetheless, a composite with ferroelectric properties comparable to those of lead zirconate titanate, Pb[ZrxTi1-x]O3 (PZT), has not yet been invented [5]. Likewise, each of these variable structures has distinct characteristics relating to the coercive field, remanent polarization, or curie temperature. However, the toxic nature of lead (Pb), fatigue, aging, and leakage current are still the reasons for their suffering. However, analogous to the European Union Directives 2002/95/EC, 2002/96/EC, lead-based ferro-materials have to be substituted with environmentally friendly discretions unless a predictable alternative is found. This is why lead-free ferroelectric ceramics that can fit the specifications mentioned are becoming an increasing interest in the research community.
In this regard, the Bismuth Layered Structure Ferroelectrics materials (BLSF) took profit due to their unique and distinct ferroelectric properties in applications as well as compositions known as lead-free constituents, exhibiting a high and stable dielectric constant, low dielectric loss, high tenability properties [6], and an anisotropic residual polarization [7].
These ceramics are described by the general form Bi2Am–1BmO3m+3 (m = 1, 2, 3, 4), where "A" is a sequence of ions appropriate for dodecahedral coordination, and "B" is a combination of ions relevant for octahedral coordination. [Bi2O2]2+ sheets and perovskite-type layers presenting the composition (Am–1BmO3m+1)2– form these compounds by the mixture of those structural elements [8]. Intermediating bismuth oxide layers between the ferroelectric units present the aim of BLSFs over other structures of ferroelectric materials. Extensive research on SrBi2Nb2O9 (known as SBN) belonging to the family of these layered ceramics with m = 2 proved their suitability as functional ceramics in the NVFeRAM applications [3,9].
The Literature shows that elementary substitution of 'A' and 'B' sites with atoms like Rare Earth (RE) elements, which have multiple applications that connect many aspects of modern life and culture as they have unusual physical and chemical properties [10], can improve the properties of pure Bismuth Strontium Niobate (SBNs) [11, 12], whose characteristics, such as particle size, morphology, pureness, chemical distribution, and composition, are subject of affection out of the condition of preparation, and affect in return the properties and efficiency of the final ceramic. In fact, Strontium Bismuth Niobate synthesized by the solid-state reaction method using mixtures of oxide reagents particles of large size demands high temperatures for the synthesis and more manual as well as automatic grinding duration [13].
The work in question is an attempt to further upgrade the properties of SBN by partial substitution at Bismuth sites with Europium. This element is chosen for doping given its ionic radius and electronegativity values of Bi and Eu, which are 0.120 nm, 0.185 nm, and 1.9 eV, 1.2 eV, respectively.
Ceramic elaboration
A solid-state reaction method was used to elaborate the ceramic compounds, using Bi2O3, SrCO3, Nb2O5, and Eu2O3 as raw materials. To compensate for the loss due to evaporation, 3% of Bi2O3 is added to the stoichiometric amounts of batch constituents, which were weighed using an electronic balance, crashed to a fine powder, and homogenized for about 2 h using an agate mortar before it was placed in an alumina crucible [14]. The mixtures were calcinated at a temperature of 900 °C for 12 h. Using a uniaxial pressing in a hydraulic jack, the calcined powder was pressed into pellets of 1 to 2 mm in thickness and 6 mm in diameter by applying a pressure of 10 MPa. The pellets were then fritted for 4 h at a temperature of 950 °C.
X-ray diffraction analysis, carried out using a PANAnalytical XPERT diffractometer (with 40 kV/200 mA, an angular range between 10-70° (2θ) was analyzed with a 0.05° step size (2θ) and 2 s/step as a counting time), was used to determine the phases formation of the samples. The POWD software was used to calculate the Miller indices and the matrix parameters of the specimens.
The theoretical density of the samples was calculated using the volume obtained from the POWD software. In contrast, the experimental density was measured using Archimedes' Method, based on the following equation (the measurements were carried out three times to obtain an average density value) [15]:
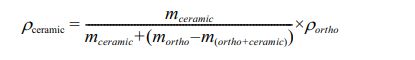
with: ρceramic = density of the ceramic;
mceramic = mass of ceramic measured in the air;
mortho = mass of diethyl- phthalate;
m(ortho + ceramic) = mass of ceramic immersed in diethyl- phthalate;
ρortho = volumic mass of diethyl- phthalate (1.11422 g/cm3);
Characterization of the powder phase structure
Fourier Transform Infrared Spectroscopy (FTIR) and Raman spectroscopy were used to study the structure of the compounds. By analyzing a fine powder of the synthesized phase using the Confotec MR520 Raman Confocal Microscope, the spectra were recorded in a range between 400-1400 cm-1 over an average of 128 scans and 1 s exposure time in the micro-Raman compartment with a 10× objective and an Argon-ion laser emitting 514 nm as an excitation source.
FTIR spectra were obtained by the KBr technique, using a spectrometer Bruker VRTEX 70, in the 50-4000 cm-1 domain, with 32 scans and a 4 cm-1 resolution for each determination. Pulverized KBr was homogenized by mixing the ceramics powder with a ratio of (0.99/0.01 g). A pressure of 2 t/cm2 was applied to the primary mixtures to produce dense discs. The FTIR spectra were measured immediately after the preparation to avoid the disc's moisture attack.
Scanning electron microscopy (SEM) from Carl ZEISS EVO18 imageries was employed to observe the structure of the grains.
Dielectric characterization
The dielectric measurements were handled on electrodes that had been formed by the appliance of a conductive silver paste on both sides of polished pellets. The dielectric constant (ε’r) dependence on temperature from RT to 500 °C was measured and recorded at different frequencies on the HP 4192A impedance analysis.
Phase formation and structure
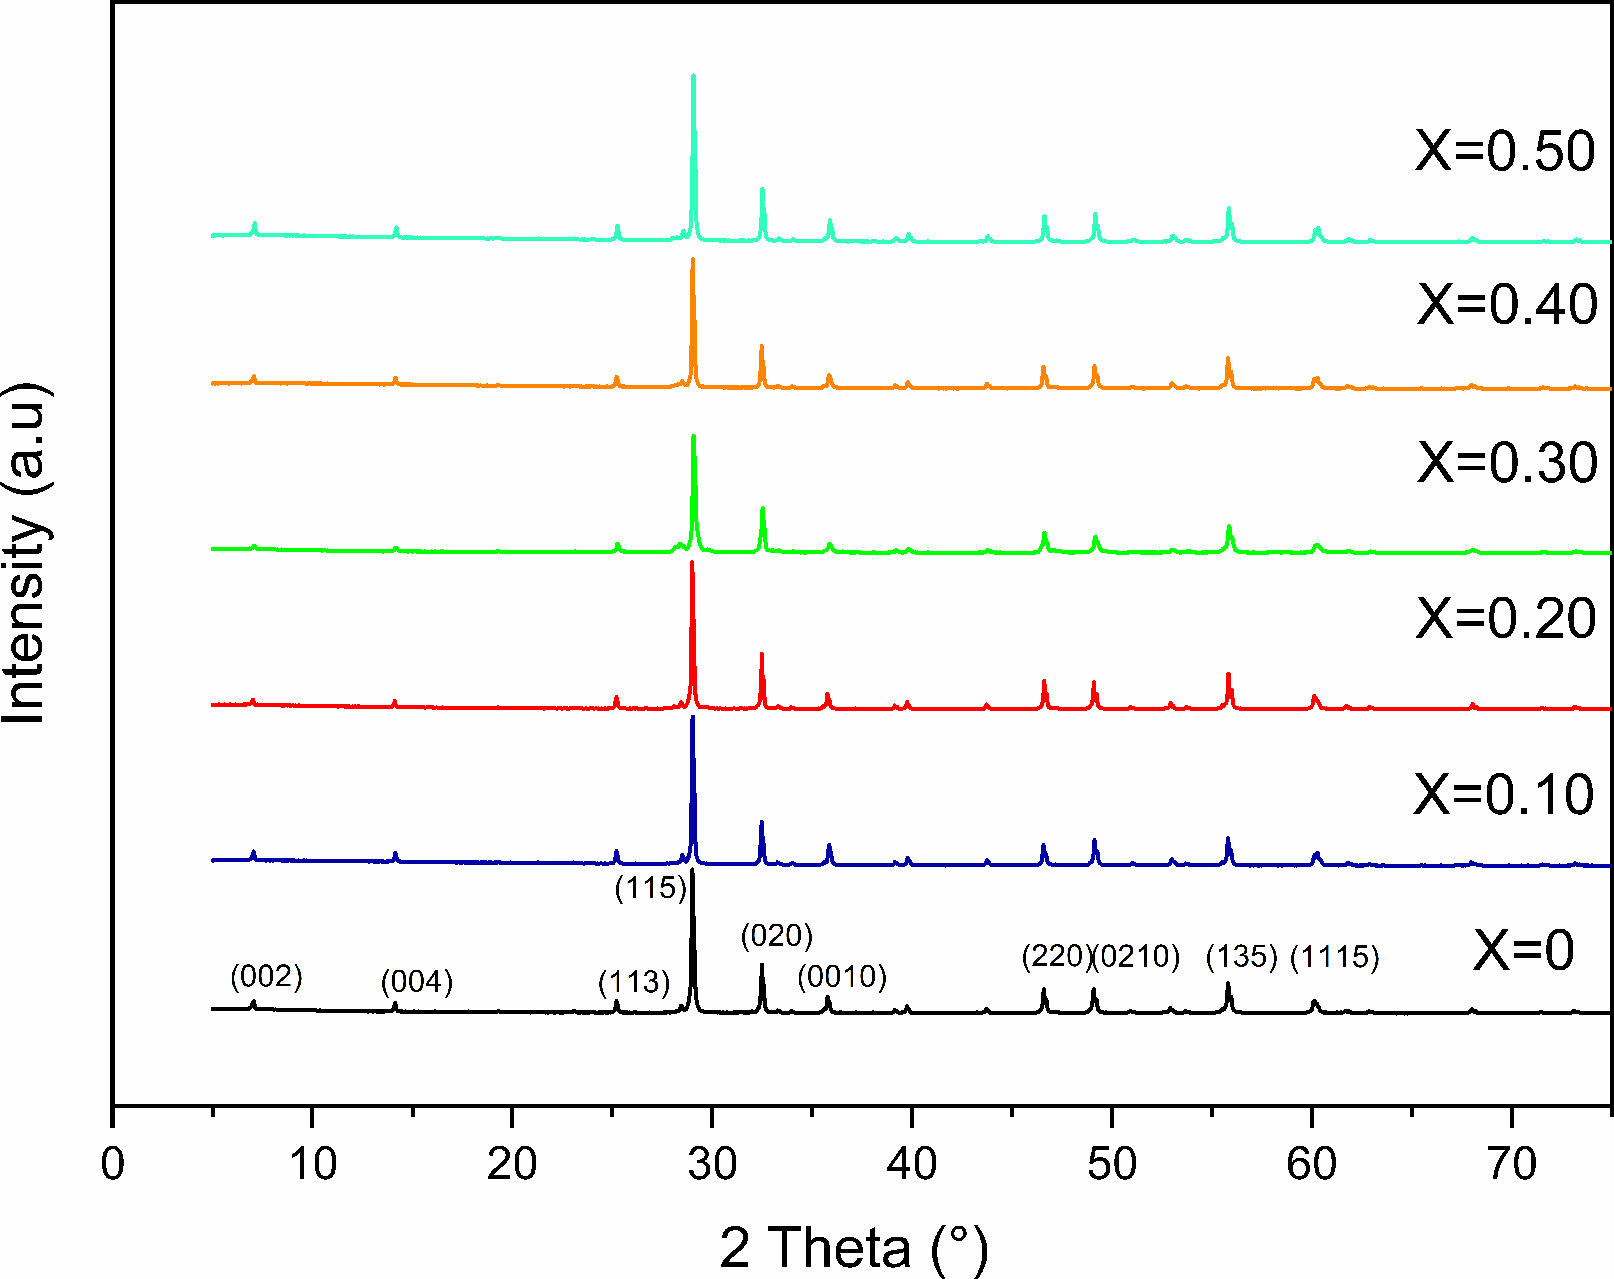
X-ray diffraction analyses demonstrated that single phase layered structures were formed within the composition ranges studied in which the content is between 0 and 0.50, and no secondary phase was visible (Fig. 1). They also showed that all samples have a space group A21am in the orthorhombic structure [16]. This signifies that the layered structure of SrBi2Nb2O9 (JCPDS card no. 89-8158) is preserved in SrBi2−xEuxNb2O9 (x = 0, 0.10, 0.20, 0.30, 0.40, and 0.50) and validated the entrance of Eu3+ ions into the unit cell while conserving the aurivillius structure [17]. Furthermore, the highest intensity of the diffracted peaks is attributed to the (115) orientation, which is coherent with the given factuality that the most extreme reflection of Aurivillius compounds is all of the type (11”2m+1”), as mentioned in a study published a priori, the set of (hkl) indices set with the (115) system are reported to be orthorhombic ((hkl) indices of maximum intensity peak) [18].
The shift of 29°'s peak (corresponding to (1 1 5) reflection) indicates that europium ions have diffused into the SrBi2Nb2O9 lattice, given the systematic variation of the match between the Bi–O and the averaged Eu–O band stretch. Simultaneously, stress between the perovskite units and the (Bi2O2)2+ layers can be released by the substitution of smaller ionic radii, europium in this case (93 pm) for Bi3+ (103 pm); under these circumstances, the distortion is reduced in the Aurivillius system [11, 19, 20].
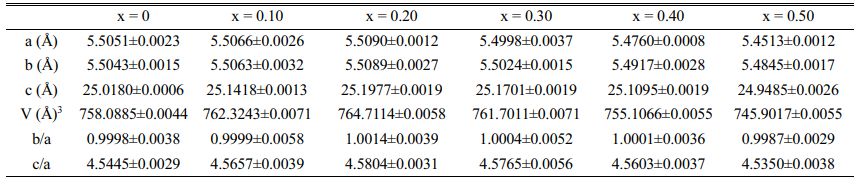
From analyzing structural parameter data collected (Table 1), the strain along c-axis c/a (tetragonal strain) and the orthorhombic distortion (b/a) highlights less orthorhombicity and more tetragonal strain [2(a−b)/(a+b)] [8, 21]. Therefore, it is clear that the c value increases with increasing the concentration of europium, yet, the value decreases when its concentration reaches 0.30. Conjointly, the a and b values seem to diminish with the main doping concentration, which signifies that the unit cell's volume progressively undergoes some substantial contraction at x = 0.30.
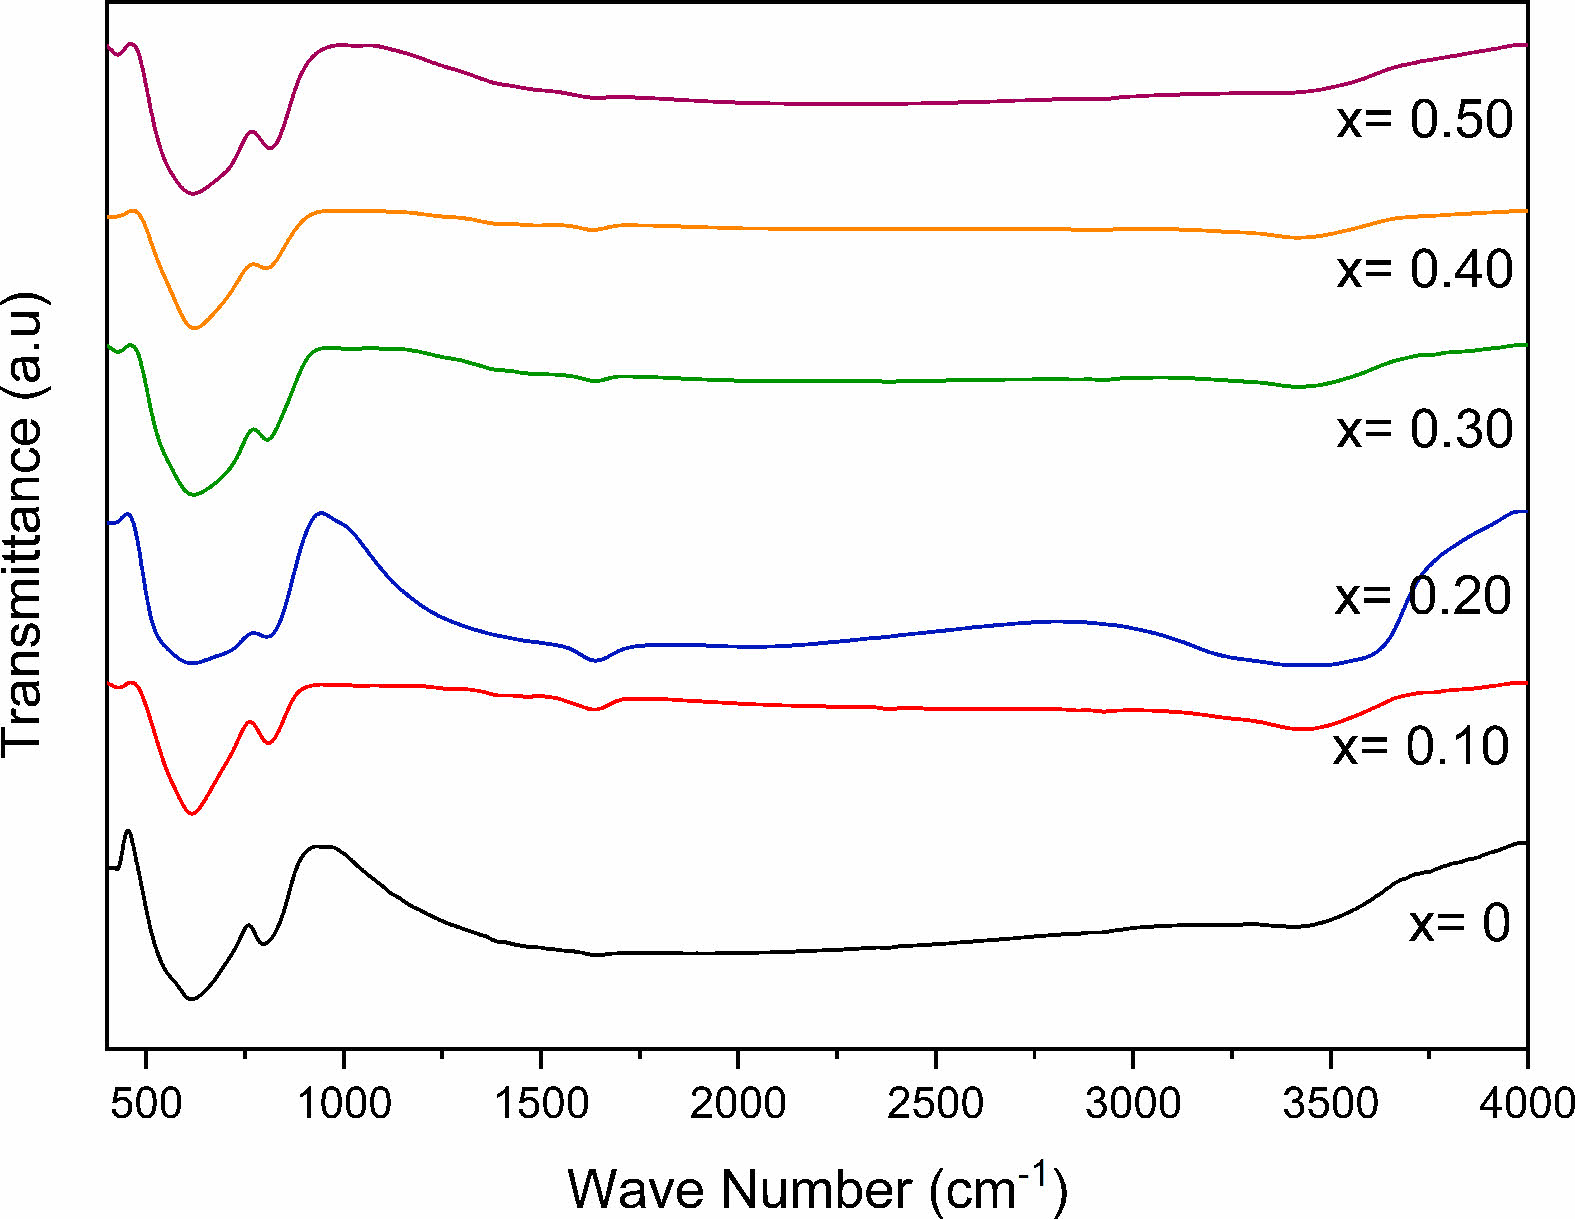
FTIR and Raman spectra of Eu- doped SrBi2Nb2O9 powders (SrBi2-xEuxNb2O9 with x = 0, 0.10, 0.20, 0.30, 0.40, and 0.50) were measured to understand the specific absorption patterns based on bond strength and atoms that constitute molecules, the influence of europium substitution on SBN, and to identify the phase purity of multi-component oxides in SBN and SBEuN. Two absorption bands were observed from the FTIR spectra of SBN and SBEuN ceramics (Fig. 2). The bands at 3440 and 1630 cm-1 correspond to the bending mode of the H-O group of water, which might be due to the absorption of atmospheric hydrogen dioxide during the experiments. All spectra of the powders doped with europium exhibited characteristic Nb-O well-defined bond vibrations of the NbO6 octahedron at 615 and 810 cm-1. The band at 430 cm-1 is assigned to the vibrations of Bi-O arising from the strong covalently bonded (Bi2O2)2+ layers [22].
When comparing FTIR’s spectrums, it is clear that all bands do not shift; the substitution effect was taken into consideration. The results obtained in this study suggest that the temperature of 900 °C promotes the reaction between SrCO3, Bi2O3, and Nb2O5 oxides, forming the phase SrBi2Nb2O9 [23].
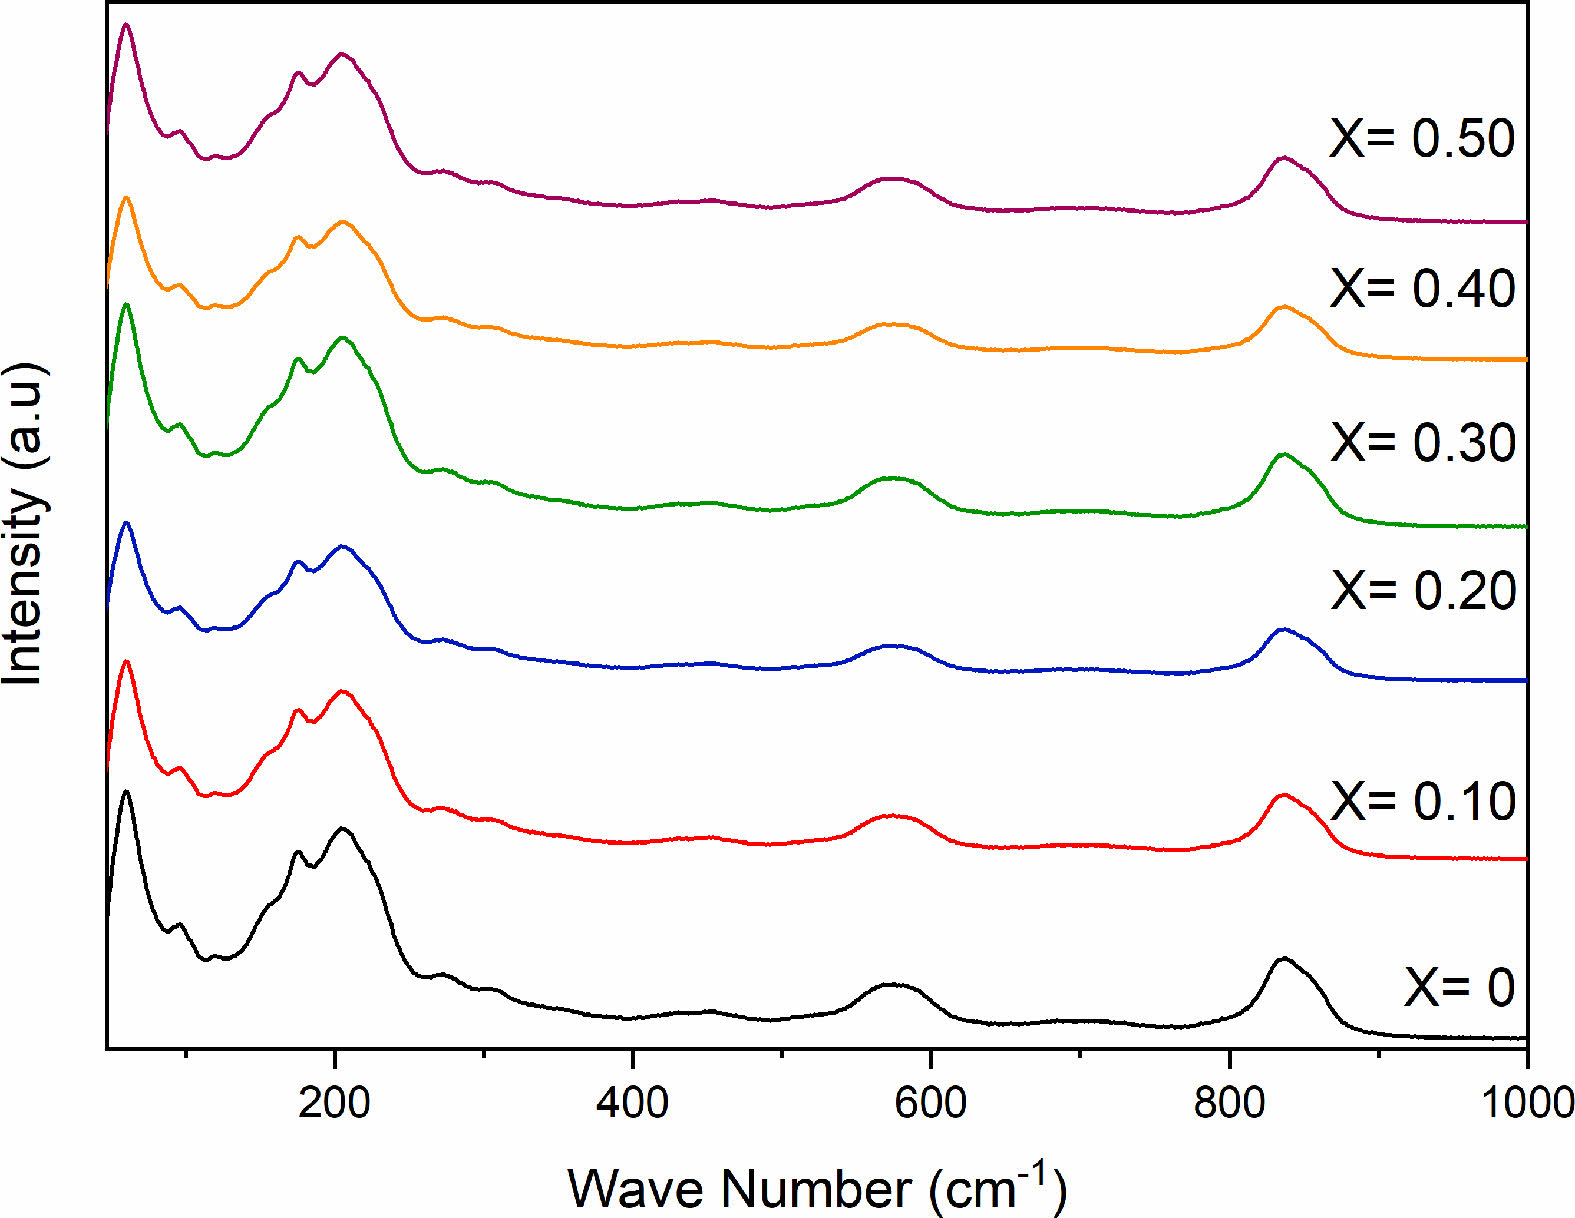
Five absorption bands are observed from the Raman spectra of SBN and SBEuN ceramics (Fig. 3). The broad absorption band at ~590 cm-1 and the lower band at 837 cm-1 are assigned to the Nb-O stretching mode and bending vibration. The bands at 98 and 218 cm-1 are related to the vibration of the A (Sr) site ions of the pseudo perovskite blocks, while the band at 61 cm-1 is assigned to the vibrations arising from strong covalently bonded (Bi2O2)2+ layers. For the spectra of the Eu-doped SrBi2-xEuxNb2O9, there are no additional shifts in the band or intensity [24].
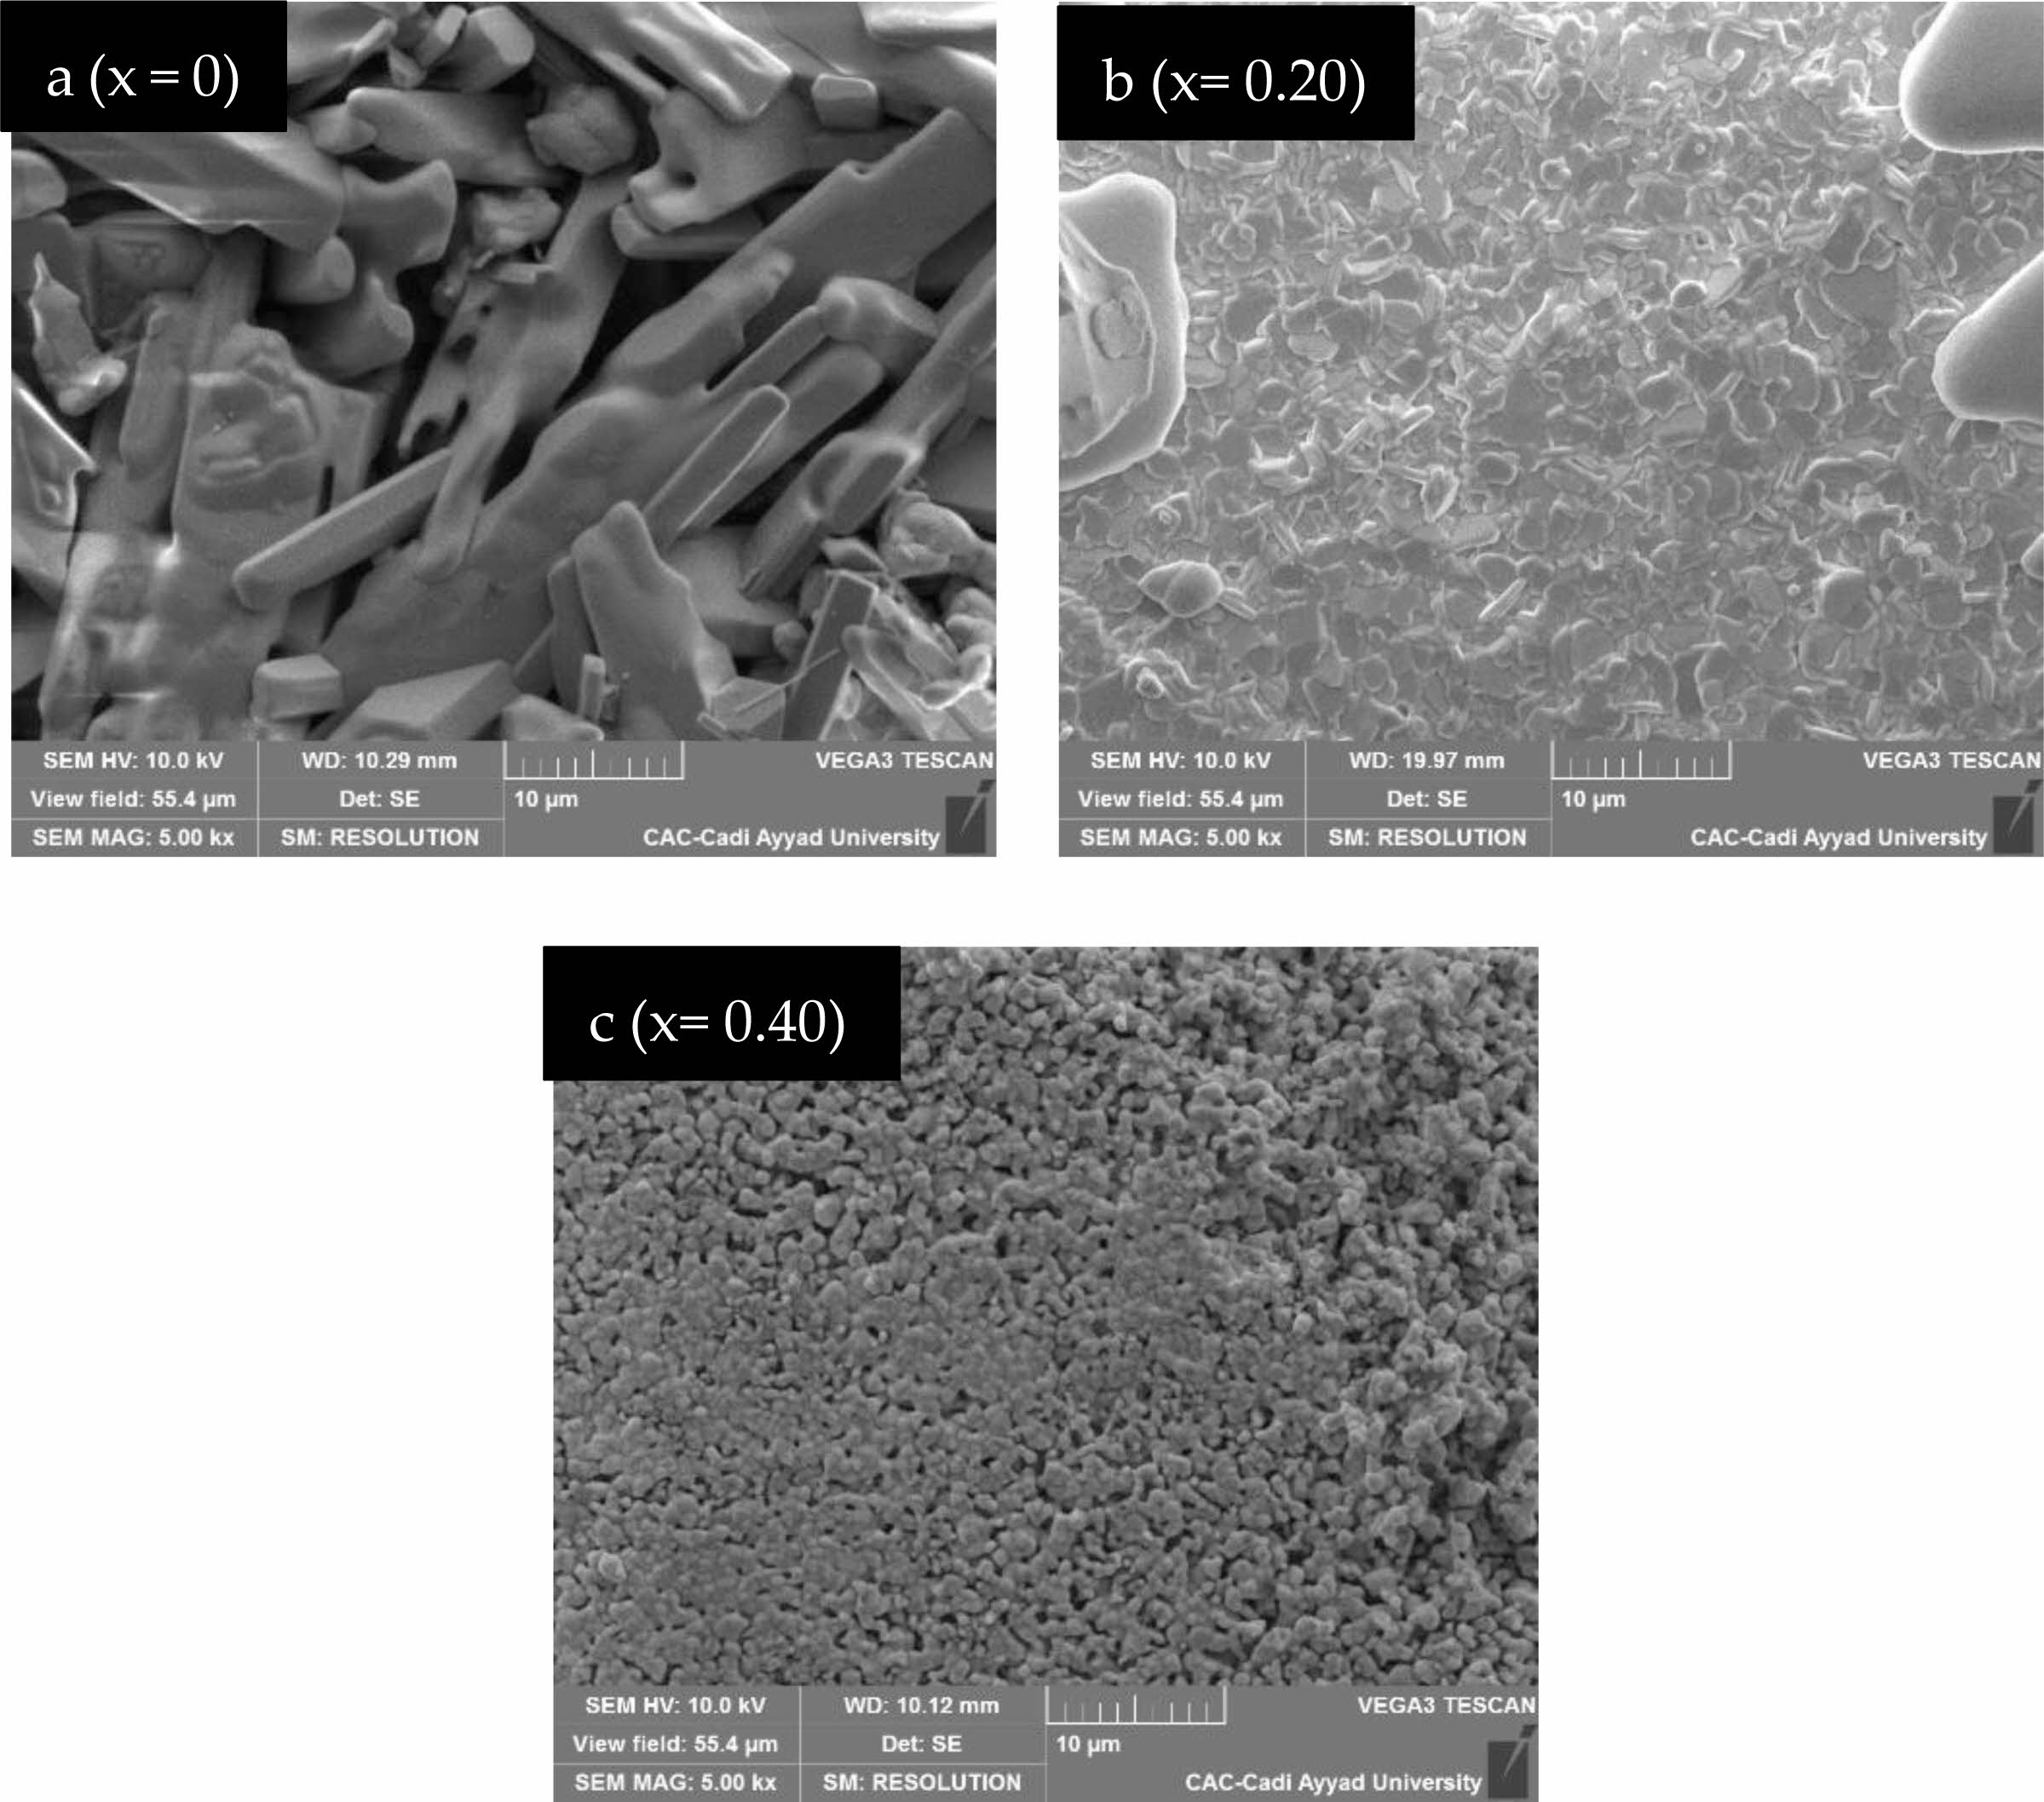
Fig. 4 shows the cross-sectional microstructure investigated by SEM (Scanning electron microscopy) micrographs, which have been registered for the Eu-doped SrBi2Nb2O9 (x = 0, 0.10, 0.20, 0.30, 0.40, and 0.50) polished surfaces ceramic-materials. The sintered pellets exhibit less porosity and represent condensed and various aspects in the arrangement of grains in both shape and size. At the same time, the plate and rod-like shaped grains have been recorded for SBN (x = 0) (Fig. 4-a), which is recognized as the grain growth characteristic form of Aurivillius microstructures [22, 25]. The doped samples (Fig. 4-b-c) are micro-grained and thus display remarkable and well-pronounced grain boundaries. A denser morphology with low porosity and a more pronounced globular aspect of grains are observed for the doped ceramics when increasing the rate of Europium doping [18].
Dielectric properties
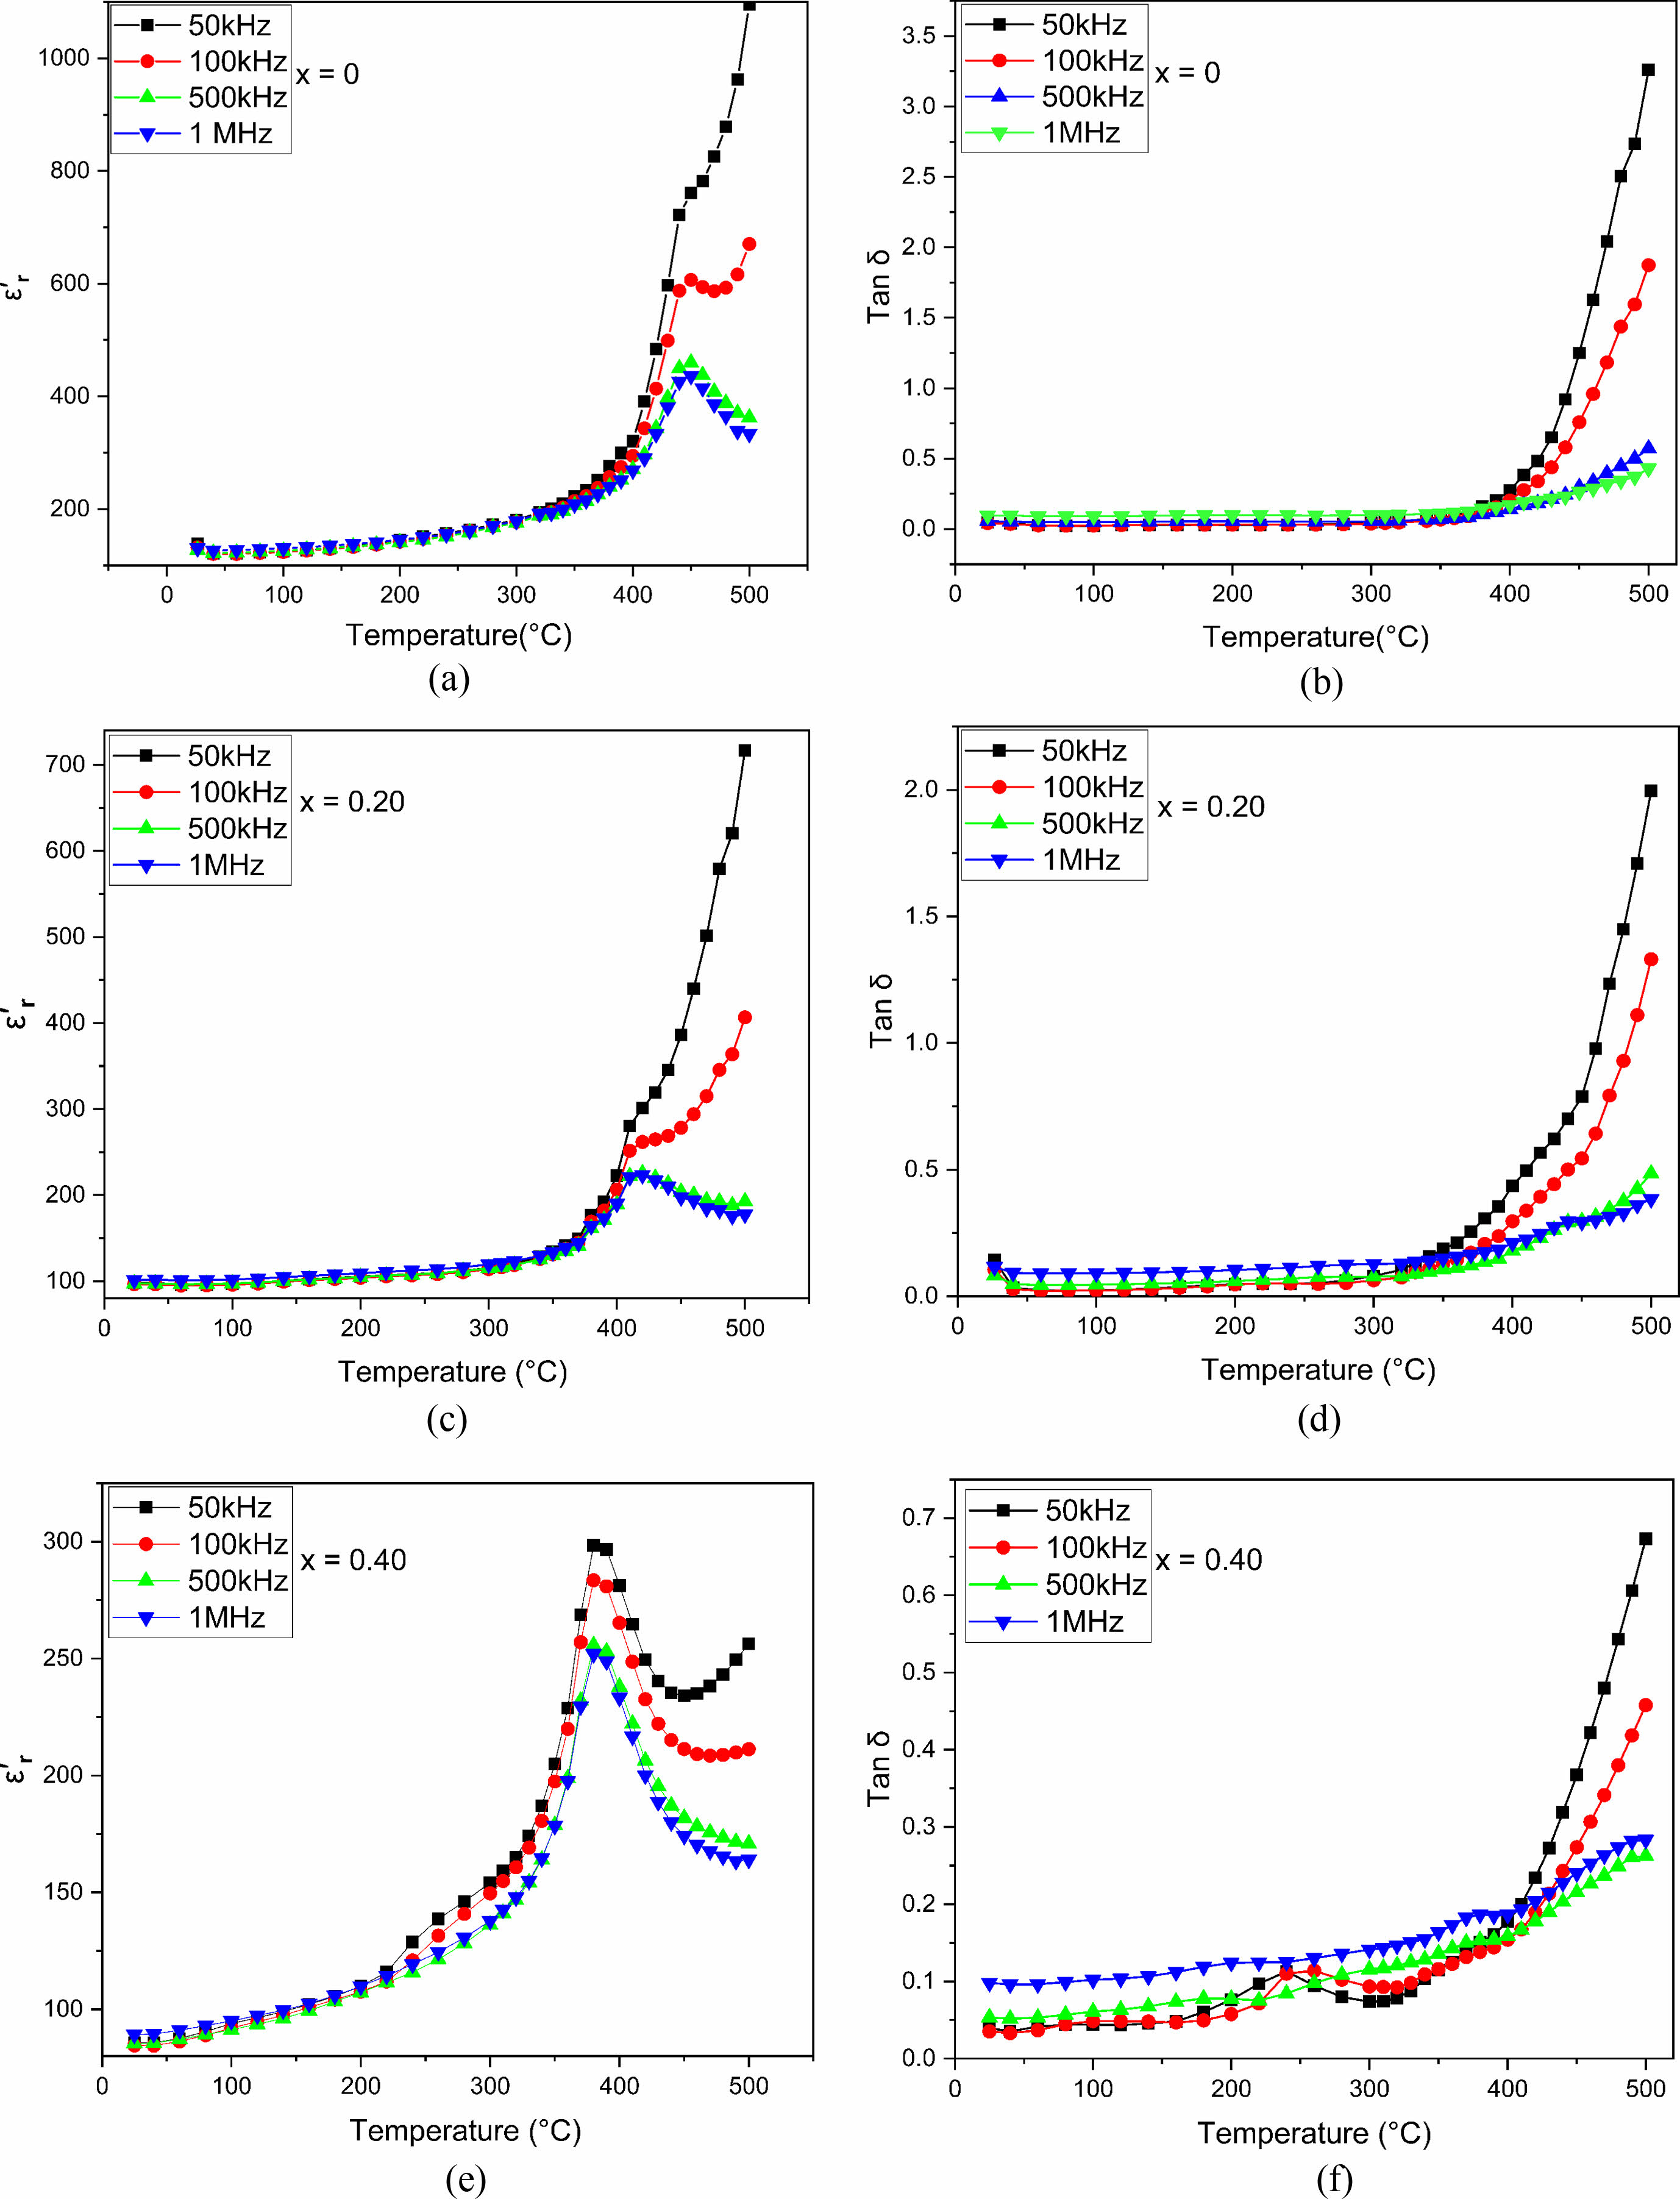
Tangent loss and dielectric constant are measured at different temperatures at frequencies between 50 kHz and 1 MHz, for the pure SrBi2Nb2O9 and Eu-doped SrBi2Nb2O9 composites (with x = 0, 0.20, 0.40) (Fig. 5) to examine the dielectric properties. The pure phase sample showed a distinct ferroelectric to paraelectric transition at a Curie's temperature value of about Tc = 450 °C, for which the dielectric constant is near ε'm= 436. In contrast, the phase transition of doped SBN is detected at a temperature of Tc = 415 °C with a dielectric permittivity that is equal to ε'm= 223 when x = 0.20 and Tc = 385 °C when ε'm= 219 for x = 0.40.
Those results agree with previous studies since the Tc decreased when increasing the percentage of europium doped as expected. These facts could be explained by relating to the quantity of europium in the composition due to which channels are created in the ferroelectric structure. This is the reason why the ceramic develops a conductivity aspect that reduces the Curie temperature. This noticed decrease can also be illustrated by the effect of ionic radii since it is equal to 0.90 Å for europium compared to 1.18 Å for bismuth. This difference caused a lattice distortion. As a result, the Curie temperature substantially decreased due to stress at the crystallite borders [17, 18, 26].
A decrease in the dielectric constant's behavior is noticed as well. To explain this trend, it is necessary to mention that the dielectric constant of a system includes the following types of polarization contributions [27].
- The existence of an electric field: the movements of anions and cations induce ionic polarization;
- Electronic polarization is engendered after the electron shell displacement;
- The charges present at the system interface generate space charge polarization apparition;
- A change in the direction of domains in the orientation of the external field was applied, leading to dipolar polarization.
From all the data above, and the XRD results (Fig. 1) indicating the shift in the peaks, it can be concluded that the lattice parameter changes of doped ceramics lead to a decrease in ionic polarization, which means a reduction in dielectric constant [14, 27]. It evolves in the reverse of the dielectric constant regarding tangent loss behavior. In other words, the tang delta increased when increasing europium content (Fig. 5), and this attitude becomes more pronounced when the temperature gets higher. The conduction in doped ceramics is behind the tangential delt increase [28, 29].
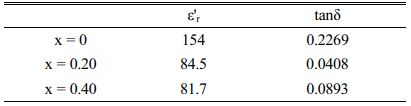
From Table 2, which shows a dielectric loss (tan δ) and dielectric constant (ε'r) of doped and undoped samples at room temperature, the variation of those parameters can be summarized as a function of doping content. In fact, the sample with x = 0 has a higher dielectric constant and loss (ε'r}, tan δ) than the europium doped samples, while SBN doped with 20% of europium presents the optimum behavior since tanδ decreased to 0.0408 whereas it reaches 0.2269 for SBN when measured at 1 MHz [30].
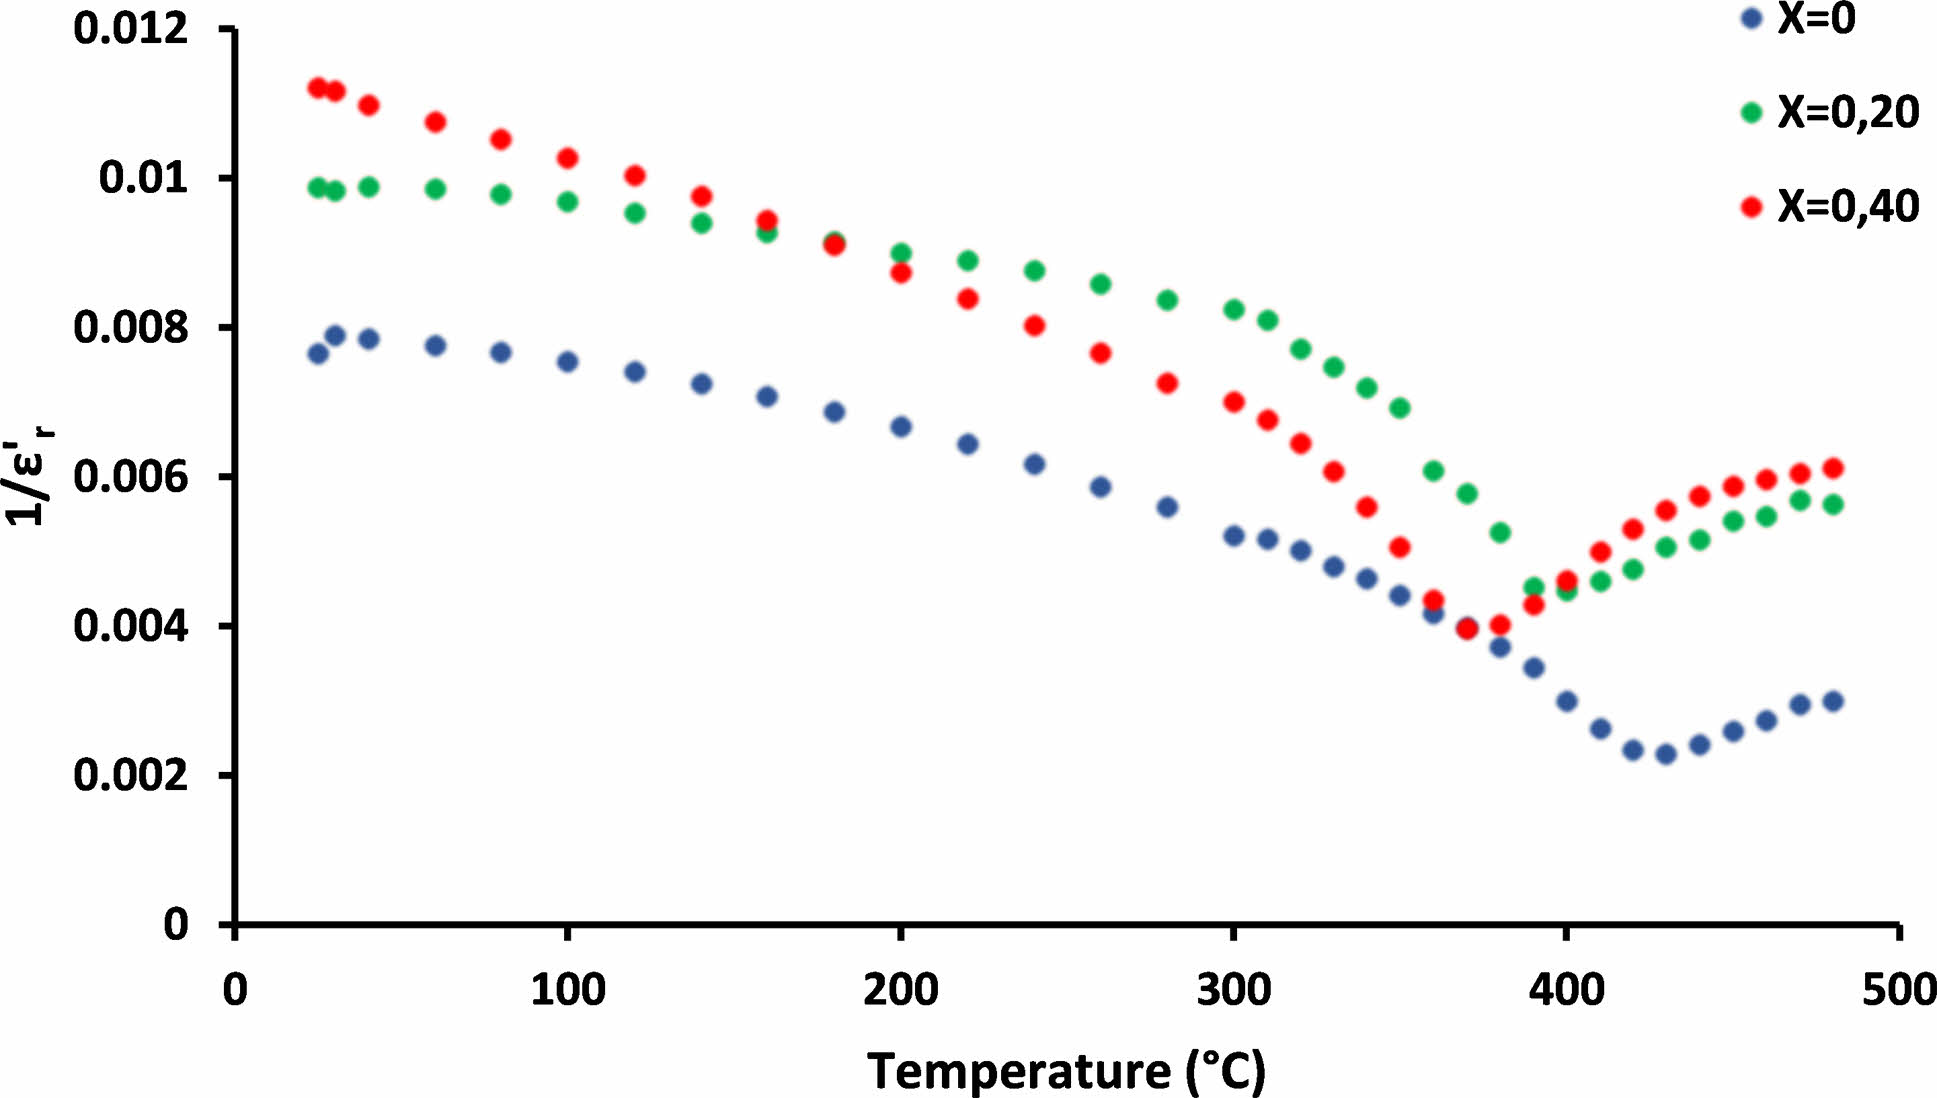
Fig. 6 shows the variation of the reciprocal dielectric constant (ε'r) of SrBi2−xEuxNb2O9 with the temperature at 100 MHz and confirms that the nature of ferroelectric-paraelectric transition in SrBi2−xEuxNb2O9 samples is of the first order.
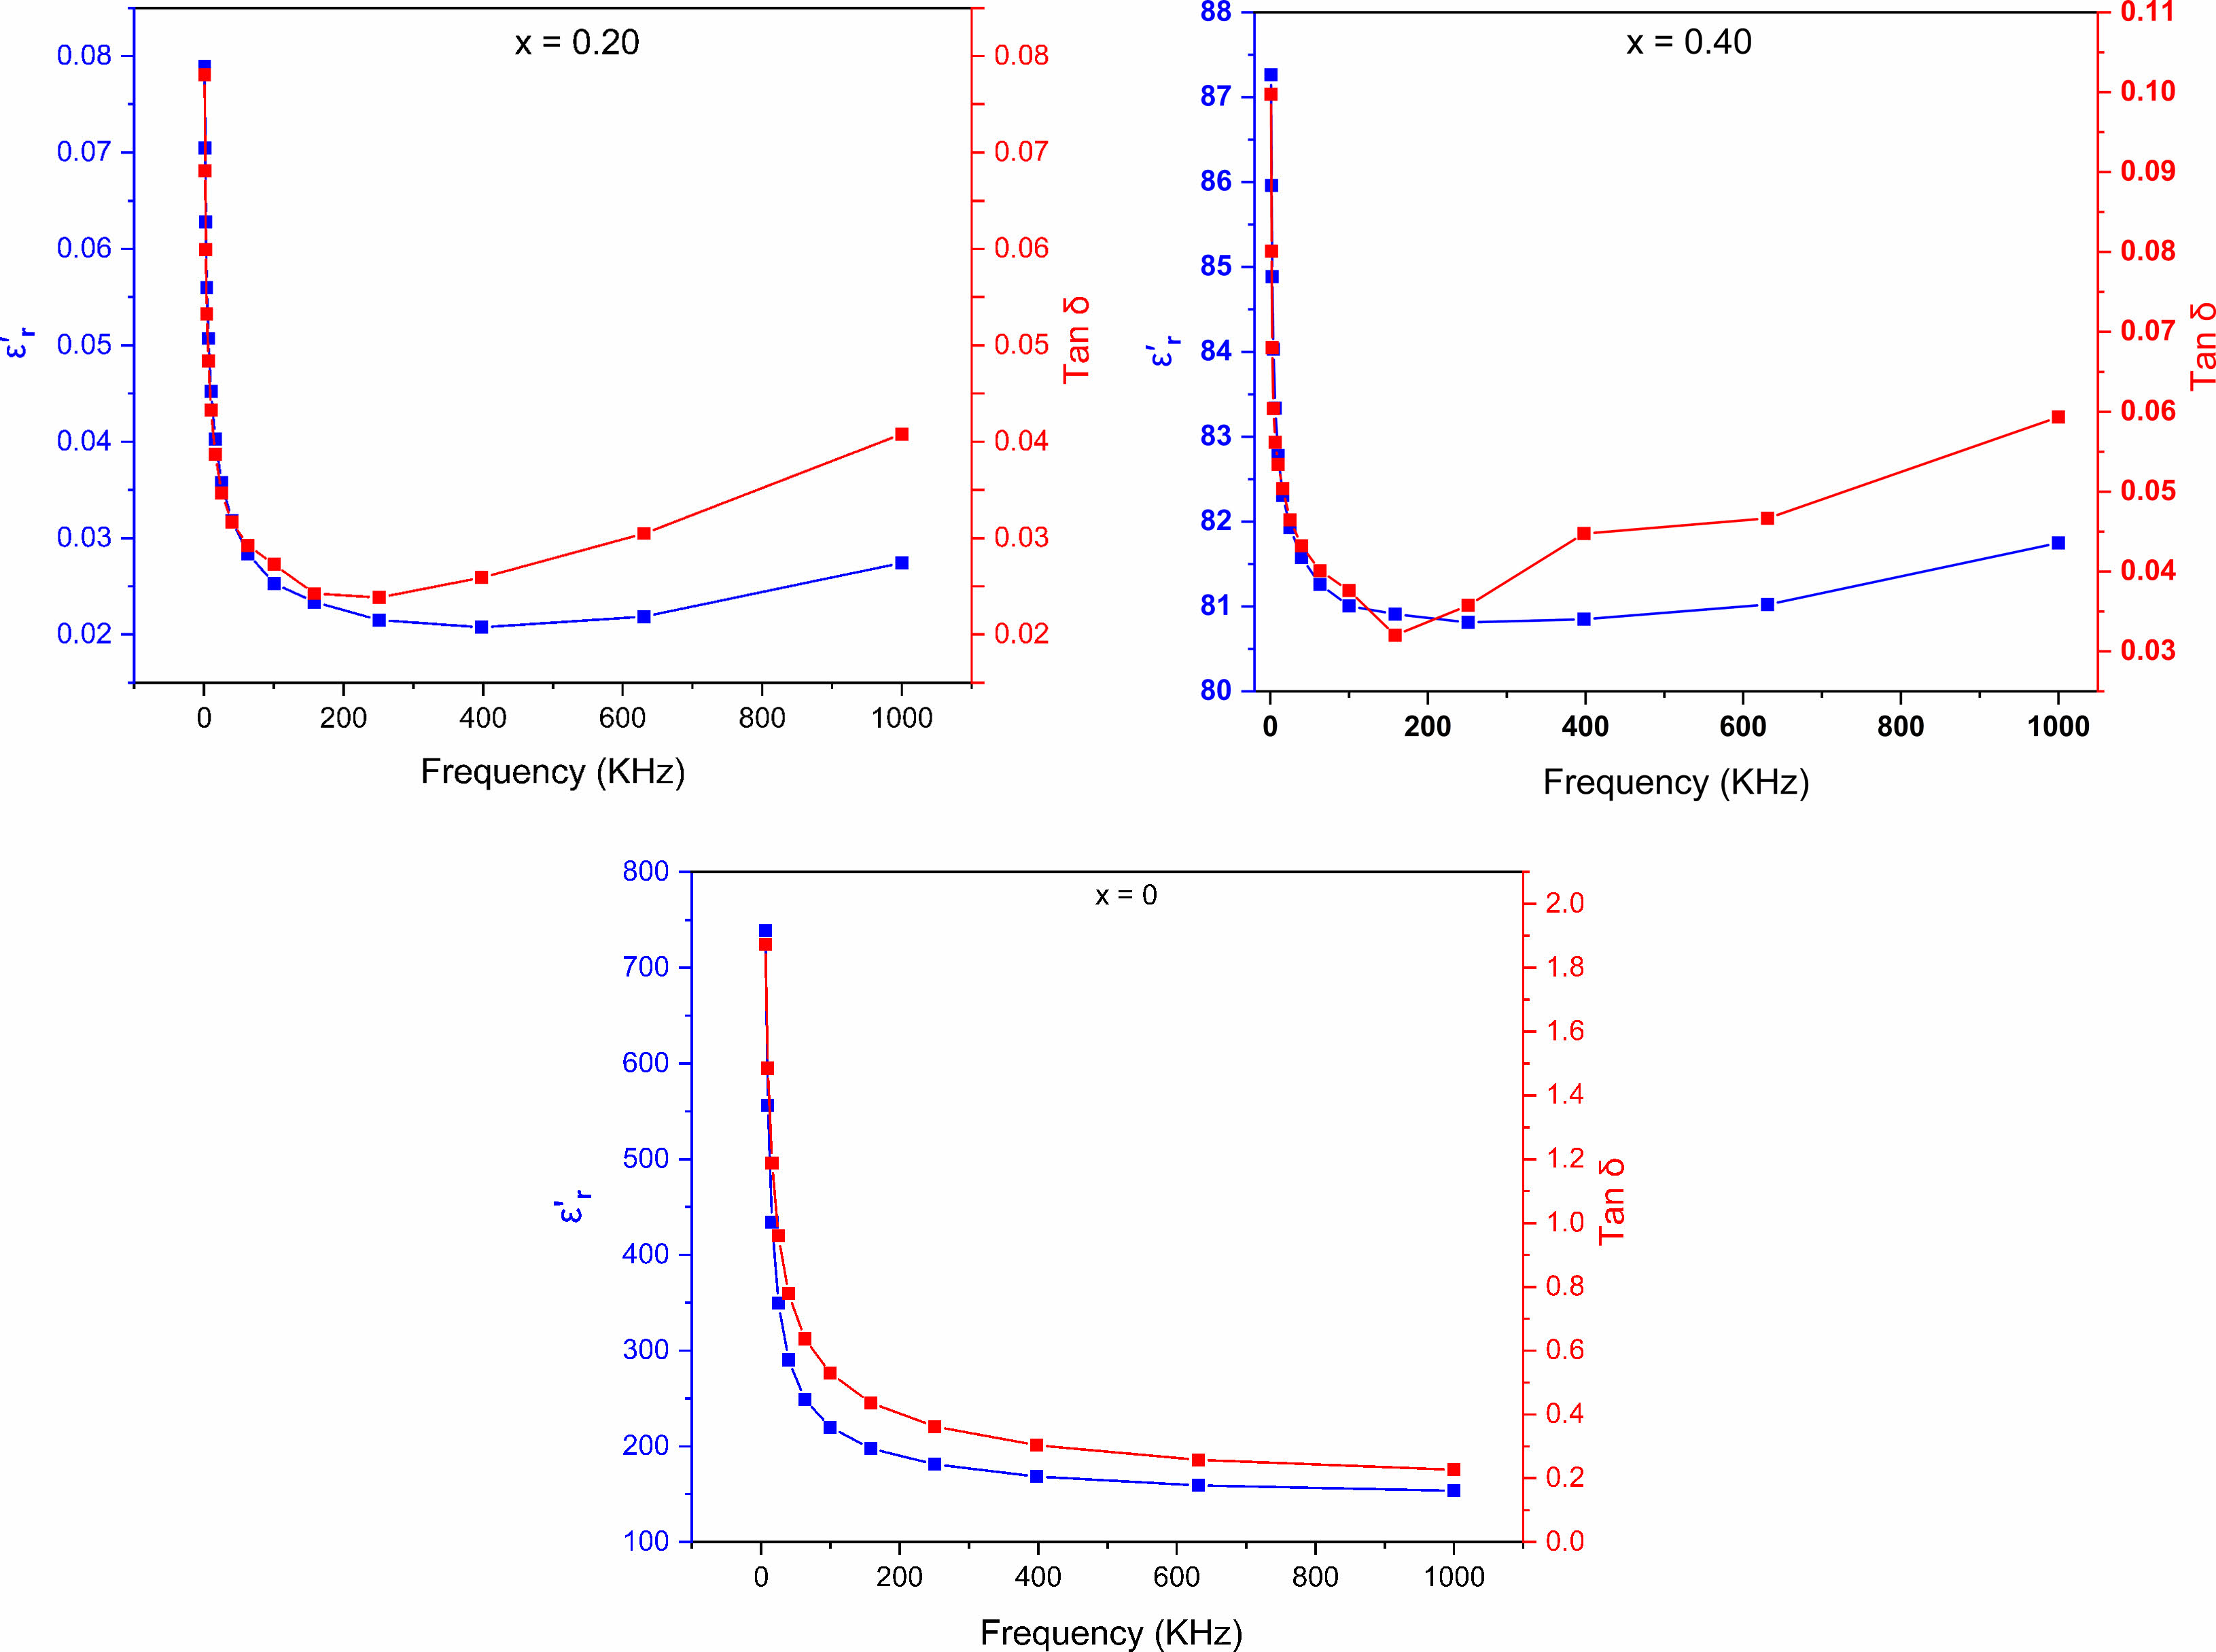
As a function of frequency in a range from 50 kHz to 1 MHz at room temperature, the fluctuation of dielectric loss (tan δ) and dielectric constant (ε'r) for SrBi2−xEuxNb2O9 (x=0, 0.20, 0.40) materials are shown in Fig. 7. A decrease in dielectric constant values for the synthesized samples when increasing the frequency was noticeable, whereas tanδ-plots showed similar behavior. It is known that the lowest dielectric loss accompanied by the plot's flattening of the dielectric constant at higher frequencies is advantageous in nonvolatile FeRAM materials and applications [30]. Hence, in this case, the dielectric permittivity and dielectric loss values increase when the Eu-doping increases before the ferroelectric–paraelectric phase conversion; likewise, the dielectric loss is reduced to 0.02 for x = 0.40 at 1 MHz.
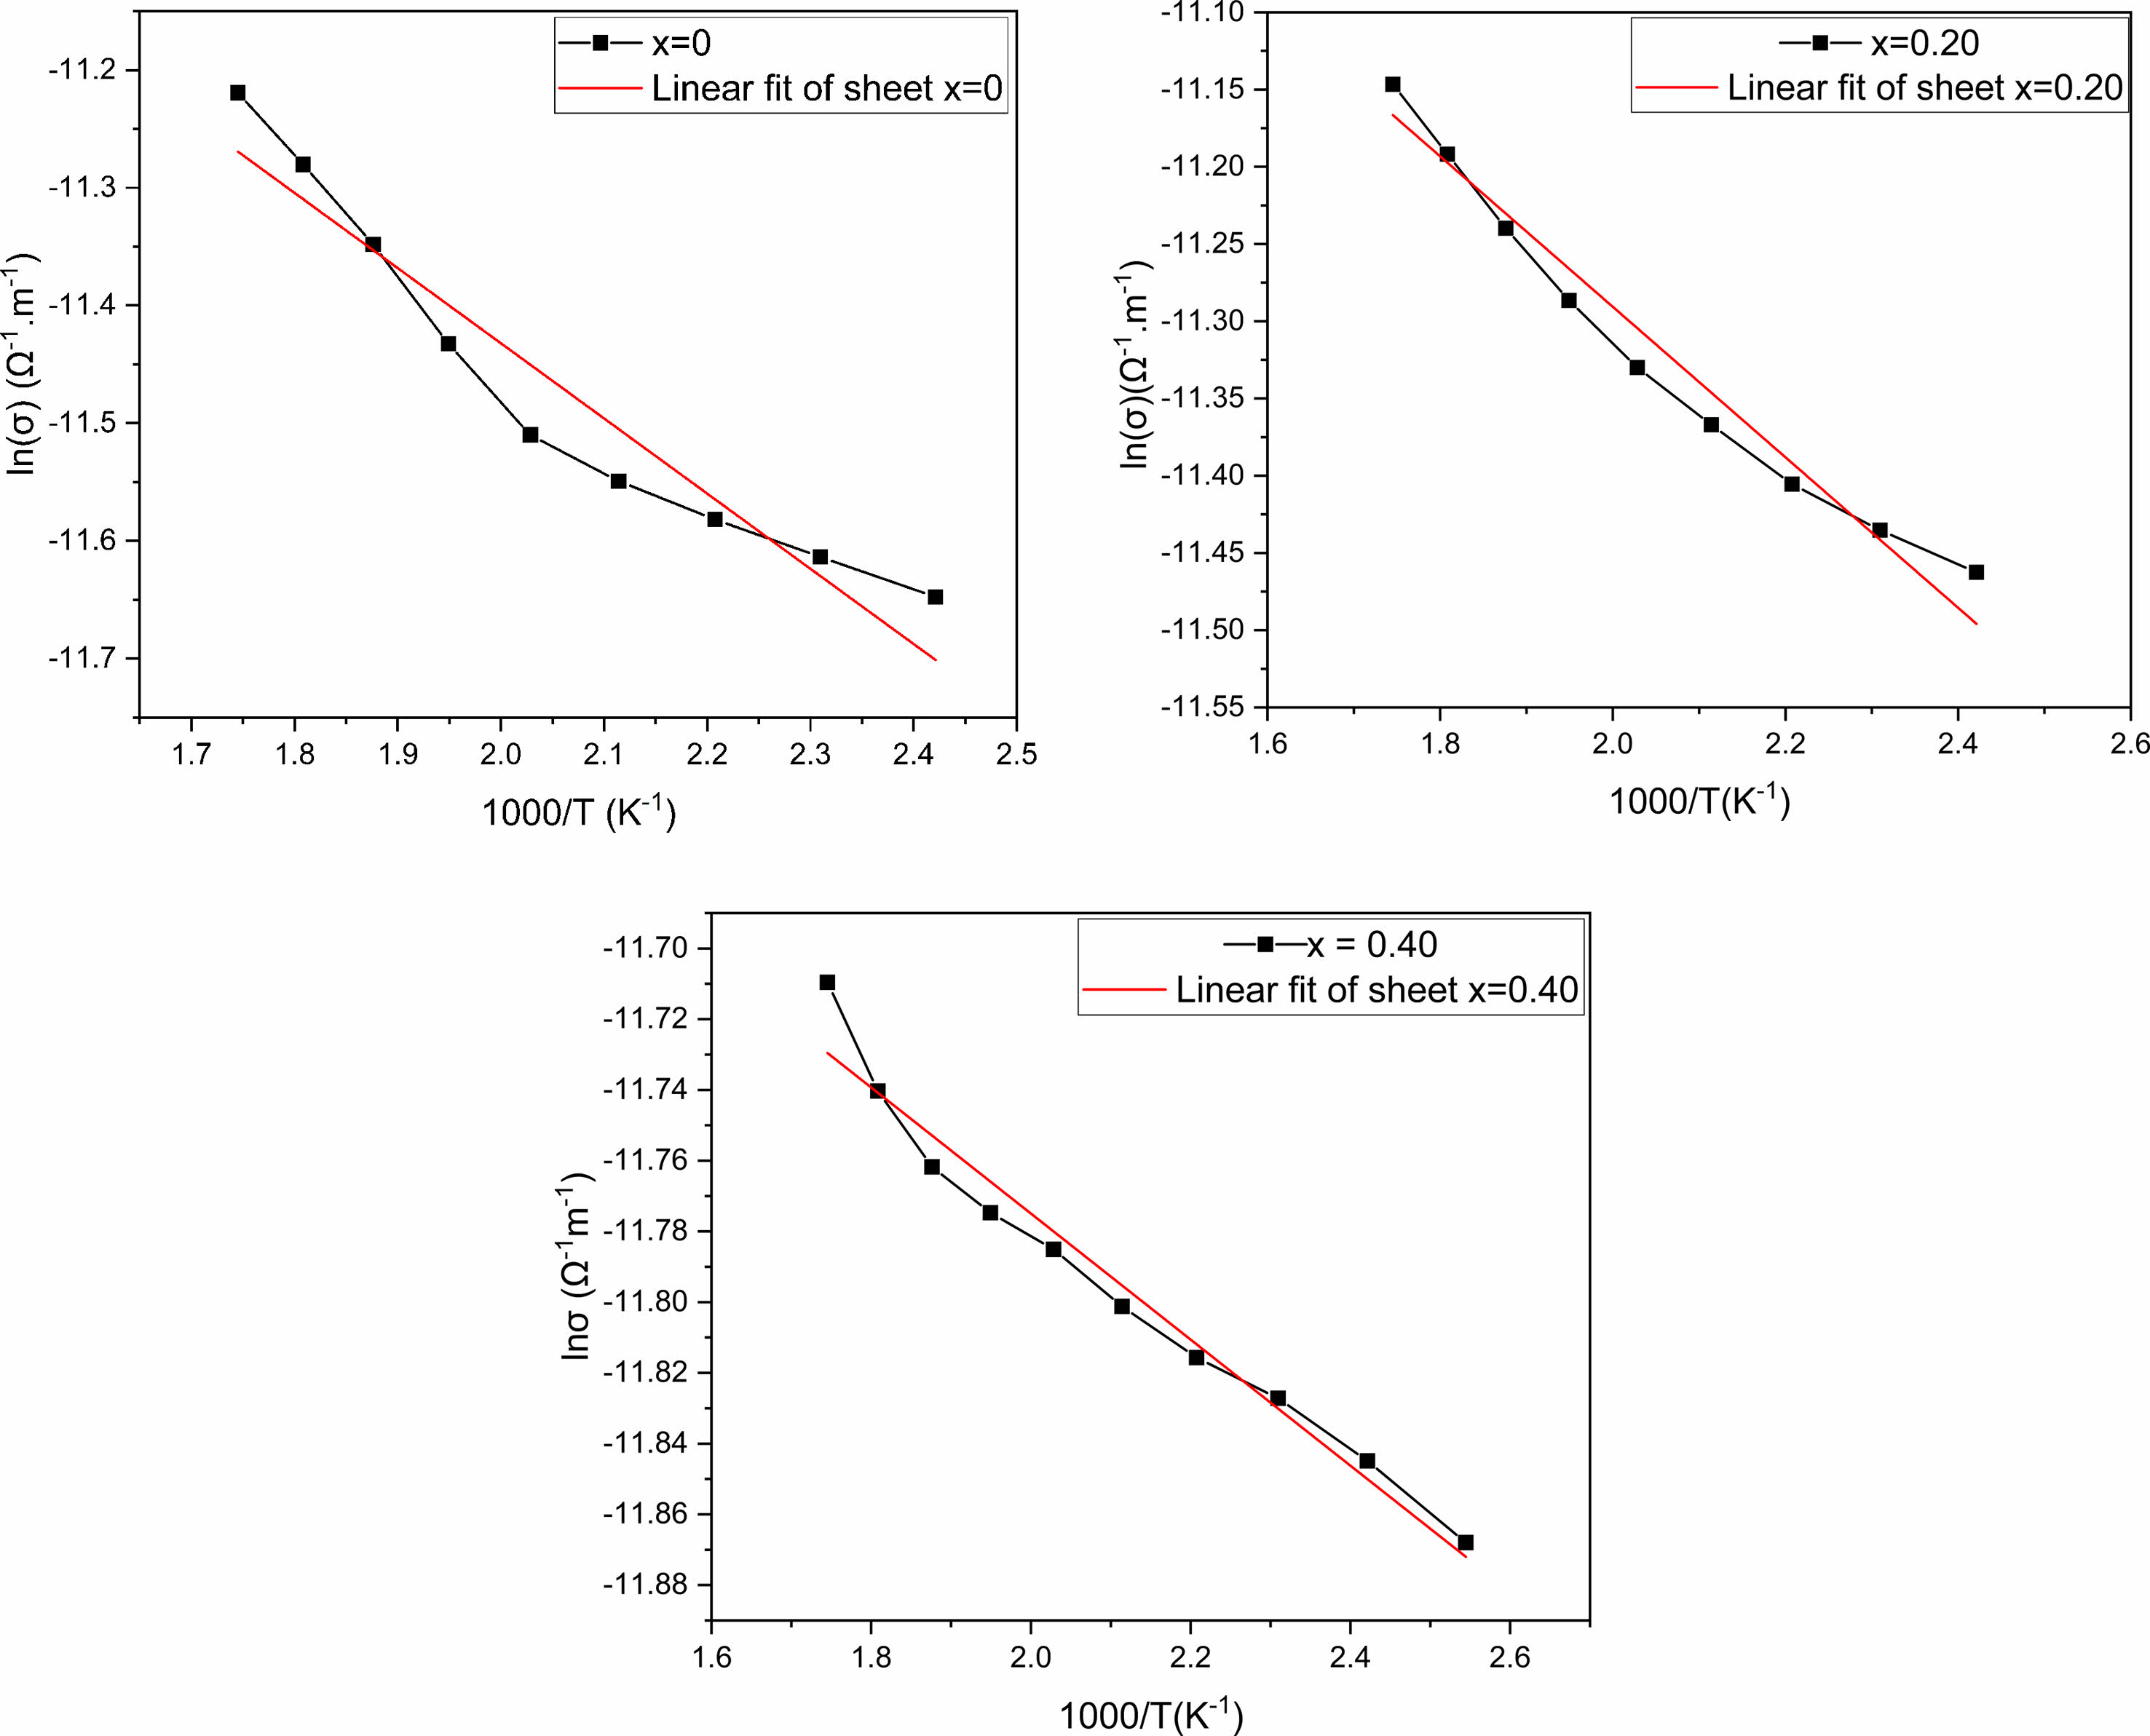
The inverse temperature dependence of ac conductivity at 100 kHz is shown in Fig. 8. In fact, electrical conduction (which is a thermal activation process) follows Arrhenius’s law below [31]:
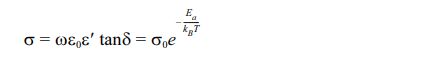
Where σ0, Ea, kB, and T are the pre-exponential factor, the conduction's activation energy, the constant of Boltzmann, and absolute temperature.
However, in the temperature region between 1.7 and 2.6. K-1, the slope of ln(σ) as a function of temperature (1000 × T-1), provides the conduction process's activation energy. Ea values are found, when measured at 100 kHz, to be 0.64, 0.48, and 0.18 eV for x = 0, x = 0.20 and x = 0.40, respectively. The considerable chemical band strength of Eu–O (799 kJ/mole), when compared to that of Bi–O (343 kJ/mole), might be the reason behind the observed decrease in the activation energy if the quantity of europium-doped increased. Otherwise, the conduction in SBN ceramics corresponds to the displacement of oxygen vacancies. Consequently, the volatilization of bismuth during the sintering process generates additional thermal energy, increasing the mobility of the charge carriers and their numbers [32].
|
Fig. 1 XRD patterns for SrBi2−xEuxNb2O9. |
|
Fig. 2 FTIR spectrum of SrBi2−xEuxNb2O9 ceramic powder. |
|
Fig. 3 Raman spectra of SrBi2−xEuxNb2O9 ceramic powder. |
|
Fig. 4 SEM images of SrBi2−xEuxNb2O9 ceramic. |
|
Fig. 5 Temperature-dependent a, b, c dielectric constant (εr') and d, e, f dielectric loss (tanδ) of SrBi2−xEuxNb2O9 ceramics. |
|
Fig. 6 Temperature dependency of 1/εr' of SrBi2−xEuxNb2O9 ceramics. |
|
Fig. 7 Frequency dependence of dielectric constant (εr') and dielectric loss (tanδ) at room temperature of SrBi2−xEuxNb2O9 ceramics. |
|
Fig. 8 Arrhenius plot for SrBi2−xEuxNb2O9 ceramics |
|
Table 2 Dielectric properties of SBN and SrBi2−xEuxNb2O9 ceramics at room temperature. |
In this work, SBN Eu-doped ceramics have been synthesized and investigated through solid-state reaction techniques. XRD, FTIR, and Raman results validated the phase formation of SrBi2Nb2O9 structure in various amounts of europium doped for bismuth sites, while SEM images showed the changes in surfaces and grain shape and size.
From the dielectric figures' profile, the Eu3+ doping in SrBi2Nb2O9 invoked the dielectric loss, dielectric constant, and curie temperature decrease. The decrease in curie temperature is associated with the global reduction of the tetragonal lattice strain. The fusion of Europium into the SrBi2Nb2O9 structure leaned to counterbalance charge carriers transmitting, contrariwise to pure SrBi2Nb2O9, which tend to suffer from crucial dielectric loss from volatilization of bismuth. Moreover, the doped ceramics’ behavior at both higher temperatures, as a classical ferroelectric phase, and room temperature as a stable material with low dielectric loss, refers to Eu-doped SrBi2Nb2O9 ceramics as suitable and promotor materials for FeRAM applications.
The authors declare no conflict of interest.
- 1. Y.D. Li, J.M. Chen, and Y.C. Lee, J. Ceram. Process. Res. 19[6] (2018) 461-466.
-

- 2. J.A. Bartkowska and D. Bochenek, Arch. Metall. Mater. 64 (2019) 221.
-
- 3. R.R. Souzaa, D. Thomazinib, M.V. Gelfusob, H. Amorínc, A.S. Pereirad, and V.C. Sousa, J. Ceram. Process. Res. 18[1] (2017) 73-78.
-
- 4. A. Moure, Appl. Sci. 8[1] (2018) 62.
-
- 5. M. Roknuzzaman, C. Zhang, K.K. Ostrikov, A. Du, H. Wang, L. Wang, and T. Tesfamichael, Sci. Rep. 9[1] (2019) 1-7.
-
- 6. K.M. Kima, S.H. Leea, B.J. Parka, J.S. Parkb, and S.G. Leea, J. Ceram. Process. Res. 23[1] (2022) 29-32.
-
- 7. F. Zhanga, C. Lic, H. Lic, X. Guob, and S. Fanb, J. Ceram. Process. Res. 19[2] (2018) 101-104.
-
- 8. P. Banerjee and A. Franco, Mater. Chem. Phys. 225 (2019) 213-218.
-
- 9. M. Afqir, A. Tachafine, D. Fasquelle, M. Elaatmani, J.C. Carru, and A. Zegzouti, J. Ceram. Sci. Technol. 9[2] (2018) 209-214.
- 10. I.N. Eshaa, Md. Al-Aminb, F.T.Z. Tomac, Enayet Hossaina, M.N.I. Khand, and Kazi Hanium Mariaa, J. Ceram. Process. Res. 20[5] (2019) 530-539.
-
- 11. Y. Wu, M.J. Forbess, S. Seraji, S.J. Limmer, T.P. Chou, C. Nguyen, and G. Cao, J. Appl. Phys. 90 (2001) 5296.
-
- 12. T. Wei, B. Jia, L. Shen, C. Zhao, L. Wu, and B. Zhang, J. Eur. Ceram. 40 (2012) 4153.
-
- 13. J.N. Kiran, K.S. Rao, H. Workineh, P. Prameelad, and K. Sowribabu, Trans. Ind. Ceram. Soc. 79[4] (2020) 202-211.
-
- 14. D. Dhak, S.K. Biswas, and P. Pramanik, J. Eur. Ceram. Soc. 26[16] (2006) 3717-3723.
-
- 15. T. Labbilta, M. Mesnaoui, H. Aouad, Y. Abouliatim, M. Khouloud, and L. Abielaala, Materials 13[11] (2020) 2637.
-
- 16. R.F Abreu, S.O. Saturno, and J.P. Do Nascimento, J. Electromagn. Waves Appl. 34[12] (2020) 1705-1718.
-
- 17. M. Afqir, A. Tachafine, D. Fasquelle, M. Elaatmani, J.C. Carru, A. Zegzouti, and M. Daoud, Appl. Phys. A. 124[1] (2018) 1-7.
-
- 18. P. Chaudhary, S. Dabas, M. Kumar, A. Kumar, and O.P. Thakur, Bull. Mater. Sci. 43[1] (2020) 1-12.
-
- 19. M. Said, T.S. Velayutham, and W.H. Abd Majid, Ceram. Int. 43[13] (2017) 9783-9789.
-
- 20. L. Cui, R. Niu, and W. Wang, J. Ceram. Process. Res. 23 [1] (2022) 57-61.
-
- 21. A. Ando, M. Kimura, T. Sawada, K. Hayashi, and Y. Sakabe, Ferroelectrics 268[1] (2002) 65-70.
-
- 22. J.N. Kiran, K.S. Rao, H. Workineh, P. Prameela, and K. Sowribabu, Trans. Indian Ceram. Soc. 79[4] (2020) 202-211.
-
- 23. M. Afqir, A. Tachafine, D. Fasquelle, M. Elaatmani, J.C. Carru, A. Zegzouti, and M. Daoud, Sci. Sinter. 51[4] (2019) 353.
- 24. T. Labbilta, M. Ait‐El‐Mokhtar, Y. Abouliatim, M. Khouloud, A. Meddich, and M. Mesnaoui, Molecules 26[13] (2021) 3928.
-
- 25. M. Afqir, A. Tachafine, D. Fasquelle, M. Elaatmani, J.C. Carru, A. Zegzouti, and M. Daoud, J. Electron. Mater. 47[7] (2018) 3398-3402.
-
- 26. I.N. Eshaa, Md. Al-Aminb, F.T.Z. Tomac, E. Hossaina, M.N.I. Khand, and K.H. Mariaa, J. Ceram. Process. Res. 20[5] (2019) 530-539.
-
- 27. Y. Tiana, S. Lia, B. Zhanga, Y. Gongb, P. Liua, X. Huc, and Q. Jinga, J. Ceram. Process. Res. 23[4] (2022) 430-435.
-
- 28. B.R. Kumar, N.V. Prasad, G. Prasad, and G.S. Kumar, Mater. Today Proc. 11 (2018) 1036.
- 29. H. Djani, A.C. Garcia-Castro, W.Y. Tong, P. Barone, E. Bousquet, S. Picozzi, and P. Ghosez, npj Quantum Mater. 4[1] (2019) 1-6.
-
- 30. L. Cui, R. Niu, and W. Wang, J. Ceram. Process. Res. 23[1] (2022) 57-61.
-
- 31. F. Zhanga, C. Lic, H. Lic, X. Guob, and S. Fanb, J. Ceram. Process. Res. 19[2] (2018) 101-104.
-
- 32. M. Afqir, A. Tachafine, D. Fasquelle, M. Elaatmani, J.C. Carru, A. Zegzouti, and M. Daoud, Process. Appl. Ceram. 13[3] (2019) 281-286.
-
- 33. M. Afqir, A. Tachafine, D. Fasquelle, M. Elaatmani, J.C. Carru, A. Zegzouti, and M. Daoud, Moscow Univ. Phys. Bull. 72[2] (2017) 196-202.
-
- 34. S. Rani, G. Naresh, and T.K. Mandal, Dalt. Trans. 49[5] (2020) 1433-1445.
-
 This Article
-
2023; 24(2): 222-229
Published on Apr 30, 2023
- 10.36410/jcpr.2023.24.2.222
- Received on Jul 8, 2022
- Revised on Sep 22, 2022
- Accepted on Nov 3, 2022
Services
- Abstract
introduction
materials and methods
results and discussion
conclusions
- Conflict of Interest
- References
- Full Text PDF
Shared
Correspondence to
- Anasser Imane
-
Laboratory of Materials Sciences and Processes Optimization, Chemistry Department, Faculty of Sciences Semlalia, Cadi Ayyad University, Marrakech 40000, Morocco
Tel : 00212637847136 - E-mail: anasser.imane@gmail.com
Clean-Energy Research Institute(CRI), Hanyang University, 222, Wangsimni-ro, Seongdong-gu, Seoul, 04763, Korea
E-mail: jcpr@hanyang.ac.kr