


- Optimization of RSW process parameters on tensile strength by taguchi method
S. Rajaa,*, K. Vigneshb, M. Ravikumarc and R. Sanjeevid
aDepartment of Mechanical Engineering, PSNA College of Engineering and Technology, Dindigul-624 622, Tamil Nadu, India
bDepartment of Mechanical Engineering, PSNA College of Engineering and Technology, Dindigul-624 622, Tamil Nadu, India
cDepartment of Mechanical Engineering, Bannari Amman Institute of Technology, Sathyamangalam-638 401, Tamil Nadu, India
dDepartment of Robotics and Automation, Dhanalakshmi Srinivasan Engineering College, Perambalur-621 212, Tamil Nadu, IndiaThis article is an open access article distributed under the terms of the Creative Commons Attribution Non-Commercial License (http://creativecommons.org/licenses/by-nc/4.0) which permits unrestricted non-commercial use, distribution, and reproduction in any medium, provided the original work is properly cited.
The aim of this research is to improve the Resistance Spot Welding (RSW) process characteristics of AISI SS316L joints on tensile shear load (TSL). The RSW process parameters like electrode diameter of 6mm to 8mm, welding current of 7 kA to 9 kA, heating cycle periods of 7 to 9 are selected. The 2 mm sheet thickness has been selected for the welding trials and tensile shear test has been involved for all the trials for the purpose of identifying the TSL. Taguchi optimization technique is used for design the experiment with the help of Minitab software. It is observed that maximum TSL of 16 kN is observed by setting the parameters at 6mm electrode diameter, 9 kA welding current and heating cycles of 9. The ANOVA table confirms that welding current majorly affects the quality of weld and all the trials are observed with interfacial failure
Keywords: Resistance spot welding, Dissimilar welded joints, Taguchi analysis, Welding strength and Tensile test
The RSW (Resistance spot welding) is the oldest joining process and currently the automobile industries are preferring this process to join variety of thin sheets because, this process can be easily automated and cost effective process [1, 2]. Generally, the combined sources like pressure, time and heat are involved in RSW joints. One of the main advantages of RSW is, it can be welded in short period of time and no filler rod is used [3]. Recently, dedicated spot welding machine or robots are used for spot welding [4]. Because high-performance joints and safety with reduced weight and cost are priorities in today's industries [5]. Spot weld joints, which are used in the assembly of automotive vehicle structures, have a five thousand-count capacity and offer reliability and safety [6].
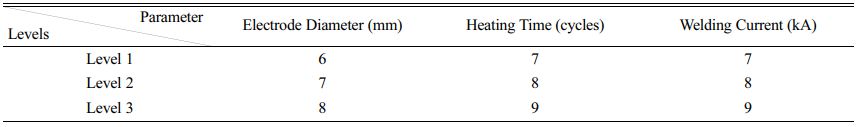
The factors determining the weld quality is process parameters. Adjusting the RSW process parameters good quality of weld can be achieved. But to achieve optimal weld process parameters more experiments has to be conducted in trial and error method. To limit the number of experiments, the Taguchi analysis is used to design the experiment. In this present study L9 orthogonal array is selected that is three levels such as welding current, heating cycles and electrode diameter and three factors i.e. three values for each factor.
Nugget formed in the RSW determines the quality of weld. Size and shape of the nugget depends on how much heat produced in the faying surface. But raising the heat continuously for long time increases the molten metal in the nugget formation leads to expulsion of the weld.
Using analytical and experimental techniques, Raoelison et al. investigated the dependability of spot-welded joints on zinc-coated SS [7]. The process variables, such as electrode force, holding time, current density, and welding time, were reported by Mousavi et al. [8]. They used Minitab to find the optimal condition for dissimilar metals and reported that current density is the most effective parameter and least is electrode force. The failure obtained in this study is pullout failure. According to Jong et al. [9] analysis of the mechanical behavior of intricate cold-rolled steel RSW joints, the diameter of the fracture had an impact on the pull-out failure mechanism. Shravan et al. [10] welded 1.6 mm thickness of interstitial free galvanized steel sheets by RSW method and reported that nugget growth can be estimated by the function of welding time (WT) and welding current (WC). Also reported that increasing the welding current in adequate weld range tensile shear strength increases. Alizadeh et al. [11] noticed that partial pullout mode initiates the pullout mode during tensile test in the ASS (austenitic stainless steel) and DSS (duplex stainless steel) joints produced by RSW process. Kim et al. [12] Optimized the welding parameters for TRIP steel and reduce the experimental trial using RSM (response surface methodology). Pashazadeh et al. [13] Utilized the multi objective genetic algorithm and artificial neural networks to identify the largest nugget. Jagesvar Verma et al. [14] have joined DSS 2205 and SS316L with the aid of shielded metal arc weld. Many researchers conducted several researches in austenitic stainless steel in different welding process. But optimization of process parameters of RSW for 316L weld ments is scarce. Due to the benefits of attractive appearance, good weldability and strong corrosion resistance, 316L stainless steel is used by many industries, including nuclear, chemical and aerospace [15, 16]. Examined the metallurgical and mechanical characteristics of the friction stir welding joint and utilized various process parameters to obtain optimal value of micro hardness and tensile strength [17]. The Friction Stir Welding Factors were successfully optimized using Genetic Algorithm. By changing the tool rotation speed, weld speed, and axial force, the stir cast hybrid composite AA7010-SiC-Al2O3 was welded by friction stir welding process. Regression analysis was performed and the tensile strength of the friction stir welded composite was investigated [18]. To achieve an acceptable value for the hardness and tensile strength, process variables including feed rate, axial force, and tool speed were taken into consideration. The process parameters for welding sheet metals made of the AA1100 alloy using friction stir welding are optimized in this work using grey relational analysis [19]. The process parameters for combining two distinct pairings of AISI 1020 and AISI 304 type steel together were productively optimized by means of resistance spot welding. The key welding process variables welding current, welding pressure and welding time were varied in experiments. The parameters of hardness, nugget diameter, and tensile shear fracture were investigated. Weld joint quality was assessed metallurgically and mechanically [20]. Following the successful production of the AA5052 aluminum alloy, the appropriate Friction stir welding process variables were examined. When determining the ideal level of welding parameters throughout the welding process, Taguchi analysis was efficiently used [21]. Researchers examined the mechanical, metallurgical, and impact of the micro structural features on friction stir welded MMC metal adopting various heat inputs. Therefore, in this study process parameters optimization for austenitic stainless steel SS316L has been conducted. For those purpose, process parameters that are electrode diameter, welding current and heating cycles has been identified for optimization.
Materials
ASS 316L with 2 mm thick sheets has been selected for the present study and the composition is shown in Table 1.
ASS have excellent corrosion resistance which preferred in automobile industries [22]. Samples with equal dimensions of 100 × 25 × 2 mm are prepared for welding.
Welding Process
The pedestal operated RSW machine having the current capacity of 50 kVA operated by microprocessor was selected. The parameters other than selected are shown in Table 2. Water cooled copper electrode was used for welding and temperature of the water was maintained at 25 oC during the experiment trials.
Tensile Test
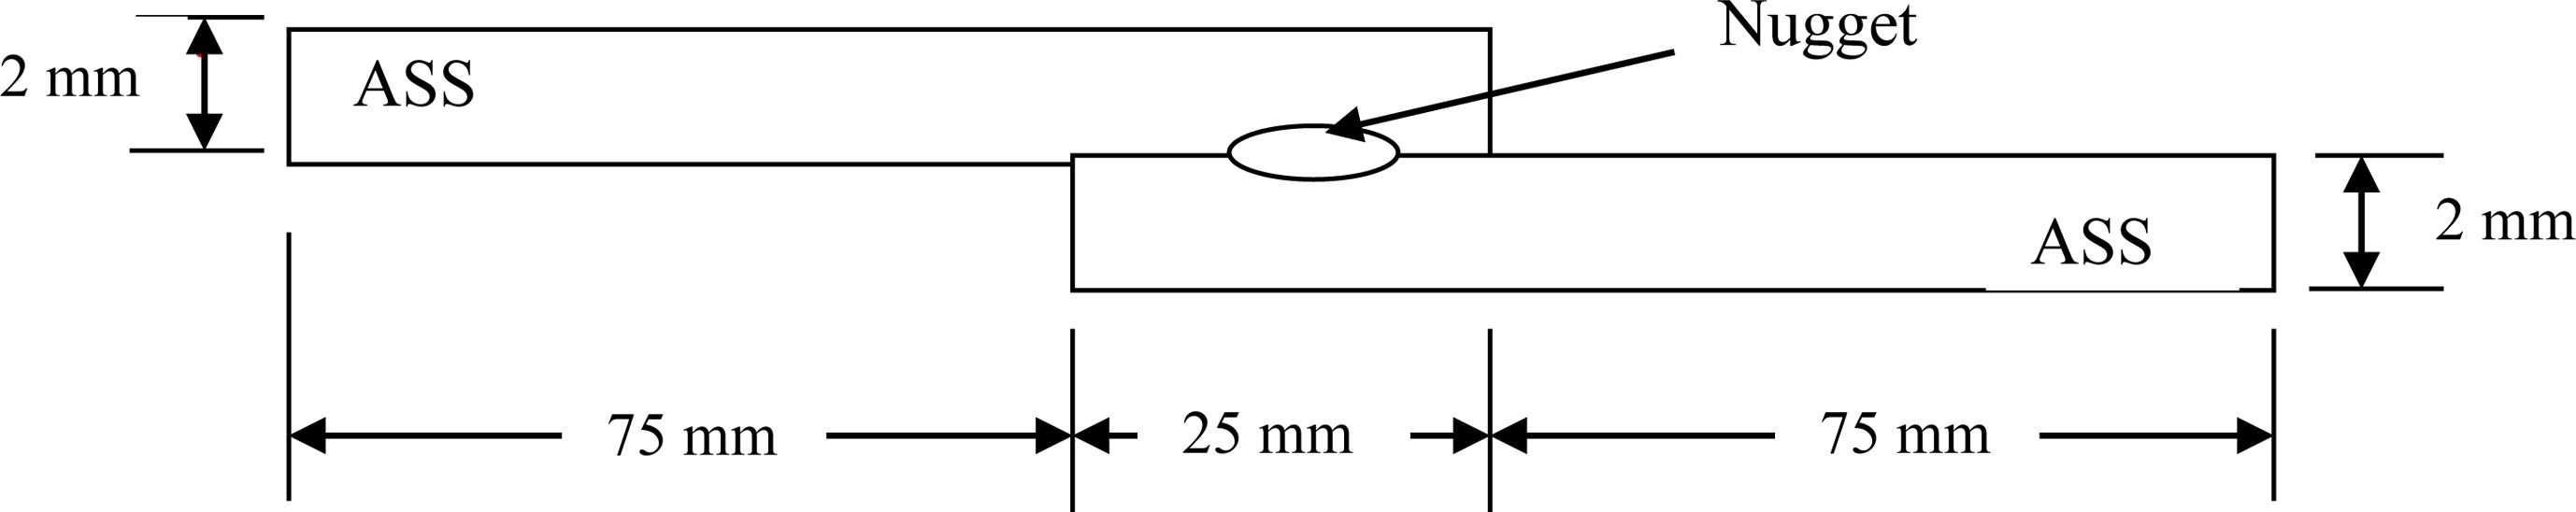
Tensile test samples were subjected to a controlled tension until failure. The tensile test samples for all joints were prepared in the following dimensions 100 × 25 × 2 mm. In this sample 25 mm lap is provided and joined in the middle of lap using Resistance spot welding machine. A 50 kN rated load capacity UTM machine Tinius Olsen make is used for the tensile shear test with 1 mm/min cross head movement. The schematic diagram of RSW lap joint configuration is shown in Fig. 1.
Taguchi Analysis
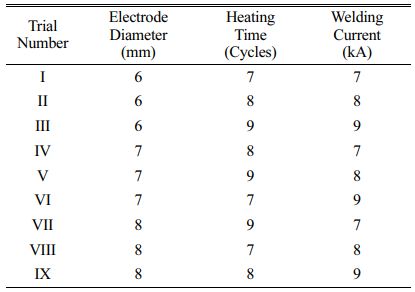
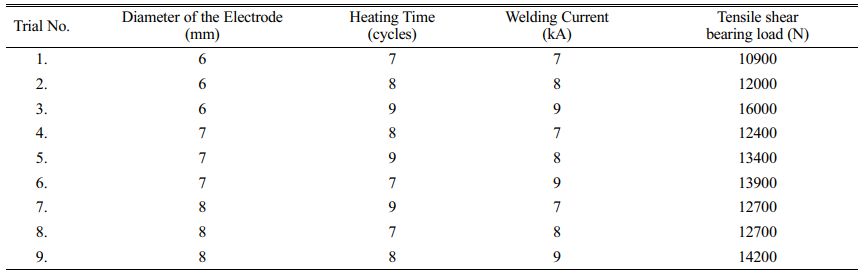
Taguchi method was utilized to get the optimal results with minimum trials. To design the orthogonal array experimental design matrix, three parameters are selected in which each parameter has three levels i.e. 33 (L9). The three parameters are welding current, electrode diameter, heating cycles. The values for three parameters and three levels are taken as shown in Table 3. The design of experiments was completed with aid of statistical tool minitab and depicted in Table 4.
|
Fig. 1 Lap joint configuration schematic diagram. |


Tensile shear load was used in this investigation as a response for the optimization, therefore ‘Larger the Better’ qualitative characteristic has been chosen. Because larger the tensile shear load define the good quality of weld. The experimental values for the TSL are shown in Table 5.
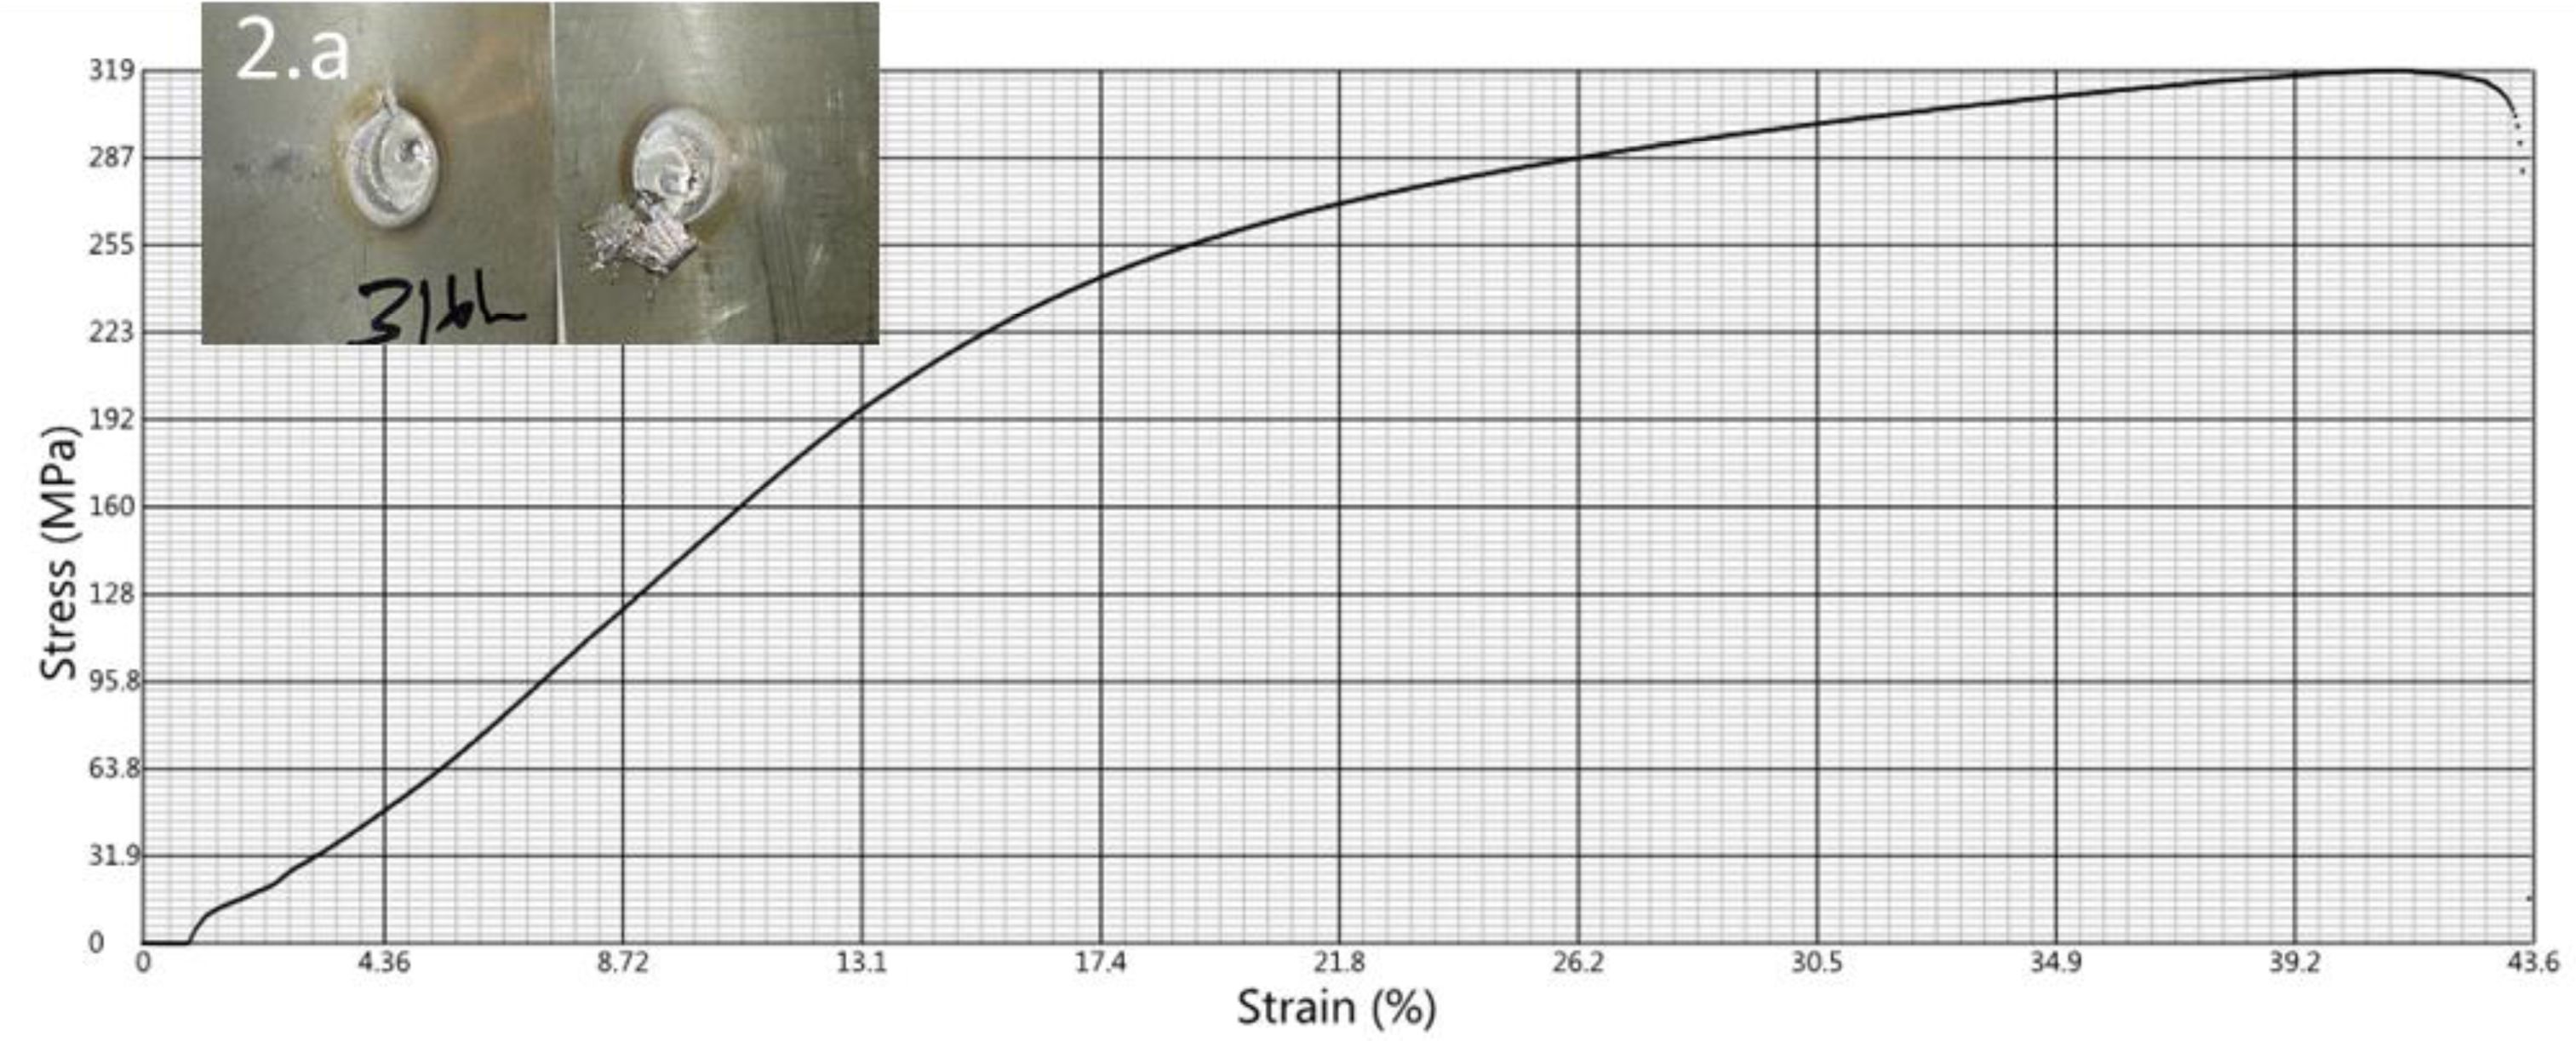
From the Table 5 it is observed that 16 kN is measured as the highest TSL for the ASS316L joints. Maximum TSL obtained when the Electrode diameter is 6 mm, Welding current is 9 kA and heating time is 9 cycles which is shown in trial number three. The stress strain graph and the data obtained for the maximum tensile load is shown in Fig. 2.
From the Table 6 it is observed that total elongation in percentage is 43.3% which confirms the ductile fracture.
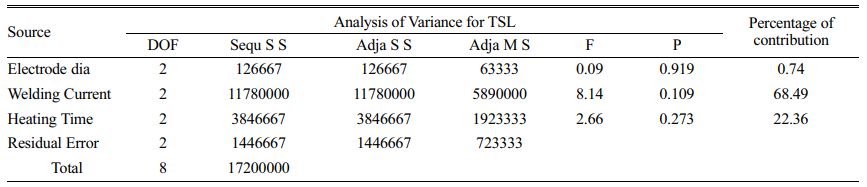
From the ANOVA (Analysis of Variance) for tensile shear load shown in Table 7 and it is inferred that WC is the supreme dictating factor which affects the quality of the weld.
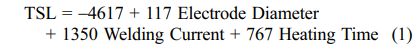
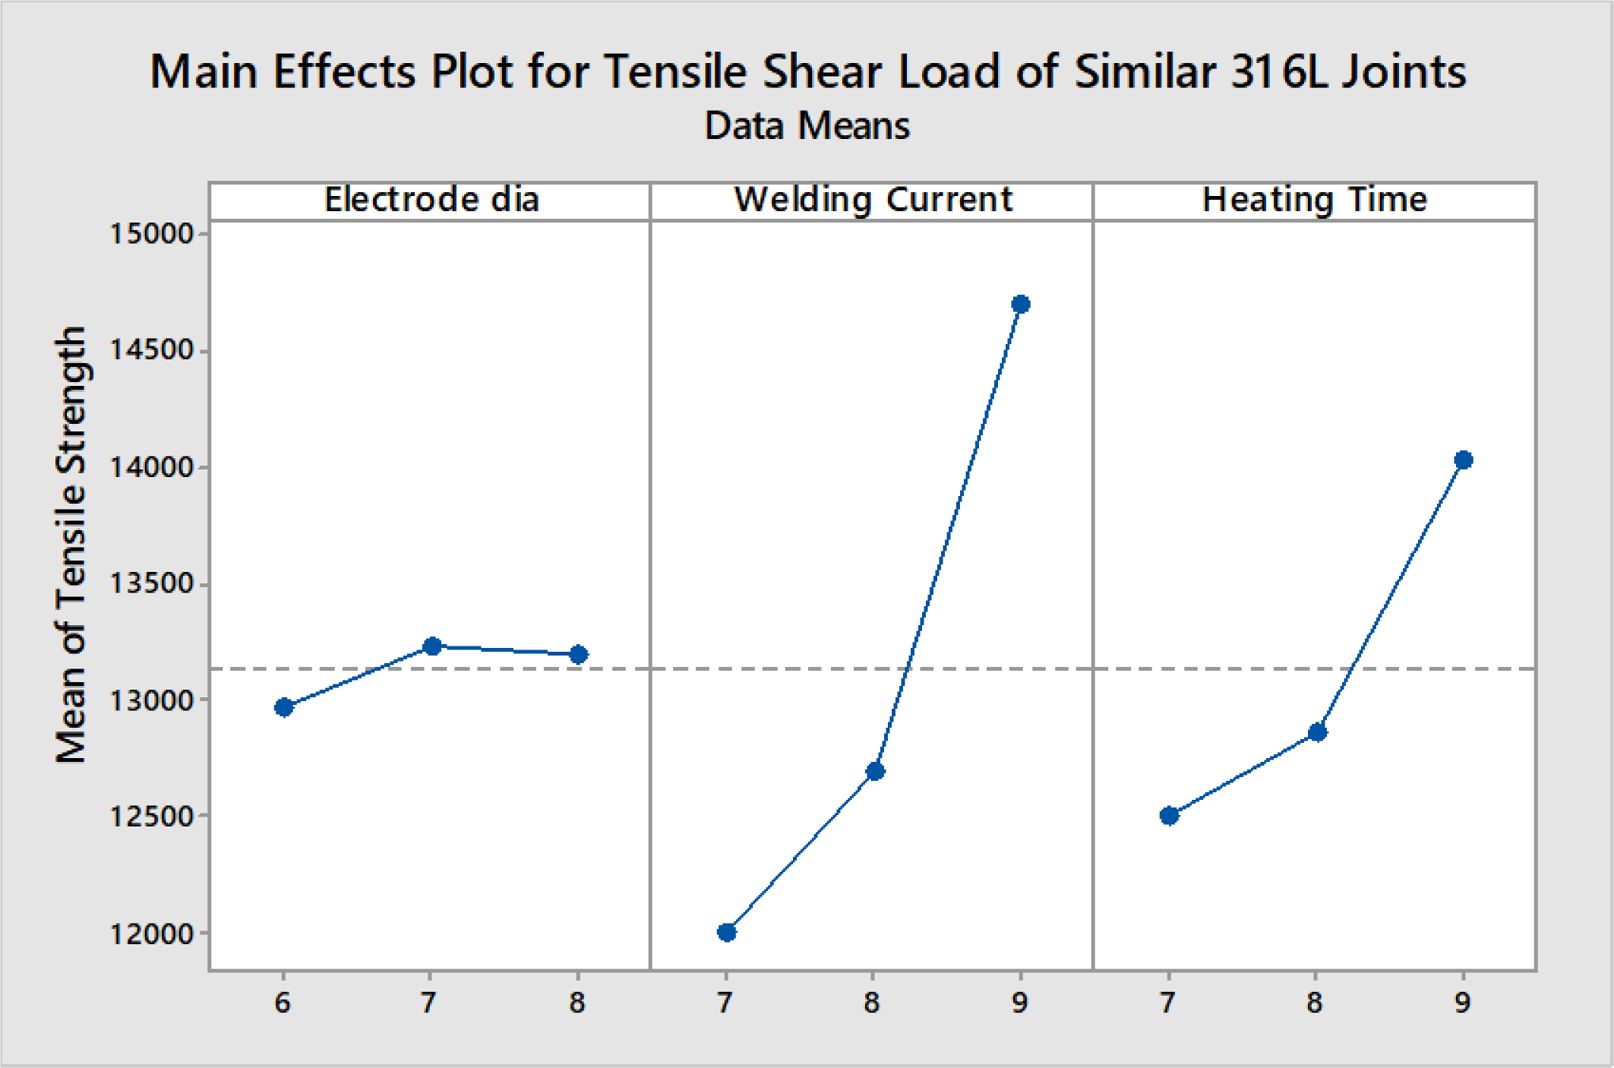
The main effect plot for S/N (Signal to Noise) ratio is shown in Fig. 2. According to Taguchi analysis highest S/N ratio deserves highest tensile strength. From the obtained S/N plot it can be seen that WC has highest S/N ratio, and electrode diameter is the least. Increasing the WC from 7 kA to 9 kA tensile shear bearing load also increased. In the similar way increasing heating time from 7 cycles to 9 cycles TSL also increased. When the electrode diameter is in 6 mm it results lower tensile load and increases with 7 mm diameter but again decreased with 8 mm diameter of electrode. The regression equation for the selected variables for TSL has been given in Eq. (1). Fig. 3
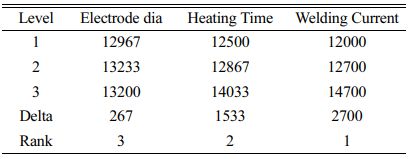
From the response table for tensile strength of SS316L similar joints shown in Table 8, welding current ranks first followed by heating time and third one is electrode diameter. It is understood that by adjusting the welding current quality of weld gets affected superiorly.
|
Fig. 2 Tensile Shear Load Graph for SS316L similar joint, (a) Fracture sample. |
|
Fig. 3 Main Effects Plot for Tensile Shear Load of Similar SS316L Joints. |

The AISI SS316L metal was properly welded using the resistance spot welding procedure, and the ideal process parameters were studied. The response to the process factors heating time, welding current time, and electrode diameter was selected to be the tensile shear strength. Taguchi route was taken on to attain the supreme process factors of the RSW. The results of the experimental examination into the impact of RSW process parameters are described below.
• Tensile strength is greatly affected by welding current, which is a strong influencing factor.
• Interfacial failure is obtained during tensile test.
• Maximum tensile shear load obtained for three different joints and respective parameters are shown in Table 9 below
• According to the ANOVA, the percentage of contribution shows that welding current contribute 68.49%, heating time contribute 22.36% and Electrode diameter contribute 0.74%
• The rank for various parameters are as follows 1. Welding current 2. Heating Time 3. Electrode diameter.

- 1. .A. Soomro, S.R. Pedapati, and M. Awang, Int. J. Adv. Manuf. Technol. 118[5] (2022) 1335-1366.
-

- 2. Kang Zhou and Ping Yao, Mech. Syst. Signal Process. 124[1] (2019) 170-198.
-
- 3. K. Vignesh, A. Elaya Perumal, and P. Velmurugan, Int. J. Adv. Manuf. Technol. 93[1] (2017) 455-465.
-
- 4. H.K. Banga, P. Kalra, R. Kumar, S. Singh, and C.I. Pruncu, J. Adv. Manuf. Process. 3[3] (2021) e10084.
-
- 5. M. Syvertsen, T. Ludwig, S. Rist, and K. Ellingsen, "Use of Incinerator Bottom Ash (IBA) in Aluminium Recycling BT-Light Metals 2022" (Springer International Publishing, 2022) p.1051-1055.
-
- 6. S. Yaacoubi, F. Dahmene, M. Mountassir, and A.E. Bouzenad, Int. J. Adv. Manuf. Technol. 117[1] (2021) 1807-1824.
-
- 7. R.N. Raoelison, A. Fuentes, C. Pouvreau, Ph. Rogeon, P. Carré, and F. Dechalotte, Appl. Math. Model. 38[9-10] (2014) 2505-2521.
-
- 8. S.H. Mousavi Anijdan, M. Sabzi, M. Ghobeiti-Hasab, and A. Roshan-Ghiyas, Mater. Sci. Eng: A. 726[1] (2018) 120-125.
-
- 9. J.P. Kong, T.K. Han, K.G. Chin, B.G. Park, and C.Y. Kang, Mater. Des. 54[1] (2014) 598-609.
-
- 10. S.S. Rao, R. Chhibber, K.S. Arora, and M. Shome, J. Mater. Process. Technol. 246[1] (2017) 252-261.
-
- 11. M. Alizadeh-Sh and S.P.H. Marashi, J. Manuf. Process. 28[1] (2017) 186-96.
-
- 12. T. Kim, H. Park, and S. Rhee, Int. J. Prod. Res. 43[1] (2005) 4643-4657.
-
- 13. H. Pashazadeh, Y. Gheisari, and M. Hamedi, J. Intell. Manuf. 27[1] (2016) 549-559.
-
- 14. J. Verma, R.V. Taiwade, R.K. Khatirkar, S.G. Sapate, and A.D. Gaikwad, Trans. Indian. Inst. Met. 70[1] (2017) 225-237.
-
- 15. H. Li, Y. Hu, R. Di, R. Yuan, C. Shi, and J. Lei, Ceram. Int 48[14] (2022) 20388-99.
-
- 16. P. Muthurasu and M. Kathiresan, J. Ceram Process. Res. 22[6] (2021) 697-704.
-
- 17. P. Gopi Krishnan, B. Suresh Babu, and K. Siva, J. Ceram. Process. Res. Res. 21[2] (2020) 157-163.
-
- 18. R. Thirumalai, S. Karthick, and M. Giriraj, J. Ceram. Process. Res. Res. 23[2] (2022) 221-227.
-
- 19. K. Mathi, G.R. Jinu, G. Karthikeyan, and A. Elaya Perumal, J. Ceram. Process. Res. Res. 21[1] (2020) 26-34.
-
- 20. C. Chanakyana and S. Sivasankar, J. Ceram. Process. Res. Res. 21[6] (2020) 647-655.
-
- 21. R. Pandiyarajan and M.P. Prabakaran, J. Ceram. Process. Res. 21[6] (2020) 690-698.
-
- 22. V. Krishnan, E. Ayyasamy, and V. Paramasivam. Proc. Inst. Mech. Eng. Part E J. Process. Mech. Eng. 235[1] (2020) 12-23.
-
 This Article
-
2023; 24(1): 153-157
Published on Feb 28, 2023
- 10.36410/jcpr.2023.24.1.153
- Received on Aug 3, 2022
- Revised on Aug 27, 2022
- Accepted on Sep 26, 2022
Services
Shared
Correspondence to
- S. Raja
-
Department of Mechanical Engineering, PSNA College of Engineering and Technology, Dindigul-624 622, Tamil Nadu, India
Tel/Fax: +91-9894547730 - E-mail: maduraisraja@gmail.com
Clean-Energy Research Institute(CRI), Hanyang University, 222, Wangsimni-ro, Seongdong-gu, Seoul, 04763, Korea
E-mail: jcpr@hanyang.ac.kr