


- Effect of the sintering temperature on the carbonization behaviour of woodceramics from the cashew nut shell waste
Kieu Do Trung Kiena,b,* and Do Quang Minha,b
aDepartment of Silicate Materials, Faculty of Materials Technology, Ho Chi Minh City University of Technology (HCMUT), 268 Ly Thuong Kiet Street, District 10, Ho Chi Minh City, Vietnam
bVietnam National University Ho Chi Minh City, Linh Trung Ward, Thu Duc City, Ho Chi Minh City, VietnamThis article is an open access article distributed under the terms of the Creative Commons Attribution Non-Commercial License (http://creativecommons.org/licenses/by-nc/4.0) which permits unrestricted non-commercial use, distribution, and reproduction in any medium, provided the original work is properly cited.
Woodceramics is carbon ceramics with porous structures that can be used in many technical fields. In this study, woodceramics was prepared by mixing cashew nut shell waste (CNSW) and liquefied wood with a ratio of 1/0.6 and then sintered in an inert atmosphere at 700 oC-1200 oC. The influence of sintering temperature on the carbonization behavior of formed woodceramics was determined by X-ray diffraction, Fourier transforms infrared spectroscopy, Isotope Ratio Mass Spectrometry measurement, and Scanning Electron Microscope/ Energy Dispersive X-Ray Analysis techniques. The experimental results showed that the carbon content increased when the sintering temperature increased. In addition to the increased carbon content, the degree of graphitization of woodceramics also increased. It is represented by an increased intensity of the (002) peaks and a decrease in the d002 value on the X-ray diffraction patterns. The SEM/EDX results also showed that appeared small graphite particles in the amorphous background at 1000 oC-1200 oC. However, the d002 value of the samples is only in the range of 0.3339-0.4094 nm, so the structure of the formed carbon is a non-graphite structure
Keywords: Woodceramics, Cashew nut shell waste, Carbon materials
Waste pollution and carbon dioxide emission have been serious global for the environment. Therefore, reducing emissions is a matter of concern in over the world. Recently, materials that are synthesized through biological structures have been interested [1, 2]. One of the biological materials is wood which the cellulose, hemicellulose and lignin from the cellular microstructures [3]. When wood is burned at high temperatures it is decomposed into carbon and gases. This decomposition will create a carbon material from the wood template.
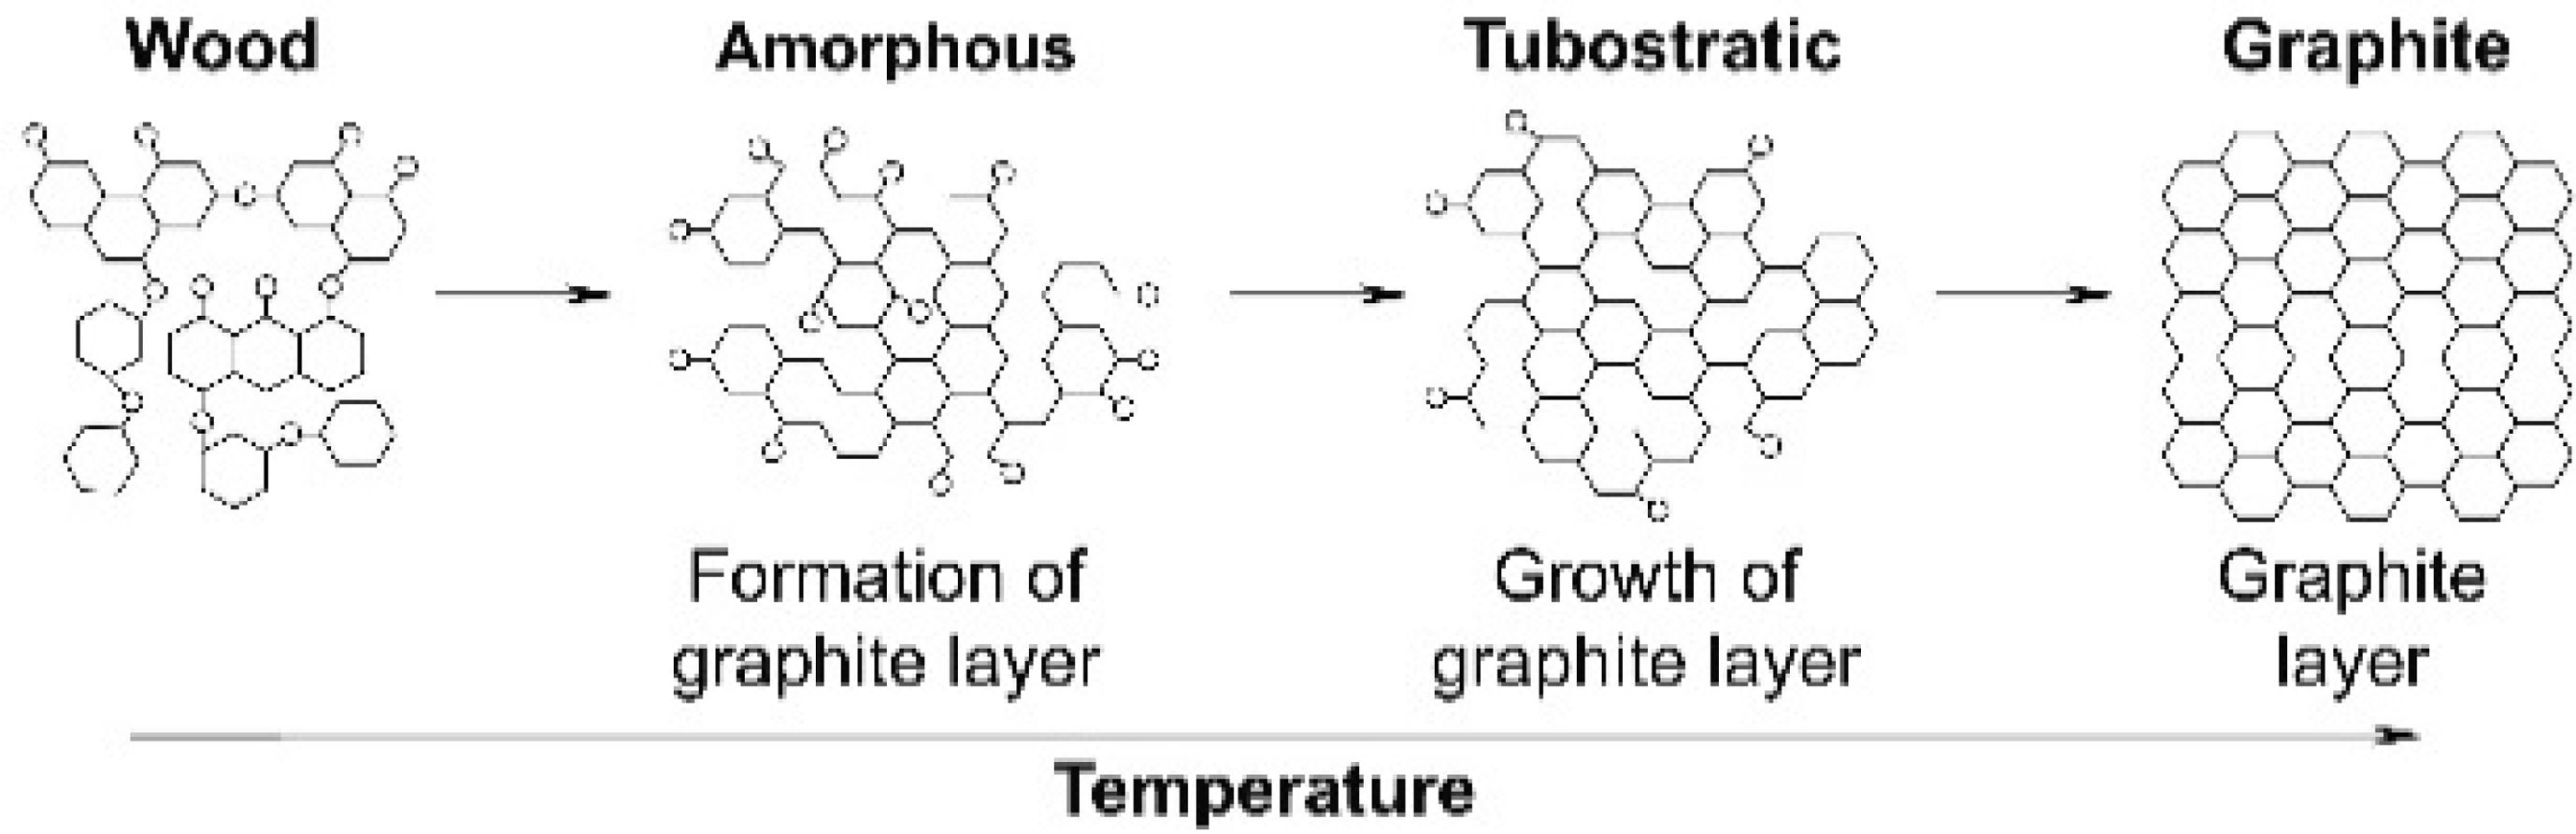
Woodceramics is a new carbon material with three kinds of structures: amorphous, turbostratic, and graphite (Fig. 1) [4]. It is usually produced by sintering from wood and resin (phenolic resin or liquefied wood) under an inner environment at a high temperature of 800 oC-3000 oC [4, 5]. It was invented by Prof. Toshihiro Okabe in 1992 [6]. This material has properties such as electromagnetic shielding [7], gas adsorption [8], radiation heating from far infrared rays [9], resistance to depend on humidity [10], friction and wears [11], etc. Therefore, woodceramics can be applied in many fields.
The applications of woodceramics depend on properties such as porosity and degree of graphitization. The porosity (including porosity number and pore morphology) of woodceramics depends on the structural form of the wood materials, the binder resin, and the carbonization temperature. Meanwhile, the degree of graphitization of woodceramics mainly depends on the carbonization temperature. When the carbonization temperature is high, woodceramics has a high degree of graphitization and good electrical conductivity so that it can be used as a burner for furnaces [12]. In contrast, woodceramics has low degree of graphitization at low temperatures and is often used as heat-resistant materials, insulation materials, electromagnetic wave shielding materials, etc [13].
The degree of graphitization of woodceramics is evaluated by parameters such as d002 (interlayer spacing between neighboring layers), Lc (thickness along the c-axis), and La (lateral size of the layers). The d002 is the value commonly used to quickly assess the degree of graphitization. For highly crystalline graphite, the d002 value is 0.3354 nm; for amorphous carbon, the d002 value is usually greater than 0.344 nm [14]. Graphitization also occurs at the same time as carbonization. Therefore, besides parameters such as d002, La, and Lc, the carbon content of woodceramics is also a value that reflects its graphitization ability. As the carbonization temperature increased, the carbon content increased similarly to the degree of graphitization. Therefore, assessing the carbon content and the degree of graphitization is important to indicate the applicability of woodceramics products.
In this paper, woodceramics was prepared from CNSW and liquefied wood. And the carbonization behaviour of woodceramics at different sintering temperatures was determined by X-ray diffraction (XRD) and Fourier transform infrared spectroscopy (FT-IR), Isotope Ratio Mass Spectrometry measurement (IRMS), Scanning Electron Microscope (SEM) and Electron probe micro-analyzer (WDX) methods.
|
Fig. 1 Scheme of structure and state of residues during sintering. |
Material preparation
CNSW is the cover to guard the kernel cashew and is a waste of the manufacturing process of the cashew nut. It has mainly composed of cellulose, hemicellulose, lignin and the element composition is as follows: C:53.6; N:9.5; O:27.3; H:8.8 (%wt.) [15]. CNSW is the raw material used in this study. It was obtained from Binh Phuoc province, South East of Vietnam. It was washed and milled into particle size under 500 µm.
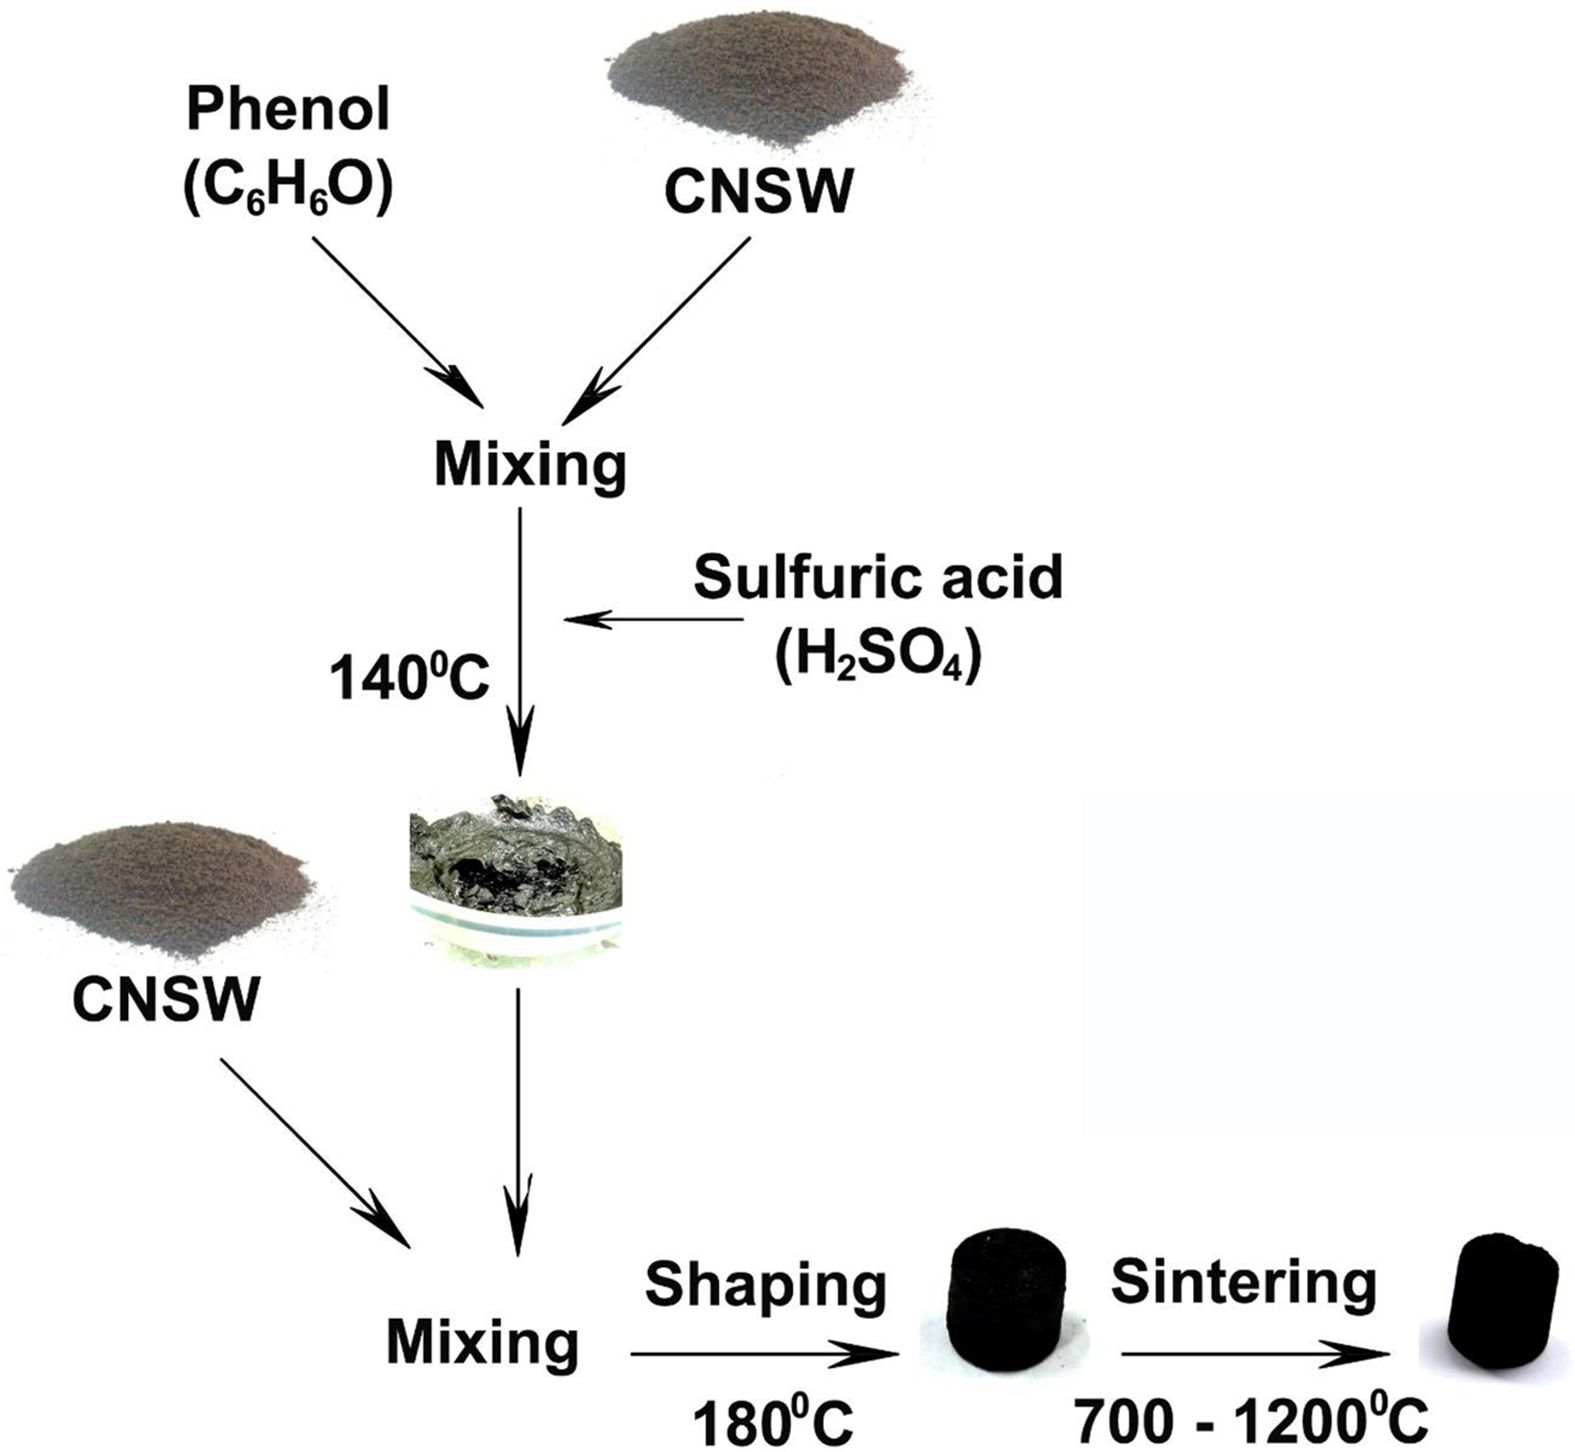
Fig. 2. showed the woodceramics synthesis methods. The liquefied wood was also synthesized from CNSW (after milled) and phenol in a ratio of 1/2 with the catalysis of sulfuric acid (5%wt phenol) in the dried furnace at 150 oC for 30 minutes.
CNSW after milling was mixed with the liquefied wood. After that, composites were made into templates under the pressure of 1 MPa for 15 minutes at 180 oC. The ratio of CNSW powder and liquefied wood was 1/0.6. The templates were cylinder form with d = 12 mm and l = 20 mm. Finally, they were sintered in an inert gas atmosphere to form woodceramics. Sintering temperatures were at 700 oC, 800 oC, 900 oC, 1000 oC, 1100 oC, 1200 oC. The samples after sintering were tested DTS, XRD, FT-IR, and SEM/EDX to consider the change of structure.
Characterization
The behaviour of the kinds of woodceramics at 700 oC-1200 oC was investigated by using the XRD method (Bruker D8 Advance model) and Cu Kα radiation (λ = 0.154 nm). The speeds of scanning were 0.5o/min in the region of 5o-70o (2 theta). In XRD spectrum, the interplanar spacing d002 was calculated from the position of peak (002) by using the Bragg equation:

At different temperatures, the change of the functional groups of woodceramics was also considered by Fourier transform infrared spectroscopy. The woodceramics samples were milled, mixed with KBr powder and compressed to form a pellet. Spectrum were recorded in air by using a Nicolet 6700 model.
The elemental compositions (carbon, oxygen, hydrogen) were also determined by Isotope Ratio Mass Spectrometry measurement (IRMS) with the Flash 2000 model. And the morphology was considered by Scanning Electron Microscope (SEM) and Energy Dispersive X-Ray Analysis (EDX) with the S-4800 Hitachi model and integrate Genesis 4000 EDX model.
|
Fig. 2 The woodceramics synthesis methods. |
The change of carbon stages
According to H. M. Cheng et al. [4], the woodceramics consists of three components that they are amorphous carbon (A), turbostratic carbon (T) and graphite carbon (G). A & T are components that correspond to a low sintering temperature (under 1250 oC). And T & G correspond to a high sintering temperature (above 1300 oC). The (002) peak at 2ϴ ≈ 22o and (101) peak at 2ϴ ≈ 44o on the XRD spectrums are often used to determine A, T and G in the carbon structure [16-18].
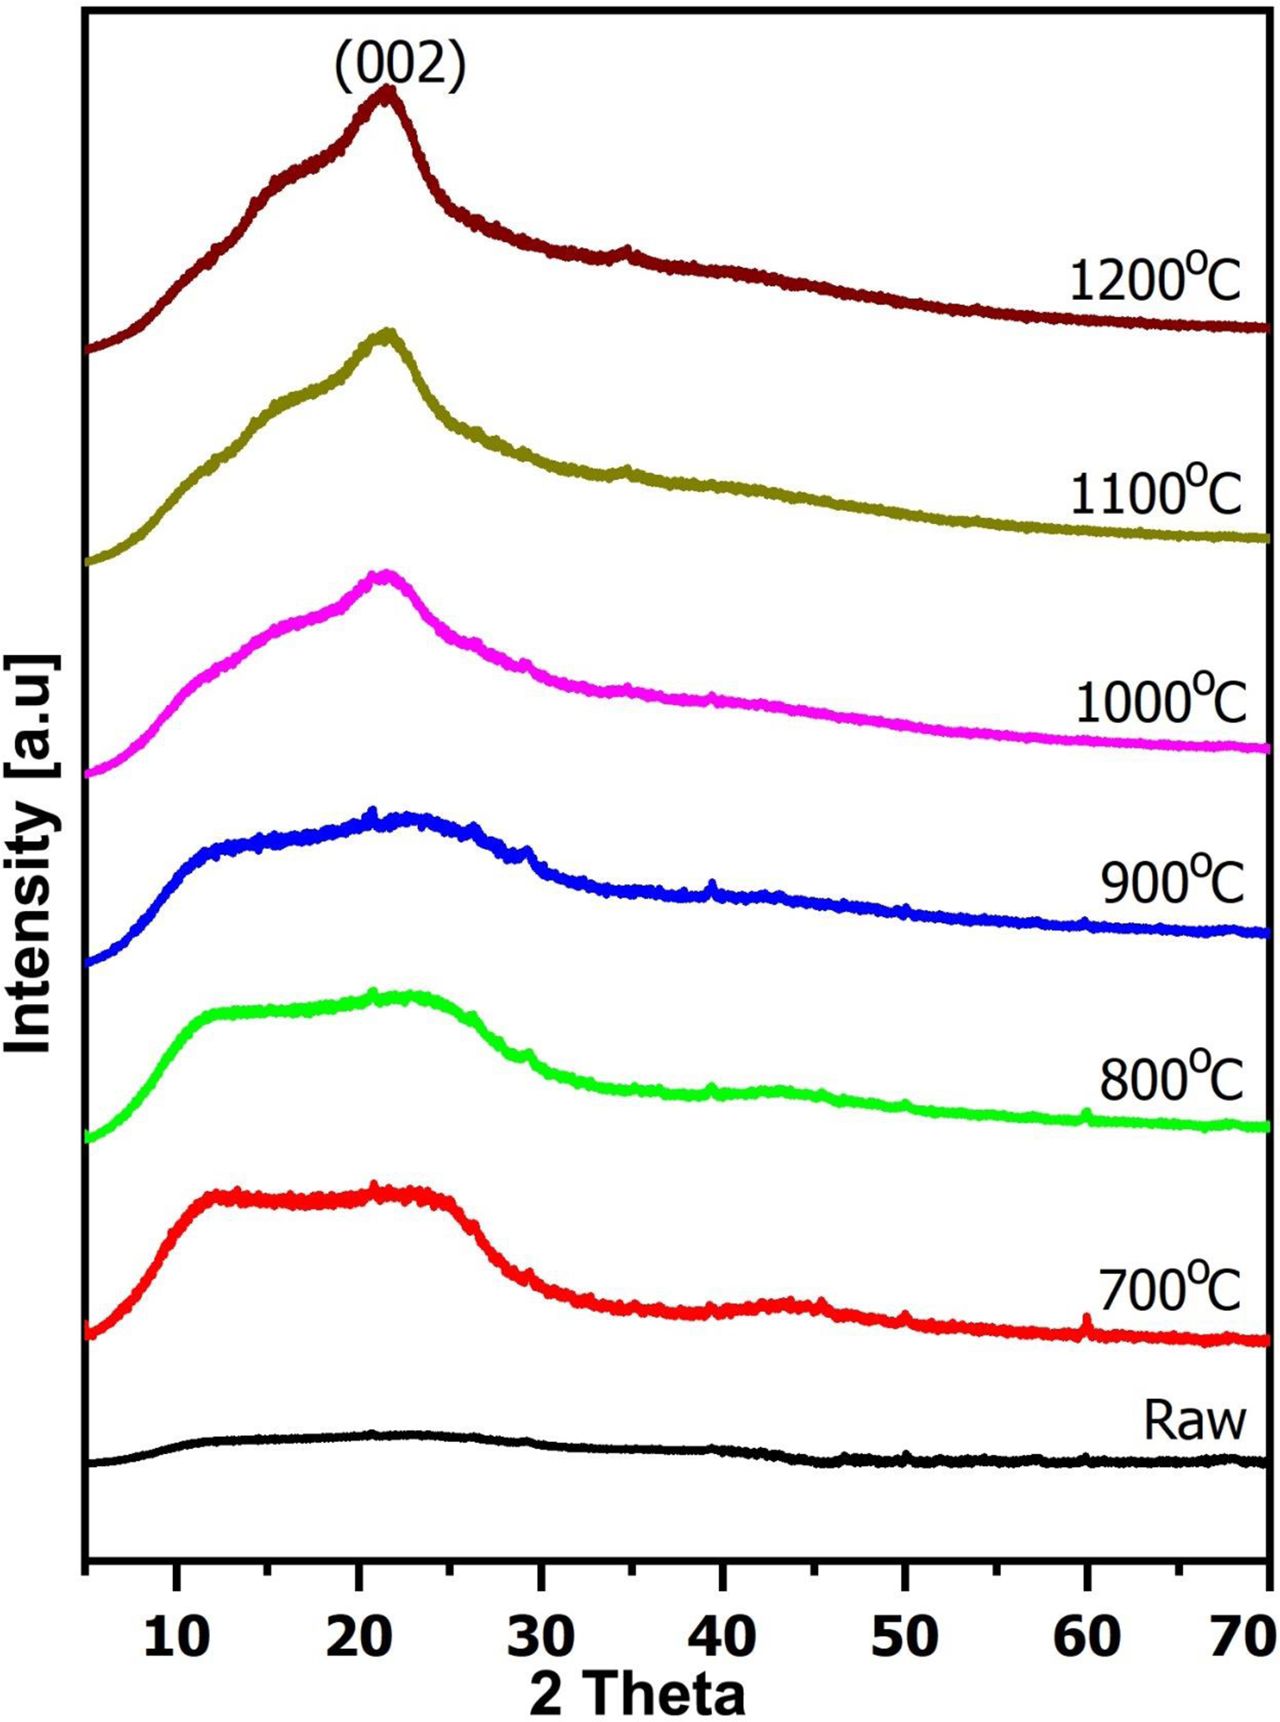
In Fig. 3, the XRD patterns of woodceracmics were made from CNSW and liquefied wood (the weight ratio was 1/0.6) at different temperatures. On XRD patterns, the (002) peak showed components of woodceramics. Unlike with raw samples, after sintering samples also appeared at 2ϴ ≈ 22o. By increasing the sintering temperature from 700 oC to 1200 oC, the (002) peak became stronger and had a narrower full-width at haft-intensity.
At 700 oC, 800 oC and 900 oC, XRD patterns appeared (002) peak, but a full-width at haft-intensity of them was large. It demonstrated that the main component structure was A structure at these temperatures [19, 20]. At 1000 oC, 1100 oC and 1200 oC, the (002) peak on XRD patterns was seen clearer and a full-width at haft-intensity of them was narrower, which meant that T and G structure appeared. It predicted that woodceramics became better and their structure became harder and more stable at high temperatures. On the other hand, on all of the XRD patterns, the (101) peak didn’t appear. This implies that three dimensions of graphite crystal were almost not developed even after sintering at 1200 oC and the main component structure was T structure.
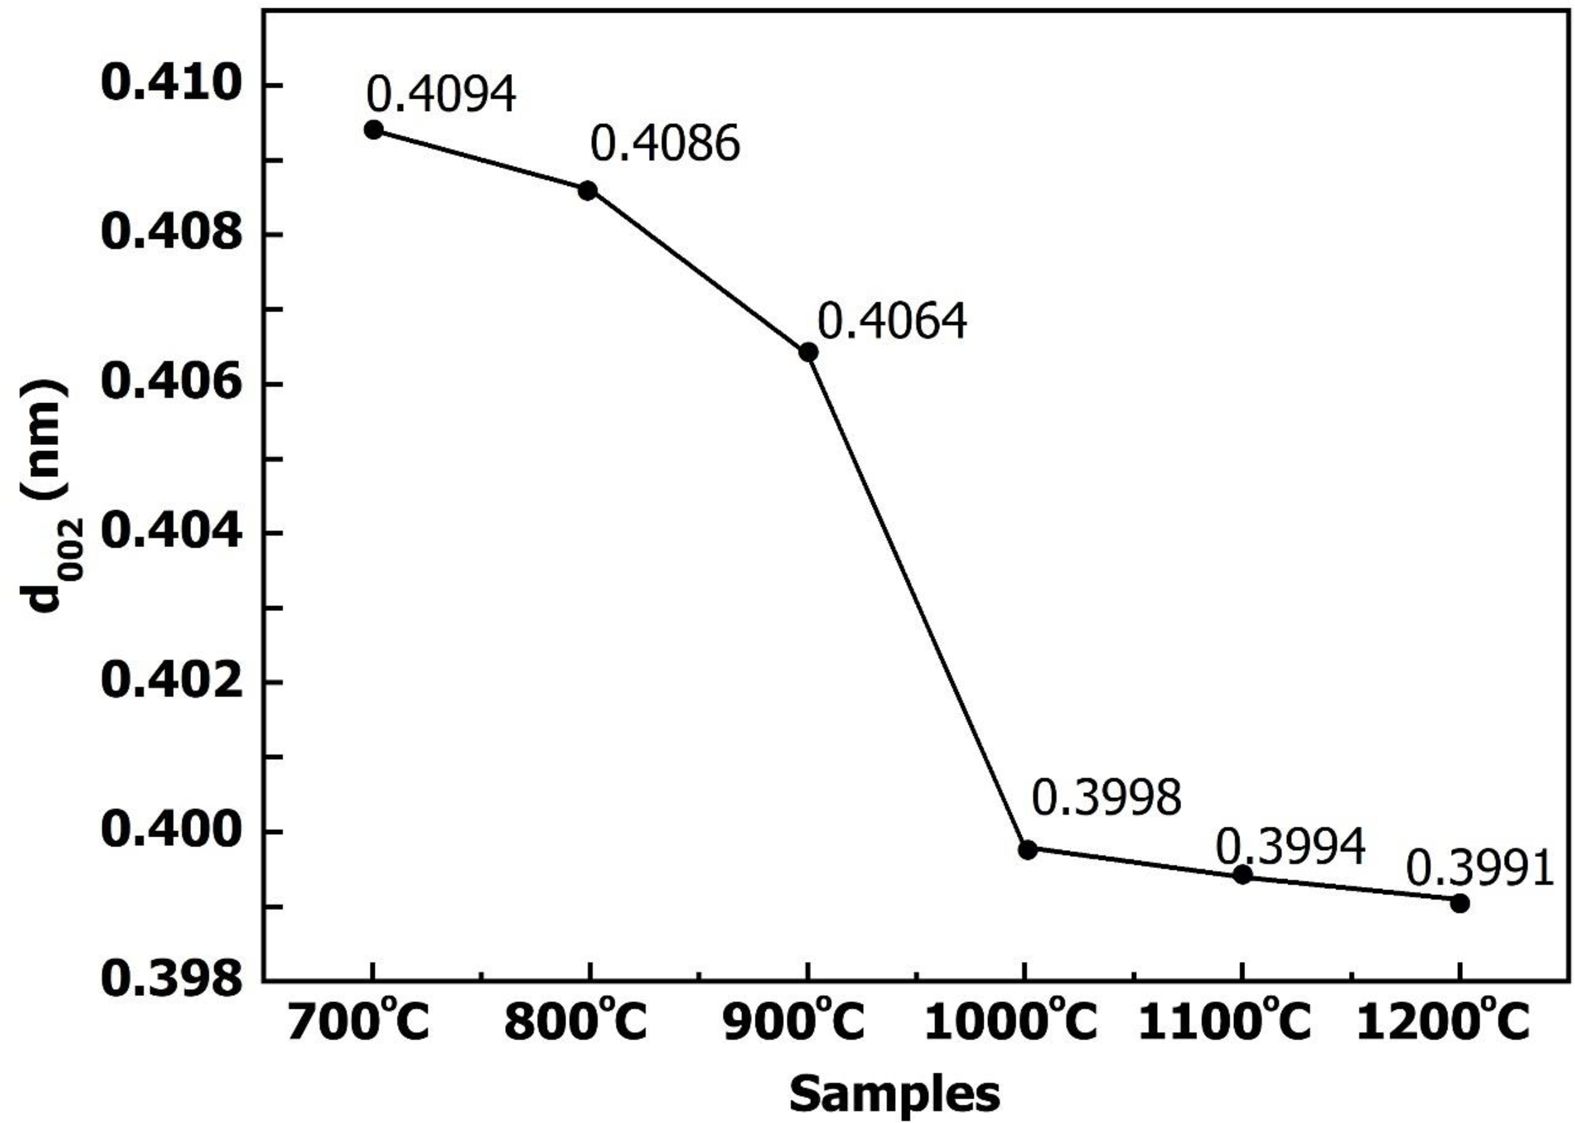
The d002 value is also used to appraise a graphitization degree of carbon. In general, the development of the graphite structure is reflected by decreasing values of d002. The d002 values of highly crystallized graphite are lower than 0.3354 nm [21, 22]. Fig. 4 showed the relationship between (002) interplanar and sintering temperature of the woodceramics. It showed that the d002 decreased with increasing temperature, and all of d002 values were much higher than 0.3354 nm. This implies that the structural woodceramics was a non-graphite structure. Besides that, at the temperature range from 900 oC to 1000 oC, the slope of graph was high. It meant that there was a strong shift from A structure to T structure at these temperature ranges.
The change of the functional groups
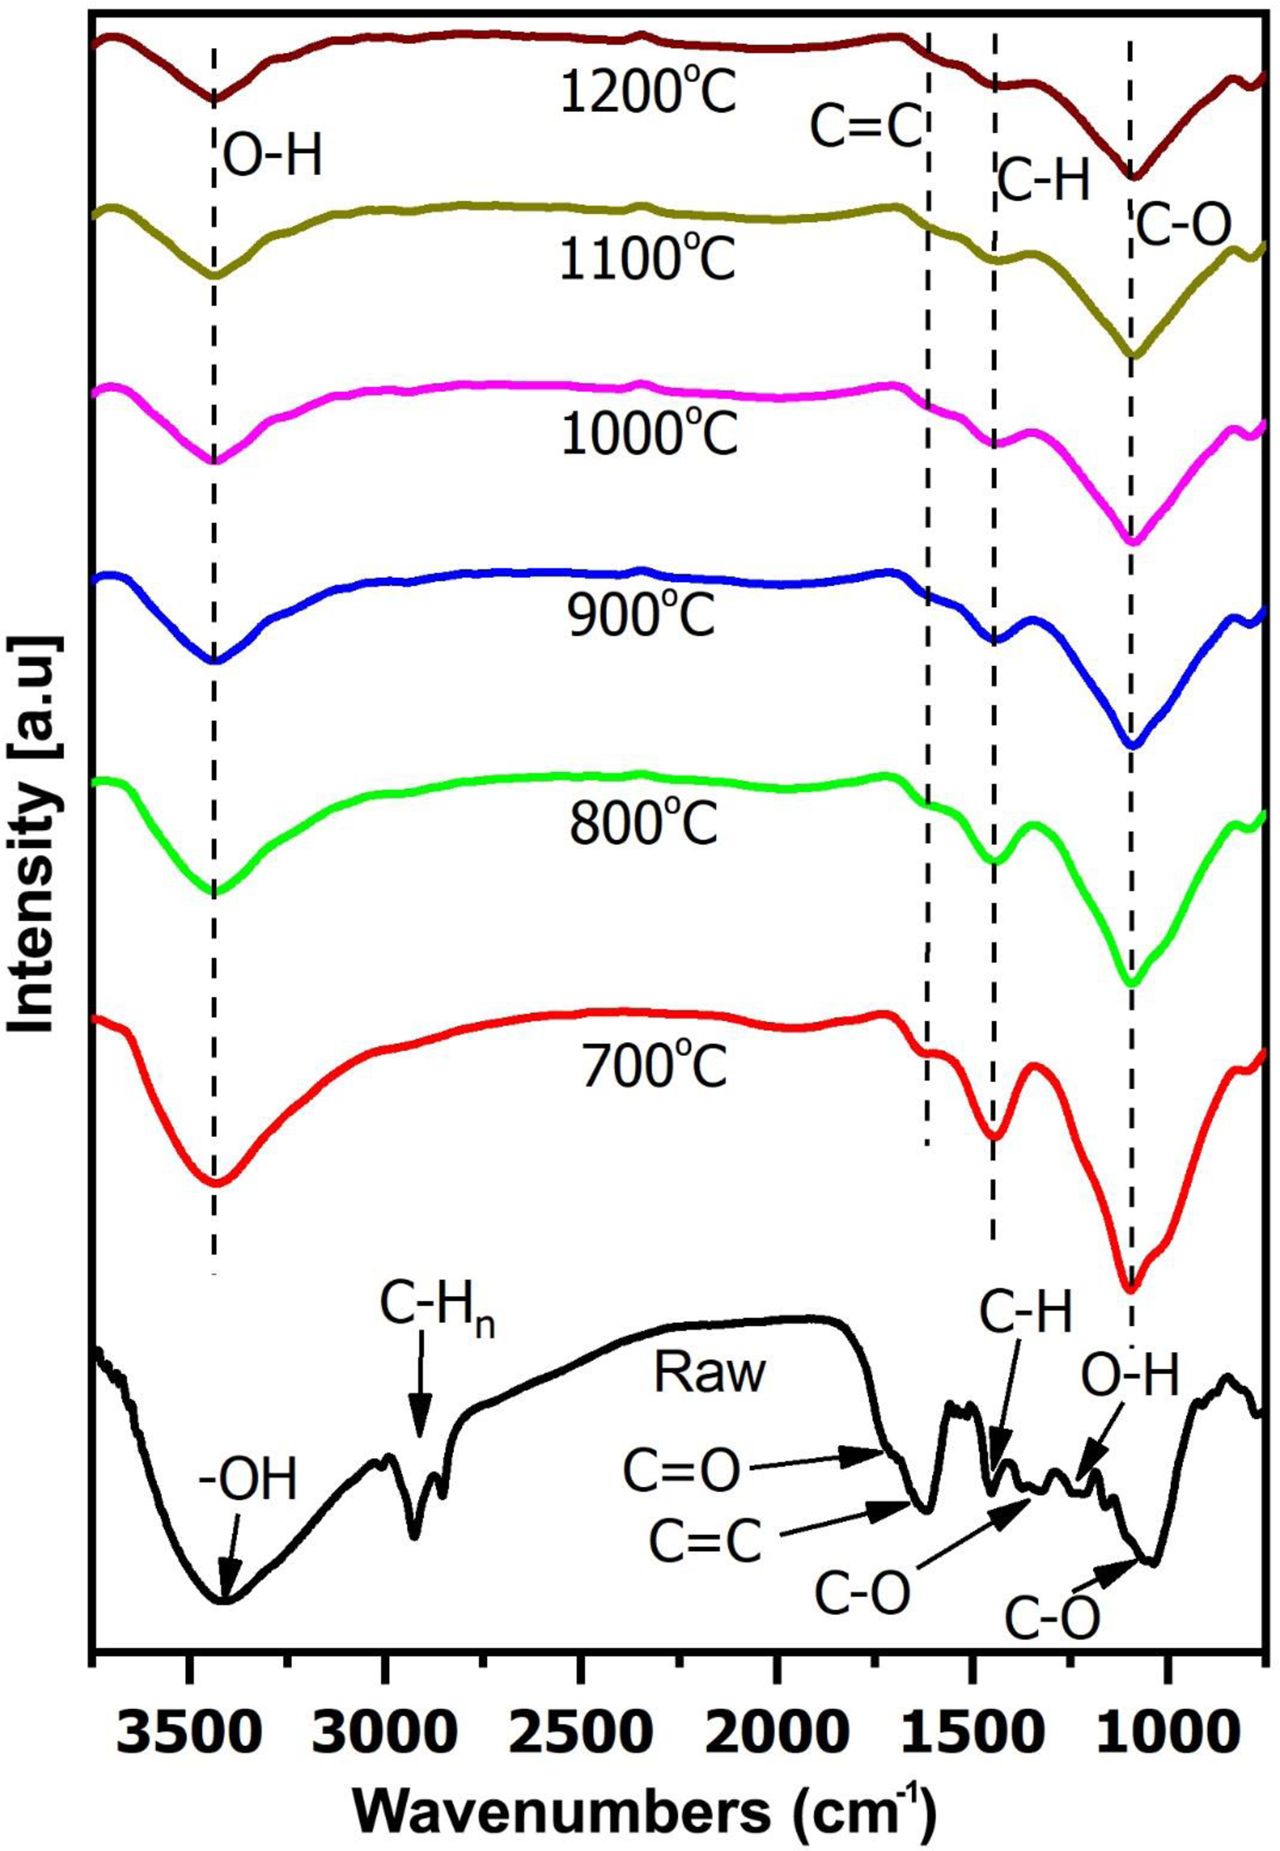
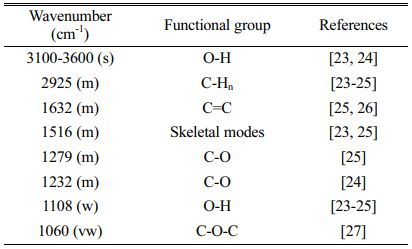
Unlike the XRD method, which shows the formations of graphite, FT-IR shows the change of functional groups. Fig. 5 showed the FT-IR spectrums from CNSW and woodceramics at different temperatures. And the absorption frequencies of the functional groups refer to Table 1.
The spectrum of CNSW showed characteristics of carbohydrates compound such as absorptions due to O-H vibration (3100-3600 cm-1), C-Hn vibration (2925 cm-1), skeletal modes vibration (1516 cm-1), C=C vibration (1632 cm-1), C-H vibration (1402 cm-1), C-O-C vibration (1232 cm-1), C-O-C vibration (1060 cm-1) and O-H (1108 cm-1). After sintering, because C-O-C vibration is very weak, C-O vibration (1279 cm-1) and C-O-C vibration (1060 cm-1) were overlapped and created C-O vibration (1232 cm-1). When the temperature increased, C-H vibration (1402 cm-1), and C-Hn vibration (2925 cm-1) also disappeared. It showed that there were dehydration and rearrangement of the molecular structure.
In addition to the loss of some vibration, the FT-IR spectrums of woodceramics samples still appeared with four vibrations. O-H vibration (3100-3600 cm-1) represented the moisture of samples. C=C vibration (1632 cm-1), skeletal modes vibration (1516 cm-1) and C-O vibration (1232 cm-1) showed that A structure and T structure of woodceramics at 700 oC-1200 oC were in the form of graphite oxide [28].
Besides that, when the sintering temperature was increased, the ratios of C=C vibration and skeletal mode vibration, C=C vibration and C-O vibration were also increased. It could be pointed out the functional groups (such as C-H, C-O) to be cracked and releasing oxygen and hydrogen gases out of the woodceramics. The result of the chemical compositions by the IRMS method would clarify this process.
The change of chemical compositions
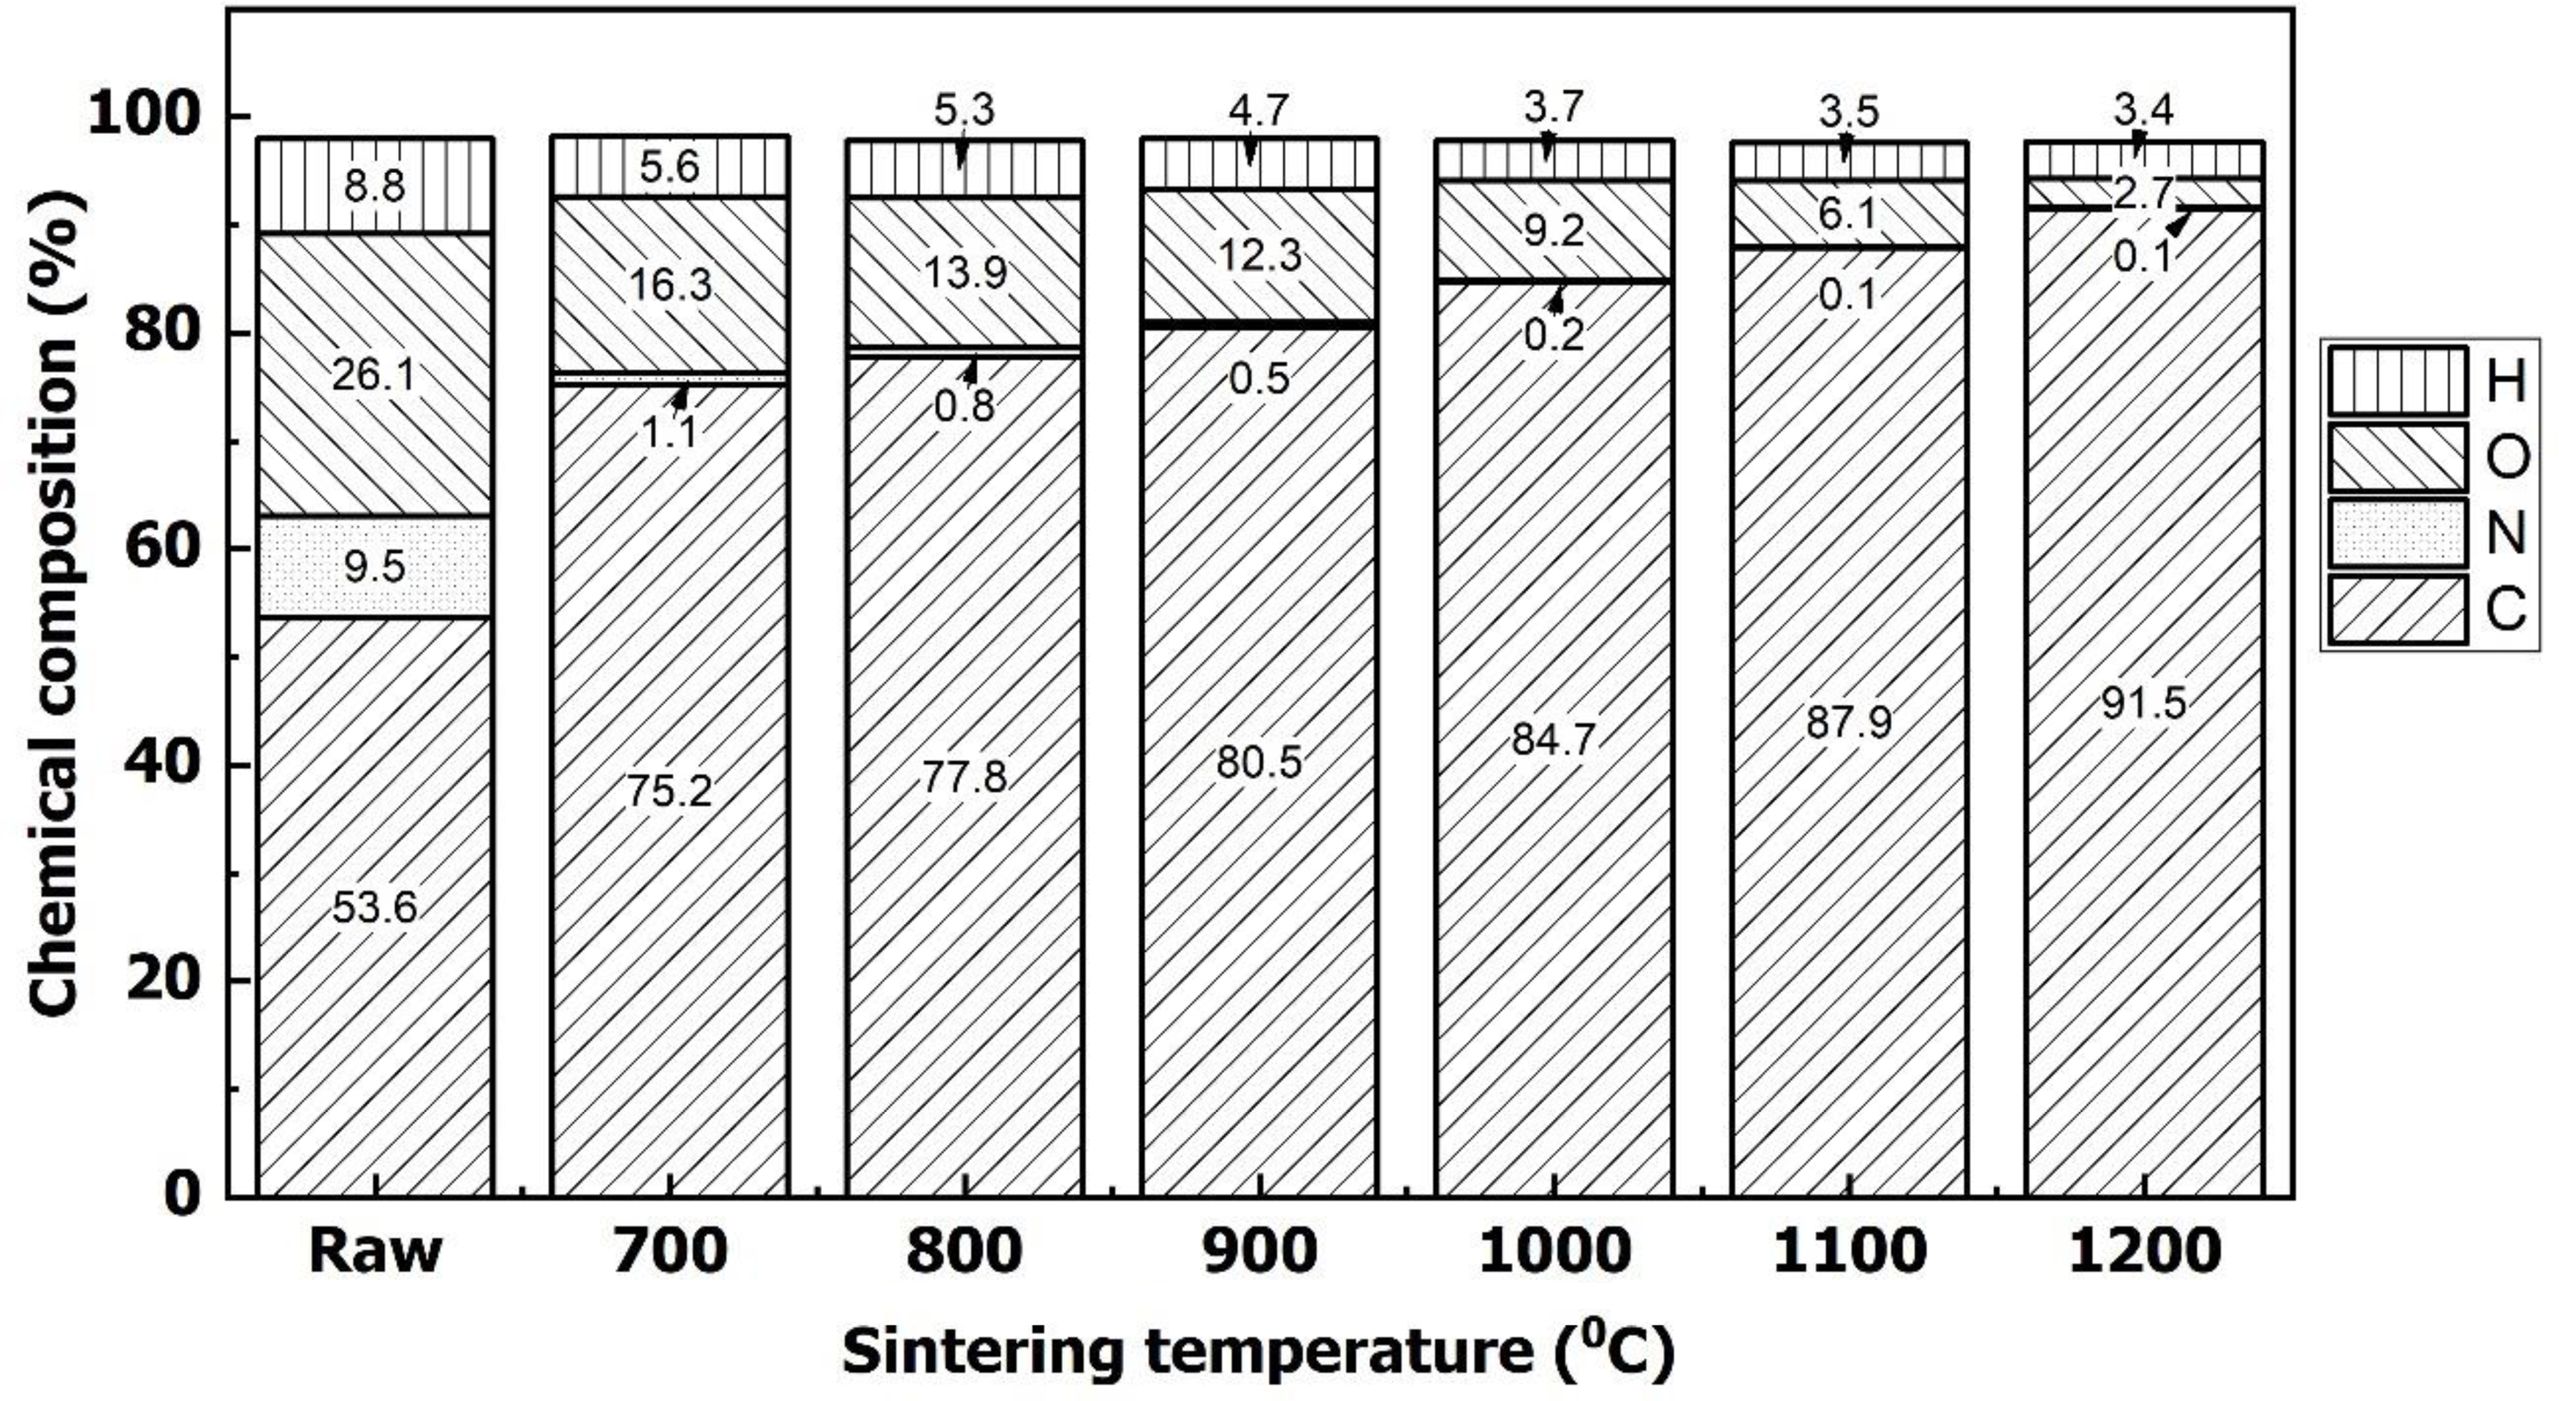
Fig. 6 showed the chemical compositions of a woodceramics at different temperatures. This result proved again the conclusions from the FT-IR analysis. When heating, WCNS was decomposed and links of carbon, nitrogen, oxygen, and hydrogen were cracked. Nitrogen, oxygen, and hydrogen were released out of the material. The result of this process was the increased carbon content [29, 30].
Moreover, when the synthetic temperature was increased, the ratios of carbon/nitrogen and carbon/hydrogen were also increased. It explained why the ratios of C=C vibration and skeletal mode vibration, C=C vibration and C-O vibration were increased in Fig. 5 at high temperatures.
The change of morphology
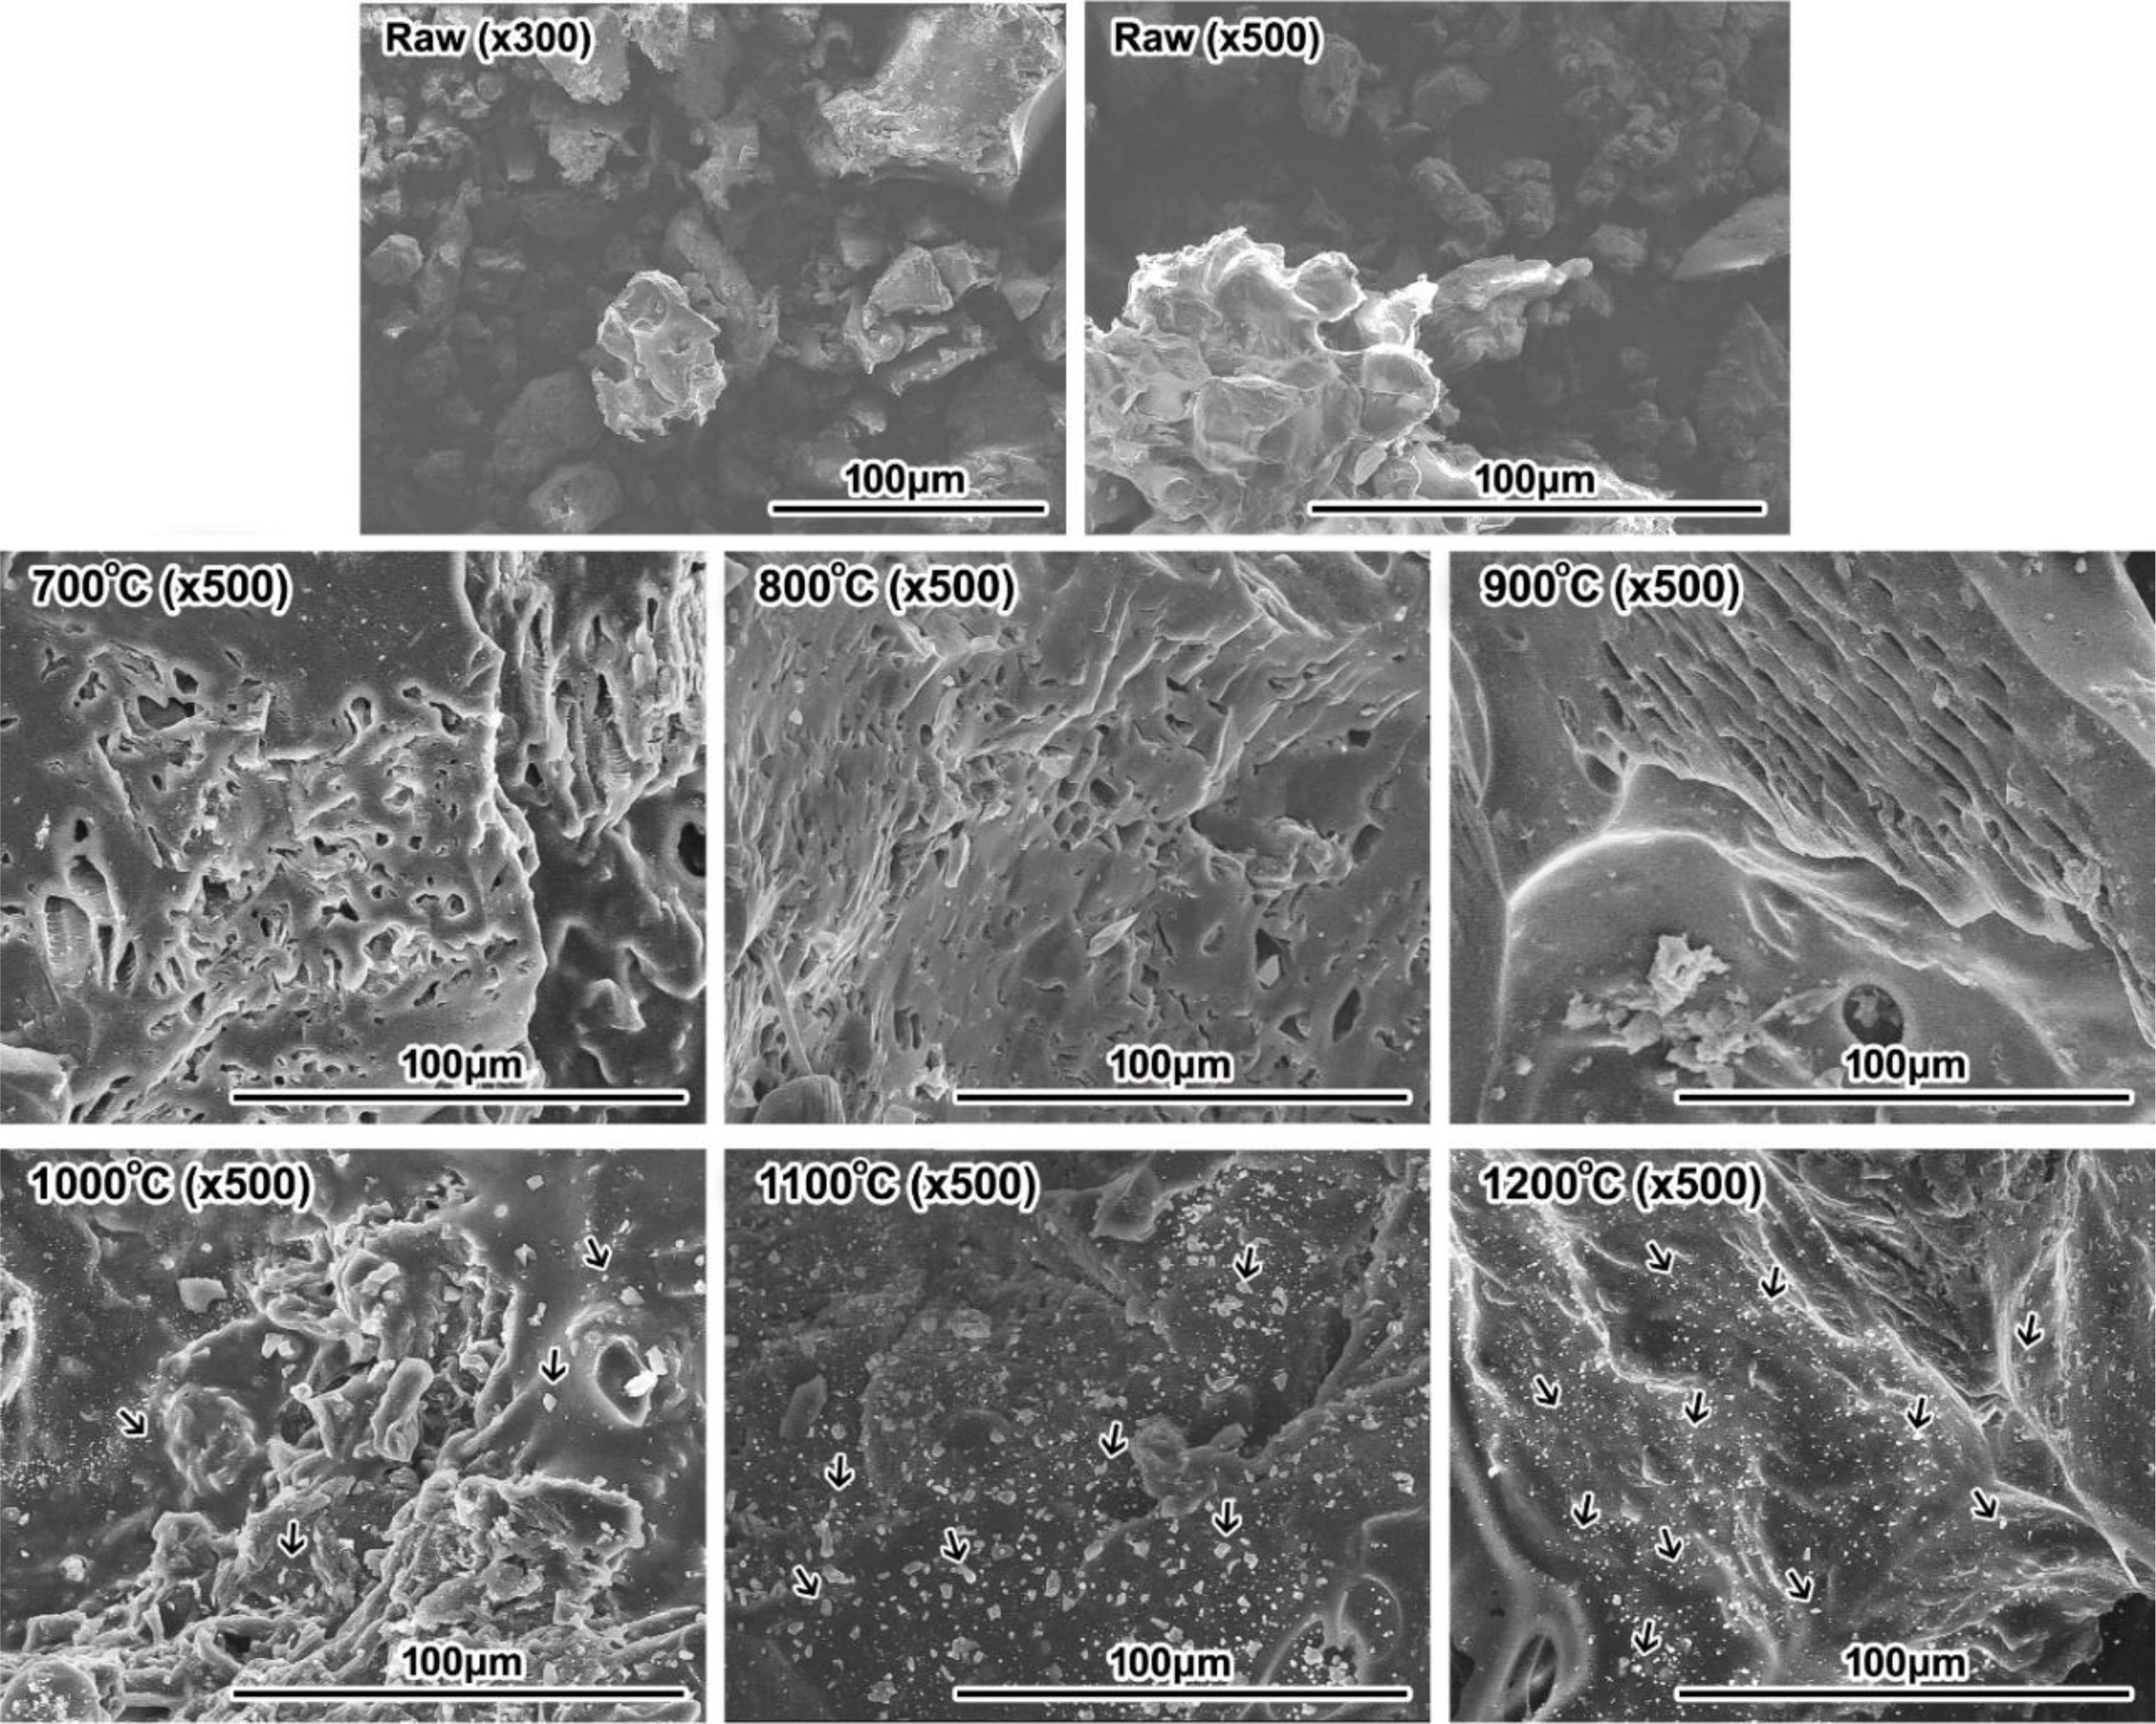
In the carbonization behaviour of woodceramics, the morphology evolution with increasing the sintering temperature was observed by using the SEM photographs. The results were shown in Fig. 7.
The SEM image showed the sintering of woodceramics. At the pattern before sintering (raw sample), the particles were not linked. But after sintering (700 oC, 800 oC, 900 oC, 1000 oC, 1100 oC, 1200 oC samples), the patterns no longer were seen the individual particles, they were linked together at high temperature. At sintered patterns, a lot of pores were found with sizes ranging from 5 μm to 25 μm and the ratio of the porous was decreased when the sintering temperature was increased. The porosity was a characteristic of woodceramics material. They are caused by the pyrolysis of the hydrocarbon compounds in the cashew nut shell waste. The porous appeared clearly in patterns 700 oC, 800 oC and 900 oC. But at the patterns which were sintered at higher than 900 oC, the patterns were shrunk and the porosity was almost gone.
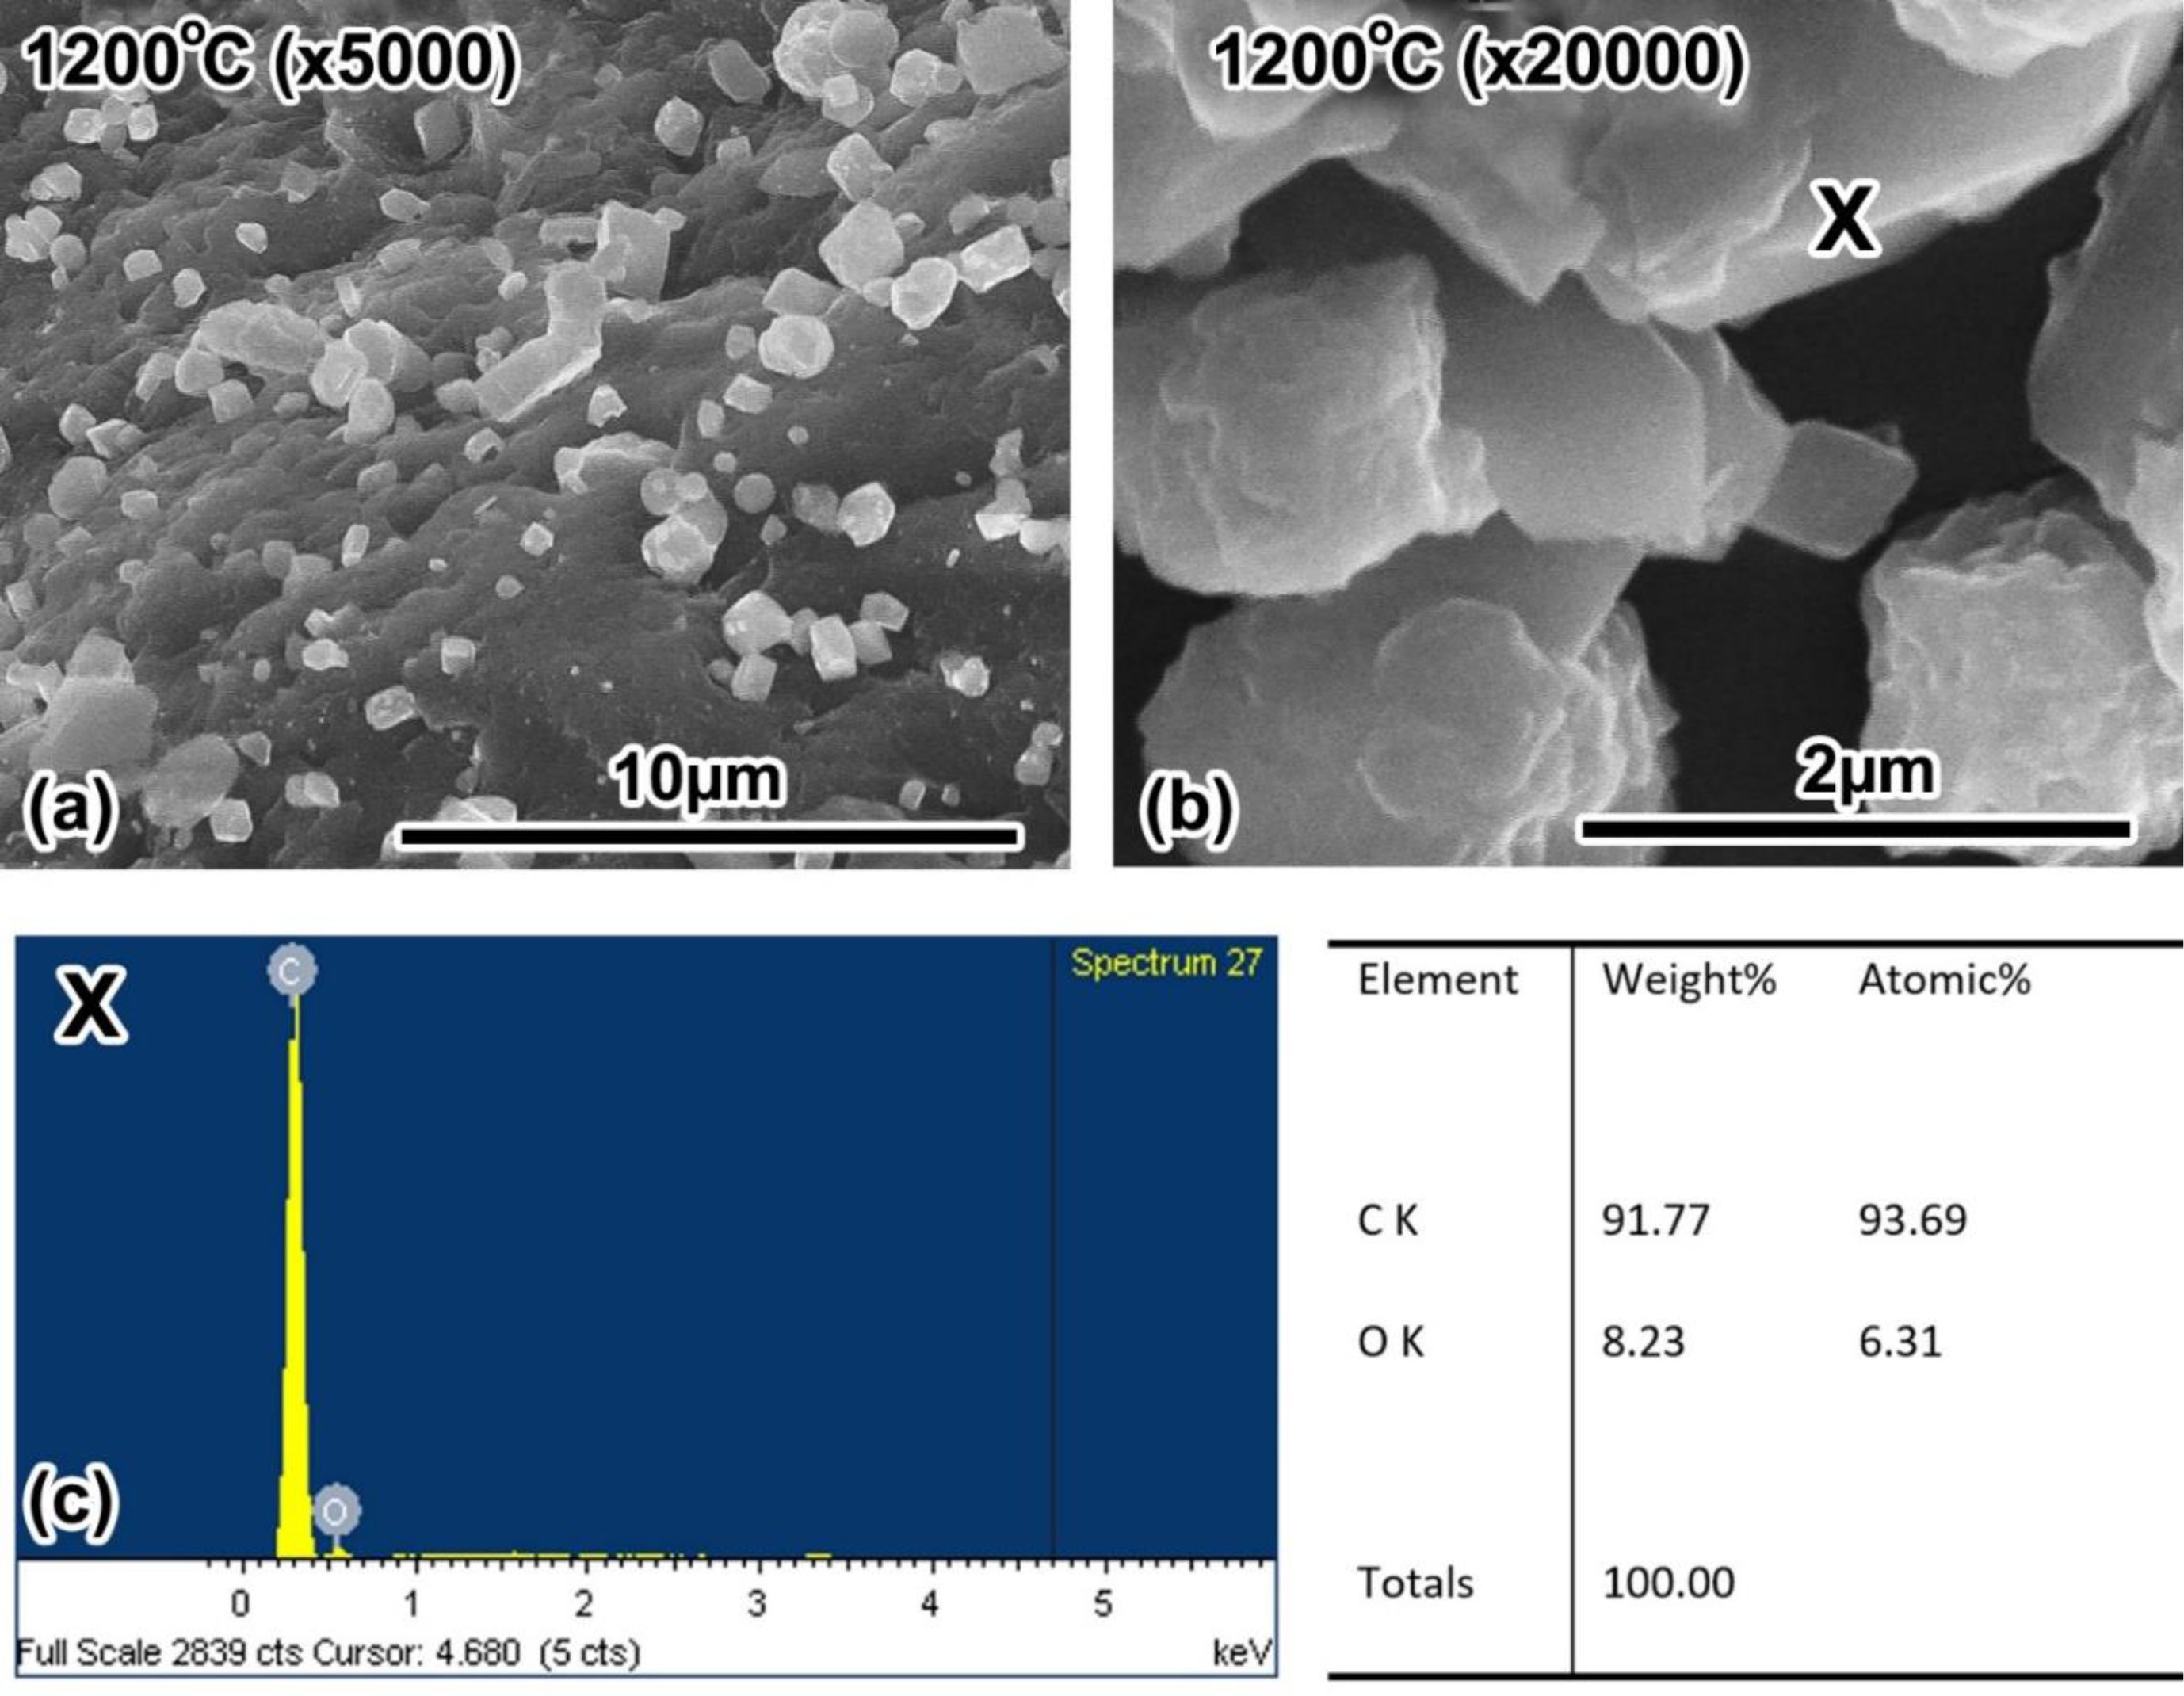
Also, SEM images in Fig. 7, at the high-temperature pattern (1000 oC, 1100 oC and 1200 oC), a lot of light colour particles appeared on a dark background. These may be graphite particles formed at high-temperature. This statement is consistent with the conclusion from the XRD results and d002 value of patterns. The patterns were a strong shift from A structure to T structure. But these light colour particles also may be dust clinging to patterns. To be clearer, these need to be determined the chemical composition. Fig. 8 was the SEM images at high resolution and the chemical compositions of light colour particles by EDX analysis.
Fig. 8 is a morphological result of woodceramics at 1200 oC at magnification 5.000 times (Fig. 8a), and 20.000 times (Fig. 8b). The image showed clearly the shape of light colour particles. The shape is the same as the shape of graphite. The chemical compositions of them at the point marked X by EDX analysis showed that the compositions were 91.77% carbon and 8.23% oxygen (Fig. 8c). This result demonstrated that light colour particles were graphite particles formed at high temperatures. But the size of these particles was small with sizes ranging from 2 μm to 4 μm and scattered in the amorphous background. This result once again demonstrated the turbostratic structure of woodceramics as the XRD result showed.
|
Fig. 3 The XRD patterns of woodceramics at different temperatures. |
|
Fig. 4 D002 of the graphite crystalline at different temperatures. |
|
Fig. 5 The FT-IR spectrum of woodceramics at different temperatures. |
|
Fig. 6 The elemental composition of woodceramics at different temperatures |
|
Fig. 7 The change of morphology of woodceramics at different temperature. |
|
Fig. 8 The morphology and chemical compositions of woodceramics at 1200 oC. |
|
Table 1 Absorption frequencies of the functional groups |
s: strong, m: medium, w: weak, vw: very weak |
In this paper, the woodceramic was made from WCNS powder and the liquefied wood in an inert gas atmosphere. The changes of the structure of woodceramics at 700 oC-1200 oC were investigated. The results could be summarized as follows:
1. With increasing sintering temperature, the (002) peak intensity in the XRD spectrum of woodceramics became stronger and a full-width at haft-intensity of this peak was narrower. At 700 oC, 800 oC and 900 oC, woodceracmis was the form of the amorphous structure. And at temperatures above 1000 oC, it was the turbostratic structure. The (101) peak hasn't appeared. This implies that three dimensions of the crystal was almost not developed at under 1200 oC. The interplanar spacing (d002) decreased with increasing temperature. But d002 values were much higher than 0.3354 nm so the structural woodceramics was a non-graphite structure. The temperature 900 oC-1000 oC was a strong shift from amorphous structure to turbostratic structure.
2. The main functional groups of woodceramics at 700-1200 oC were C=C, skeletal mode and C-O. It showed that the amorphous structure and the turbostratic structure of woodceramics at 700-1200 oC were in the form of graphite oxide.
3. When heating, nitrogen, oxygen, hydrogen formed and released out of the material. Therefore, the main element of woodceramics is carbon.
4. The particles were linked after sintering. The patterns after sintering had a lot of pores with sizes ranging from 5 μm to 25 μm. The ratio of the porosity was decreased when the sintering temperature was increased. Graphite particles were formed at temperatures above 1000 oC. But the size of these particles was small (from 2 μm to 4 μm) and scattered in the amorphous background. This is a characteristic of the turbostratic structure.
We acknowledge Ho Chi Minh City University of Technology (HCMUT), VNU-HCM for supporting this study.
- 1. T. Manabe, M. Ohata, S. Yoshizawa, D, Nakajima, S. Goto, K. Uchida, and H. Yajima, Trans. Matter. Res. Soc. Jpn. 32 (2007) 1035-1038.
-

- 2. T.C. Wang, T.X. Fan, D. Zang, and G.D. Zang, Carbon 44 (2006) 900-906.
-
- 3. T.C. Wang, T.X. Fan, D. Zhang, and G.D. Zang, J. Mater. Sci. 41 (2006) 6095-6099.
-
- 4. H.M. Cheng, H. Endo, T. Okabe, K. Saito, and G.B. Zheng, J. Porous Mater. 6 (1999) 233-237.
-
- 5. J. Qian, Z. Jin, and J. Wang, Mater. Sci. Eng., A 368 (2004) 71-79.
-
- 6. T. Okabe, K. Saito, and K. Hokkirigawa, J. Porous Mater. 2 (1996) 207-213.
-
- 7. K. Shibata, T. Okabe, K. Saito, T. Okayama, M. Shimada, A. Yamamura, and R. Yamamoto, J. Porous. Mater. 4 (1997) 296-275.
-
- 8. K. Ogawa and T. Okabe, Trans. Mat. Res. Soc. Jpn. 34 (2009) 659-662.
-
- 9. Y. Okachi, K. Ogawa, J. Tsuji, and T. Okabe, Trans. Mat. Res. Soc. Jpn. 38 (2013) 507-512.
-
- 10. K. Kasai, and K. Shibata, K. Saito, and T. Okabe, J. Porous. Mater. 4 (1997) 277-280.
-
- 11. T. Akagaki, K. Hokkirigawa, T. Okabe, and K. Saito, J. Porous. Mater. 6 (1999) 197-204.
-
- 12. J. Tsuji, R. Ozao, T. Okabe, T. Suda, and R. Yamamoto, Mater. Trans. 46 (2005) 2679-2684.
-
- 13. T. Okabe, K. Kakishita, H. Simizu, K. Ogawa, Y. Nishimoto, A. Takasaki, T. Suda, M. Fushitani, H. Togawa, M. Sata, and R. Yahamoto, Trans. Mater. Res. Soc. Jpn. 38 (2013) 191-194.
-
- 14. H. Terrones, T. Hayashi, M. Muñoz-Navia, M. Terrones, Y.A. Kim, N. Grobert, R. Kamalakaran, J. Dorantes-Dávila, R. Escudero, M.S. Dresselhaus, and M. Endo, Chem. Phys. Lett. 343 (2001) 241-250.
-
- 15. K.D.T. Kien, P.D. Tuan, T. Okabe, D.Q. Minh, and T.V. Khai, J. Ceram. Process. Res. 19 (2018) 472-478.
-
- 16. E. Bresciani, T. Barata, T.C. Fagundes, A. Adachi, M.M. Terrin, M.F. Navarro, and J. Minim. Interv. Dent. 1 (2008) 102-111.
-
- 17. A. Gutiérrez-Pardo, J. Ramírez-Rico, A.R.D.A. López, and J.M. Fernández, J. Matter. Sci. 49 (2014) 7688-7696.
-
- 18. J.G. Park, S.Y. Kim, I.S. Han, H.S. Kim, and I.J. Kim, J. Ceram. Process. Res. 20 (2019) 540-546.
-
- 19. D.Q. Minh, T.V. Khai, H.N. Minh, N.V.U. Nhi, and K.D.T. Kien, J. Ceram. Process. Res. 22 (2021) 246-251.
-
- 20. Y.T. Parka, J. Ceram. Process. Res. 18 (2017) 488-493.
-
- 21. D. Torres, J.L. Pinilla, and I. Suelves, J. Environ. Chem. Eng. 9 (2021) 105022.
-
- 22. T. Takashi, T. Fujino, T. Fan, H. Endo, T. Okabe, and M. Yoshimura, Carbon 40 (2002) 761-765.
-
- 23. A. Nagaty, O.H.E. Sayed, S.T. Ibrahim, and O.Y. Mansour, Holzforschung 36 (1982) 29-35.
-
- 24. V.P. Tolstoy, I.V. Chernyshova, and V.A. Skryshevsky, in “Handbook of Infrared Spectroscopy of Ultrathin Films” (John Wiley Interscience, 2003).
-
- 25. M. Aho, P. Kortelainen, J. Rantanen, and V. Linna, J. Anal. Appl. Pyrolysis 15 (1989) 297-306.
-
- 26. C. Morterra and M.J.D. Low, Mater. Lett. 2 (1984) 289-293.
-
- 27. A.S. Politou, C. Morterra, and M.J.D. Low, Carbon 28 (1990) 529-538.
-
- 28. J.G. Contreras and F.C. Briones, Mater. Chem. Phys. 153 (2015) 209-220.
-
- 29. M. Singh and B.M. Yeea, J. Ceram. Process. Res. 5 (2004) 121-126.
- 30. A.E. Pramonoa, M.B.T. Firdausa, W. Ratriomasyoa, M.Z. Nuraa, and J.W.M. Soedarsonob, J. Ceram. Process. Res. 18 (2017) 748-753.
-
 This Article
-
2023; 24(1): 127-133
Published on Feb 28, 2023
- 10.36410/jcpr.2023.24.1.127
- Received on Jul 1, 2022
- Revised on Aug 20, 2022
- Accepted on Sep 3, 2022
Services
- Abstract
introduction
experimental
results and discussion
conclusion
- Acknowledgements
- References
- Full Text PDF
Shared
Correspondence to
- Kieu Do Trung Kien
-
aDepartment of Silicate Materials, Faculty of Materials Technology, Ho Chi Minh City University of Technology (HCMUT), 268 Ly Thuong Kiet Street, District 10, Ho Chi Minh City, Vietnam
bVietnam National University Ho Chi Minh City, Linh Trung Ward, Thu Duc City, Ho Chi Minh City, Vietnam
Tel : (84.8) 8 661 320 Fax: (84.8) 8 661 843 - E-mail: kieudotrungkien@hcmut.edu.vn
Clean-Energy Research Institute(CRI), Hanyang University, 222, Wangsimni-ro, Seongdong-gu, Seoul, 04763, Korea
E-mail: jcpr@hanyang.ac.kr