


- Fabrication of high purity silica precipitates from quartz sand toward photovoltaic application
Agus Budi Prasetyoa, Murni Handayania,*, Eko Sulistiyonoa, F. Firdiyonoa, Eni Febrianaa, Wahyu Mayangsaria, Sayekti Wahyuningsihb, Edi Pramonob, Ahmad Maksumc, Rini Riastutid,* and Johny Wahyuadi Soedarsonod
aNational Research and Innovation Agency, Puspiptek Area, Setu, South Tangerang, Banten 15314, Indonesia
bChemistry Department, Faculty of Mathematics and Natural Sciences, Sebelas Maret University, Surakarta 57126, Indonesia
cDepartment of Mechanical Engineering, Politeknik Negeri Jakarta, Depok 16425, Indonesia
dJohny Wahyuadi Laboratorium, Departement of Metallurgy and Materials, Universitas Indonesia, Depok 16424, IndonesiaThis article is an open access article distributed under the terms of the Creative Commons Attribution Non-Commercial License (http://creativecommons.org/licenses/by-nc/4.0) which permits unrestricted non-commercial use, distribution, and reproduction in any medium, provided the original work is properly cited.
The development of renewable energy is becoming a crucial aspect because fossil fuels are non-renewable energy and will run out in the near future. Since Indonesia is in the equator area which gets sunshine throughout the year, solar cell is one of the renewable energy which is very promising as renewable energy. The obstacle to develop solar cell is the high cost of solar panel. Therefore, new technology to produce silica with high purity is important to be performed in order to be used as material in making solar panels. Here we fabricated high purity silica precipitates from quartz sands from Kendawangan, West Kalimantan. We fabricated silica precipitated by roasting quartz sand and then dissolving the sodium silicate into boiling water followed by leaching, precipitation and repeatedly washing using hydrochloric acid. The content of SiO2 of atomic absorption spectroscopy of quartz sand from Kendawangan contains SiO2 of 99.2% and the remaining trace elements are impurities. The roasting process was conducted using sodium carbonate with the comparison of quartz sand: sodium carbonate = 55:45 (% ratio) at 1.200 °C for 2 hours obtaining sodium silicate crystal. The final result of silica precipitates obtained in this research showed that the silica precipitates has very high purity with content of SiO2 up to 99.99%. This successful result will contribute for domestic industry which can provide high purity silica precipitates for material source of solar grade silicon in photovoltaic device
Keywords: Quartz sand, Roasting, Leaching, High purity, Silica, Precipitate
The consumption of the global energy is rising due to the increase of the population year by year. The increase of consumption of fossil fuel will cause various environmental impacts. Besides that, fossil fuel is unsustainable energy source for the future availability [1-4]. Since Indonesia is in the equator area which is getting sunshine throughout the year, photovoltaic cell which is also known as solar cell can be one of the promising candidates of renewable energy.
The obstacle of developing photovoltaic device application is the high price of solar panel [1]. The high price of solar panel is because Indonesia still imports solar panel components from outside, where the domestic industry is not able to make solar panels. The component of solar cell which cannot be made by domestic industry is wafer silicon. In order to make wafer silicon, high grade silicon with very high purity is needed [3-6]. For making high grade silicon in photovoltaic device, high purity silica (99% of SiO2) as material source is required [7]. Therefore, new technology for producing silica with high purity is important to be conducted in order to be used for material source of making solar panel.
Indonesia has abundant natural resources including quartz sand with low and high purity. Low purity quartz sand can be found in some area in Java Island with the lowest grade of about 49-93% SiO2 [8]. Low purity quartz sand can be used as raw materials for glass, mechanical material, ceramics [9], or fired brick [10]. Moreover, high purity quartz sand is usually found in Kalimantan Island where the purity can reach 99% SiO2. This quartz is potential as high grade silicon material resources of solar cell. One of the best producers of quartz sand in Indonesia from Ketapang Regency, West Kalimantan Province. Quartz sand in Ketapang Regency is in the area of Riam Kusik Village, Marau District and Padang Duabelas Village, Matan Ilir District [11]. The SiO2 content in Padang Dua Belas village is 98.8% and the SiO2 level in Riam Kusik village is 98.6% [11]. The potential of quartz sand from Kendawangan Subdistrict, Ketapang Regency is 530 million tons in Kendawangan Village [12].
Generally the bedrock in the Ketapang area is granite and volcanic rocks which are scattered and separated by pre-tertiary sedimentary rock outcrops and a few poor rocks. So that the quartz sand formation is estimated to come from weathered granite, including the Sukadana granite formation which consists of granite, granodiorite and diorite [11]. This Sukadana granite rock formation consists of quartz monzonite rock, monzogranite, sionogranite and feldspar alkali granite, slightly seinit quartz, quartz monzodiorite and quartz diorite [13]. In addition to the Sukadana formation, the constituent of the quartz sand deposit in Kendawangan is Sangiyang granite, consisting of perititic granite, granophilic, leukocratic, fine-grained granite with alitrimorphic texture on Sangiyang Hill [13]. In addition to quartz sand, mineral potentials that are quite prominent are bauxite containing alumina, zircon sand containing zirconia and monazite sand containing rare earth metal elements such as cerium, thorium and uranium [14]. Other minerals that are around Kendawangan are magnetite and hematite which are rich in iron, cassiterite is rich in tin, rutile and ilmenite are rich in titanium [15]. The existence of minerals other than quartz sand does not interfere with the level of sand purity because quartz sand comes from the granite formation of Sukadana and Sangi granite which are arranged separately from other minerals [13]. With this formation, quartz sand in Ketapang Regency covering Matan Ilir, Marau and Kendawangan Districts has very high silica content with only humus that is easy to wash.
With quartz sand which has a very high level of purity, quartz sand from Ketapang Regency has potential as a raw material for solar panels, electronic components as a semi conductor and ceramic materials [16, 17]. Based on the results of the process of making silicon for solar panels (SOG), the silica content requirement in quartz sand is 98.5% to 99.5% [18]. Therefore, to make quartz sand from 98.5% to 99.5% for the requirements to be a SOG product, various stages of the process are needed, starting from reducing the grain size to 75 to 300 µm and then washing process to obtain silica with impurities of 158-180 ppm [18]. A potential source of SOG material other than quartz sand is agricultural waste containing cellulose fibers contained silica elements. Silica from organic agricultural waste has a very high purity because it only contains silica, ash and organic elements [19]. So that the separation process is quite easy by heating the organic material to temperatures above 1000 oC then the organic elements will decompose so that it leaves silica and a little ash. Silica and ash are separated mechanically through a flotation process because ash has a very low density compared to silica [19].
In this paper, a comparison of characterization between quartz sand from Kendawangan Village, Kendawangan District, Ketapang Regency and the precipitate silica products resulting from the processing of quartz sand is explained. The results of the comparative characterization process between products and raw materials can be used as an identification material for quartz sand potential as raw materials of solar cell grade (SOG) silicon. The process used to process quartz sand from Kendawangan Village left, Kendawangan District, Ketapang Regency is an alkali smelting process with sodium carbonate, the process of eliminating impurities [20, 21], the deposition process with hydrochloric acid and the drying process in order to obtain precipitate silica. Expected silica precipitate capable of being used as raw material for solar grade silicon (SOG). The successful result of this research which can get high purity of silica precipitates with content of SiO2 up to 99.99% will contribute importantly in provision of solar panel resources.
The research methods were performed as follows: the characterization of quartz sand as raw material for making high purity silica precipitates was conducted using X-Ray diffraction (XRD), gravimetric analysis and atomic absorption spectroscopy (AAS). After characterization, quartz sand was washed with water. Washing process was done by immersing and stirring quartz sand in water basin to remove mud and humus contained in the quartz. The process of washing was repeated until the used water in the basin became clear and the quartz sand become visible and white. After that quartz sand was filtered and followed with drying. The result was then roasted at 1,200 oC for two hours with 55:45 (% ratio) of the comparison of quartz sand with sodium carbonate to form crystal of sodium silicate. The crystal of sodium silicate resulted from the roasting was then crushed by planetary ball mill to get sodium silicate powder. Sodium silicate powder then was dissolved in 500 ml of boiling water with pH = 7. The dissolution was done by making variable process with different comparison of solvent with sodium silicate powder (1 : 25; 1 : 15; 1 : 10; and 1 : 8). The filtrate resulted from the dissolution was then added with HCl 1 N and stirred and after that washed with water until the pH was neutral. The solution was stirred and remained to form gel on the bottom of solution and then the solution was centrifuged. The result of centrifugation is gel of silica precipitates which was then dried at temperature of 80 oC for 12 hours and 150 oC for 5 hours. The optimum result of dissolution process was used for leaching process and further precipitation using chloride acid 37%, then was followed by precipitation and drying in the same condition used in dissolution. The result was then washed with hydrochloric acid (with concentration of HCl is 1 M). The abstersion was done with different variables of number abstersion from one time to six times abstersion.
Characterization of quartz sand
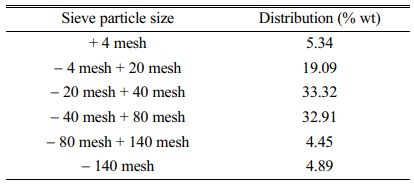
Analysis of particle size distribution on quartz sand from washing process of the left Kendawangan Village, Kendawangan District, Ketapang Regency. From the results of the measurement analysis using the sieve method it is seen that quartz sand from the left Kendawangan Village area, Kendawangan District, Ketapang District comes from granite blocks. This can be seen from the amount of quartz sand which is roughly sized and gravel-like, which is different from quartz sand from other regions in Indonesia, such as from Gunung Walat, Sukabumi Regency in the form of quartz sand strand and quartz sand mixed with mud that forms solids. The results of particle size distribution analysis can be seen in the Table 1.
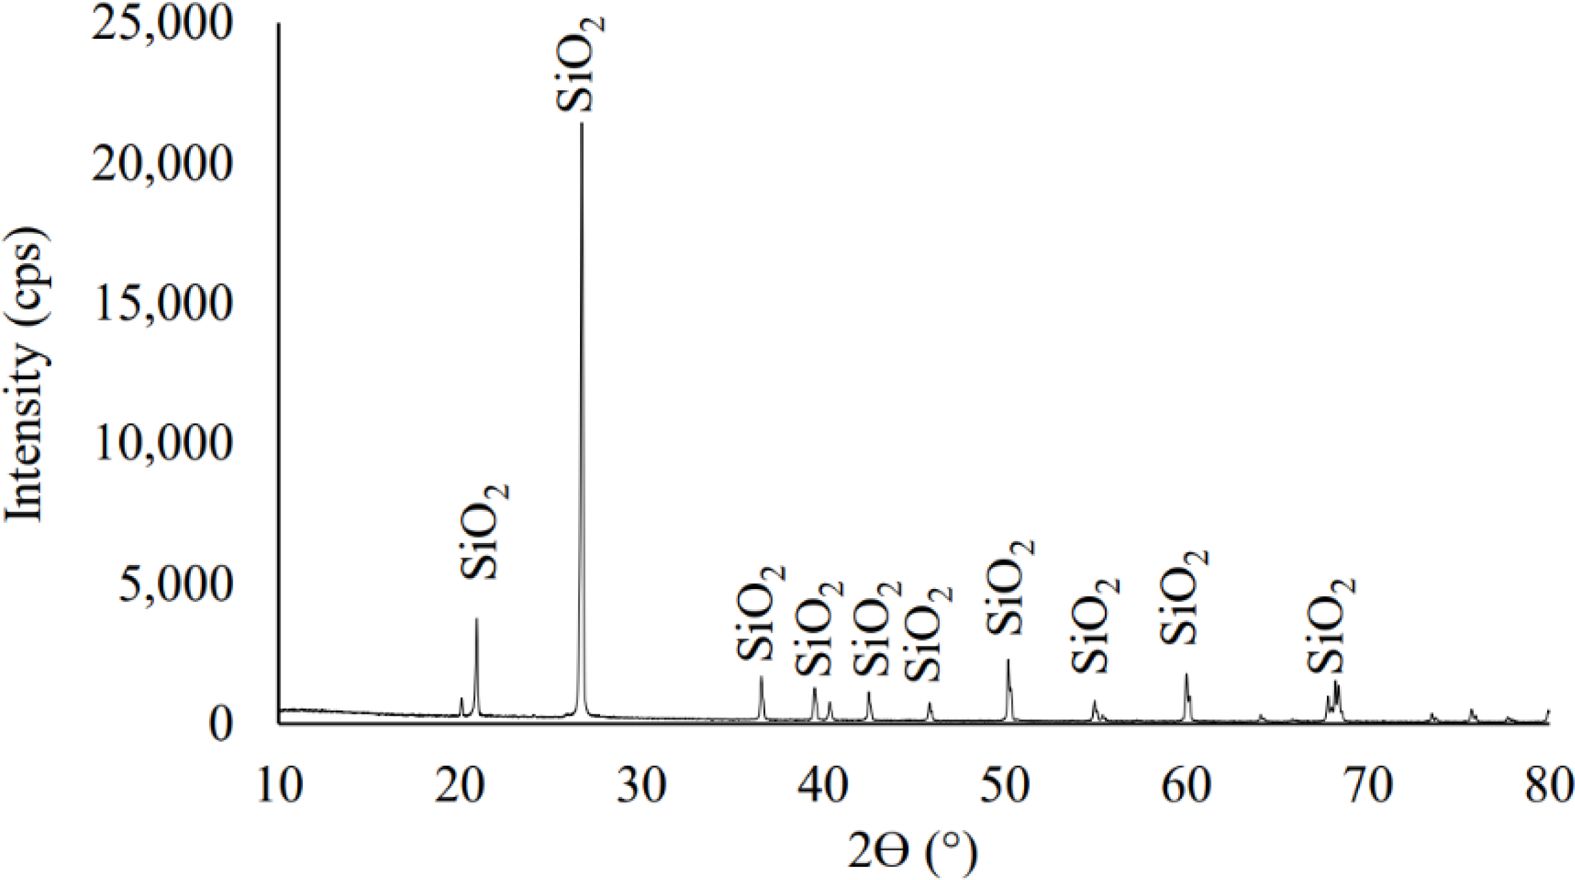
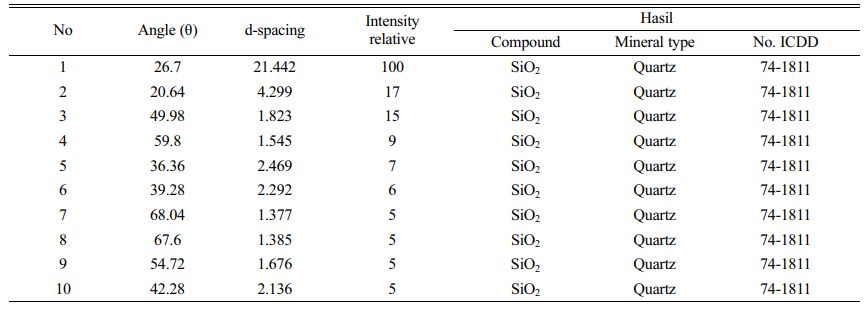
In order to make high purity silica precipitate, quartz sand from Kendawangan, West Kalimantan was chosen. It is known that quartz sand of Kendawangan has high content of silica and low content of the impurities. In order to use the quartz sand of Kendawangan, identification of the mineral structure contained in the quartz sand was performed using X-Ray diffraction (XRD). The result of identification is shown in Fig. 1. The result showed that almost all the peaks appeared have d-spacing of SiO2 which reveal that the quartz sand of Kendawangan consists of SiO2 crystals. This diffraction pattern indicates that the quartz sand the sample is dominated by quartz crystal phase with the highest peak at 2Ɵ of 26.7, this is in accordance with several previous studies that characterize quartz sand [22-25].
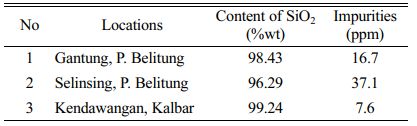
Table 2 showed the d-spacing result of quartz sand using XRD identification which revealed that quartz sand of Kendawangan contained high purity with SiO2 as a dominant compound. The impurities contained in the quartz sand cannot be identified using XRD because the intensity of the impurities is very small. We also measure the quartz sand from Kendawangan using gravimetric analysis and compare with quartz sand from Gantung and Selinsing, Belitung Island. The result of Gravimetric analysis is shown in Table 3.
Table 3 showed the result of gravimetric analysis which depicted that quartz sand from Kendawangan comprised the highest silica content about 99.24% compared with quartz sand from Gantung and Selinsing in Belitung Island. This means that quartz sand from Kendawangan has highest potential as raw material for solar cell than quartz sand from Belitung Island. Further analysis of the quartz sand from Kendawangan was done using atomic absorption spectroscopy (AAS) to know quantitatively of SiO2 content and impurities contained in quartz sand. AAS analysis can be used to analyze trace element quantitatively and accurately of the samples.
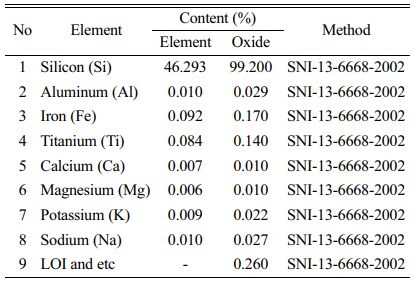
The result of AAS analysis is depicted in Table 4. AAS analysis result of quartz sand from Kendawangan indicates that the content of SiO2 in quartz sand of Kendawangan is high of 99.2% and this result has a good agreement with the result obtained from gravimetric analysis. By AAS analysis, the content of impurities can be identified quantitatively. It is depicted that the content of main impurity in quartz sand of Kendawangan is Fe, followed with Ti, Na, Al, K, Ca, and Mg.
Washing and Roasting Quartz Sand
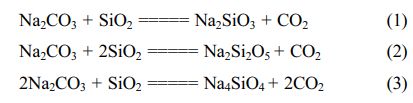
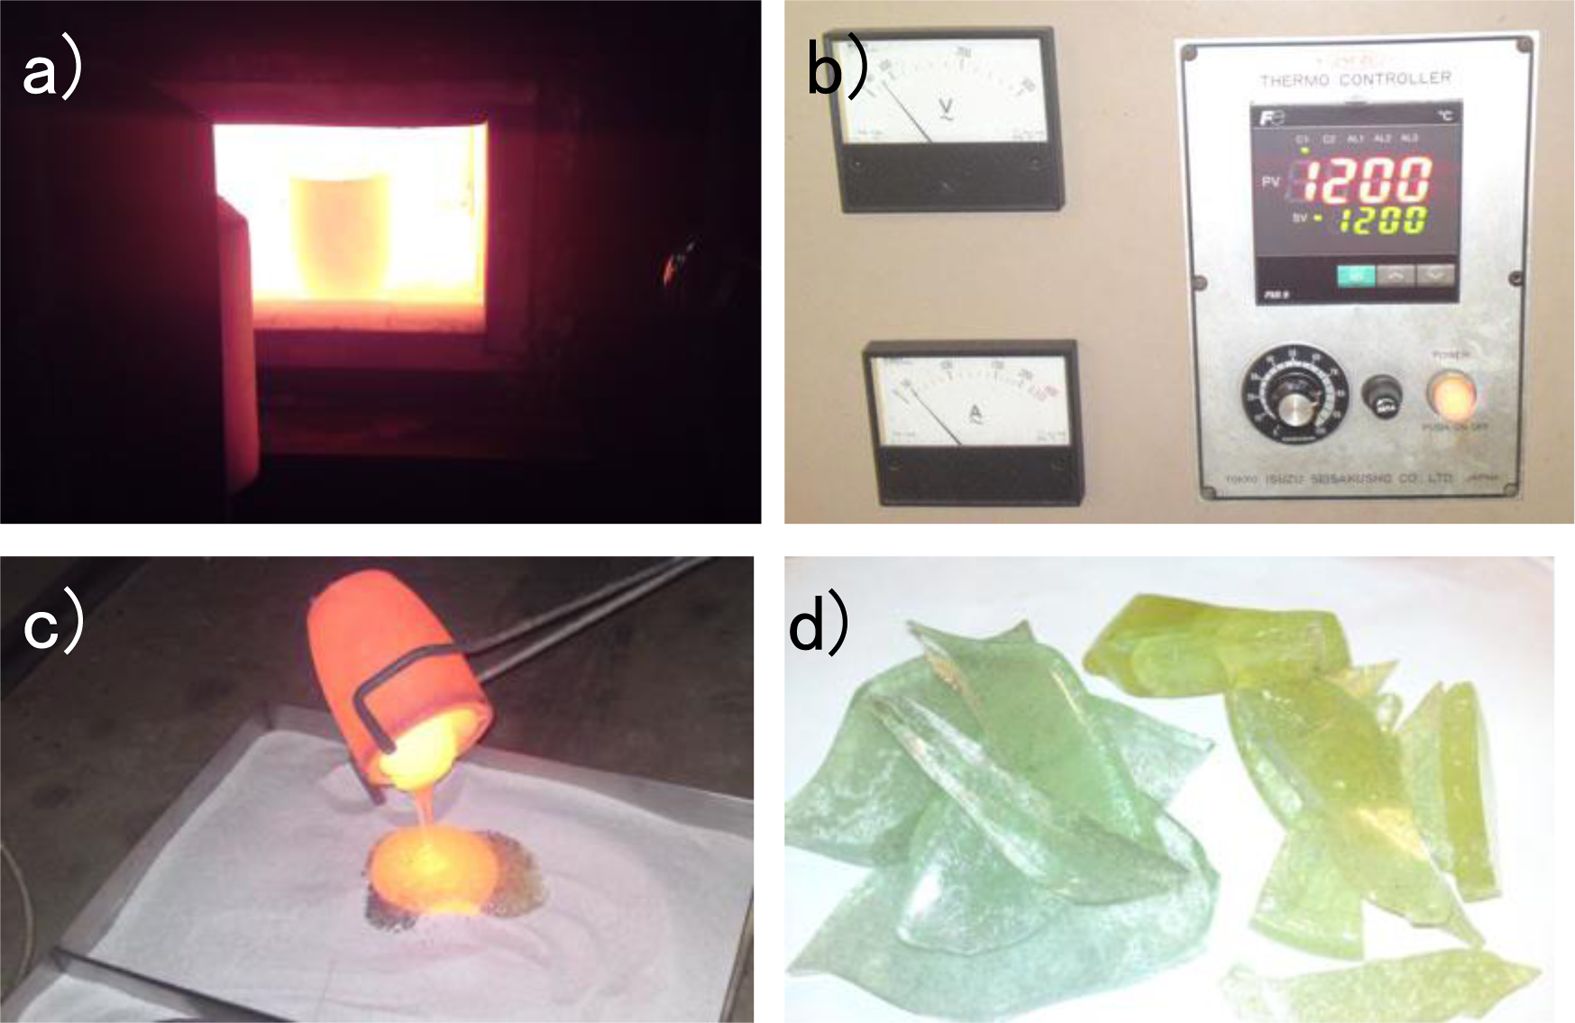
After characterization of quartz sand from Kendawangan, washing the quartz sand was conducted using water to remove mud and humus. Mud and humus will influence the roasting process so that the melt resulted from roasting will not be pellucid and also will affect to the dissolution of sodium silicate. The pellucid quartz sand resulted from washing was then roasted to form Sodium silicate. The roasting was done by mixing quartz sand with sodium carbonate. Aim of the roasting process is to transform silica particles into compound which can be dissolved in solution/water. The roasting process was performed using quartz sand and sodium carbonate with the comparison 55:45% of weight at 1200 °C for 2 hours. The roasting process and the result of roasting are shown in Fig. 2.
From the phase diagram, it is indicated that on the selected composition and temperature, silica in quartz sand will transform into liquid Sodium silicate. In the phase diagram, the weight fraction with 55% of SiO2, quartz sand starts to melt at 1080 oC forming sodium silicate which has high viscosity and will be difficult to be taken out from the crucible. By increasing the temperature until 1200 oC, the aqueous Sodium silicate can be taken out easily. After taken out from the crucible and poured on the plate, the viscous liquid of Sodium silicate then was cooled at room temperature forming hard solid crystal of sodium silicate with has specific colour depending on major impurities contained in Sodium silicate. The reaction in this step is :
Dissolution process of sodium silicates
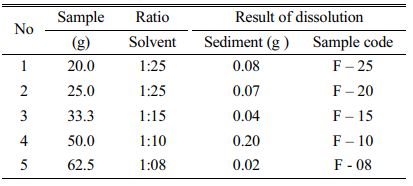
Hard solid crystal of sodium silicate resulted from roasting was then crushed by planetary ball mil to get sodium silicate powder in order to be easily dissolved in boiled water. The dissolution of sodium silicate is to remove the impurities and get high purity silicate precipitates. Dissolution process was conducted using variable of ratio between solvent (boiled water) and sodium silicate as shown in Table 5.
The result shows that F10 give the highest sediment of 0.20 g, which indicates that impurities can be removed by filtration, whereas the impurities of sodium silicate F8, F15, F20 and F25 dissolved in dissolution process. In order to get high purity silica precipitates, filtrate resulted from dissolution was added with chloride acid 1N and then washed with distilled water until pH became neutral. After that the solution was stirred to form gel. F25 could not form gel, this because the amount of concentration of chloride acid is lower and cannot precipitate silica in the solution. Gel of sample F 8, F 15, and F 20 then was centrifuged. Gel resulted from centrifugation was dried at 80 oC for 12 hours and 150 oC for 5 hours forming silica precipitates.
The result of gravimetric analysis in Table 4 shows that F 10 and F 20 give better result with content percentage of SiO2 are 99.7% and 99.8%, respectively. Based on this result, we choose F10 for further precipitation to remove the impurities in order to get high purity silica precipitates. F20 is not chosen, because the further process will need distilled water two times for this sample.
Leaching process using hydrochloric acid and further precipitation of sodium silicate
Leaching process is commonly used in the mineral treatment to clean mineral by solubilizing impurities using appropriate solvent [26]. There are several acid leaching agents that widely used such as HCl, HF, HNO3, H2SO4, H2C2O4 [26-29]. In this research, we use HCl as acid leaching agent because HCl is known as a cheaper and effective leaching agent. Leaching process in this work is important to be performed to remove impurities Al, Fe, Ti, Ca, Mn and Mg contained in silica precipitates resulted from dissolution. Besides that, this leaching process is aimed to remove sodium impurity. In the precipitation, sodium can dissolve forming sodium chloride and gel silica hydroxide will be formed floating in the solution. Gel then can be filtered to separate from sodium chloride and dried at 80 °C for 12 hours and 150 °C for 5 hours. The reaction in this step is:


However, sodium chloride can adhere into gel, so that sodium still remains in silica precipitates. Therefore we apply strategies to eliminate sodium impurity:
- Gel obtained from precipitation was washed again using aqueous chloride acid repeatedly
- The temperature to dry the silica precipitates was adjusted
- The concentration of sodium silicate before precipi- tation was managed to get soft gel granules so that it can be easily precipitated.
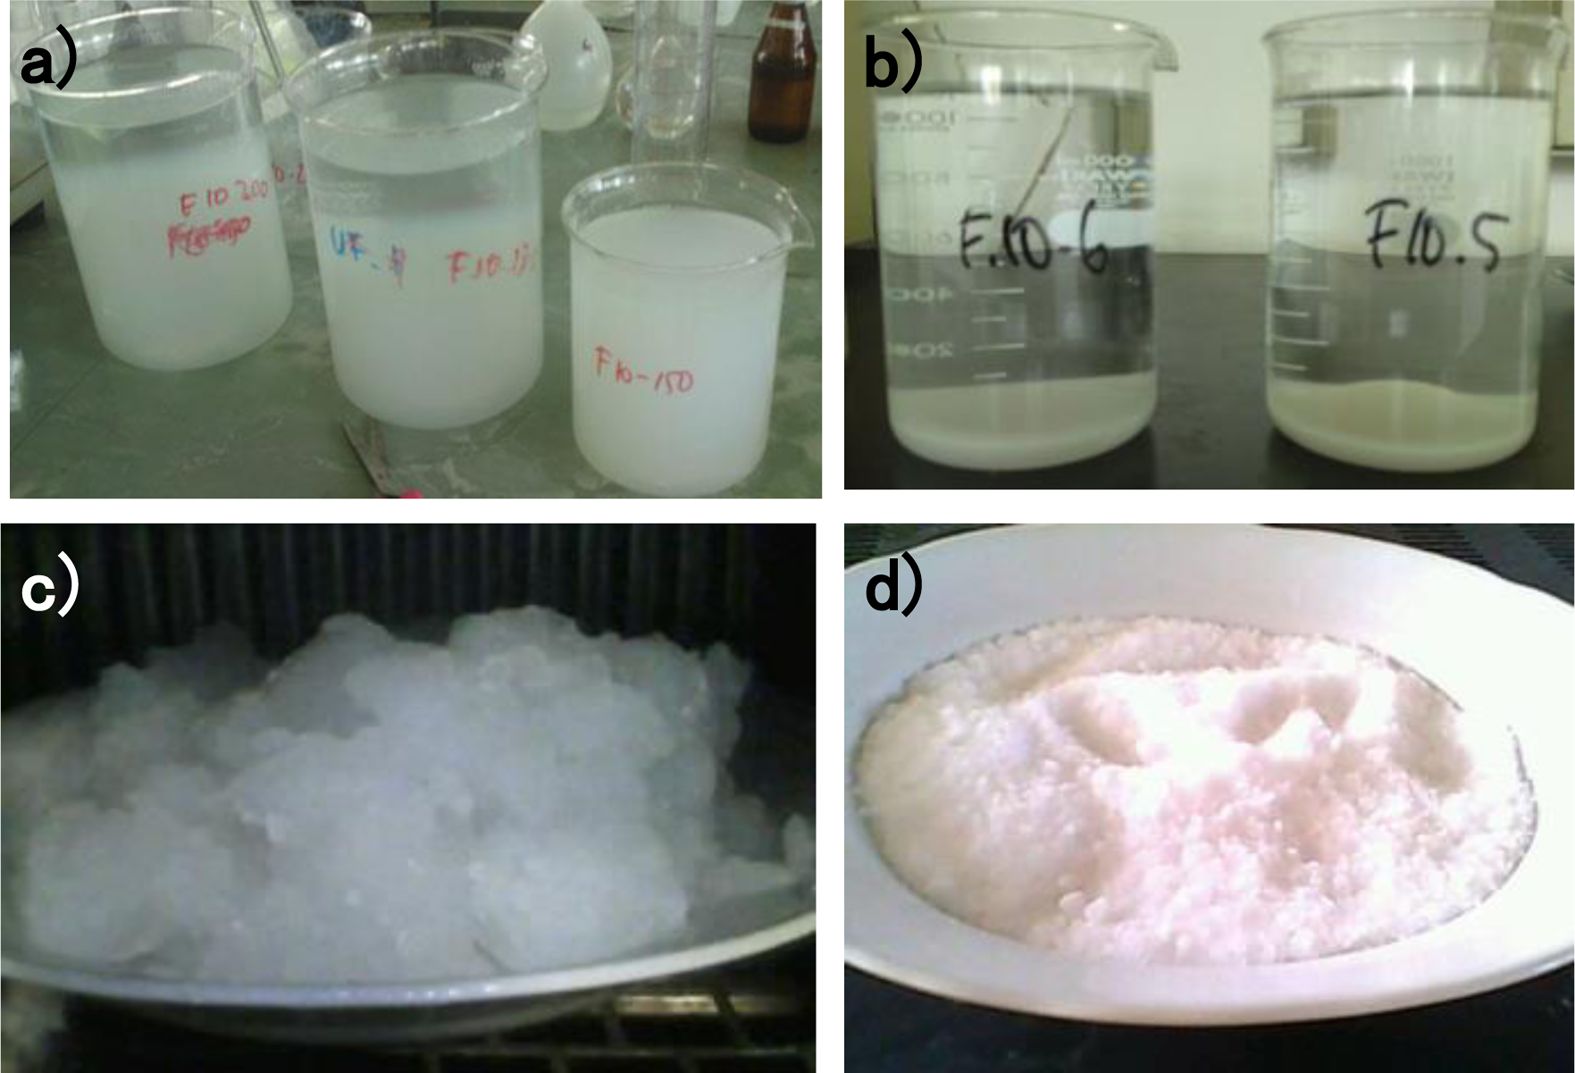
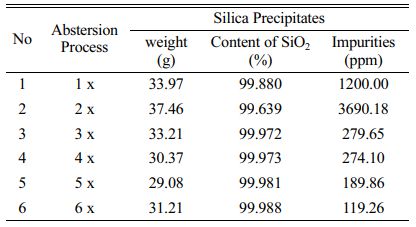
We used F10 to perform leaching process using concentrated hydrochloric acid (HCl 37%). The process was followed by precipitation and abstersion using aqueous of hydrochloric acid (with concentration of HCl is 1 M) forming high purity silica precipitates was shown in Fig. 3 and Table 6. The abstersion was done with different variables of number abstersion from one time to six times abstersion.
The result showed that the highest purity of silica precipitates gained after six times abstersion provided silica precipitates in high purity with content of SiO2 of 99.988% (99.99%). This very high purity silica precipitates are very promising to be applied for making solar grade silicon in photovoltaic device.
Characterization of silica precipitate
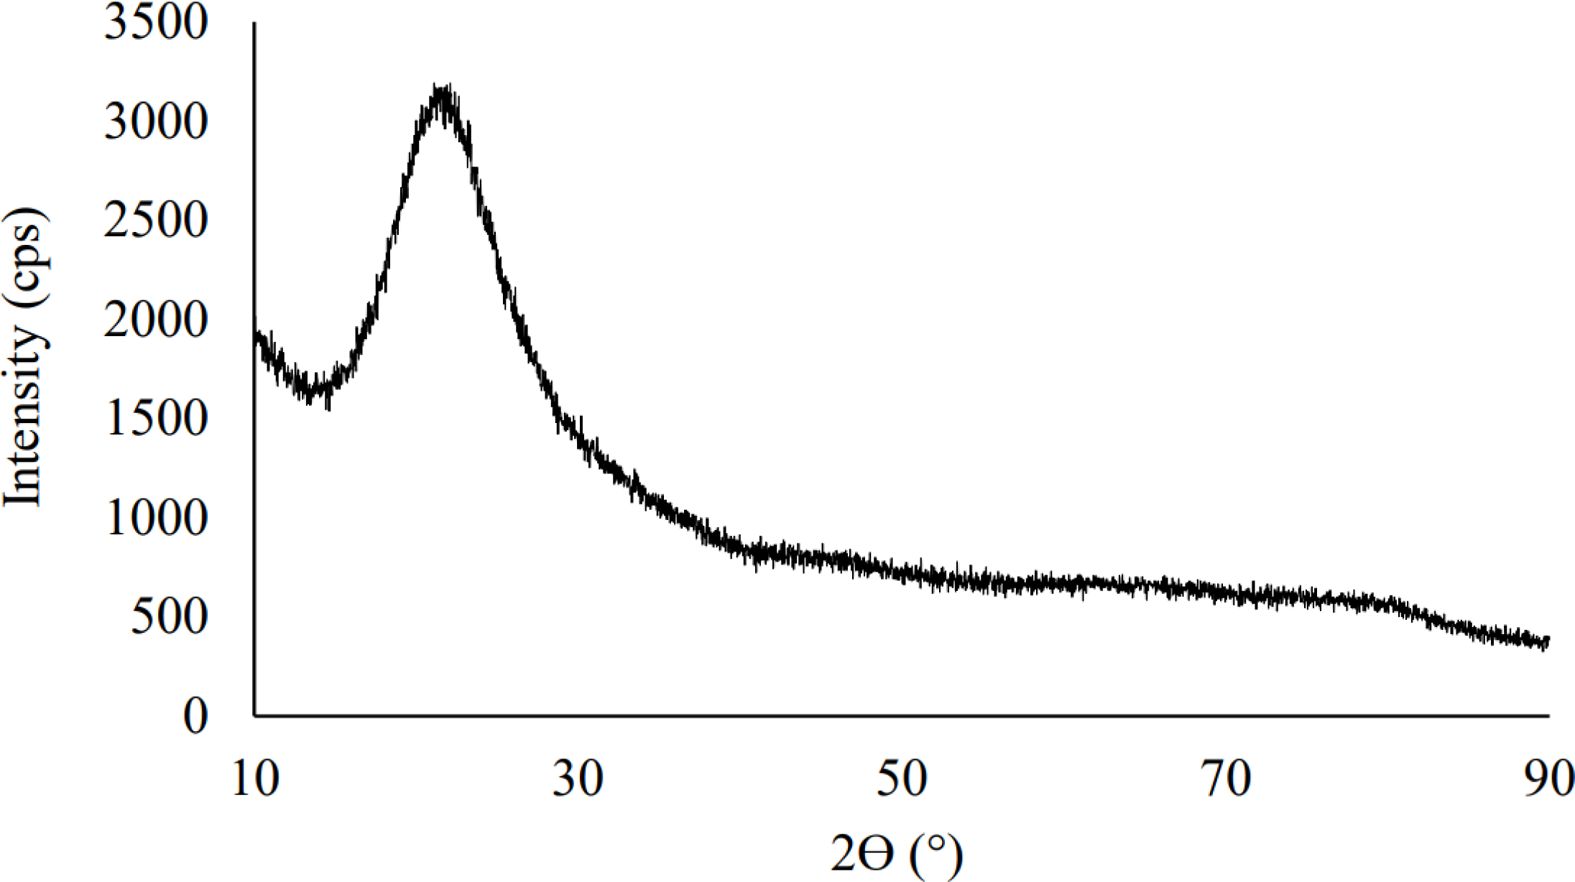
The resulting product was analyzed using XRD which is shown in Fig. 4. The results of XRD analysis of the processed silica produced from silica sand originating from Kendawangan, West Kalimantan showed a pattern that did not have sharp peaks and was an irregular pattern like a hump indicating the compound produced. namely silica precipitate in the amorphous phase. This result is very far from the composition of the silica sand sample which predominantly contains silica in crystalline form. The pattern from the XRD analysis graph shows a characteristic hump that has a peak width between 15 to 30o from a 2θ Bragg angle. This is consistent with several studies in the manu- facture of silica precipitates which state that the peak of the hump occurs at the 2θ Bragg angle, which is between 15 to 30o [24, 30-34].
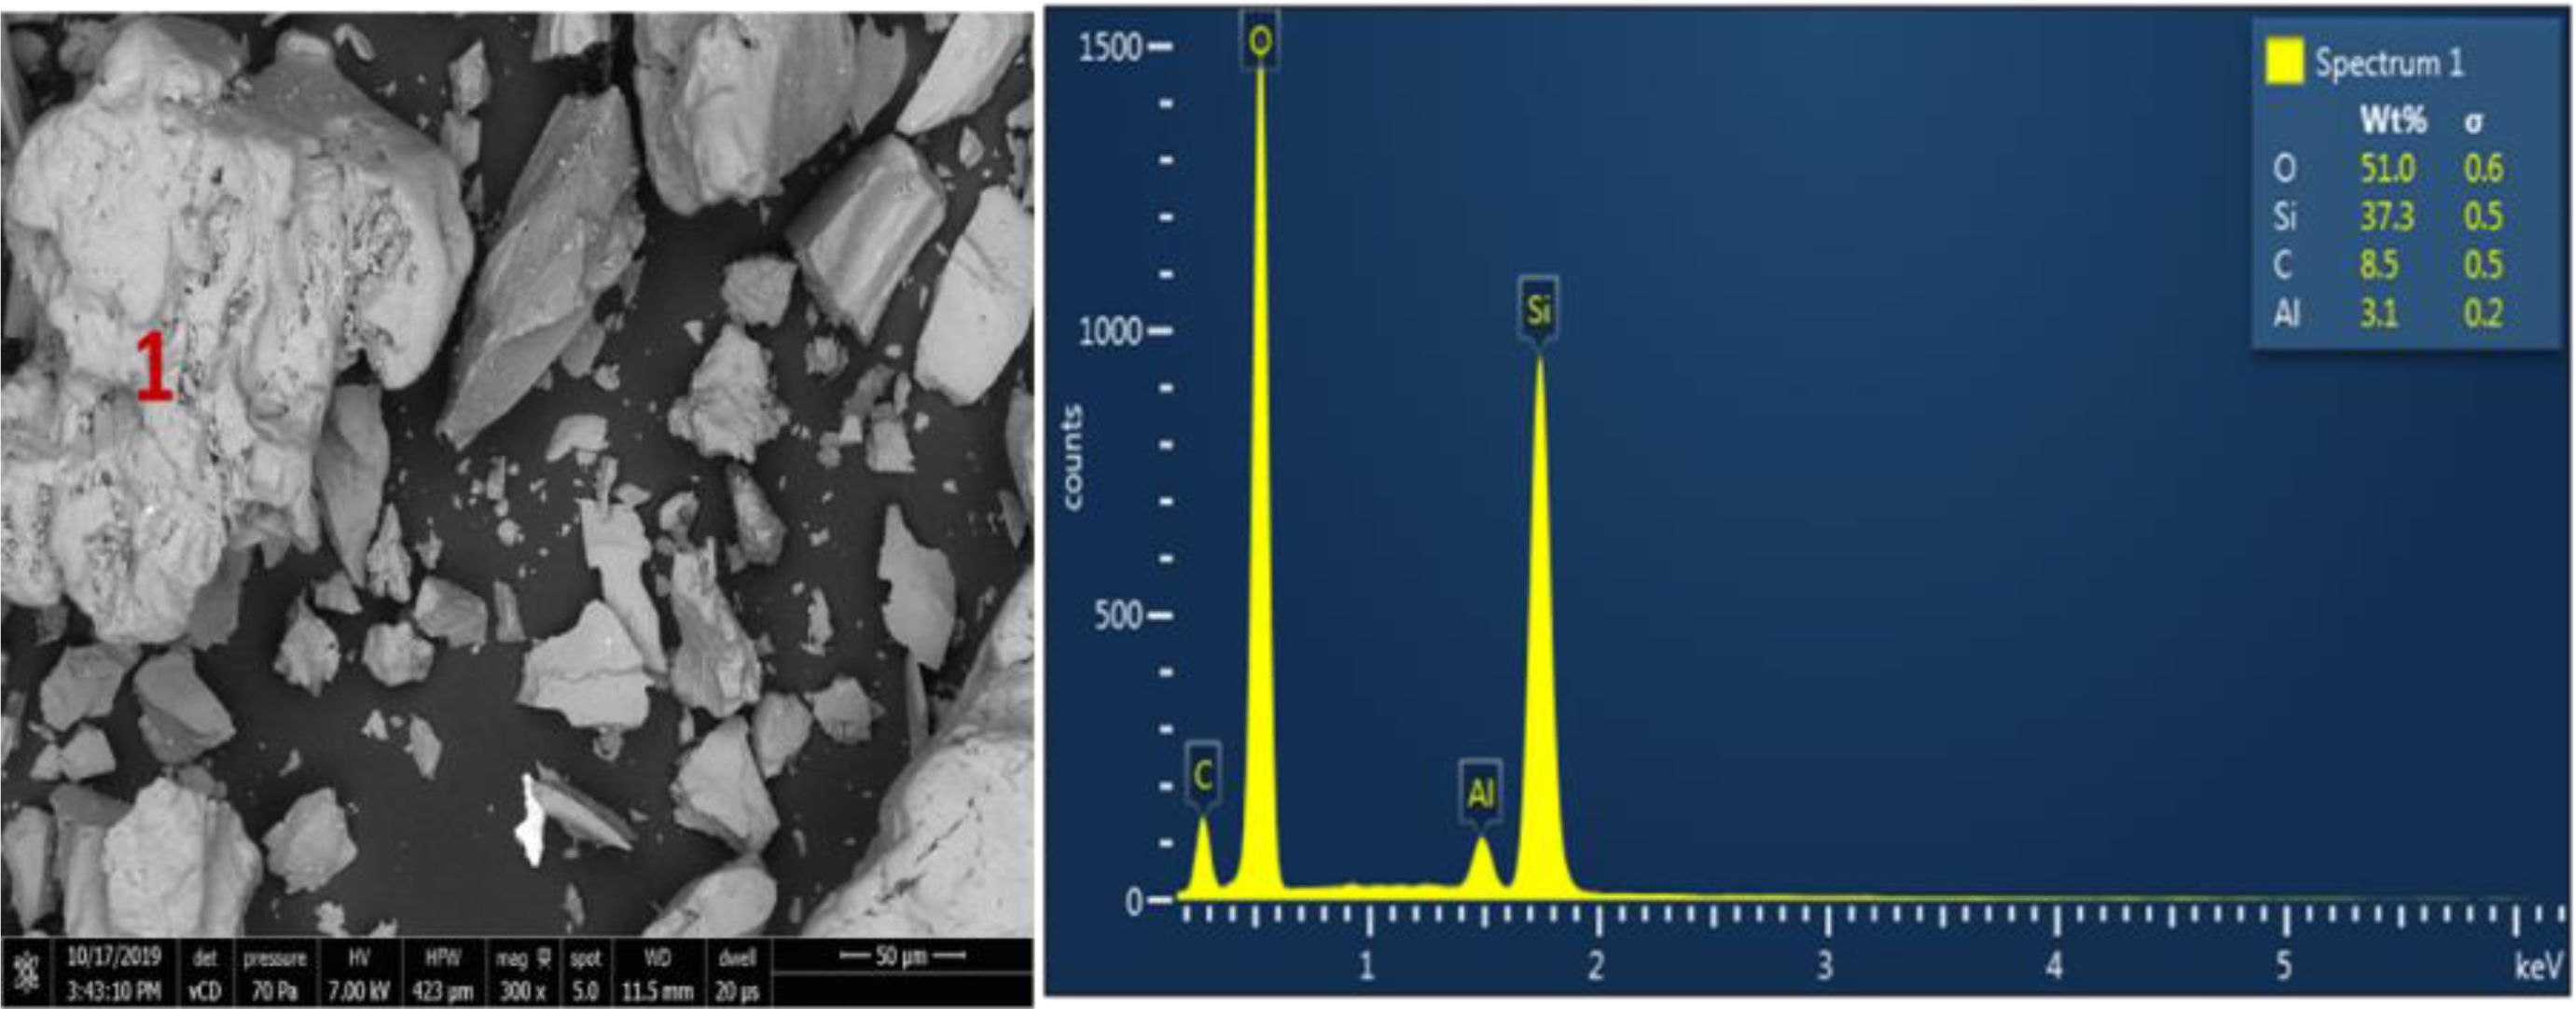
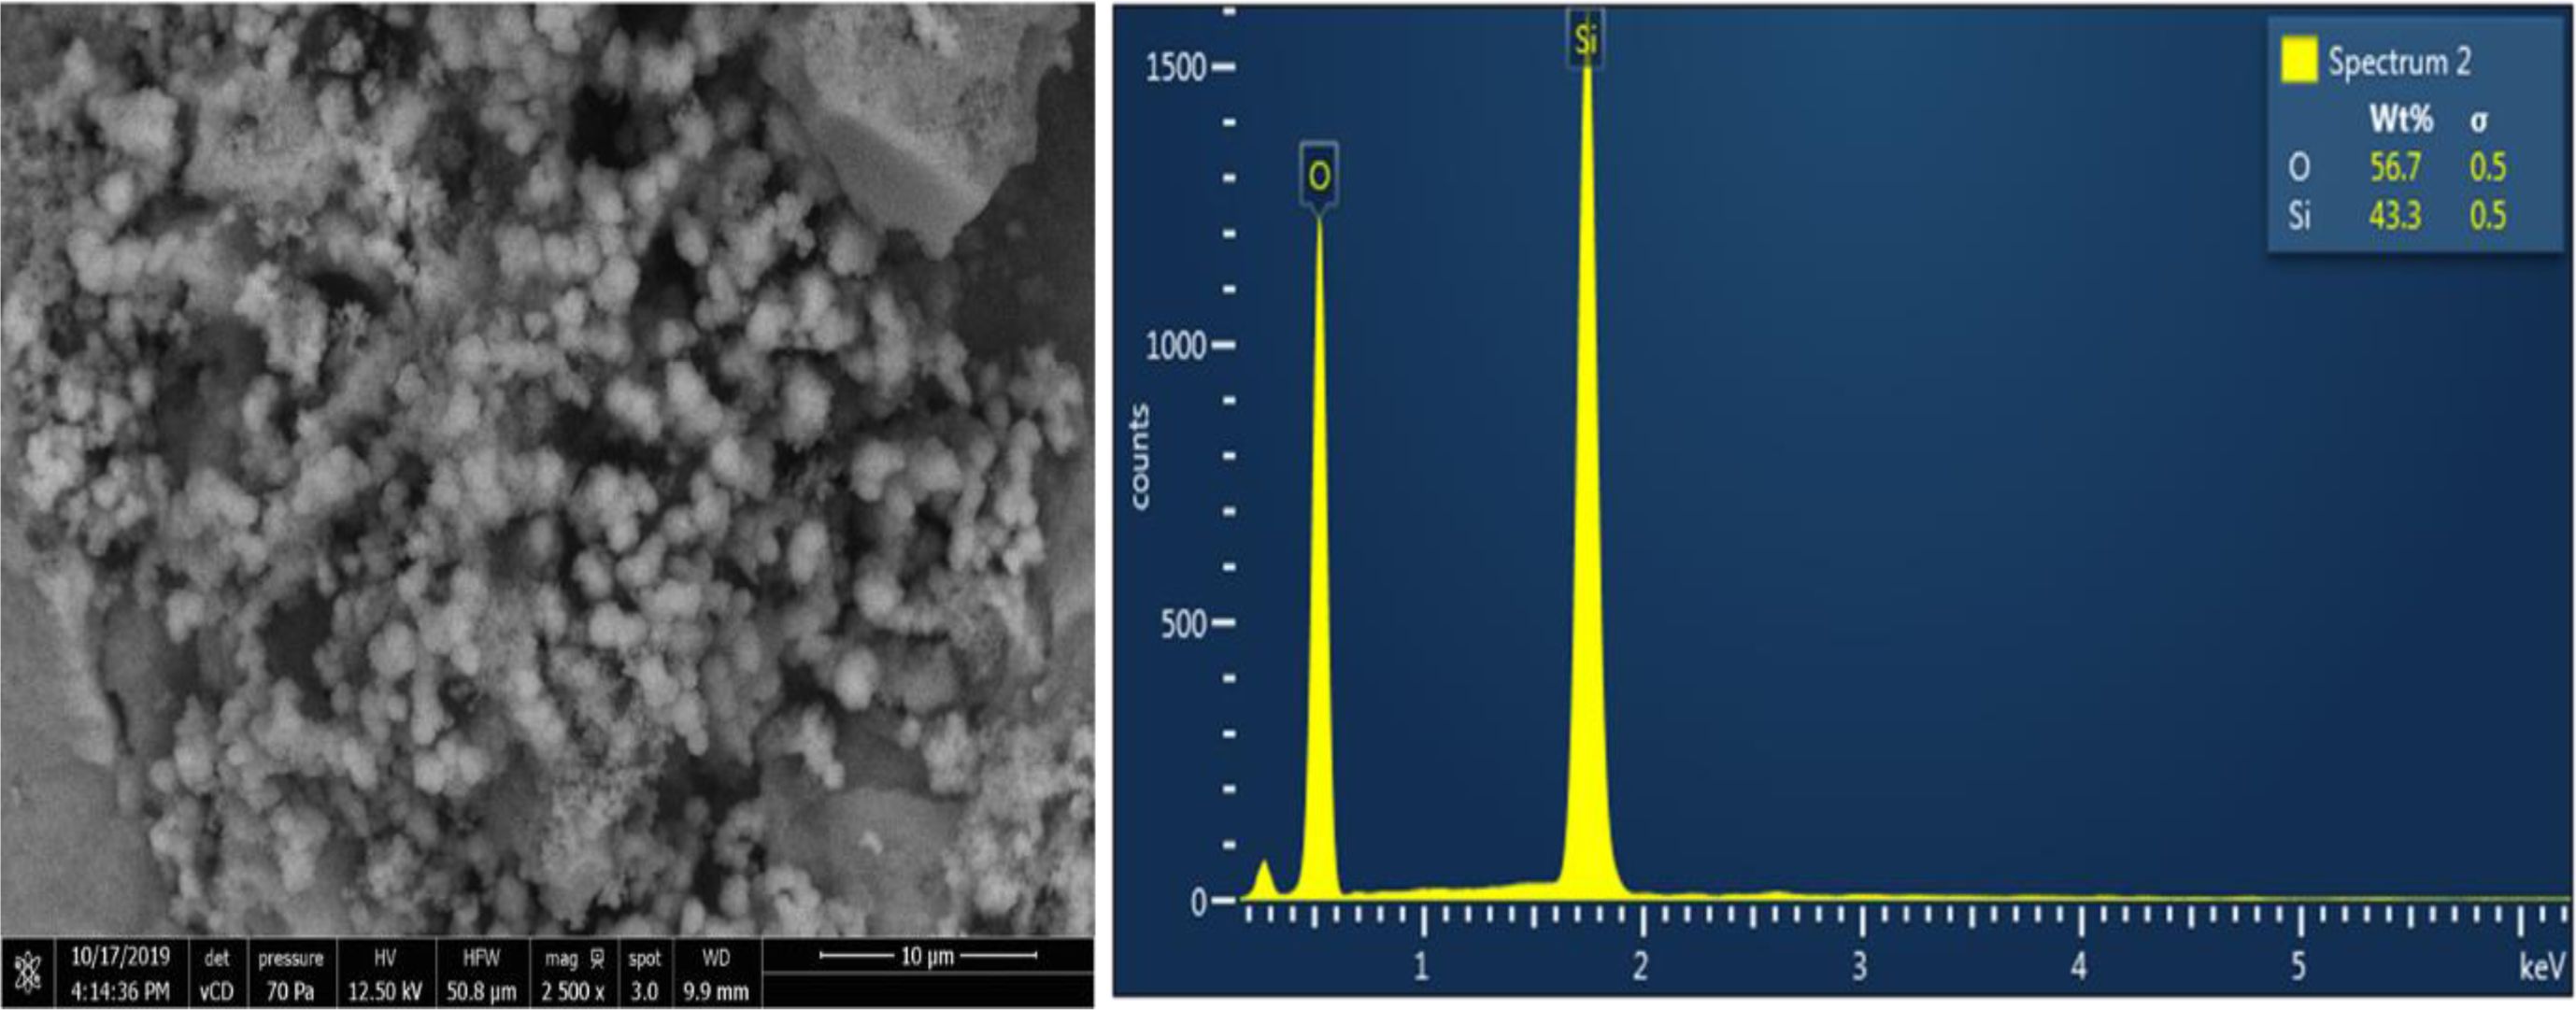
By seeing at the shape of the grains and EDX observation, it is observed that quartz sand grains are dominated by quartz and small impurities with Aluminum elements of 3.1%, and carbon 8.5%. The grains of silica precipitates is smaller and softer when it is compared with the raw materials of quartz sand. From the EDX observation, it is seen that the result of silica precipitates only contains Si element of 43.3% and oxygen of 56.7%. The impurities is not detected by the EDX which indicates that the product of silica precipitates have high purity of SiO2 content. Therefore, quantitative analysis is performed to confirm the purity of the product using micro gravimetry continued with AAS for the raw materials and ICP for the silica precipitates. Fig. 5 Fig. 6 Table 7
Analysis result by micro gravimetry and atomic absorption spectroscopy
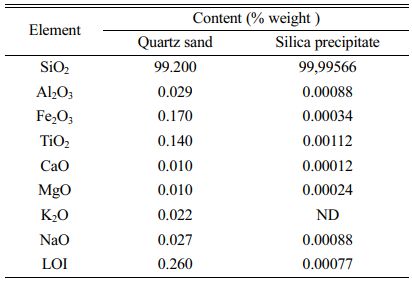
The measurement process with gravimetry was done by micro weighing the sample then the sample was added with excess hydrofluoric acid so that silica dissolved in hydrofluoric acid to form volatile silicon fluoride. The sample was then evaporated until it runs out so that the remaining dot was left in the bottom of the Teflon beaker. The dots are then weighed and then dissolved them in aqua regia solution until completely dissolved. Aqua regia solution was diluted and impurities analysis was conducted by AAS and ICP methods. The results of the combined analysis of micro-gravimetric analysis with AAS on Kendawangan quartz sand and prototype silica products with the purity of 99.99% by micro-gravimetric analysis with ICP can be seen in the Table 8.
The quantitative analysis shows that quartz sand from the left Kendawangan Village, Kendawangan District, Ketapang Regency has very good quality and fulfills the requirements for making solar grade silicon (SOG) or for silicon in electronic components. This is because quartz sand in this area has a range of SiO2 contents that meet the requirements of levels of 98.5-99.5%. By having a silica content of 99.2%, the precipitation process can produce silica precipitates product with purity of 99.99%. The analysis shows that TiO2 and Al2O3 elements are the most difficult to eliminate compared to other elements such as iron, calcium, magnesium and group I metals. This is because the elements TiO2 and Al2O3 have amphoteric properties so it is difficult to precipitate in advance and has a tendency to follow the nature of silica. The overall process of making high purity silica with 99.99% of SiO2 has been successful from raw materials of quartz sand from left Kendawangan Village, Kendawangan District, Ketapang District by eliminating impurities from 7,800 ppm to around 433 ppm.
|
Fig. 1 Pattern of XRD result for quartz sand from Kendawangan |
|
Fig. 2 The roasting process of quartz sand to form hard solid of crystal Sodium silicate: a) the condition of roasting quartz sand with sodium carbonate, b) the temperature for roasting process at 1.200 oC, c). The viscous liquid of sodium silicate resulted from roasting, d) After cooling at room temperature, the viscous liquid of sodium silicate become hard solid crystal which has different colour depending the major impurity in Sodium silicates. |
|
Fig. 3 a) Precipitation process of Sodium silicates, b) Abstersion of silica precipitates, c) Gel filtration and dryness process, d) High purity silica precipitates. |
|
Fig. 4 Pattern of XRD result for silica precipitate. |
|
Fig. 5 Results of SEM Mapping on Quartz Sand samples from left Kendawangan, Ketapang Regency (left), where items 1 was observed by EDX (right) |
|
Fig. 6 Results of SEM mapping on Silica Precipitates resulted from quartz sand of Kendawangan (left), and observation elements by EDX (right). |
|
Table 1 The measurement results of particle distribution with the Sieve Method. |

|
Table 8 The results of micro gravimetric analysis continued with the analysis of AAS and ICP. |
Process of fabricating high purity silica precipitates have been performed successfully. Fabrication high purity silica was conducted by roasting quartz sand and then dissolving the sodium silicate into boiling water followed by leaching, precipitation and repeatedly washing using hydrochloric acid. The result of the research indicated that the content of SiO2 yielded from the process showed purity superior to 99.99%. This high purity silica precipitates are very promising to be applied in domestic industry to provide raw material of high grade silicon in photovoltaic device.
The Authors would like to thank The Ministry of Education, Research and Technology for the funding through PDUPT SK No. 8/E1/KP.PTNBH/2021 and PPTI SK No. B-3452/III/PL.01.03/8/2021. The authors would like to acknowledge sophisticated analytical instrumentation facilities from ELSA (E-Layanan Sains) – National Research and Innovation Agency (BRIN) for the characterization of the materials.
- 1. A. Istratov, T. Boanassisi, M.D. Picket, M. Heuer, and E.R. Weber, Materials Science and Engineering: B 134[2-3] (2006) 282-286.
-

- 2. T. Saga, NPG Asia Mater 2[3] (2010) 96-102.
-
- 3. B.G. Gribov and K.V. Zinov'ev, Inorganic Materials 39[7] (2003) 653-662.
-
- 4. Y. Delannoy, Journal of Crystal Growth 360 (2012) 61-67.
-
- 5. J. Safarian, G. Tranell, and M. Tangstad, Energy Procedia 20 (2012) 88-97.
-
- 6. B.S. Xakalashe and M. Tangstad, Chem. Technol. (2012) (March): p. 6-9.
- 7. A. Kheloufi, M. Fathi, H. Rahab, A. Kefaifi, A. Keffous, and S.A. Medjahed, Chem. Eng. Trans. 32 (2013) 889-894.
-
- 8. E. Sulistiyono, M. Handayani, A.B. Prasetyo, Y. Irawan, E Febriana, S.N. Sembiring, and E. Yustanti, in IOP Conference Series: Materials Science and Engineering (2020) IOP Publishing.
-
- 9. S.W. Ui, S.J. Lim, S.H. Lee, and S.C. Choi, J. Ceram. Process. Res. 10[4] (2009) 553-558.
-
- 10. J.G. Song, F. Wang, X.B. Bai, D.M. Du, Y.Y. Ju, M.H. Xu, and G.C. Ji, J. Ceram. Process. Res. 12[4] (2011) 357-360.
-
- 11. N. Wicakson, J. Sains Teknologi 11[2] (2009).
-
- 12. H.R. Zulfikar, C. Wastoni, and T. Djadja, Prosiding Pemaparan Hasil-Hasil Kegiatan Lapangan dan Non Lapangan Tahun, (2008).
- 13. T. Muliyana, E. Putra, and Kabupaten Ketapang, Provinsi Kalimantan Barat (Pusat Sumber Daya Geologi-Badan Geologi), (2015).
- 14. H. Syaeful, K.S. Widana, and S. Sudarto, Kalimantan Barat. (2014).
- 15. A. Setyanto and M. Surachman, Bull. Mar. Geol. 32[1] (2017) 33-40.
-
- 16. J. Park, J.G. Yeo, S. Yang, and C.H. Chob, J. Ceram Process Res. 19[1] (2018) 20-24.
-
- 17. J.J. Liang, Q.H. Lin, X. Zhang, T. Jin, X.F. Sun, B.G. Choi, I.S. Kim, J. Do, and C.Y. Jo, J. Ceram Process Res. (2016).
-
- 18. A. Buttress, J.M. Rodriguez, A. Ure, R.S. Ferrari, C. Dodds, and S.W. Kingman, Miner. Eng. 131 (2019) 407-419.
-
- 19. J.A. Adebisi, J.O. Agunsoye, S.A. Bello, I.I. Ahmed, O.A. Ojo, and H.B. Hassan, Solar Energy 142 (2017) 68-86.
-
- 20. S. Wahyuningsih, A.H. Ramelan, N.S. Suharty, M. Handayani, F. Firdiyono, E. Sulistiyono, H. Munaroh, P.P. Sari, and Y.R. Kristiawan, in IOP Conference Series: Materials Science and Engineering, (2018) IOP Publishing.
-
- 21. S. Wahyuningsih, A.H. Ramelan, N.S. Suharty, M. Handayani, F. Firdiyono, E. Sulistiyono, E. Pramono, B. Sasongko, A.O.T. Dewi, and R. Hidayat, in AIP Conference Proceedings, (2018) AIP Publishing LLC.
-
- 22. A. Sdiri, T. Higashi, S. Bouaziz, and M. Benzina, Arab. J. Chem. 7[4] (2014) 486-493.
-
- 23. E. Sulistiyono, M. Handayani, A.B. Prasetyo, Y. Irawan, E. Febriana, S.N. Sembiring, E. Yustanti, F. Nugroho, and E.Y. Muslih, Eastern-Eur. J. Enterp. Technol. 3[6] (2021) p. 111.
-
- 24. E. Febriana, U.A. Manurung, E. Sulistiyono, M. Handayani, A.B. Prasetyo, Y. Irawan, E. Febriana, F. Nugroho, and E.Y. Muslih, in IOP Conference Series: Materials Science and Engineering (2020) IOP Publishing.
-
- 25. W. Trabelsi, M. Benzina, and S. Bouaziz, Phys. Procedia 2[3] (2009) 1461-1467.
-
- 26. K. Abdelkrim, B. Yassine, K. Aissa, and D. Najjib, in AIP Conference Proceedings, (2011) American Institute of Physics.
-
- 27. M. Khalifa, M. Hajji, and H. Ezzaouia, in EPJ Web of Conferences (2012) EDP Sciences.
-
- 28. F. Veglio, B. Passariello, and C. Abbruzzese, Ind. Eng. Chem. Res. 38[11] (1999) 4443-4448.
-
- 29. H. Kurama and S. Kurama, in 18th international mining congress and exhibition of Turkey-IMCET, (2003).
- 30. P.S. Utama, R. Yamsaengsung, and C. Sangwichien, Braz. J. Chem. Eng. 36[1] (2019) 523-530.
-
- 31. J. Martinez, S. Palomeras, G. Ortega, F. Ruiz, and Y. Chumakov, Mater. Lett. 60[29-30] (2006) 3526-3529.
-
- 32. S. Musić, N. Filipović-Vinceković, and L. Sekovanić, Braz. J. Chem. Eng. 28[1] (2011) 89-94.
-
- 33. S. Affandi, H. Setyawan, S. Winardi, A. Purwanto, and R. Balgis, Adv. Powder Technol. 20[5] (2009) 468-472.
-
- 34. S. Abualnoun Ajeel, K.A. Sukkar, and N.K. Zedin, in IOP Conference Series: Materials Science and Engineering (2020) IOP Publishing.
-
 This Article
-
2023; 24(1): 103-110
Published on Feb 28, 2023
- 10.36410/jcpr.2023.24.1.103
- Received on Jul 1, 2022
- Revised on Sep 16, 2022
- Accepted on Oct 12, 2022
Services
- Abstract
introduction
experimental methods
results and discussion
conclusions
- Acknowledgements
- References
- Full Text PDF
Shared
Correspondence to
- Murni Handayani a, Rini Riastuti
-
aNational Research and Innovation Agency, Puspiptek Area, Setu, South Tangerang, Banten 15314, Indonesia
Tel : +62 82114103137
dJohny Wahyuadi Laboratorium, Departement of Metallurgy and Materials, Universitas Indonesia, Depok 16424, Indonesia
Tel : +62 818-125-159 - E-mail: murni.handayani@brin.go.id, riastuti@metal.ui.ac.i
Clean-Energy Research Institute(CRI), Hanyang University, 222, Wangsimni-ro, Seongdong-gu, Seoul, 04763, Korea
E-mail: jcpr@hanyang.ac.kr