


- Performance of deep learning approaches for detection and classification of ceramic tile defects
D. Sivabalaselvamania,*, K. Nanthinib, S. Vanithamanic and L. Nivethad
aAssociate Professor, Department of Computer Applications, Kongu Engineering College, Perundurai, Tamilnadu, India
bAssistant Professor, Department of Computer Applications, Kongu Engineering College, Perundurai, Tamilnadu, India
cAssociate Professor, Department of Computer Applications, M.Kumarasamy College of Engineering, Karur, Tamilnadu, India
dAssistant Professor, Department of Computer Science and Engineering, Kongunadu College of Engineering and Technology, Thottiam, Tamilnadu, IndiaThis article is an open access article distributed under the terms of the Creative Commons Attribution Non-Commercial License (http://creativecommons.org/licenses/by-nc/4.0) which permits unrestricted non-commercial use, distribution, and reproduction in any medium, provided the original work is properly cited.
Ceramic tiles are in high demand in the infrastructure and building development industries due to their low cost, ease of installation, maintenance, moisture resistance, and availability in a broad range of colors, textures, and sizes. Automated facilities, which produce hundreds of tiles in every segment, require a tremendous volume of output. Because of the large number of tiles produced and the frequency with which they are produced, it is impossible to manually examine them for faults, necessitating the use of a rapid, efficient, and reliable automated process. However, while the process of detecting flaws and categorizing them (or classification) is not as efficient as it might be, recent advances in computing technology, mathematical modeling, and high-resolution picture capture equipment have given rise to new prospects in the subject. Many kinds of literature on using these systems for the same goal are currently accessible. Deep learning is a type of artificial intelligence that helps people makes decisions. In production applications, image detection of faulty Ceramic Tile Surfaces is a critical skill. Deep learning is now being studied for its potential application in automated defect identification. As a result, we propose Deep Learning approaches that take advantage of the transform domain properties of the tiles image. The model's capacity to learn via the system makes it versatile and dynamically customizable. Different deep learning-based fault detection and classification transfer learning approaches are examined in this study
Keywords: Deep learning, Classification, Ceramic tile images, VGG model, CNN
In manufacturing applications, defect detection is a vital capability to ensure quality. For a production process to be in control and run according to schedule, defect identification is essential. Based on the type and quantity of results, corrective measures can be made to make sure that process performance remains appropriate. These obligations might include everything from changing out a machine tool to doing routine maintenance on other parts. Defect identification may be viewed as occurring before the machine maintenance diagnostics phase. Defect identification is a crucial part of the inspection process since it decides whether a product generated by a process or provided by a supplier should be approved or rejected. It can also aid in the rework and repair of parts, reducing material waste. If errors are recognized early enough in some industrial processes, a feedback control system can be engaged. Defect identification processes are also necessary for developing process models that may be used to improve product quality. Previously, flaw detection was done by humans who had prior knowledge of the procedure. Automated defect detection is required to enable increased levels of automation in manufacturing operations.
One of the most common methods for detecting faults is to process and analyze photographs of surfaces containing problems. Automated surface defect identification has been the subject of several articles that combine traditional image processing methods with machine learning. When the defect patterns on the surfaces are continuous and the background is different from the defect, traditional image processing techniques can produce the expected results. In such circumstances, methods including edge detection, greyscale image threshold, and picture segmentation are frequently employed to enhance fault finding.
• Cracked Tiles
The major reasons for cracked tiles include heavy objects like pots and cans being dumped on the tiles, the use of inferior tiles, an inappropriate subfloor, improper cutting and handling, changes in the atmosphere, etc.
• Faded Tiles
Due to sunlight exposure or the use of unnecessarily harsh chemicals, tiles lose their sheen.
• Shade Variation in Tiles (Spot)
Shades of tile are the result of combining the tile's color and the way that color or ornamentation is distributed over the surface with other visual aspects of the tile.
• Chipped Tiles
Unintentionally, a large item falls upon the tile.
• Crazing on Tiles
The glazed surface of tiles develops hairline fractures.
• Warped Tiles
Heat has the effect of bending, twisting, or deforming tiles.
• Size Variation in Tiles
During manufacture, tiles shrink, and the amount of shrinkage varies from tile to tile, etc.
Model-based approaches are effective for images with little to no change in the flaws they detect. Because there are numerous forms of uncertainty in industrial settings, ranging from the severity of flaws to their shapes and sizes, it is vital to build procedures that can adjust to such extensive differences. Because of their tolerance to variation, learning-based methods are a better option than pre-programmed feature identification methods. Such robustness can be achieved using traditional machine learning approaches for classification and regression. Support vector machines (SVMs), K-nearest neighbors, Naive Bayes, Neural Networks, and Ensemble Learning are among the learning-based methods used. To learn the desirable faults, these approaches take into consideration statistical fluctuations in the defects in the images. One of the major drawbacks of such systems is that precise models are required to interpret fault patterns, and they may still be inadequately resistant to changes in texturing, lighting, defect complexity, and other factors.
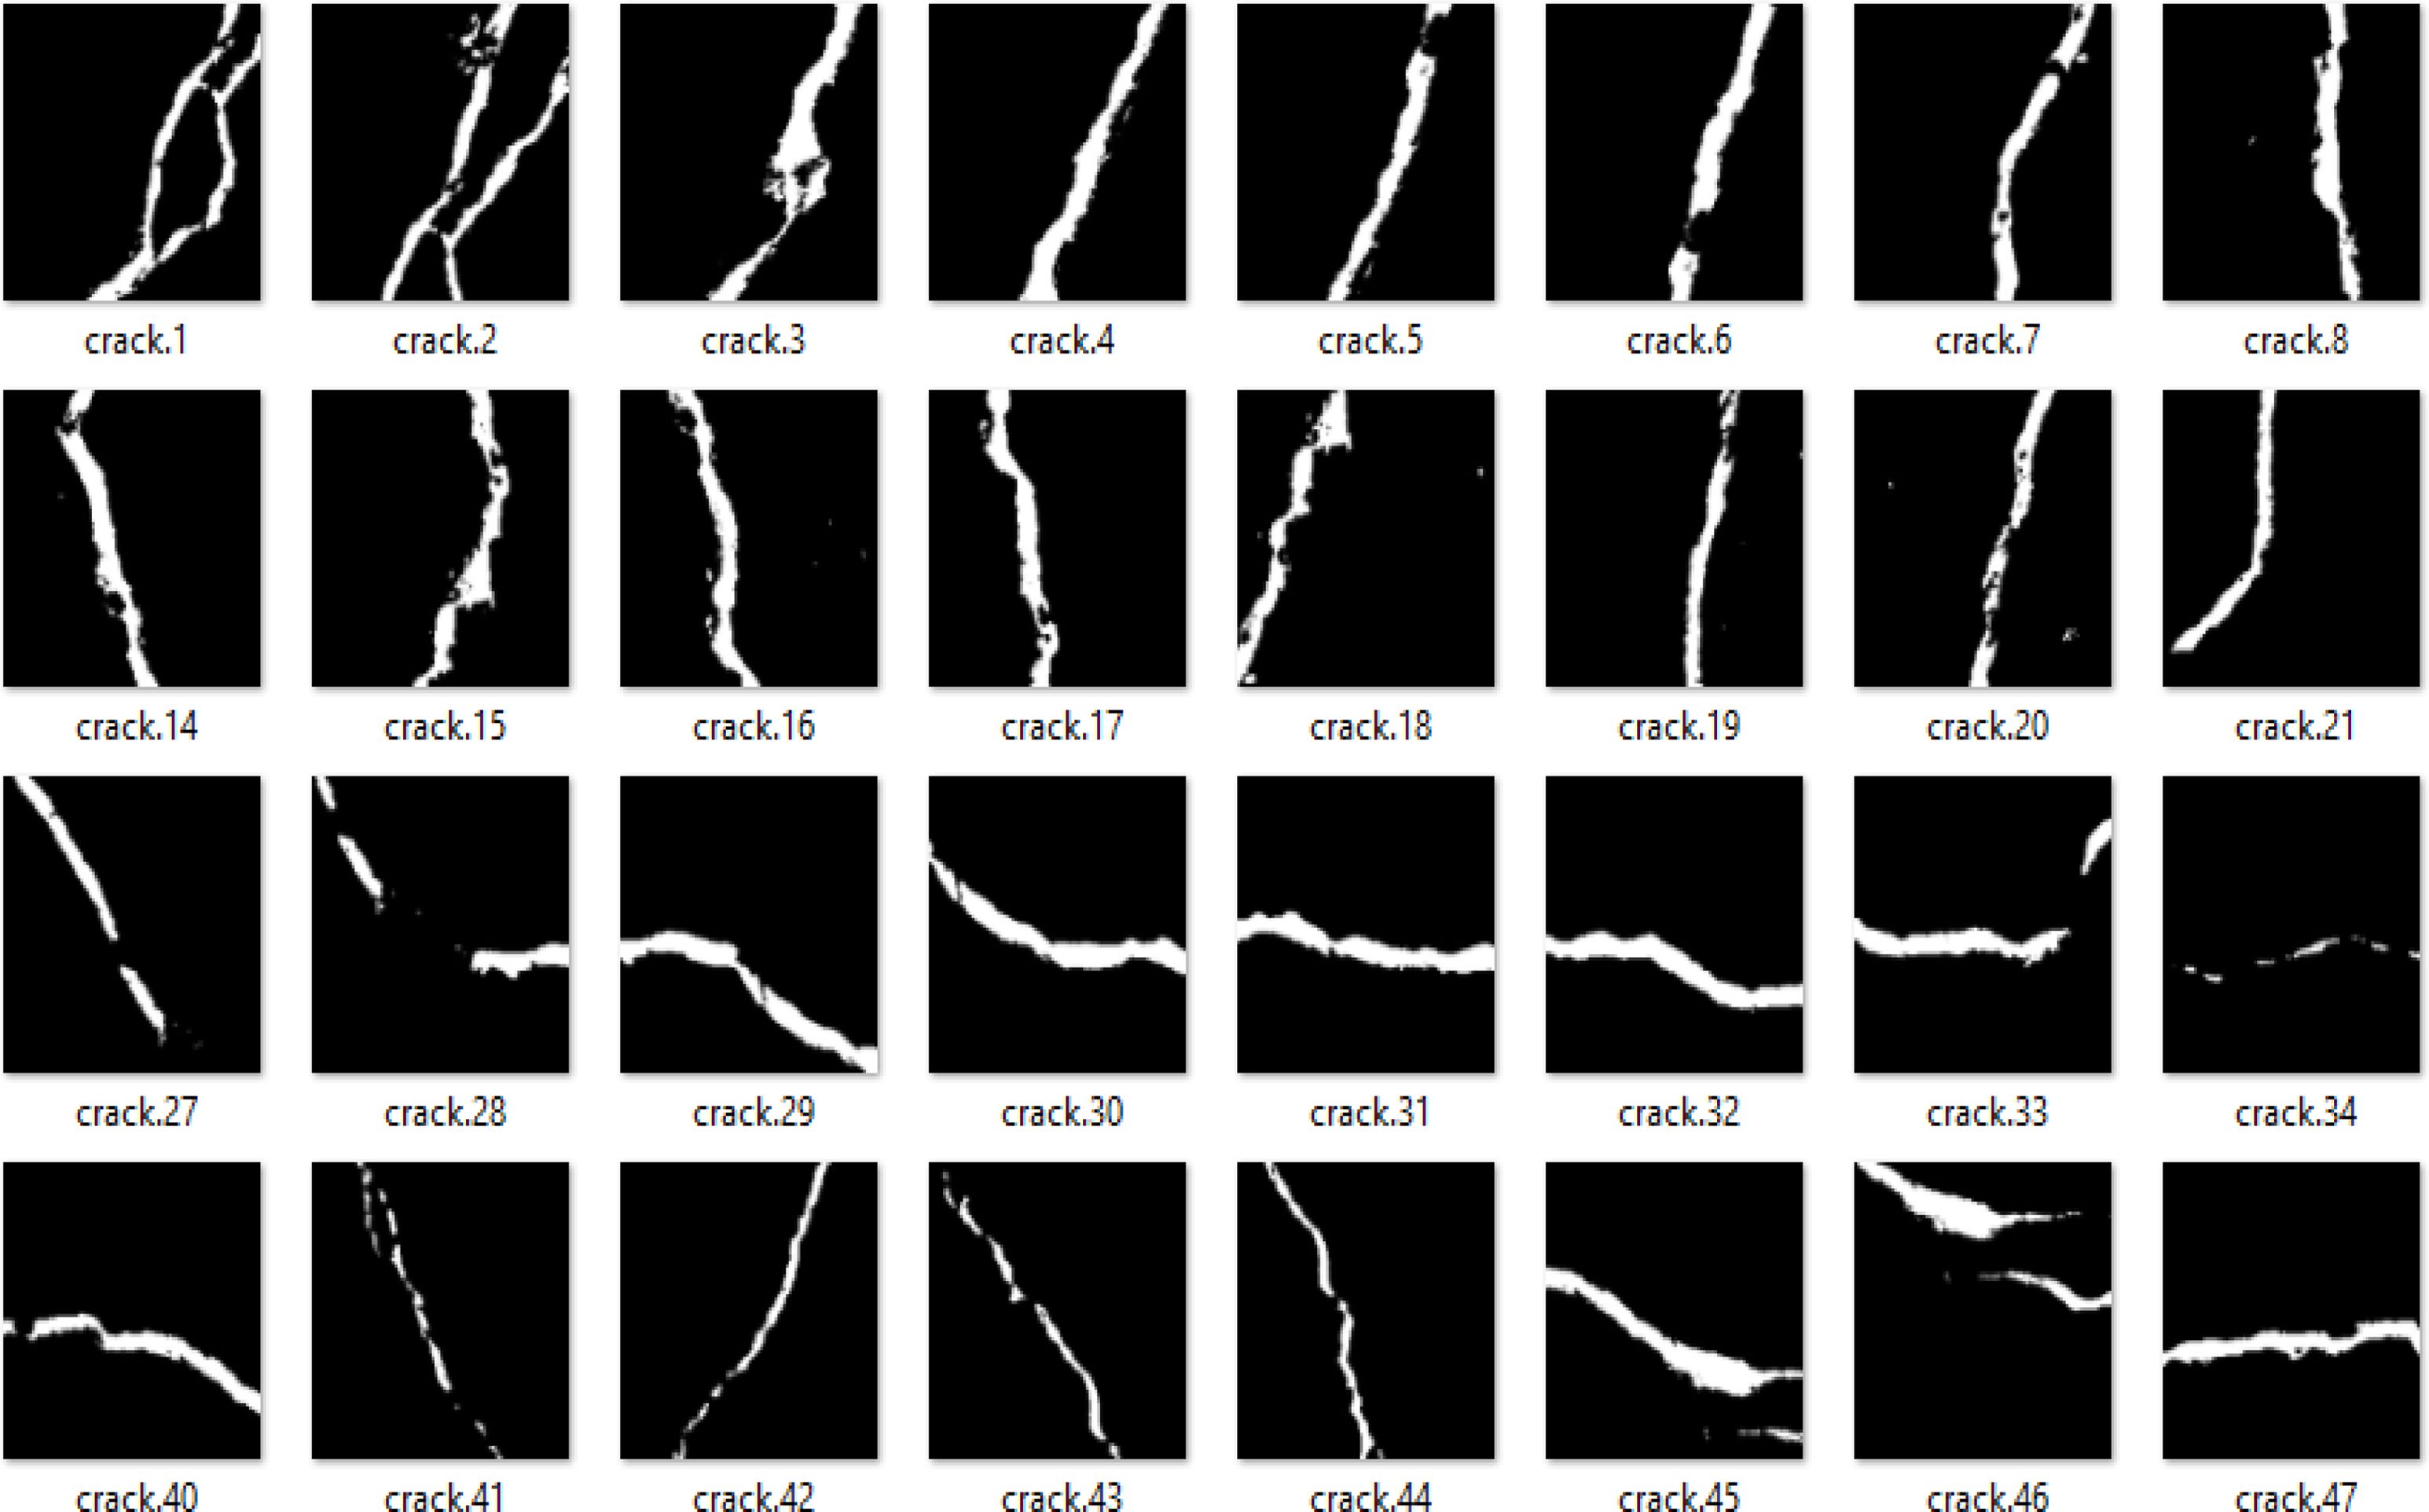
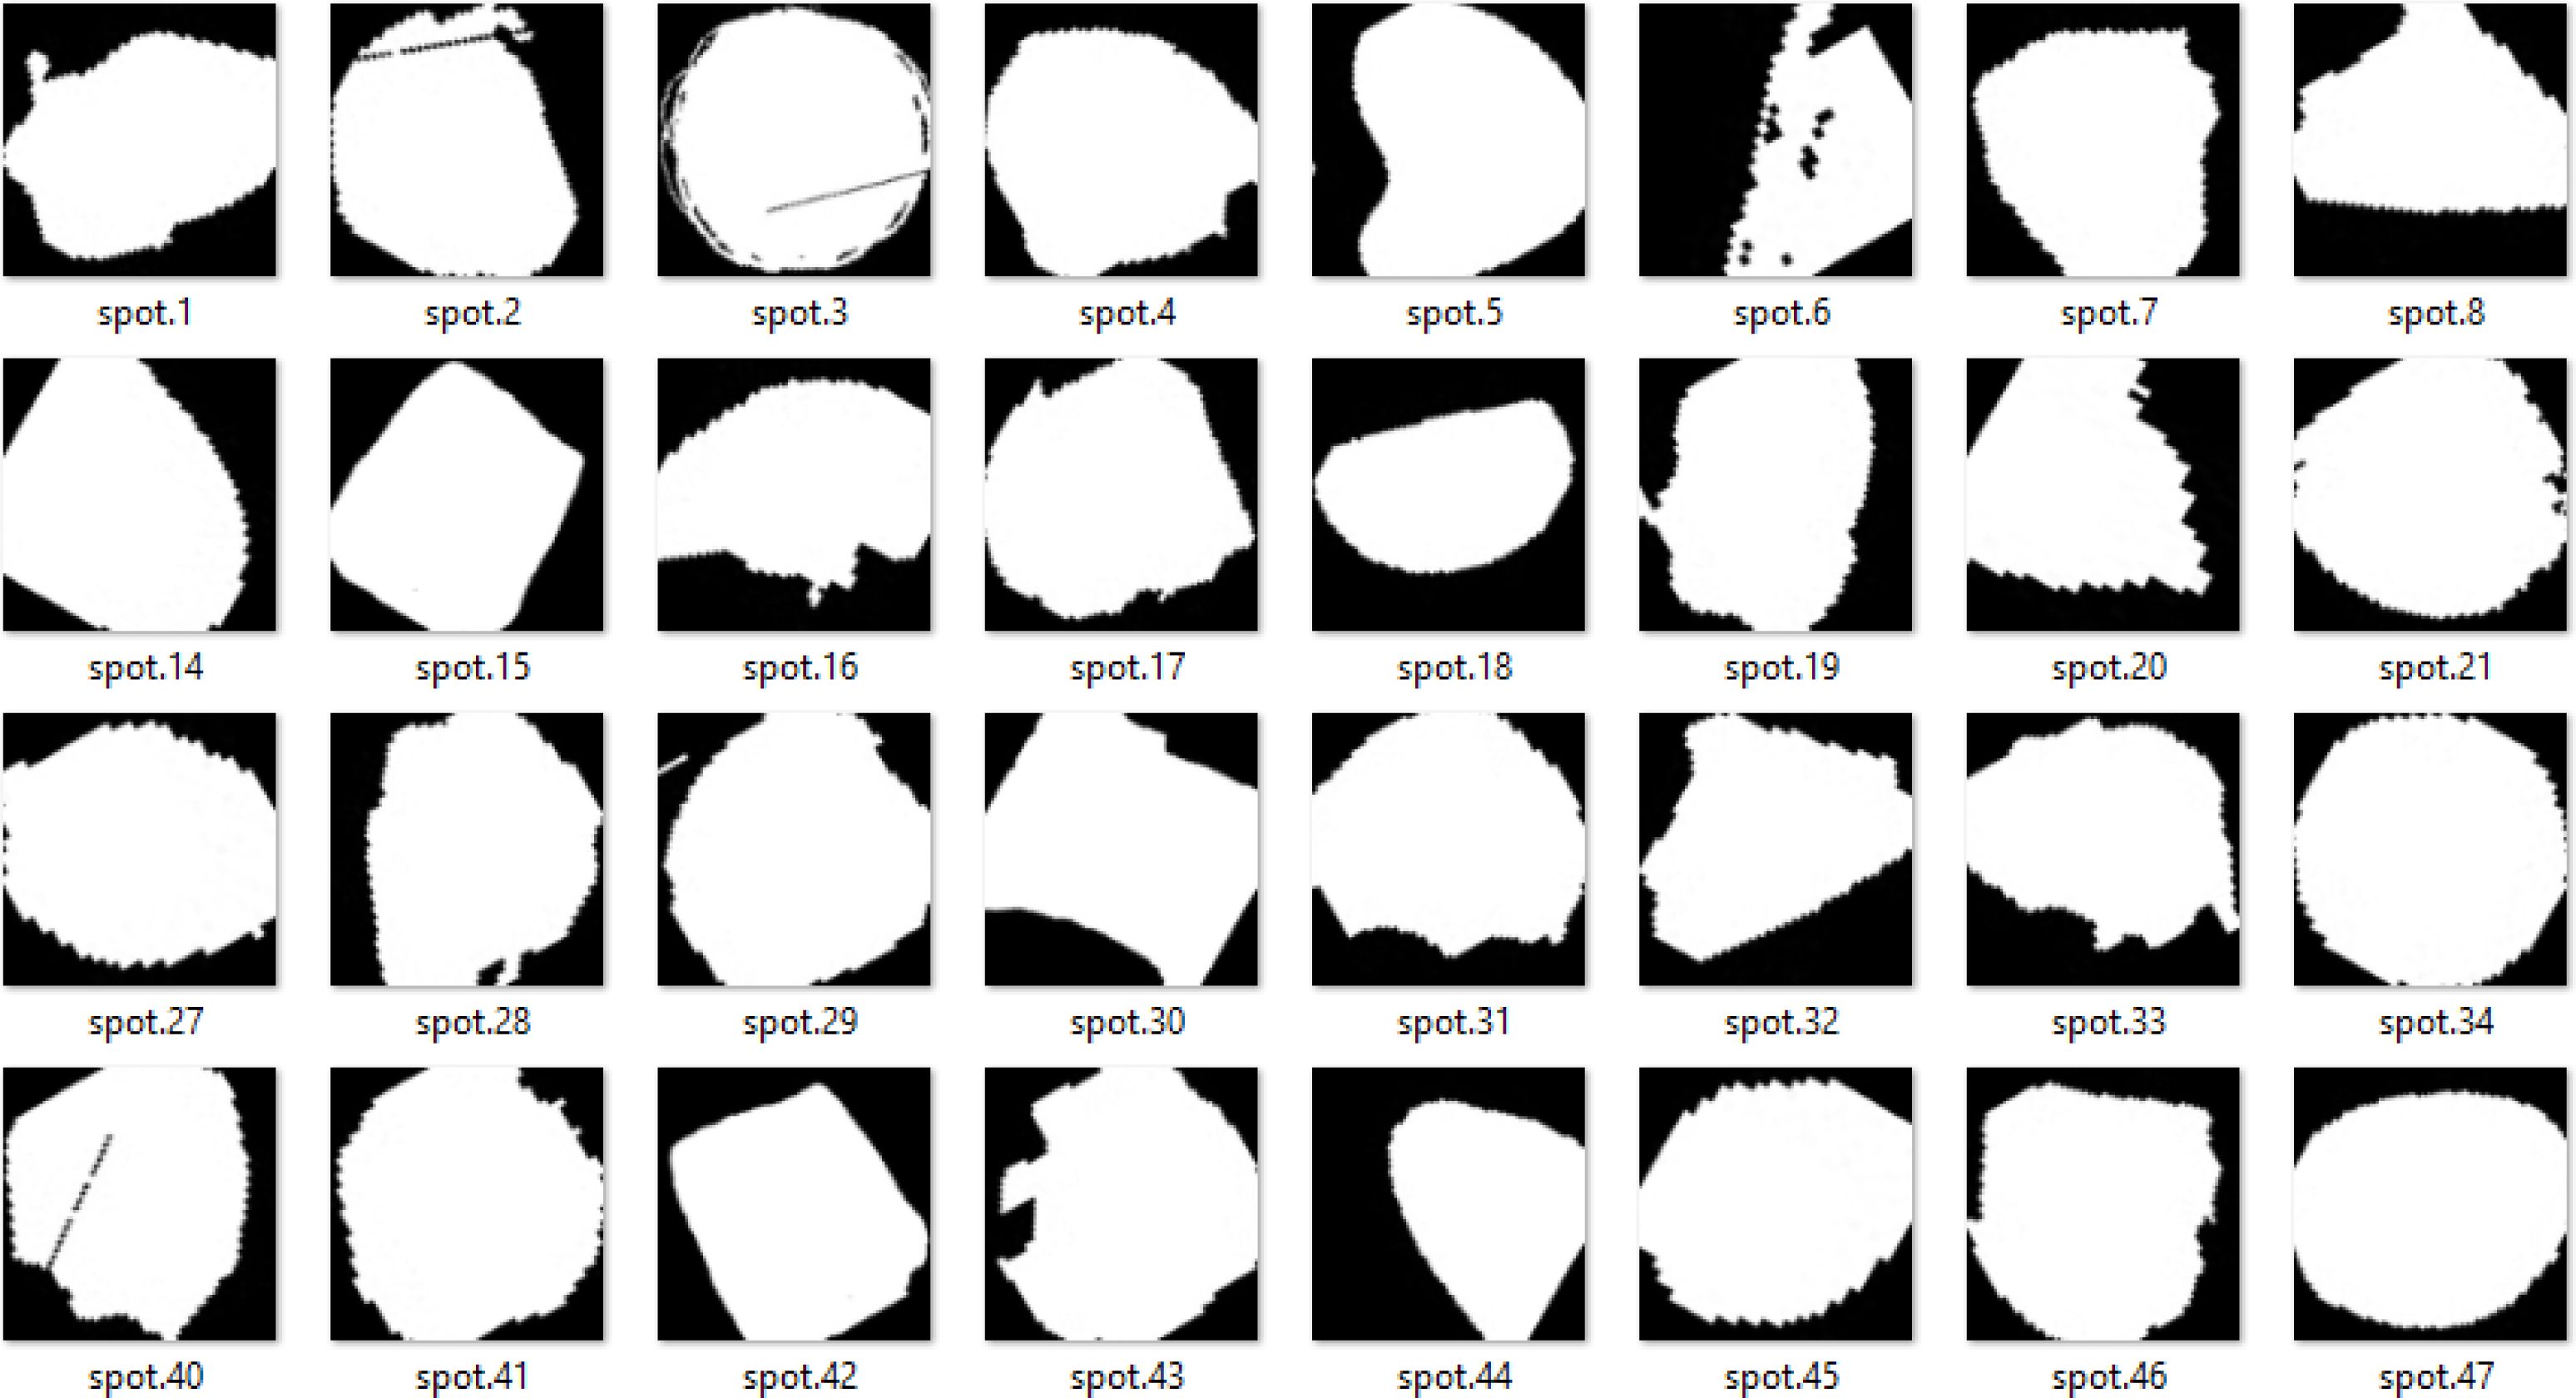
Deep learning has lately been shown to be incredibly successful in a variety of image-based applications, such as object detection and classification, facial detection, pattern recognition, defect diagnostics, target tracking, and many more. It has shown to be resistant to backdrop, lighting, color, form, sizes, and intensity when detecting patterns in pictures. This is very useful in industrial settings when detecting complicated surface flaws. Figure 1 and 2 depicts the different ceramic crack and spot images.
Furthermore, flaws must not only be discovered but also the exact size and type of defects must be determined.
Deep learning is one of the upcoming fields in computer science right now. We will first gather the photographs and then enhance them by resizing and modifying them in this procedure. Following that, we'll sort them into crack and spot image classes. We can differentiate them when we have completed dividing them into separate classes. We can distinguish the defective classes as cracks and spots of tiles once we've finished sorting them into distinct classes. We can name all types of defective photos individually according to their classifications, therefore our assessment's major goal is to identify the types of defective images. Additionally, no special code is required for teaching different sorts of faults. As stated in various publications reviewed in this paper, tagged data for diverse flaws combined with the proper network gives a very flexible defect detection system. Fig. 3
|
Fig. 1 Sample of Ceramic Crack Images |
|
Fig. 2 Sample of Ceramic Spot Images. |
|
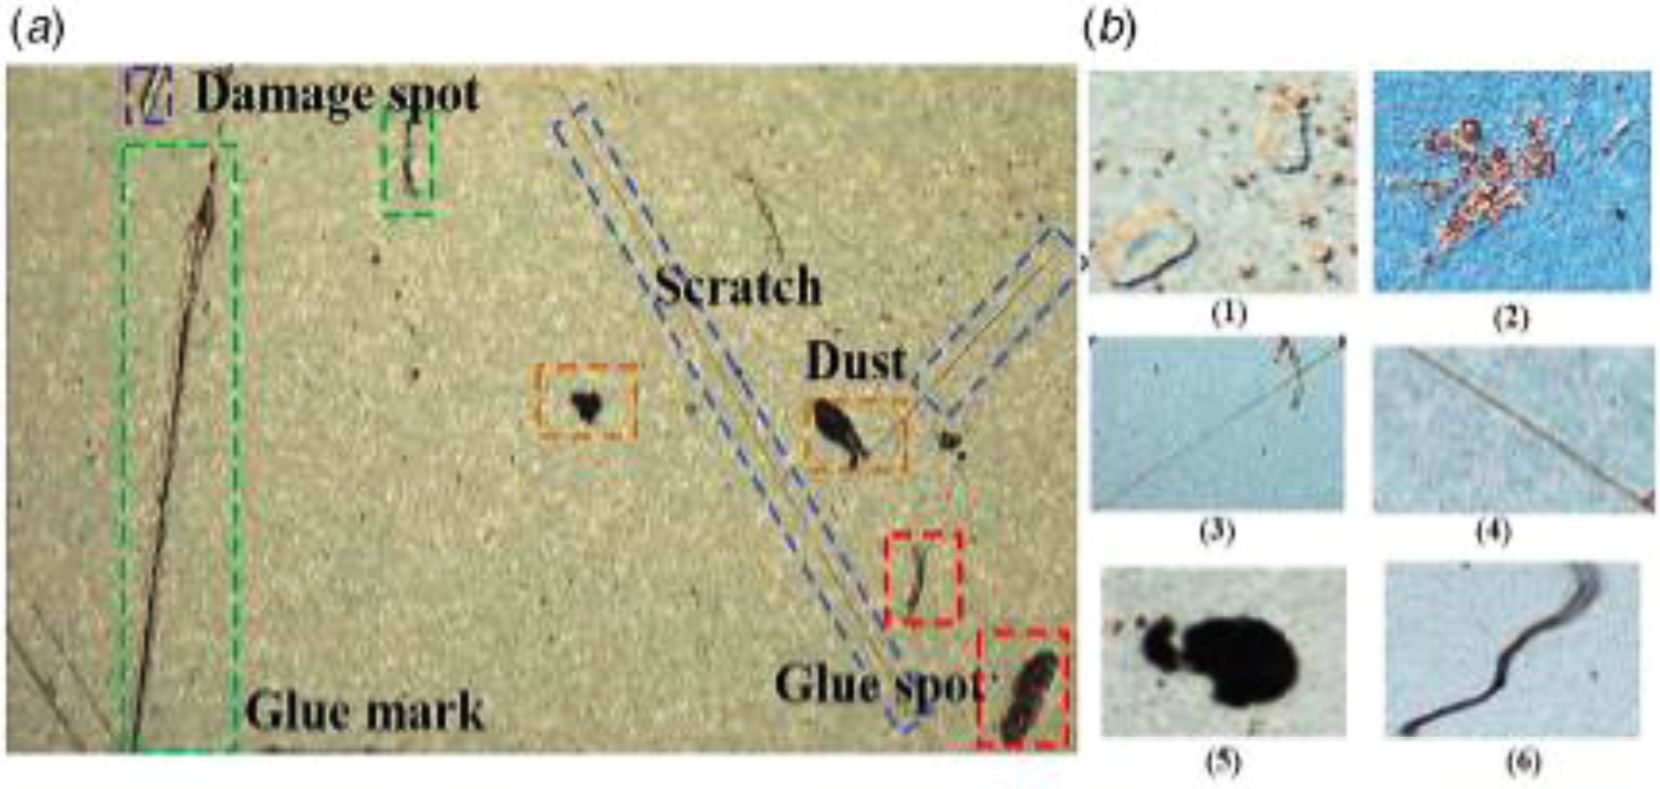
Fig. 3 Sample Images with Different Defects |
Workers in the ceramic tile industry must always labor manually to detect flaws in the tiles.
The following are some of the issues that can arise:
• There is a considerable risk of inaccuracy because they are manually detecting flaws with their own eyes. Second, at a ceramic tile plant, there are a lot of items, and manually inspecting them can be exhausting, making office workers dizzy. It always happens when someone iterates on the same type of task. However, because machines do not grow weary from completing a lot of work, they can do iterative work with greater accuracy and speed.
• Workers in the tile sector are prone to making mistakes during product inspection, whereas machine error rates are fixed.
• Finally, in the ceramic tile business, more workers are required to discover tile flaws, which are a cost issue, but a machine can lower the cost.
This work is concerned with the problem of using computer vision to do a programmed assessment of aesthetic tiles. The detection of abnormalities in finished tiles has been discovered to be an important area of programmed mechanical evaluation that has been largely overlooked by the current wave of machine vision research. First, we'll look at the benefits of the tile manufacturing sector. This is followed by a classification of common tile absconds. Following that, we examine various recently developed algorithms for detecting binary types of flaws in plain and completed tiles.
RQ: How can we tell whether an image is defective?
RQ2: Which model is best for detecting defects in tile images?
Surface quality is one of the most critical factors in establishing the perceived quality of a product in the ceramic tile manufacturing sector [1, 2]. Due to the human capacity to discern between acceptable and faulty tile surfaces, visual examination is frequently performed manually by operators [3-6]. Unfortunately, using human operators for visual examination has a number of drawbacks. In the case of mass-produced tiles, personally inspecting each tile's surface is time-consuming. To deal with this, military standards 105E sample procedures were discovered to be an alternate inspection approach [7]. The disadvantage of employing the sampling approach is that it increases the chance of allowing defective products to slip through the inspection procedure [8].
Another drawback of manual examination is the operator's human aspects. Due to weariness and repetition, the likelihood of human mistakes is likely to rise in inspection tasks that demand tedious and recurring behaviors [9]. Many research has attempted to automate visual inspection by utilizing Artificial Intelligence (AI) and Machine Learning approaches in order to solve the difficulties that result from manual quality assessment [10, 11]. Putri et al. used a fuzzy logic system [12] with Gray-Level Co-Occurrence Matrix (GLCM) feature extraction to identify ceramic tile surface imperfections. The research was able to accurately recognize 12 of the 13 test photos, yielding a 92.31percent accuracy rate. Sharma and Kaur [13] used a variety of machine learning algorithms to detect ceramic tile defects, including K-Nearest Neighbor, Support Vector Machine, and Bayesian Classifier. The study was able to achieve70.84 percent accuracy for each model using 24 samples of the test set.
Artificial Neural Networks (ANN) [14] are one the Machine Learning methods capable of creating complicated non-linear decision boundaries [16]. Provides an example of such an application, in which an ANN-based classification system was used to automatically detect weld flaws using 49 testing cases with a 97.96 percent accuracy. The model was able to achieve an average accuracy of 98.20 percent using 50 tiles samples. While various researchers have indicated that ANN is a capable model for detecting ceramic tile faults, more improvements may be made by assessing the dataset's pre-processing stage [17]. Finding a reduced dimensional representation of the image while still maintaining the critical information included within the dataset [18] is one way to enhance the model. PCA has been used as a feature extraction approach for visual inspection in several publications [19]. PCA was found to outperform GLCM feature extraction in one study in leaf categorization, with the accuracy of 98 percent and 78percent, respectively [20]. On a collected ceramic dataset. Compared with SVM (Support Vector Machine) and other deep learning-based models.
Faster R-CNN is the suggested model, the model's accuracy is 94.6 percent [21]. The ability to distinguish between microscopic cracked surfaces and typical tile demarcations might be valuable for automating visual examinations, which are labor-intensive, dangerous at high elevations, and time-consuming [22]. The categorization accuracy of human inspection techniques is around 99.43 percent. Using the CNFA method and predicted average accuracy of 98.19 percent, classify faulty and non-defective tiles [23]. The primary goal of this study was to reduce the pinhole problem while improving the surface quality of glossy, opaque floor tile glazes [24]. Overview and thorough discussion of the influence of ceramic sand particles on the majority of casting defects [25]. Some locations are ineligible for usage in the ceramics industry due to their high alunite concentration. Kaolin must be processed to eliminate the alunite before it can be utilized in the ceramics industry [26]. In order to estimate the refractory material wear in the BOF slag spout zone based on actual wear measurements taken during BOF operation, the goal of this work is to identify a regression model with a reasonable prediction measure of fit. Regression trees utilizing the CART method (Classification and Regression Trees), Multivariate Adaptive Regression Splines (MARS), the Boosted Trees technique, and Multilayer Neural Networks MLP type were used in the calculations (Multilayer Perceptron) [27].
The most common DNNs today are convolutional neural networks (CNNs), which feature a number of convolution layers. In these networks, each layer creates a (fmap) feature map, which is an abstraction of higher-level data that contains critical yet unique information from the imputed data. By employing a very deep collection of layers, modern CNNs are capable of obtaining higher performance. CNNs are utilized in a broad range of applications, including robotics, speech recognition, scene analysis, and gameplay, among others. We focused on applying CNN in image processing to distinguish cracked-tile surface images and spotted-tile surface images.
The collection of 2-D input feature maps is used to represent the activations of the input layer in computations, with each channel stated independently. A convolutional neural network consists of layers made up of high-dimensional convolutions. Every channel that emerges from the filter stacks for each channel is convolved by a different 2-D filter, which is why the 2-D filters are commonly referred to as 3-D filters. At every node in the network, the convolution's output is treated with a multi-channel summation approach. The resulting filters could have a one-dimensional bias, however, modern networks have eradicated these biases from the layers.
The output from activations with a single output channel of the map is the outcome of this calculating procedure. By applying additional 3-D filters to the same input, many output channels may be produced. To speed up filter weight reprocessing, numerous feature maps from the input may be produced in batches. For classification tasks, a small number of fully connected (FC) layers—typically one to three—follow the main convolution layers. A DNN can include a range of discretionary layers, such as non-linearity, normalization, and pooling, in addition to convolution and fully linked layers.
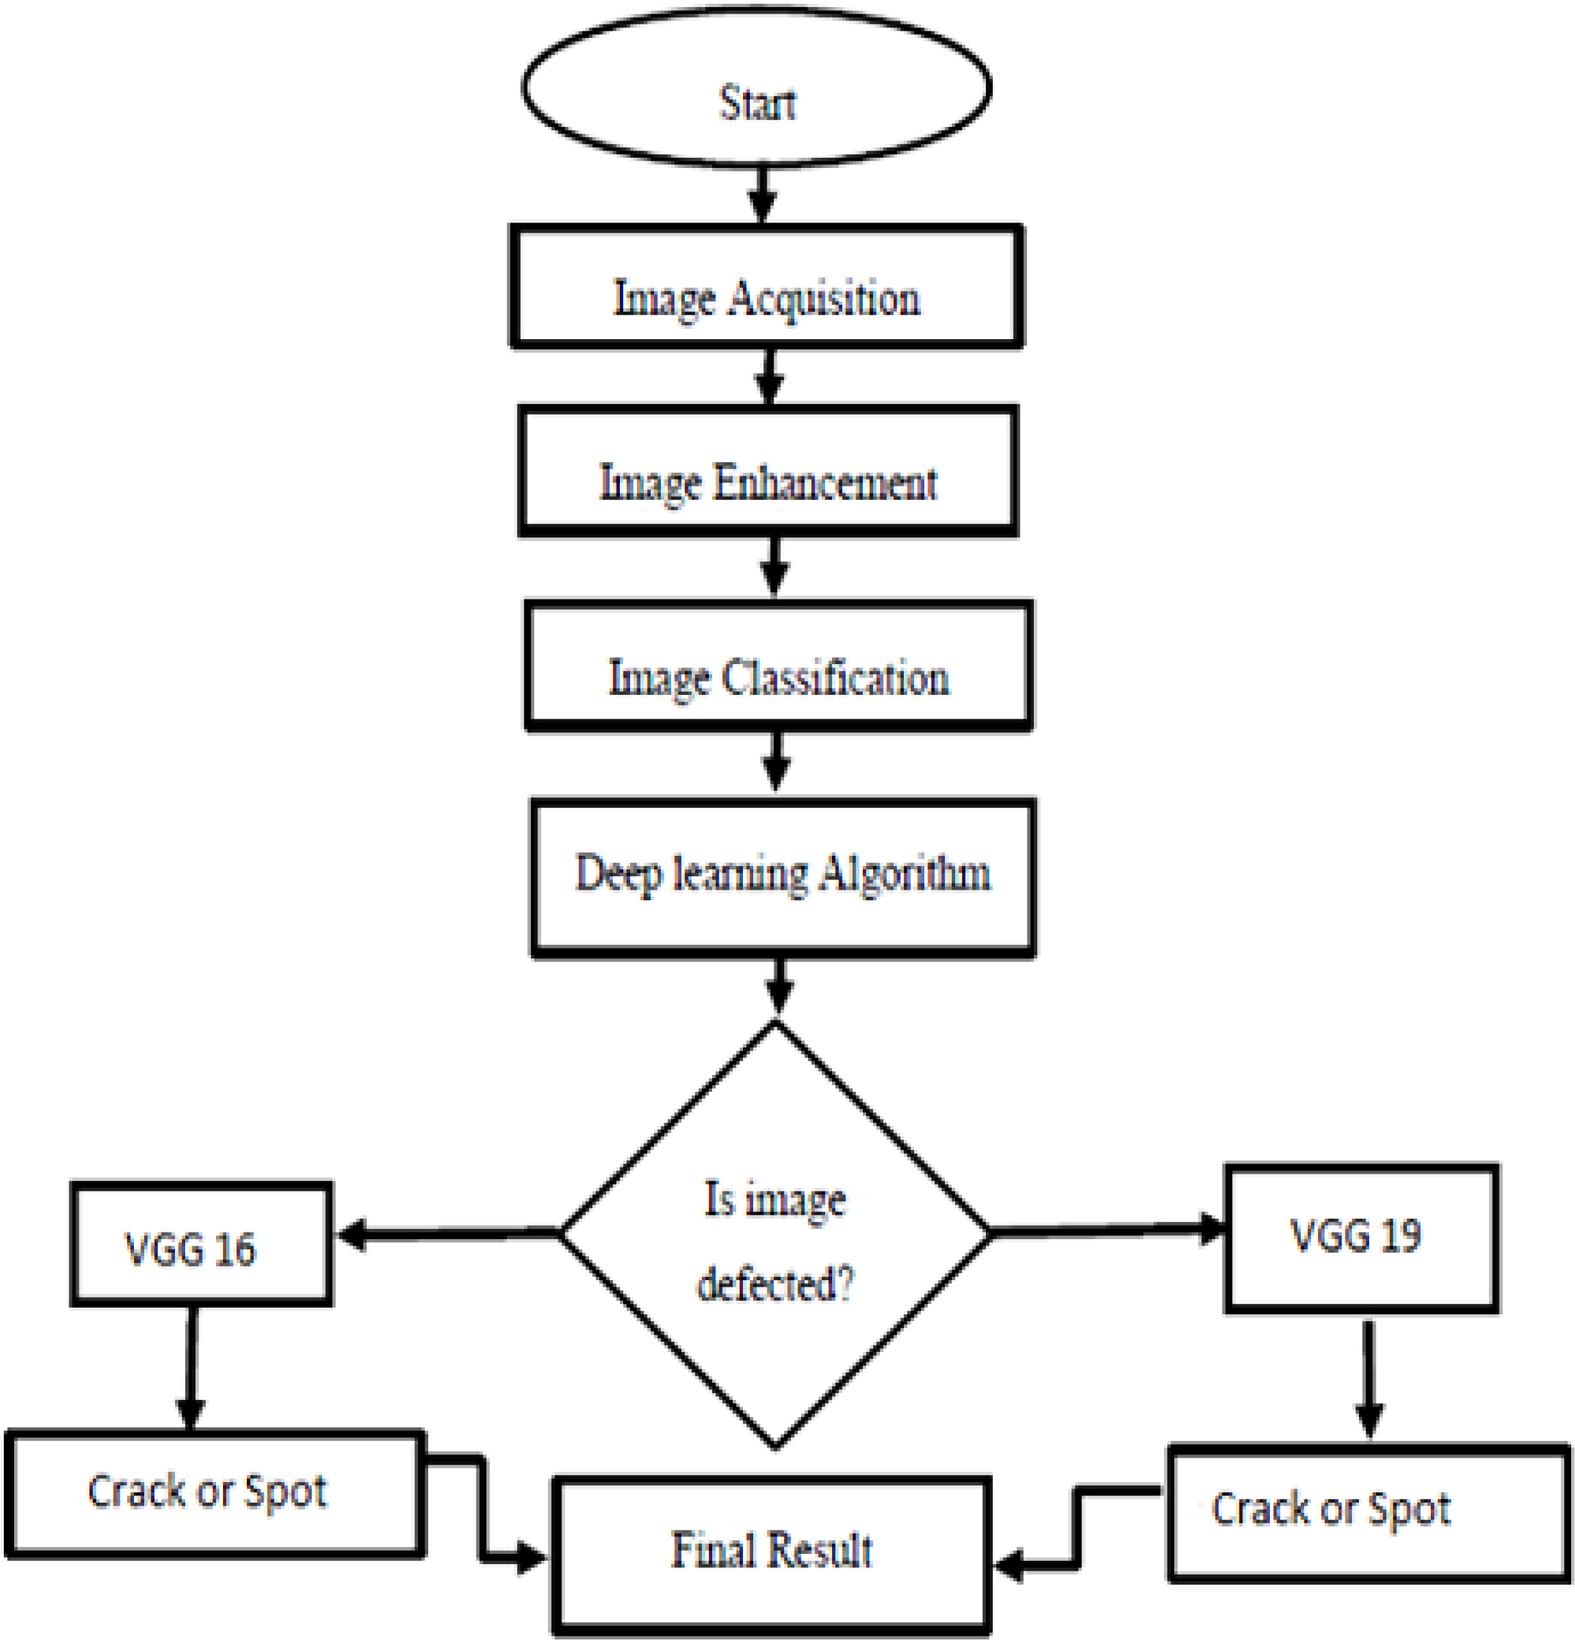
The above figure represents the system implementation flow of deep learning algorithms.
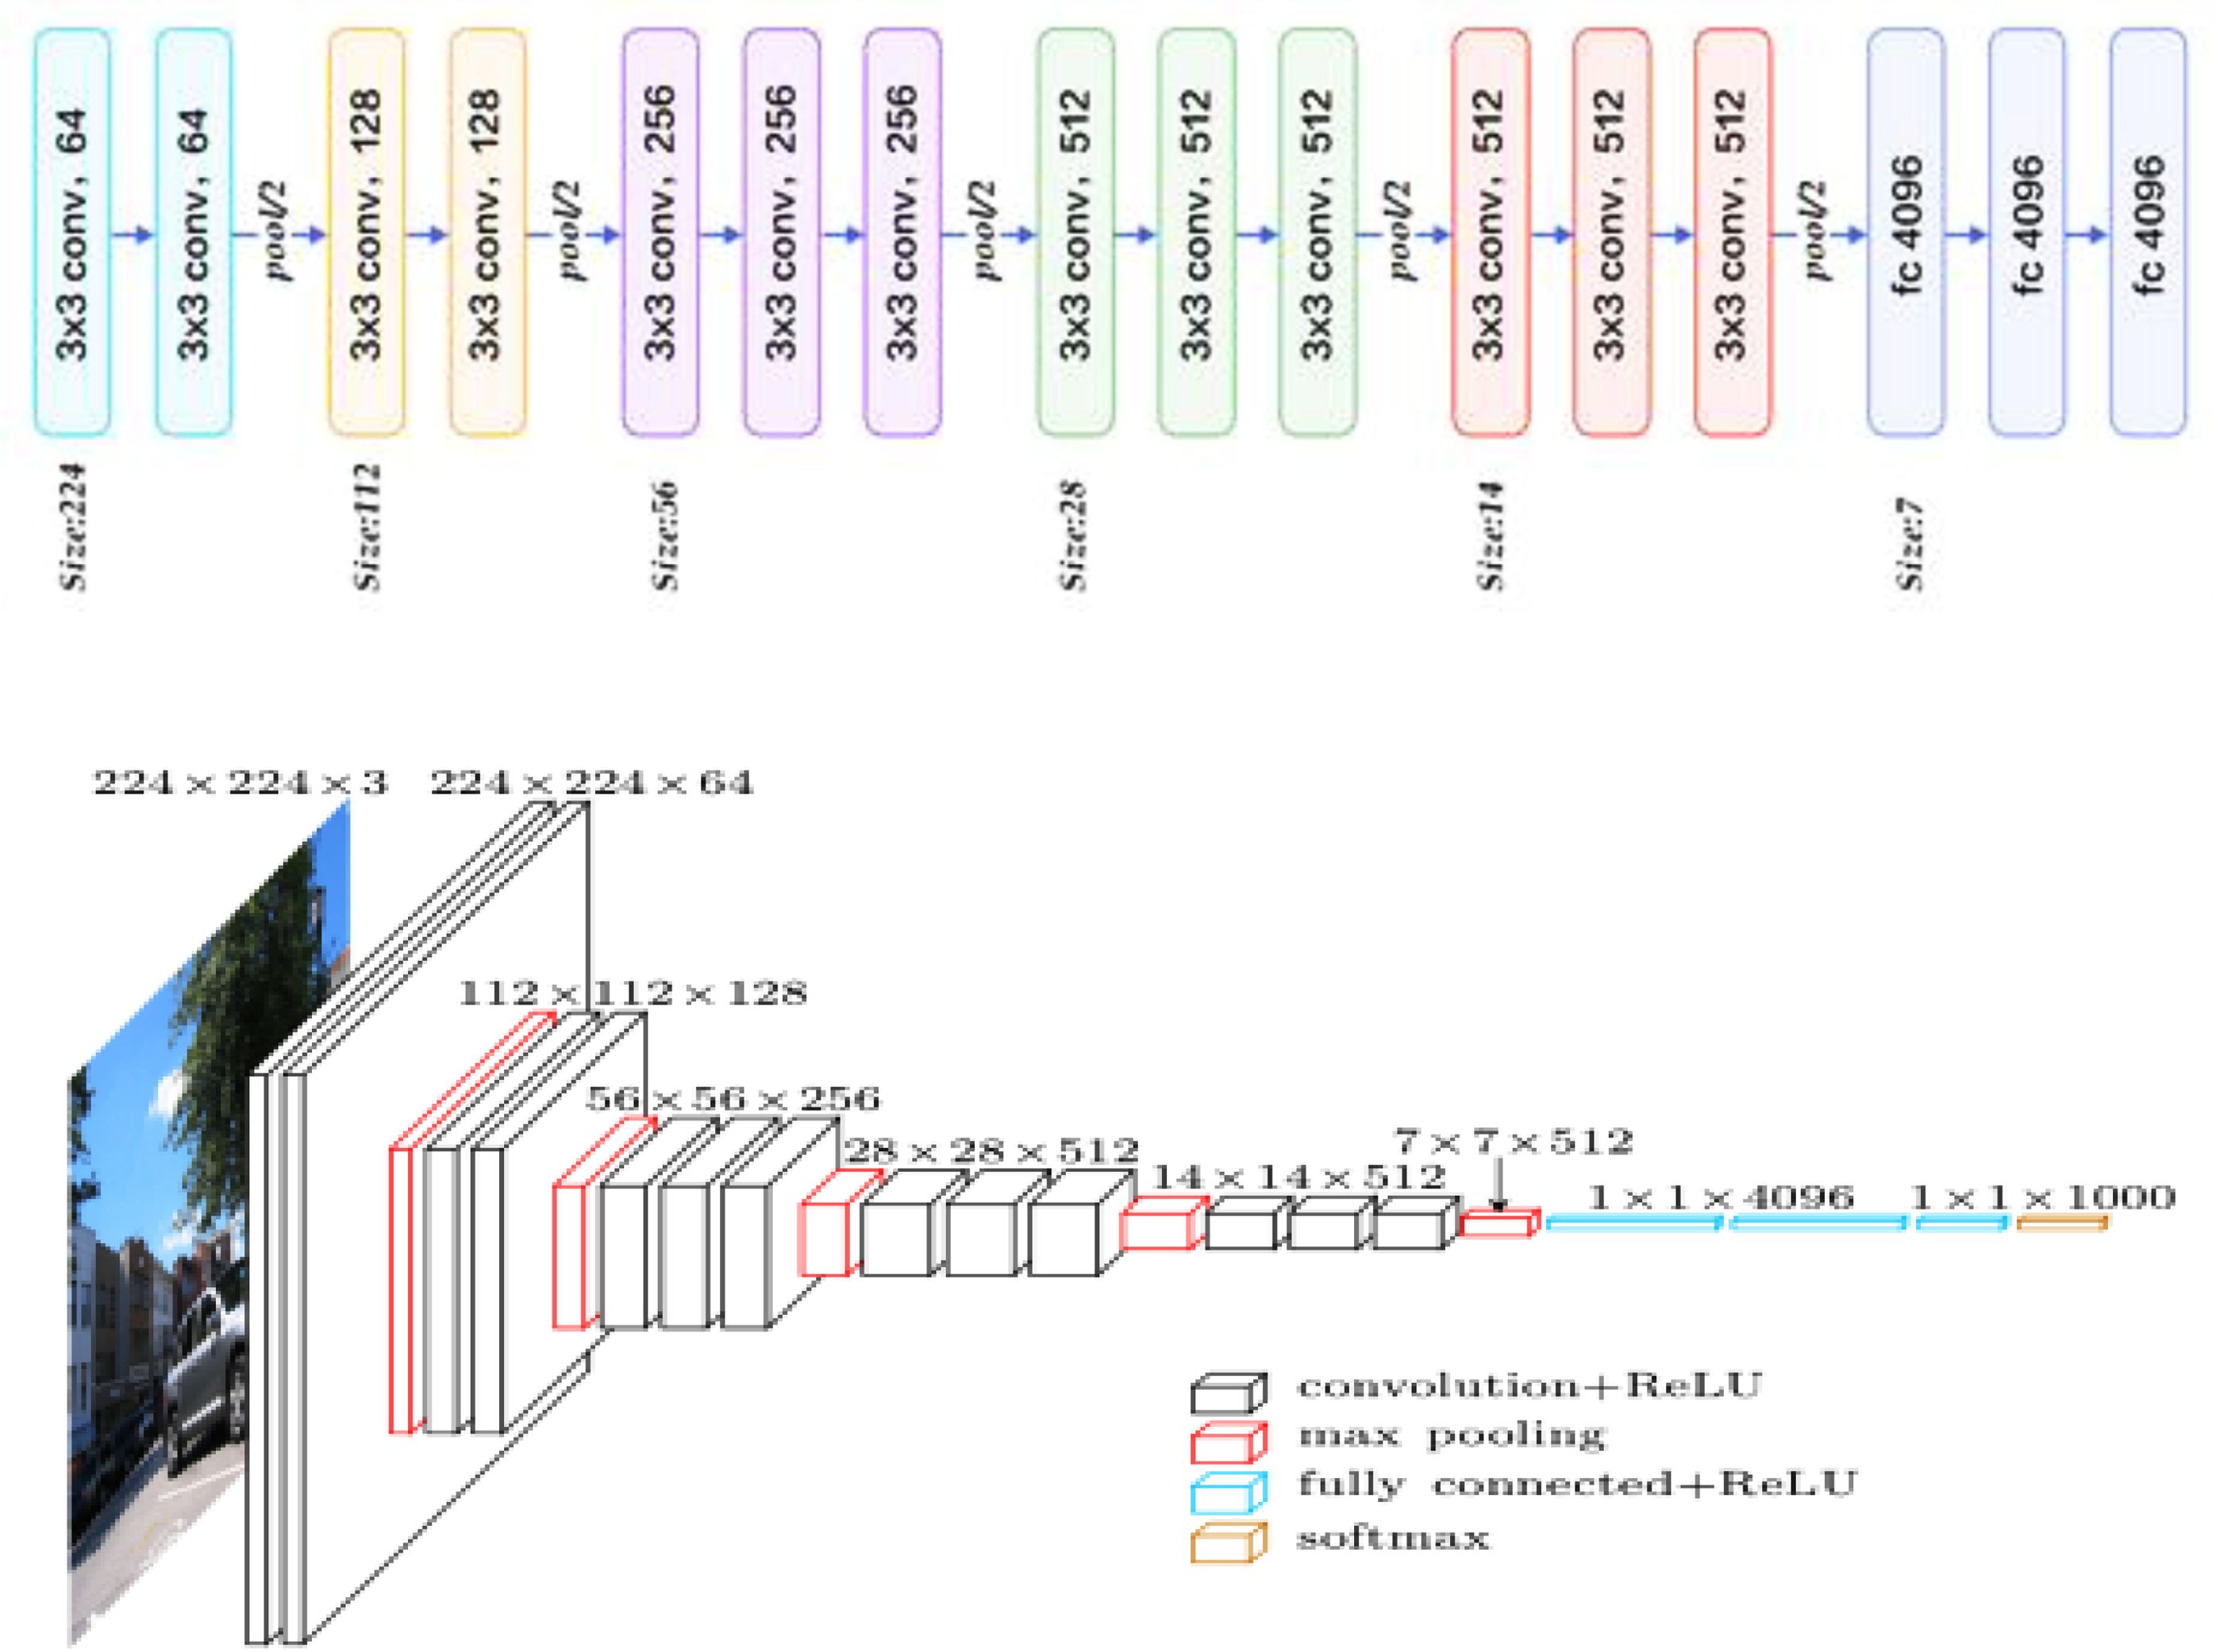
The large set of labeled photographs for computer vision research is called as ImageNet in Deep Learning. The purpose of this collection is to deliver a source and to promote research in the area of computer vision, object recognition, image classification, and object localization. “ImageNet is applicable in the platform of deep learning and Convolutional Neural Networks. The goal of this image classification trial is to train a model that can correctly classify an input image into 1,000 distinct object groups. As per our requirement of the dataset, we can configure the last layer as different distinct label groups. For example, the large volume of images classifies as four objects mean, flattening the output layer size to four. Likewise, the predefined model generation is possible for any kind of image dataset up to the maximum class label of a thousand.
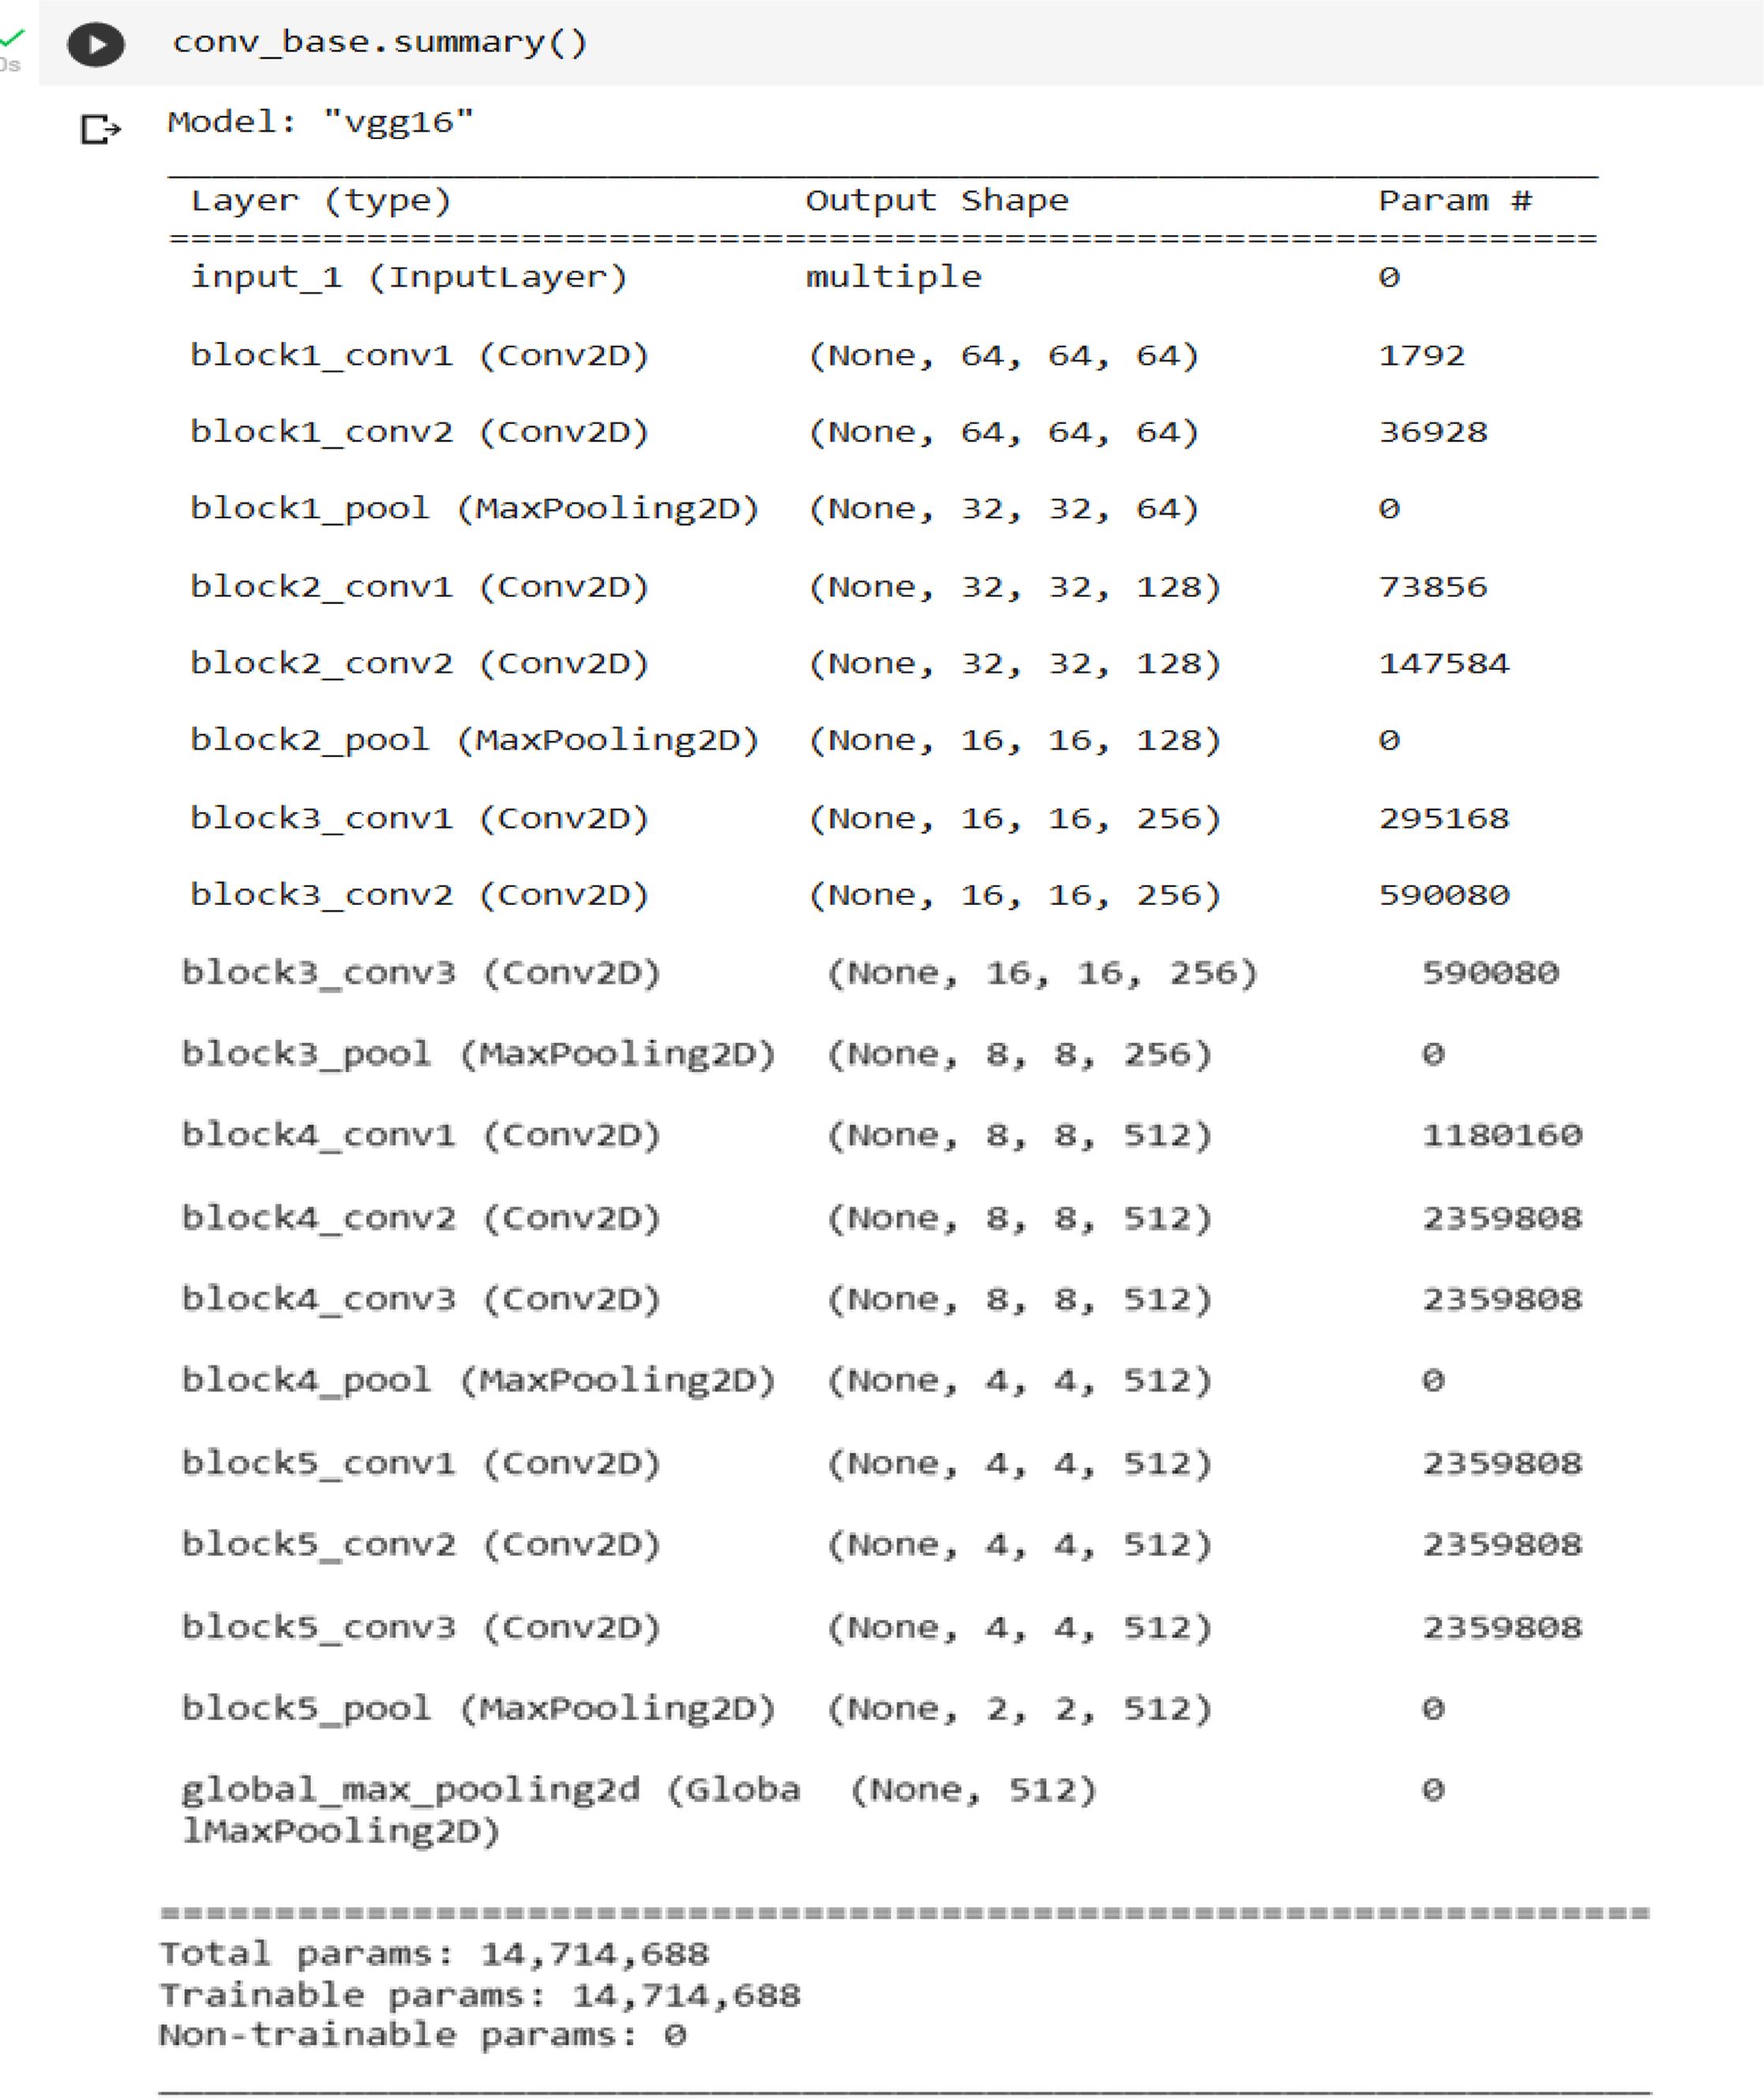
The above figures represent the 16 layers summary of VGG with respective layer filter size and activation function. VGG19 architecture is similar to VGG16, it contained 16 layers of CNNs and 3 fully connected layers and a final layer for softmax function instead of 13 layers of CNNs in VGG16.
√ Input RGB Images size of 224×224
√ Preprocessing
√ (Mean RGB value Calculation from each pixel)
√ Apply VGG 19 Model
• 16 CNN and Max Pool layers with respective filters, ReLuin each layer)
• Formulate the three fully connected layers with the output layer of value two with the Softmax activation function.
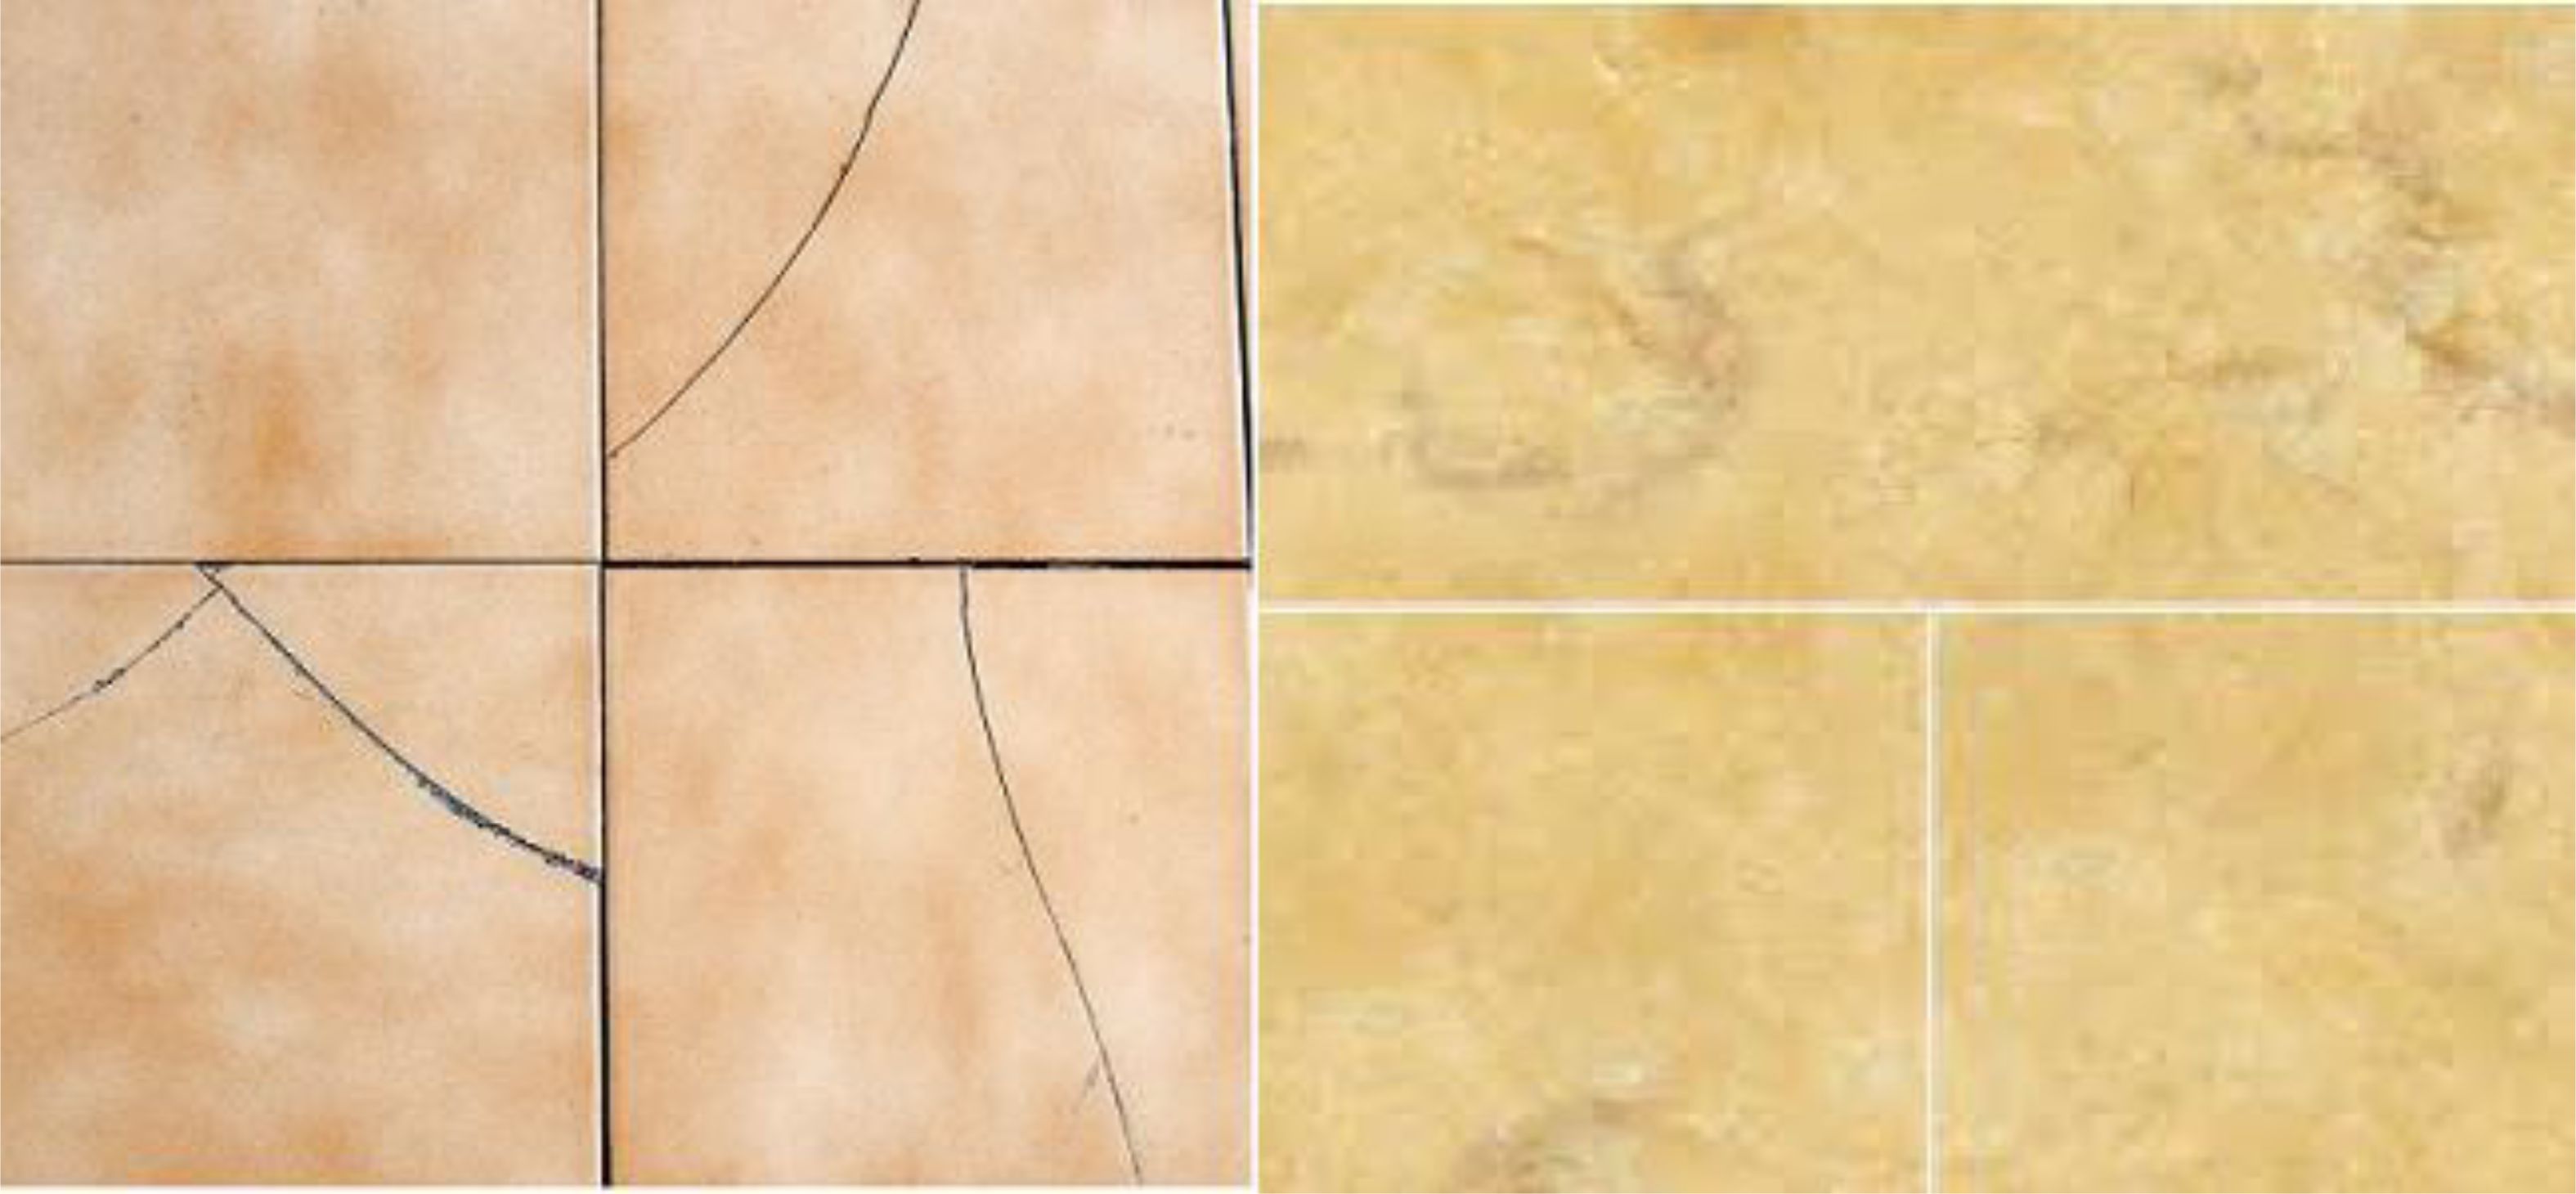
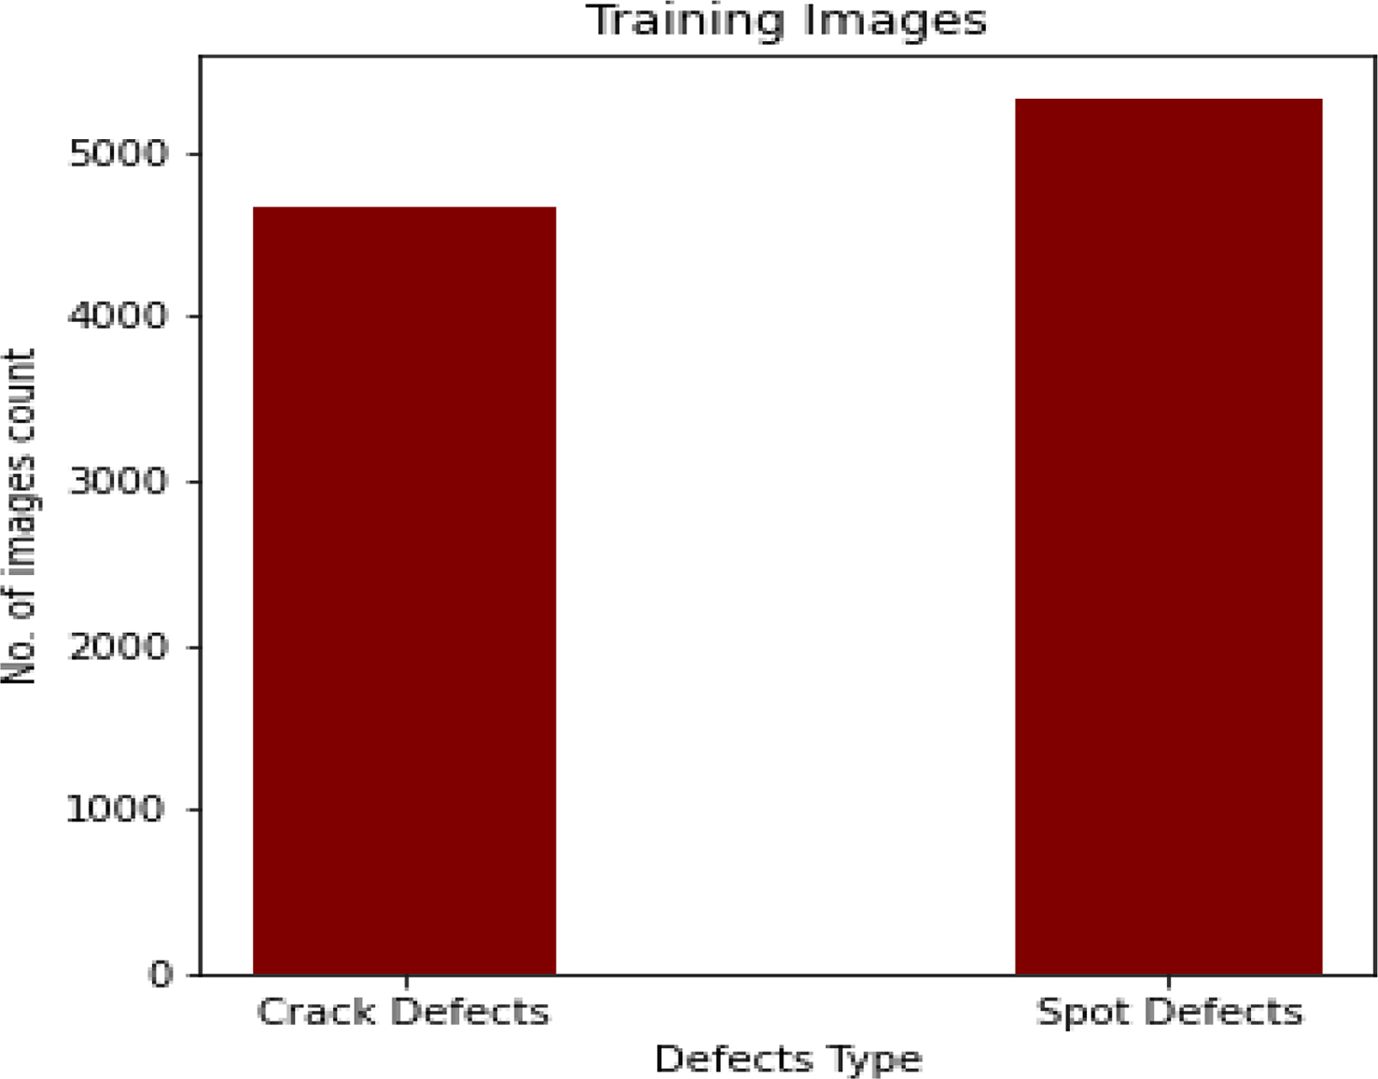
To evaluate the recommended architecture's classification capabilities, we employed smooth surface tiles with defects. In the photos collection, there are above 4000 images with crack, above 5000 images with spot, a total of 12493 images. During training, however, the picture proportions were automatically scaled and resized to 224 by 224. Figure 4 illustrates a dataset of cracked and non-crack smooth surfaces of floor tiles collected with a low-cost camera in various locations to test and confirm our model's classification capabilities of convolutional neural networks (CNNs), which feature a number of convolution layers.
|
Fig. 4 System Implementation flow of Deep Learning Algorithms. |
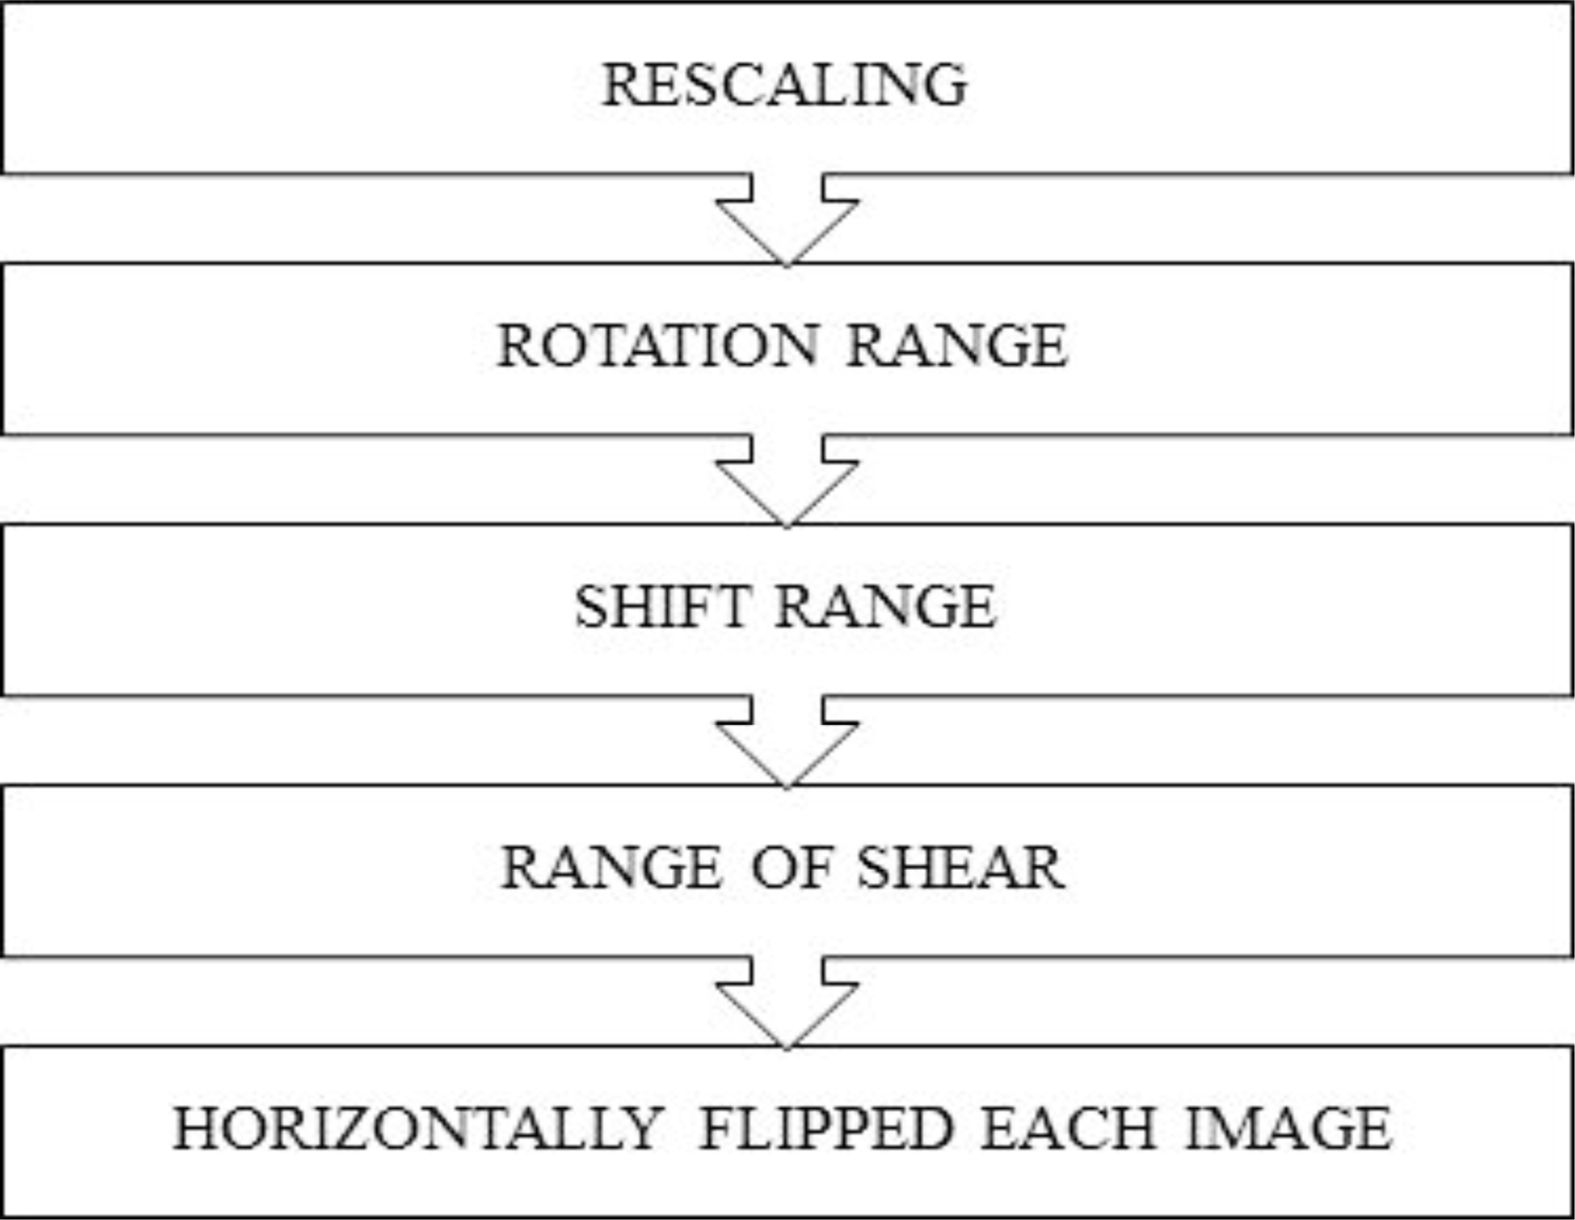
To avoid over-fitting and increase generalization capability, we employed a variety of deep learning algorithms to increase the size of the data set. The following seven affine transform algorithms were heavily used:
(1) Data rescaling: We multiplied our data by a predefined number before initiating any training procedure.
(2) Rotation range: At random, each 40×40 picture was rotated at 180 degrees.
(3) Shift range: This method moves pictures randomly horizontally or vertically.
(4) Shear range: We used a shear range of 20%, which reduces the picture angles in a counter-clockwise direction, comparable to radians.
(5) After that, each image was horizontally flipped. In order to increase training stability and speed, each pixel of the image was normalized to get a zero mean and unit variance.
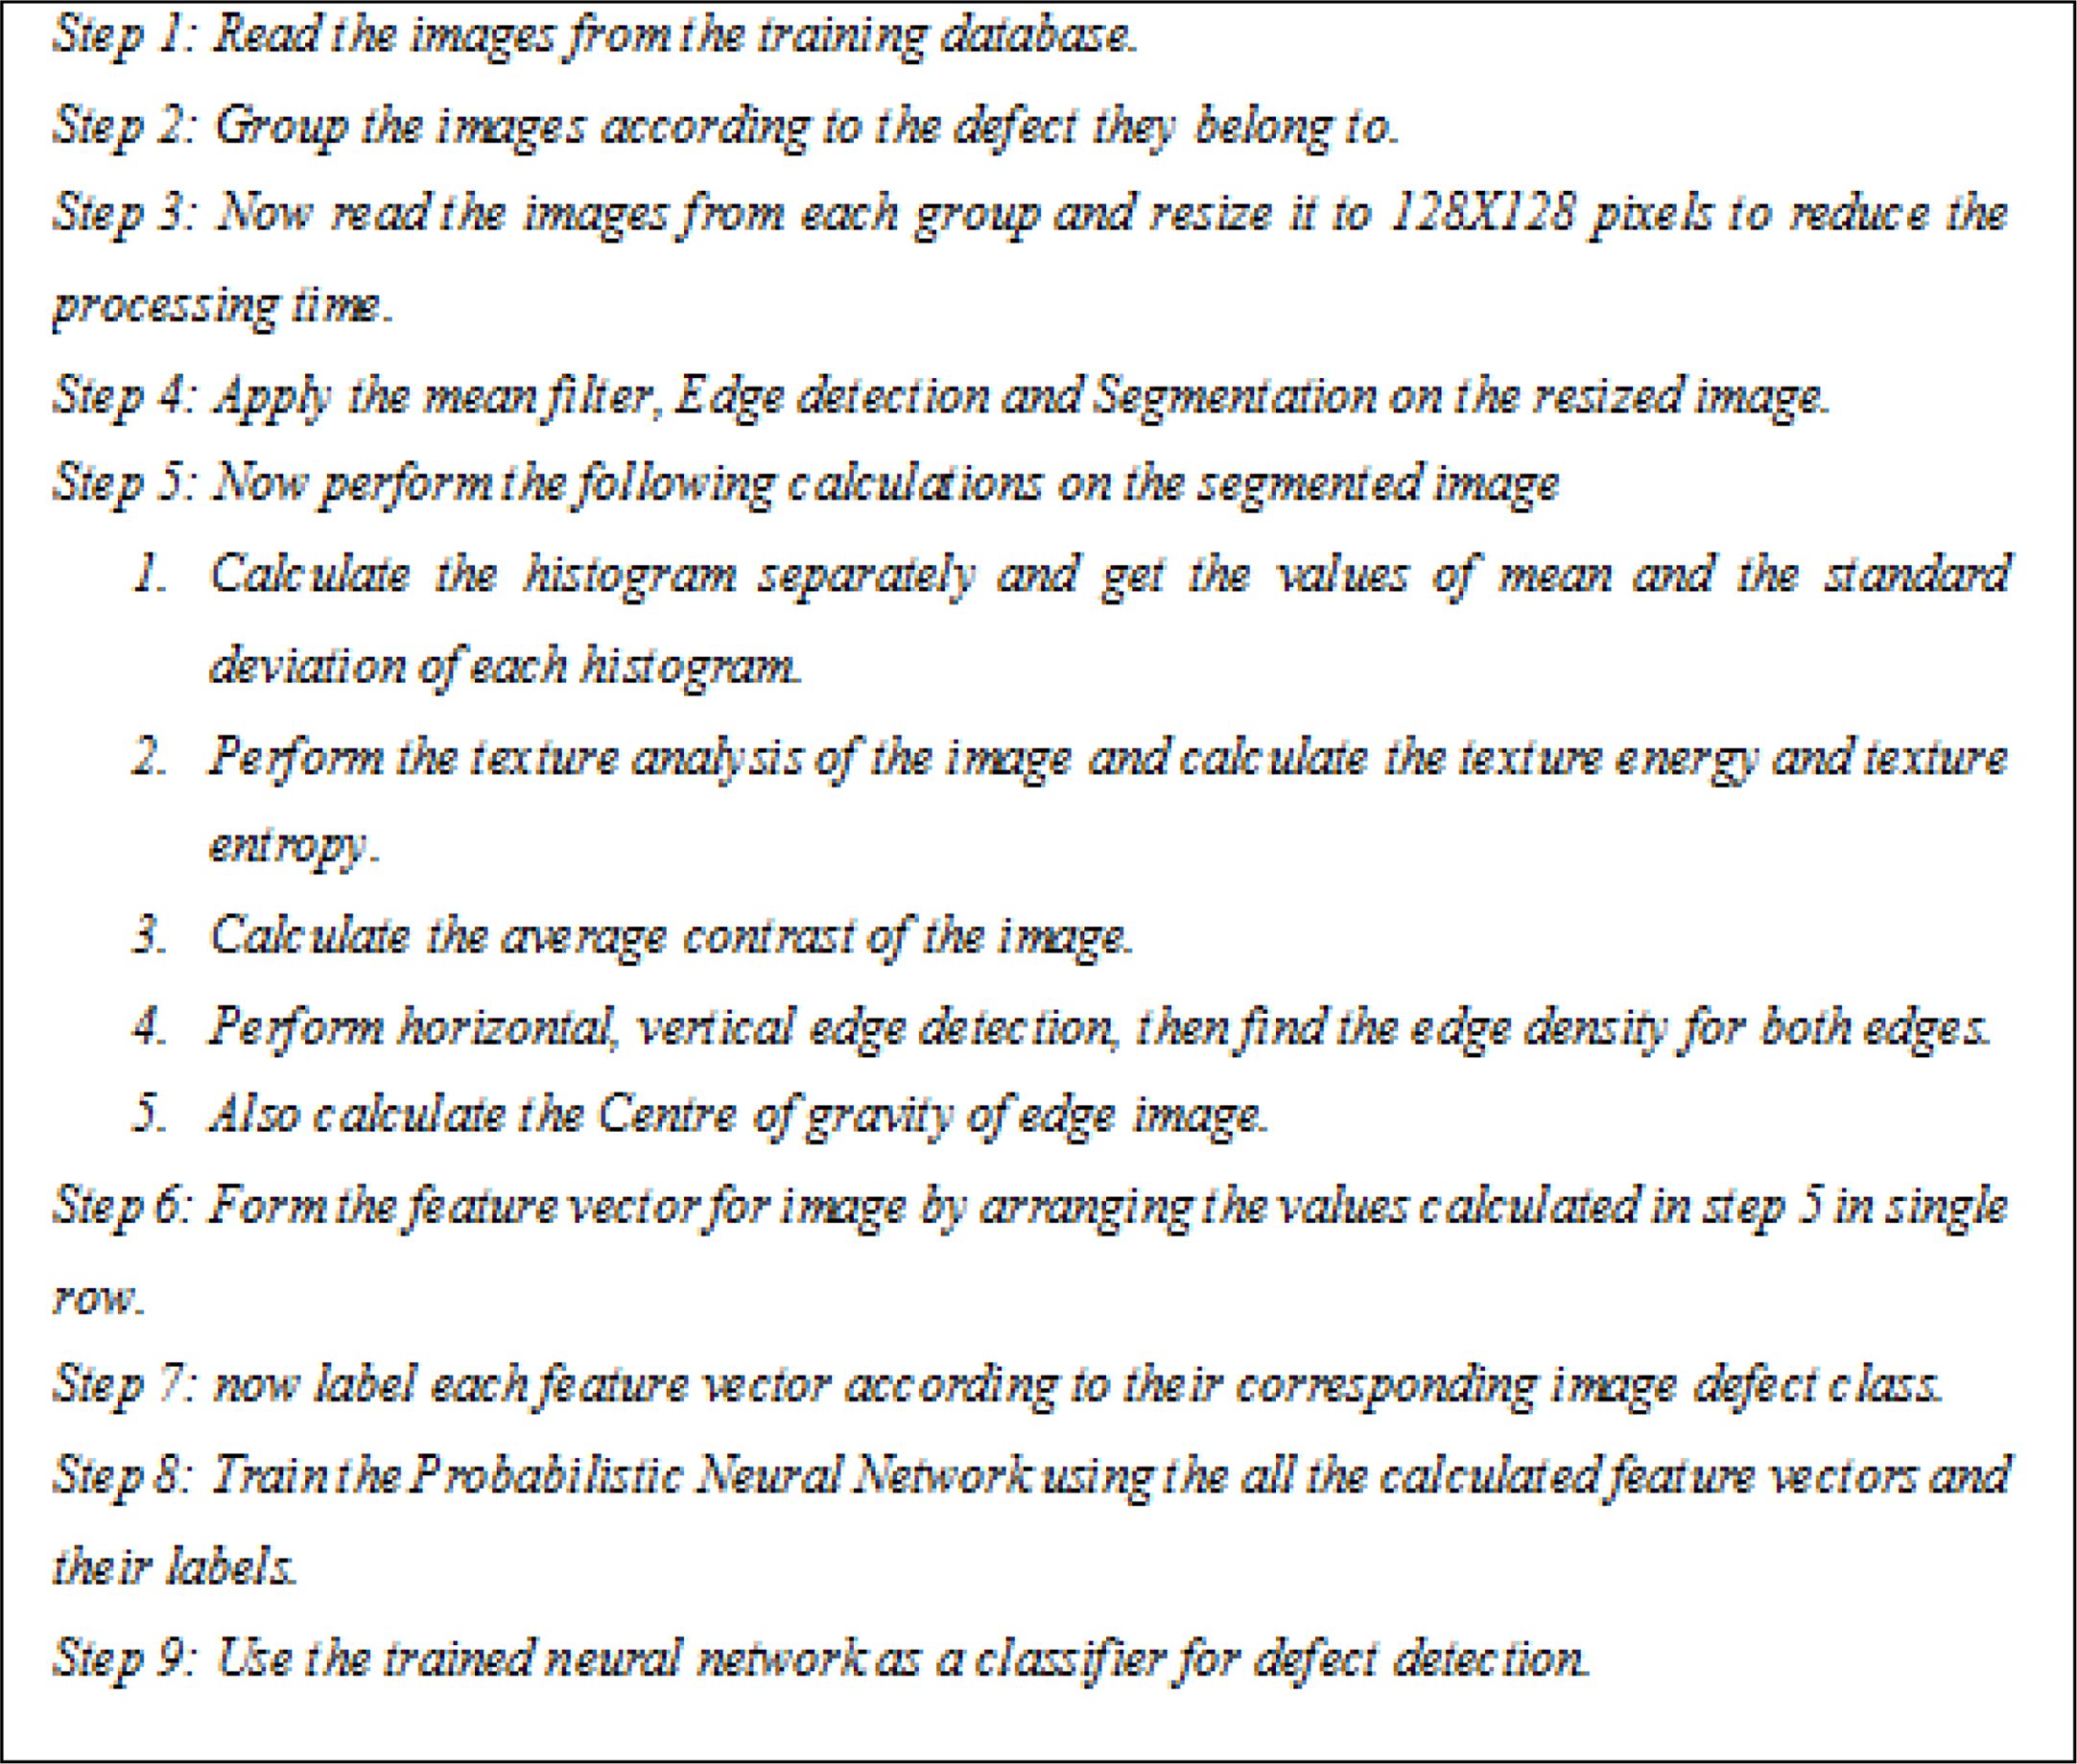
for automation engineers, resulting in limited detection capabilities and a large number of false alarms in currently available systems. We propose a Deep Learning approach, to overcome these performance limits. As a consequence, learning bias and generalization variance may be greatly reduced. The suggested method may be broken down into the following steps:
Algorithm for training phase:
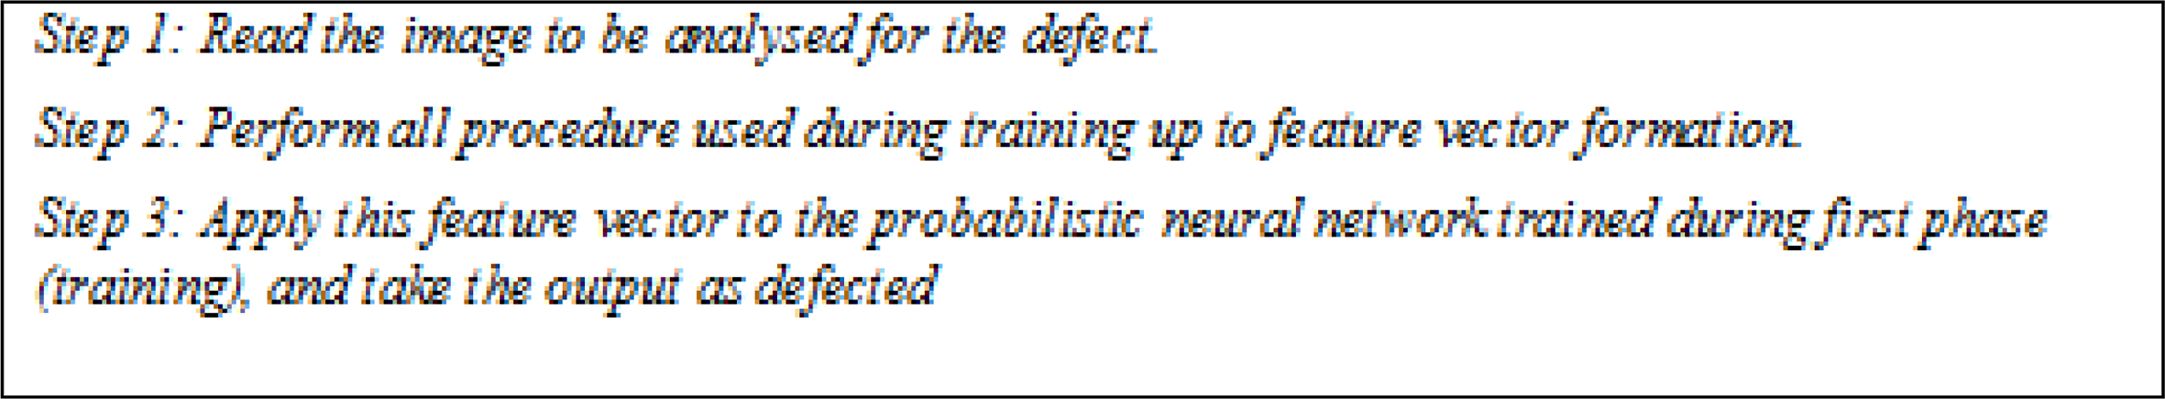
Algorithm for Detection phase:
Hyperparameters of the neural network to increment exactness
• the number of hubs in layers
• Actuation capability
• the learning rate
• Dropout rate
• Cluster size
• Ages
The quantity of neurons in each secret layer is the underlying hyperparameter to be tuned. In this case, each layer's number of neurons is fixed to be something very similar. It can likewise be ready another way. The number of neurons should be changed relying upon how complex the response is. Inside each layer, a boundary is called an initiation capability. The info layer gets input information first, then secret layers, and lastly the result layer. The result esteem is situated in the result layer. The info esteems consistently change as they move between different layers layer as per the enactment capability. How a layer's feedback values are changed over into yield is not entirely set in stone by the enactment capability. The result upsides of one layer are then moved as info values to the accompanying layer. An enhancer is dispensed once the layers of a brain network have been gathered. To get the most reduced conceivable misfortune capability, the streamlining agent should change the learning rate and loads of the neurons in the brain organization. The best exactness or least measure of misfortune is accomplished by utilizing a streamlining agent.
Overfitting might be tried not by adding regularization layers to a brain organization. After the principal stowed away layers, cluster standardization is applied. Each cluster's qualities that are shipped off the group standardization layer are standardized. The Dropout layer is an extra regularization layer. A specific number of neurons are dropped indiscriminately into a layer. The lost neurons are not generally utilized. The dropout rate decides how rapidly the small part of neurons declines. The clump size hyperparameter determines the number of tests that should be handled before the inner model boundaries are refreshed.
Consider a clump as a for-circle making expectations while repeating north of at least one example. The expectations are contrasted with the expected result factors at the bunch's decision, and a blunder is figured. An extra boundary called “ages” decides how often the learning calculation will run over the full preparation dataset. Each example in the preparation dataset has gotten an opportunity to change the interior model boundaries once during an age. At least one groups make up a period.
Fig. 5 Fig. 6 Fig. 7
|
Fig. 5 16 Layers Summary of VGG with Respective Layer. |
|
Fig. 6 Left - Tile Sample with Crack; Right - Tile Sample without Crack. |
|
Fig. 7 Steps for Pre-processing Methods. |
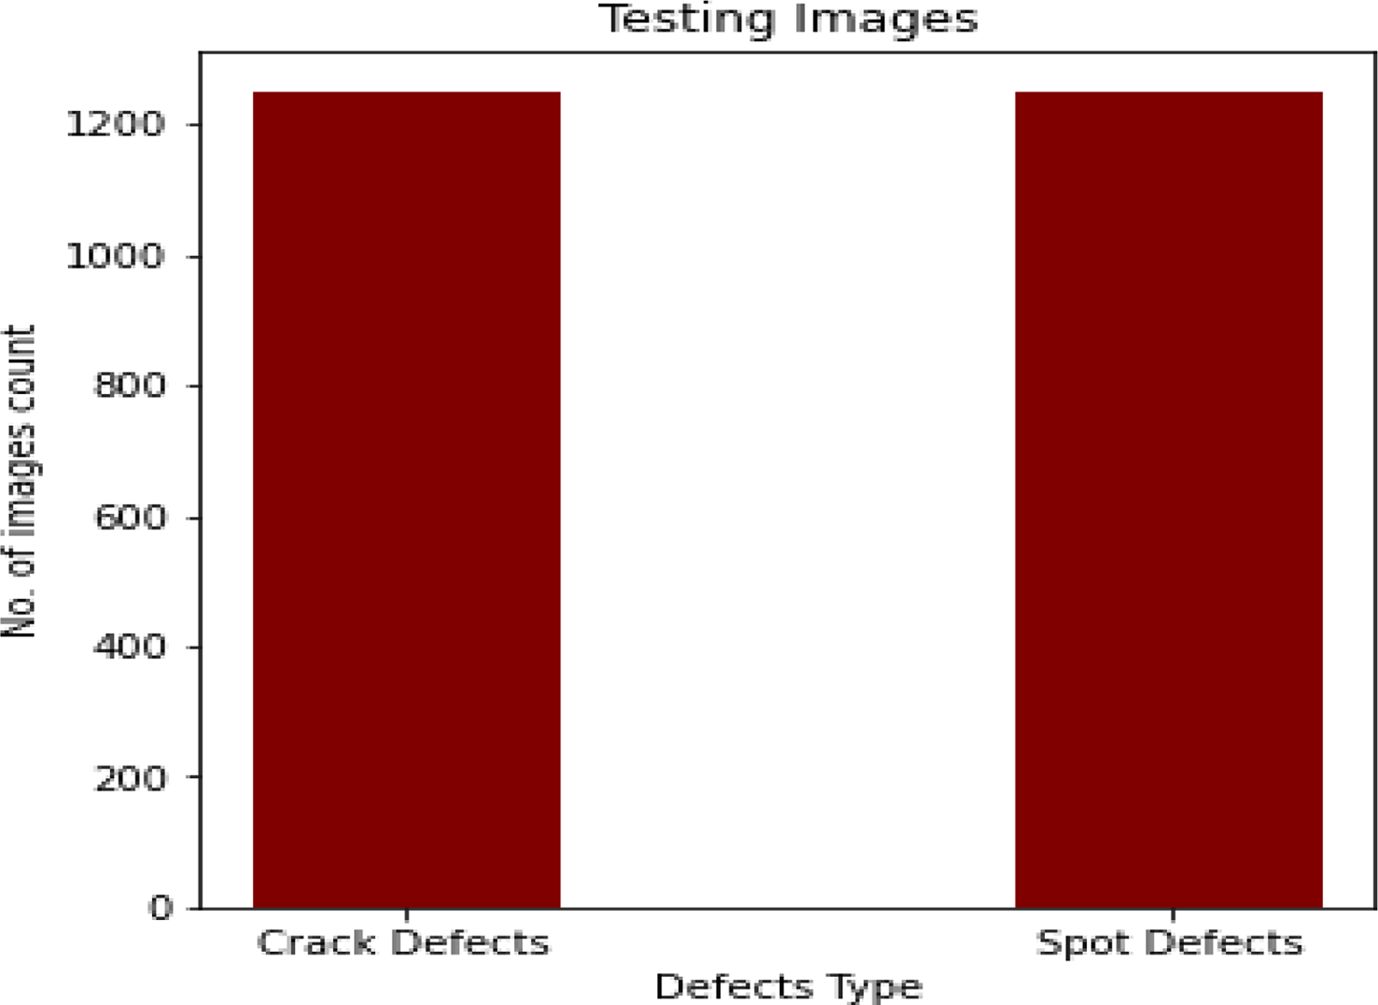
The sample size of the training and testing images used for identifying the defects in tiles is given in Figs. 8, 9.
The above section includes an in-depth analysis of the proposed algorithm for various numbers of training and testing data sizes, as well as a comparison with current approaches. We conducted a number of extensive experiments and received a variety of outcomes, but we'll show you our best ones here.
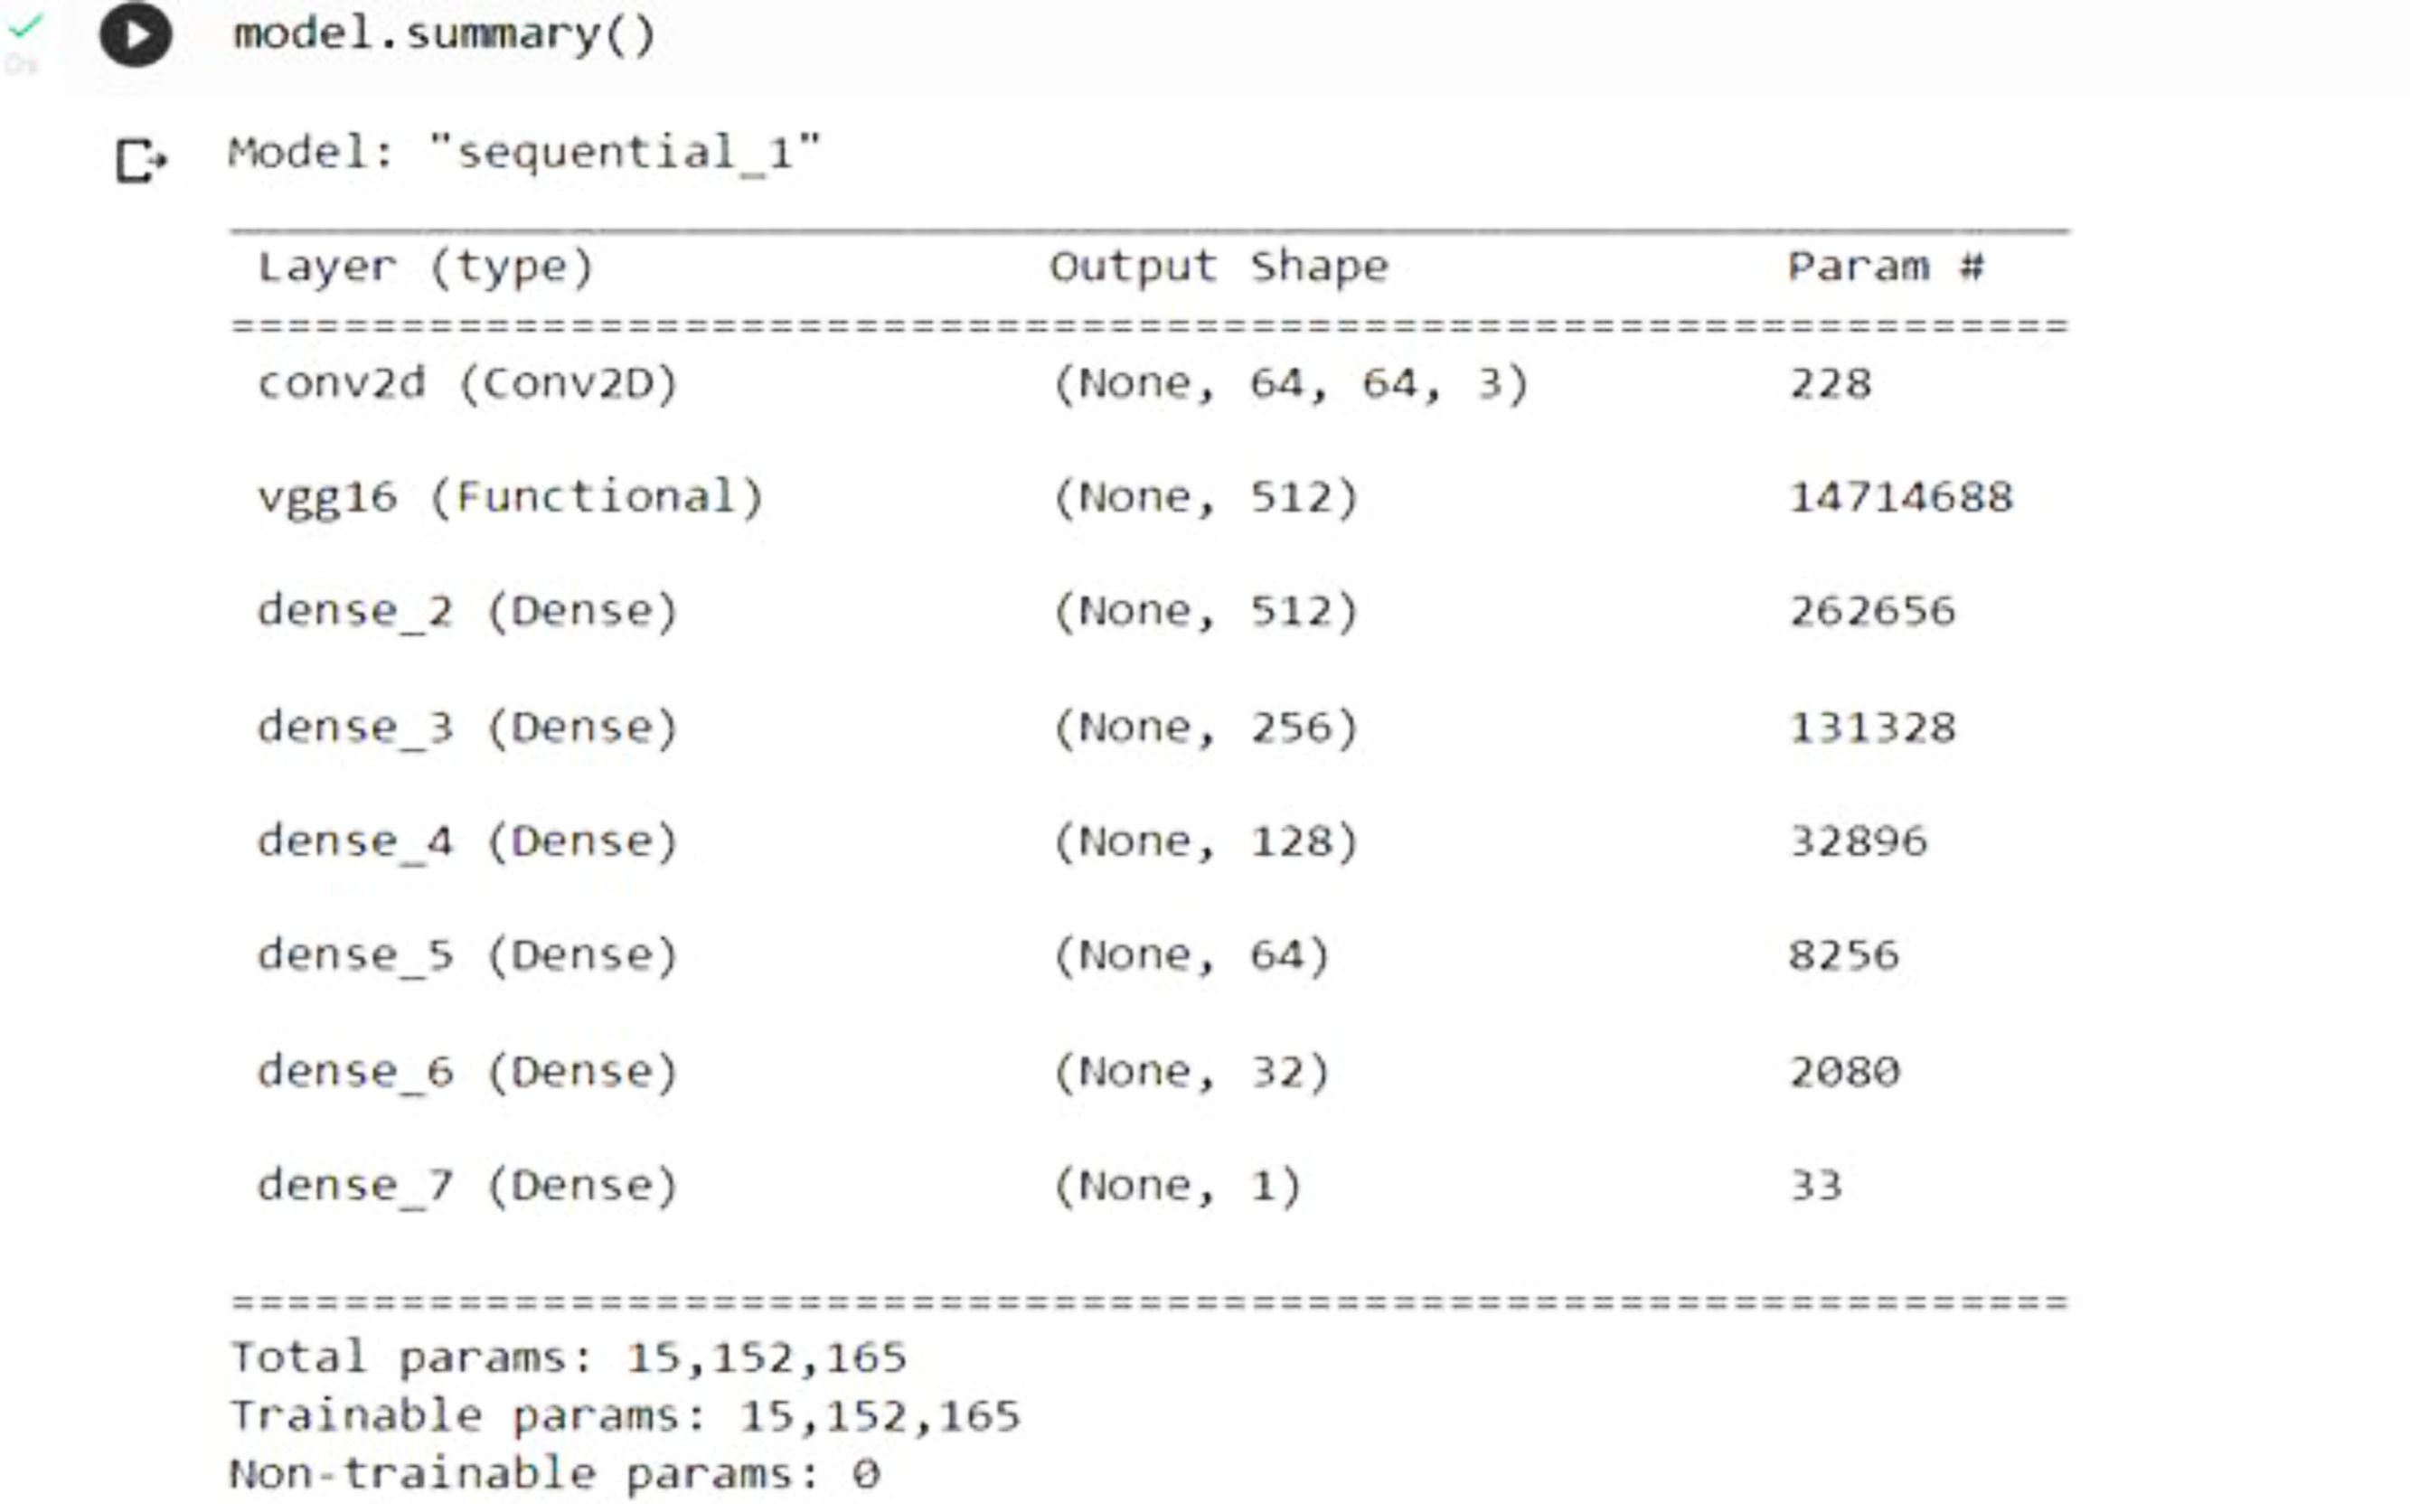
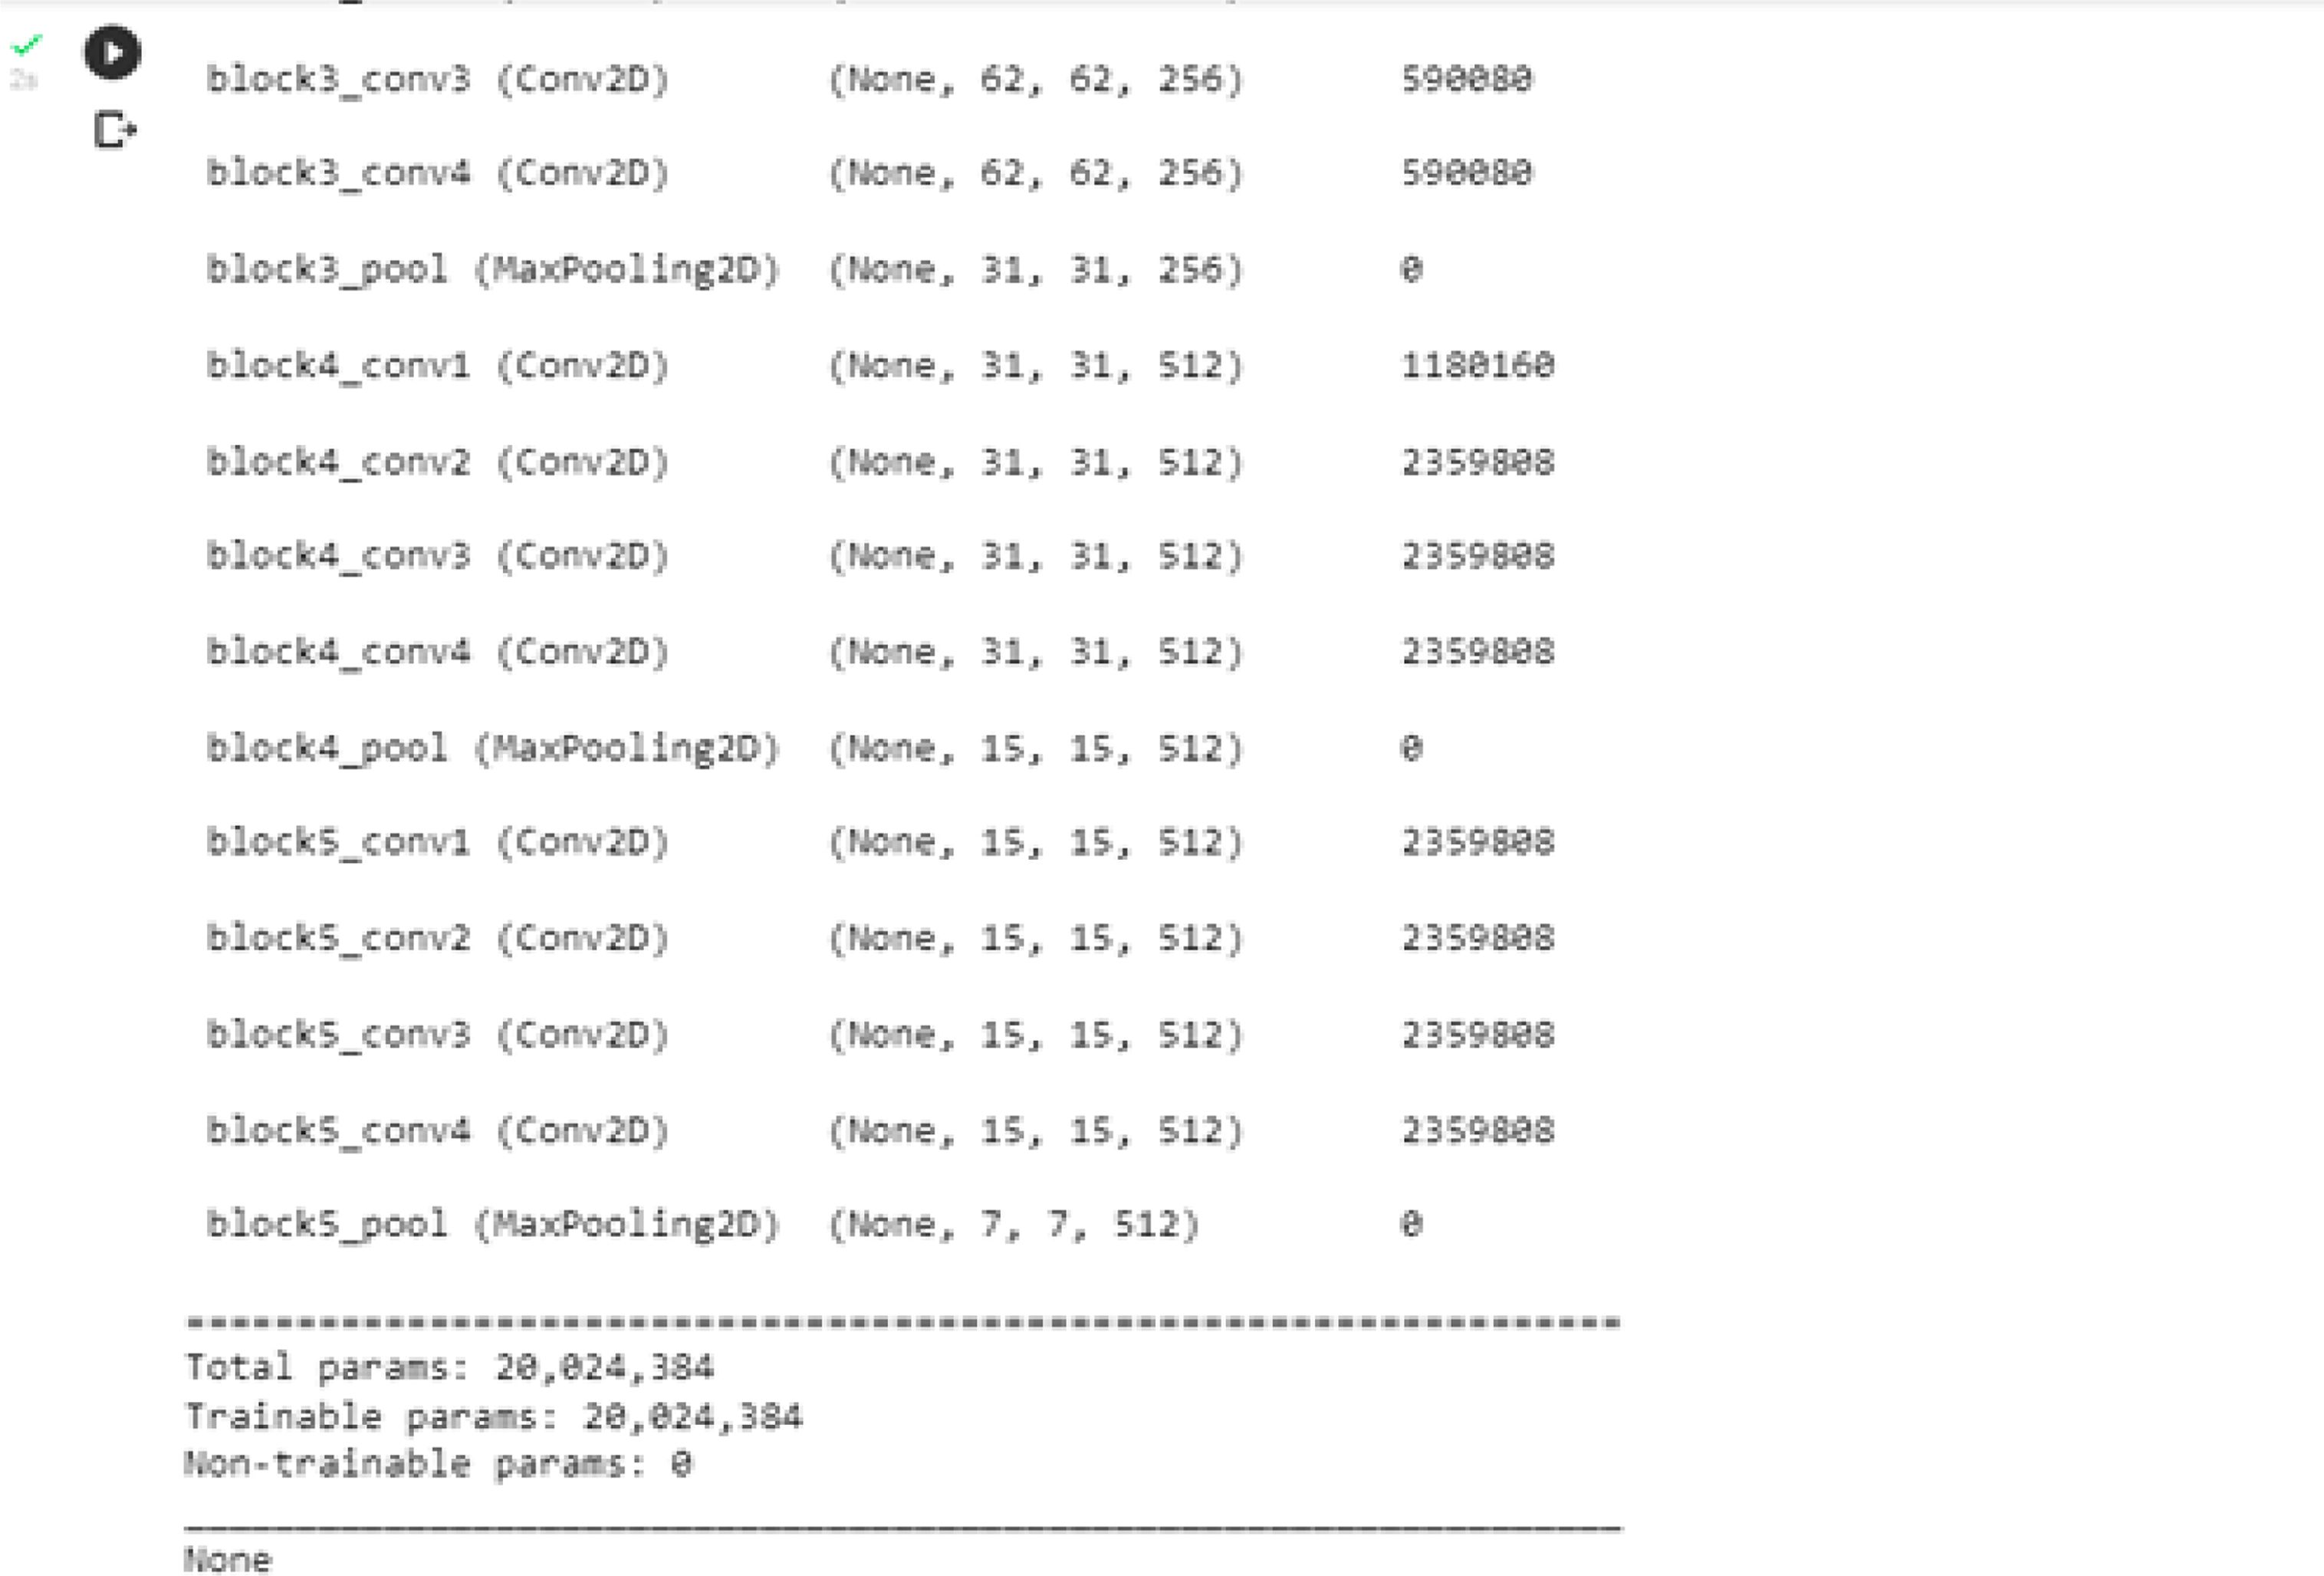
As shown in Figs. 10, 11, 12 –VGG-16 and VGG-19 is a snap of layer deep convolutional neural network. You may import a pre-trained version of the network, which has been trained over an input image.
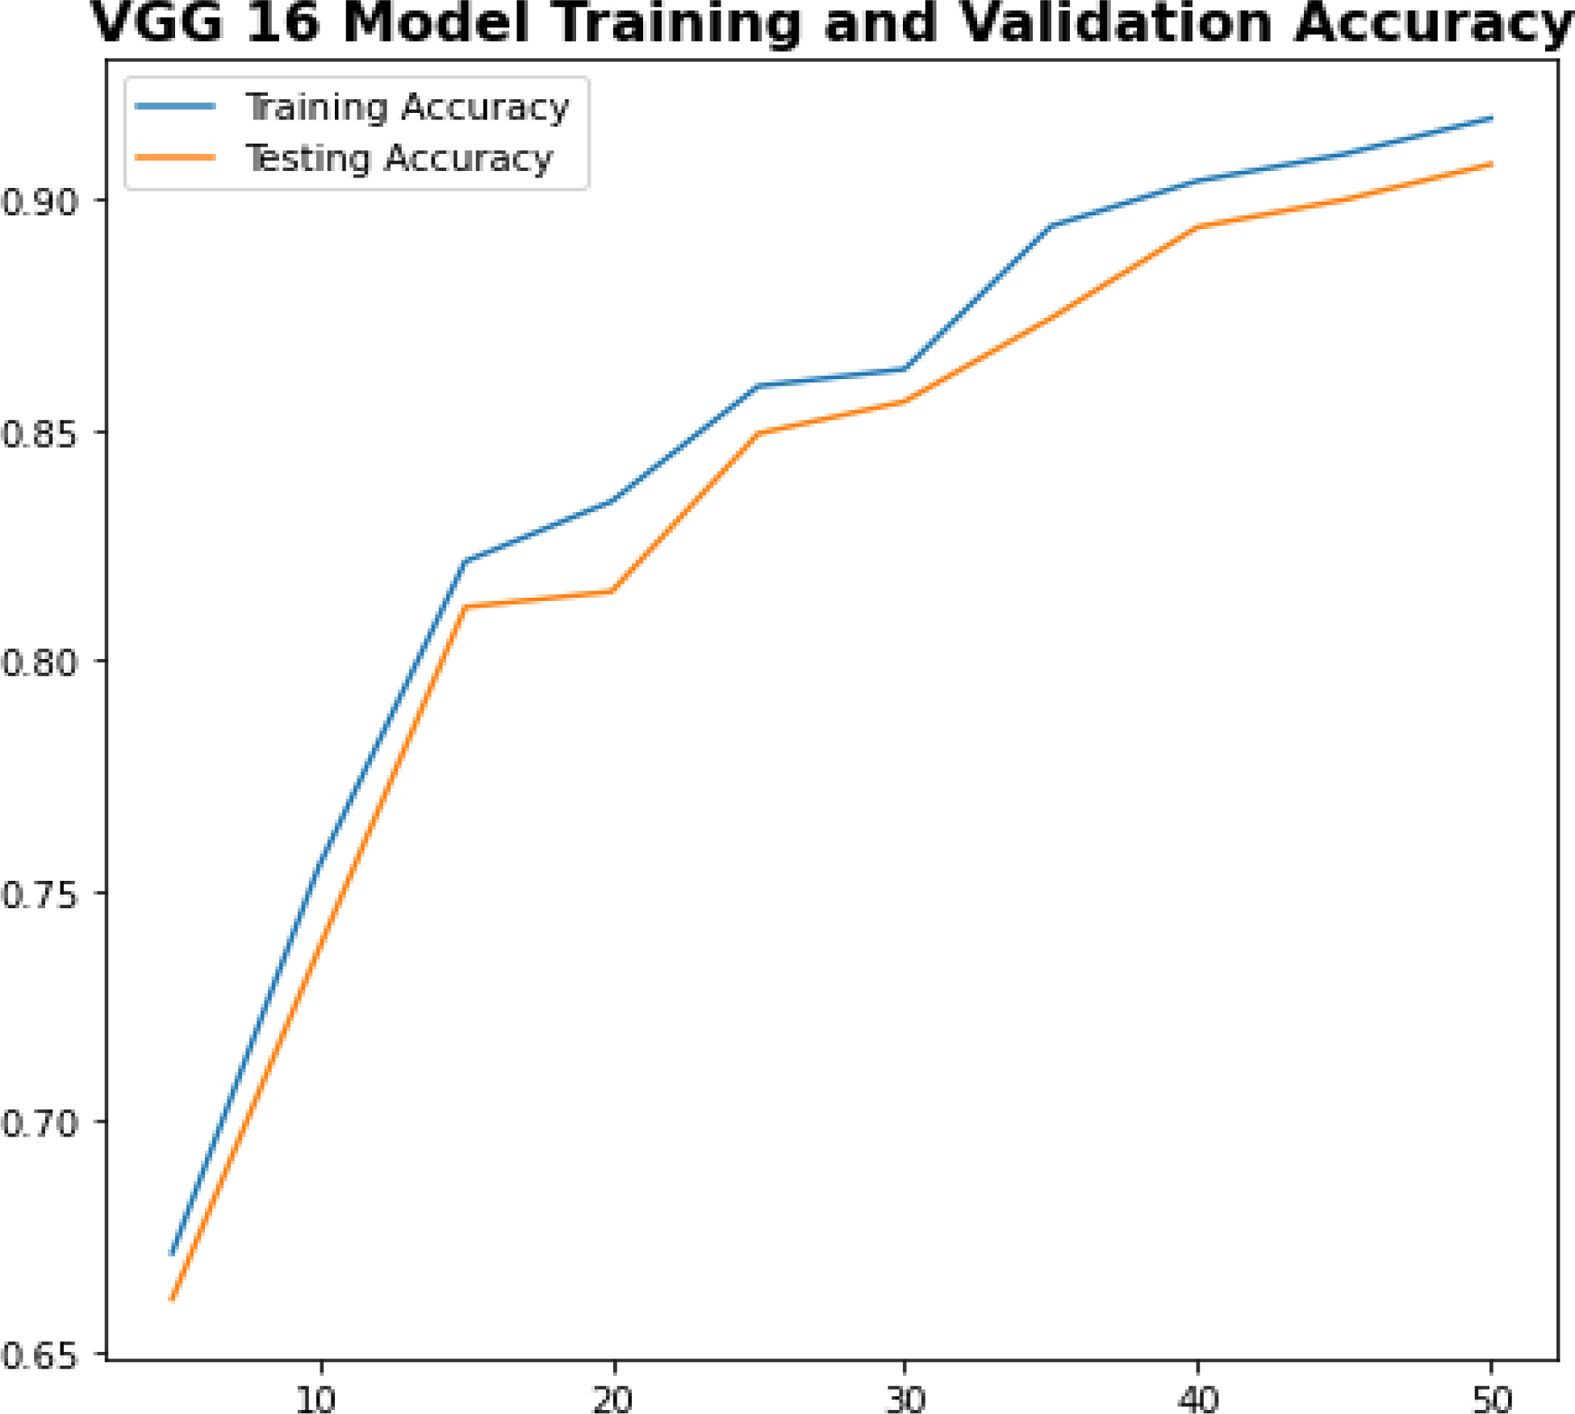
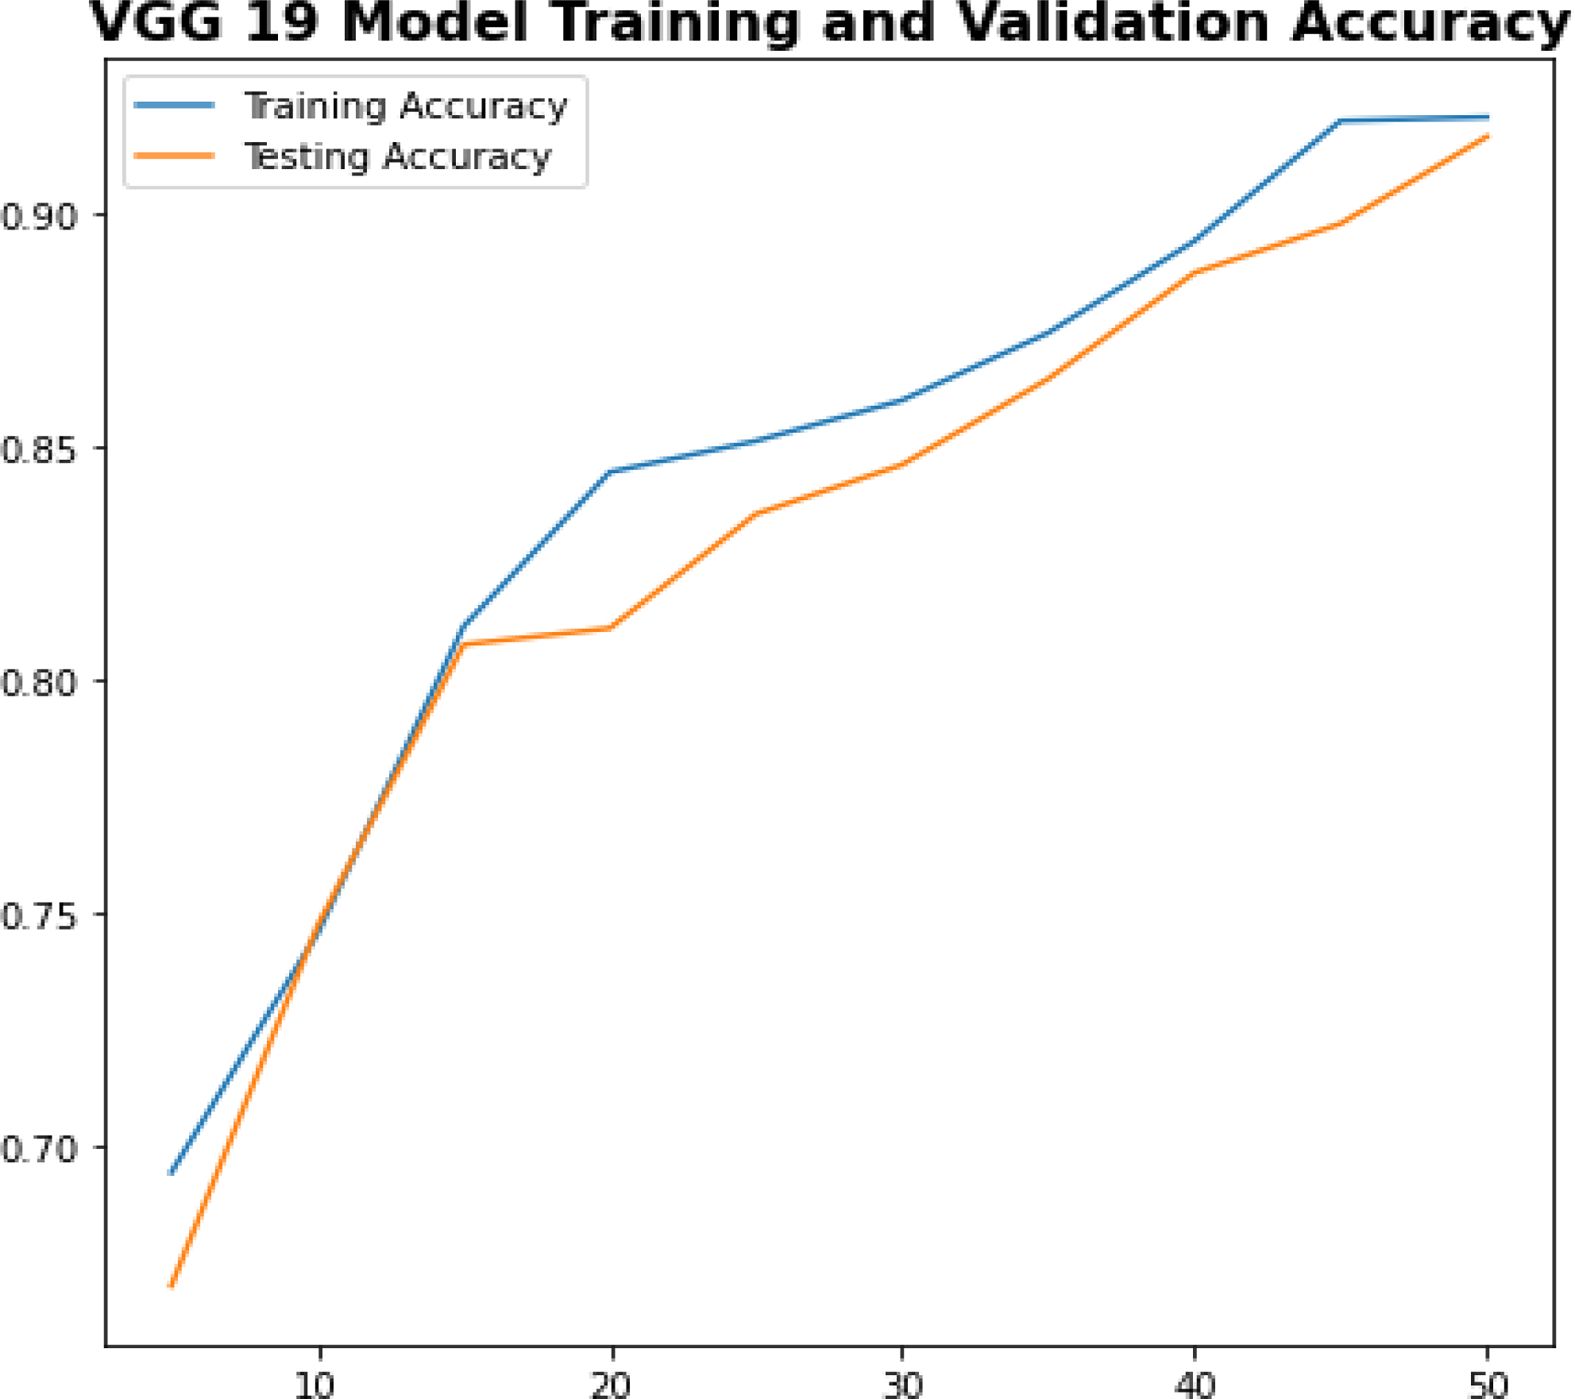
As shown in Figs. 13 and 14, both predefined model works more are as similar to each other but the additional layers of VGG19 increase the power of computation and accuracy.
|
Fig. 8 Size of Training Images |
|
Fig. 9 Size of Testing Images |
|
Fig. 10 Sample snap of Vgg16 Model Summary 1. |
|
Fig. 11 Sample snap of Vgg16 Model Summary 2. |
|
Fig. 12 Sample snap of Vgg19 Model Summary |
|
Fig. 13 VGG 16 Model Accuracy. |
|
Fig. 14 VGG 19 Model Accuracy |
A deep learning-based ceramic tile defect detection system is proposed and simulated in this work. Our rigorous testing shows that our technique works with both small tile crack and no-crack datasets. The suggested method has a detection rate of more than 99%, according to the research. Another advantage of the proposed technique is that it does not need precise mathematical modeling of flaws. As a result, it can identify a wide range of known and unknown tile attributes at the same time. In the future, additional types of tile-surface defects will be gathered from a variety of tile surfaces and patterns, and a more robust classifier will be built.
In the manufacturing sector, defects monitoring for the large volume of production units is one of the challenging tasks. Automatic defect detection for different varieties of the same products and different classification types prediction with smart applications is highly demandable in every manufacturing field like an iron rods, glass, tiles, etc. Most of the research initiative starts with binary classification like defect and non-defect product with the pre-defined model. Now the research direction towards, multi-classification of defect to be detected on the different variety of same product with the intervention of deep learning (large volume of image and video analysis) with smart application shows.
- 1. L.J. Fiol, M.A. Tena, and J.S. García, J. Busin. Amp. Indust. 26[2] (2011) 132-145.
-

- 2. S. Singh and M. Kaur, IOSR J. Eng. 2[3] (2012) 429-432.
-
- 3. R. Mishra, C.L. Chandrakar, and R. Mishra, InInternati. 2[2] (2012) 1307-1322.
- 4. D.S. Atmaja and M.K. Herliansyah, Jurn. Siste. Cerdas 4[3] (2021) 171-179.
-
- 5. A.P. Putri, InMATEC Web of Conferences, 2017 by EDP Sciences (135), p. 00053.
- 6. A.D. Septiani and D. Anne, J. Titra 1[1] (2013) 33-40.
- 7. D.C. Montgomery, in “Introduction to statistical quality control” (John Wiley & Sons, 2020) p. 11.
- 8. J.A. Yeow, P.K. Ng, K.S. Tan, T.S. Chin, and W.Y. Lim, J. Appl. Scien. 14[24] (2014) 3464-3471.
-
- 9. L.A. Martins, in Proceedings of InIECON 2010-36th Annual Conference edited by IEEE Industrial Electronics Society (IEEE, 2010) p. 1081-1086.
-
- 10. R. Mishra and D. Shukla, Int. J. Emerg. Technol. Adv. Eng 4[3] (2014) 229-233.
- 11. H. Rachmat, in Proceedings of the 2nd International Conference on Soft Computing and Data Mining, August 2017, (Springer International Publishing 2016) p. 538-545.
-
- 12. M. Sharma and G. Kaur, Int. J. Comput. Technol 3[2] (2012) 259-262.
-
- 13. T.C. Akinci, Archives. Acoustics. 36[1] (2011) 77-85.
-
- 14. X. Cheng and J. Zheng, Int. J. Eng and Manuf 1[3] (2011) 1.
- 15. V. Mohan and S. Suresh Kumar, Int. J. Comp. Appli. 109[11] (2015) 24-27.
-
- 16. S. Ramakrishnan and I.M. El Emary, Telecom. Sys. 46 (2011) 245-252.
-
- 17. Y. Tao, in Proceedings 5th International Conference on Computational Intelligence and Multimedia Applications, September 2003, edited by IEEE pp. 120-125.
-
- 18. Y. Mingqiang, K. Kidiyo, and R. Joseph, Patt. Reco. 15[7] (2008) 43-90.
- 19. R.M. Andrade and A.C. Eduardo, J. Brazili. Society Mech. Sci. Eng. 33 (2011) 67-73.
-
- 20. A. Materka and M. Strzelecki, Tech. Univ. Lodz. Inst. Elect, COST B11 report, Brussels 10[1.97] (1998) 4968.
- 21. Z. Zhou, Q. Lu, Z. Wang, and H. Huang, Sensors 19[22] (2019) 5000.
-
- 22. O. Stephen, U.J. Maduh, and M. Sain, Electronics 11[1] (2021) 55.
-
- 23. K. Wang, Z. Li, and X. Wang, Appli. Sci. 12[3] (2022) 1249.
-
- 24. A. Tunali, J. Ceram. Process. Res. 15[4] (2014) 225-230.
-
- 25. M. Alia, A. Gherissb, A.H. Al-Assafa, and M. Ismailc, J. Ceram. Process. Res. 23[3] (2022) 257-262.
-
- 26. I. Tatar, N. Ediz, and A. Aydin, Beneficiation. (2015).
- 27. S. Sado, W. Zelik, and R. Lech, J. Ceram. Process. Res. 23[4] (2022) 421-429.
-
 This Article
-
2023; 24(1): 78-88
Published on Feb 28, 2023
- 10.36410/jcpr.2023.24.1.78
- Received on Jun 29, 2022
- Revised on Sep 30, 2022
- Accepted on Oct 26, 2022
Services
- Abstract
introduction
types of ceramic tile defects
inspiration for this study
research questions
literature review
methodology
transfer learning: vgg16 and vgg19
vgg16 architecture
working model of vgg19 architecture
experiments
data augmentation and pre-processing methods
proposed algorithm
implementation results
conclusion
future work
- References
- Full Text PDF
Shared
Correspondence to
- D. Sivabalaselvamani
-
Associate Professor, Department of Computer Applications, Kongu Engineering College, Perundurai, Tamilnadu, India
Tel : +919940049001 - E-mail: sivabalaselvamani@gmail.com
Clean-Energy Research Institute(CRI), Hanyang University, 222, Wangsimni-ro, Seongdong-gu, Seoul, 04763, Korea
E-mail: jcpr@hanyang.ac.kr