


- Interface damage mechanism of rubber cord composite material
Xiaohui Guoa,*, Xiaojing Yuana, Guangyong Liub, Hefang Qiua and Fanfan Cuia
aRocket Force University of Engineering, Xi’an 715600
bKey Laboratory of Rubber-Plastics, Qingdao University of Science & Technology, Qingdao 266042, ChinaThis article is an open access article distributed under the terms of the Creative Commons Attribution Non-Commercial License (http://creativecommons.org/licenses/by-nc/4.0) which permits unrestricted non-commercial use, distribution, and reproduction in any medium, provided the original work is properly cited.
In order to study the interface failure mechanism of rubber cord composites laid at symmetrical angles, a representative volume element was established by the finite element method to simulate the stress distribution at the mesoscopic level of rubber cord composites. The energy-based power law is used to simulate the damage evolution of the cord-rubber interface. The results show that the interface damage is caused by the torque that the cord bears during the stretching process, and the interface assumes the role of transmitting torque in this process, so the failure occurred.The initial interface stiffness is a vital bonding interface parameter that affects the interface damage evolution, and the initial stiffness is positively correlated with the interface damage evolution variable. The increase in the included angle of the cord will cause the torque on the cord to increase, resulting in aggravated interface failure
Keywords: Rubber/cord, Symmetrical angle laying, Finite element, Representative volume element, Cohesive contact, Damage evolution
As a typical engineering material, rubber/cord composite material is widely used in tires, air springs, conveyor belts and other rubber products. It is formed by co-vulcanization of cord and rubber matrix. In rubber products such as tires and air springs, most rubber cord composite materials laid at multiple angles are used. The complex stress state of the material during the deformation process and the interface between the rubber and the cord make its failure challenging to predict and directly affect the safety performance of rubber products. Therefore, it is of great theoretical significance and engineering application value to study the failure mechanism of rubber cord composites.
The material properties of rubber/cord composites have been extensively studied over the past few decades. As early as 1964, Clark [1] systematically discussed rubber cord composites. Since then, the theory and experiment of rubber cord composites have been fully developed. With the continuous progress of computer technology, simulation is more frequently used in the research of rubber cord composites. Su, Benlong et al. [2] studied the failure mechanism of the lapped structure of rubber cord composites using the cohesive zone model. Daljeet K. Singh et al. [3] studied the effect of the interfacial coverage on the matrix on the debonding of the fibre/matrix interface based on the cohesion zone model, revealed the debonding mechanism of the interface, and found that the interface was first peeled from the matrix.
Environmental factors significantly impact the failure of rubber cord composites, including temperature, humidity, pH, etc. S.K. Enganati et al. [4] employed a multiscale approach to study the initial structure of the resorcinol-formaldehyde-latex (RFL) interface and its evolution during heat treatment, demonstrating the existence of an interfacial region between rubber and RFL. The hardness of the RFL interfacial phase increases significantly after heat treatment, which is not conducive to the adhesion between the matrix and the fibres. M. Jamshidi et al. [5] found that the temperature has a specific influence on the adhesion performance between the cord and the rubber, in the range of 25 ℃ to 125 ℃, the increase of the temperature leads to the decline of the adhesion performance between the cord and the rubber, but continue to increase the temperature, the adhesive force has recovered, which is attributed to the destruction and promotion of the interface bond by the temperature. Chloe Valantin et al. [6] studied the effect of fatigue on the interfacial properties of rubber cord composites of resorcinol-formaldehyde-latex coated fabrics and found that there are two failure mechanisms at the rubber cord interface; one is the rubber/RFL interface. Another is pre-existing fibrous microcrack propagation, the debonding between the cord and RFL interface. S. V. Sheshenin et al. [7] conducted a homogenization treatment on rubber cord composites under medium and large deformation. They proposed a correction method to determine the uniform properties of rubber cord composites under large deformation. In addition, due to the inhomogeneous deformation of rubber cord composites due to the reinforcement effect of the cords, to detect the large strain gradient on its surface, digital image correlation technology is being applied in the strain measurement of rubber cord composites [8, 9].
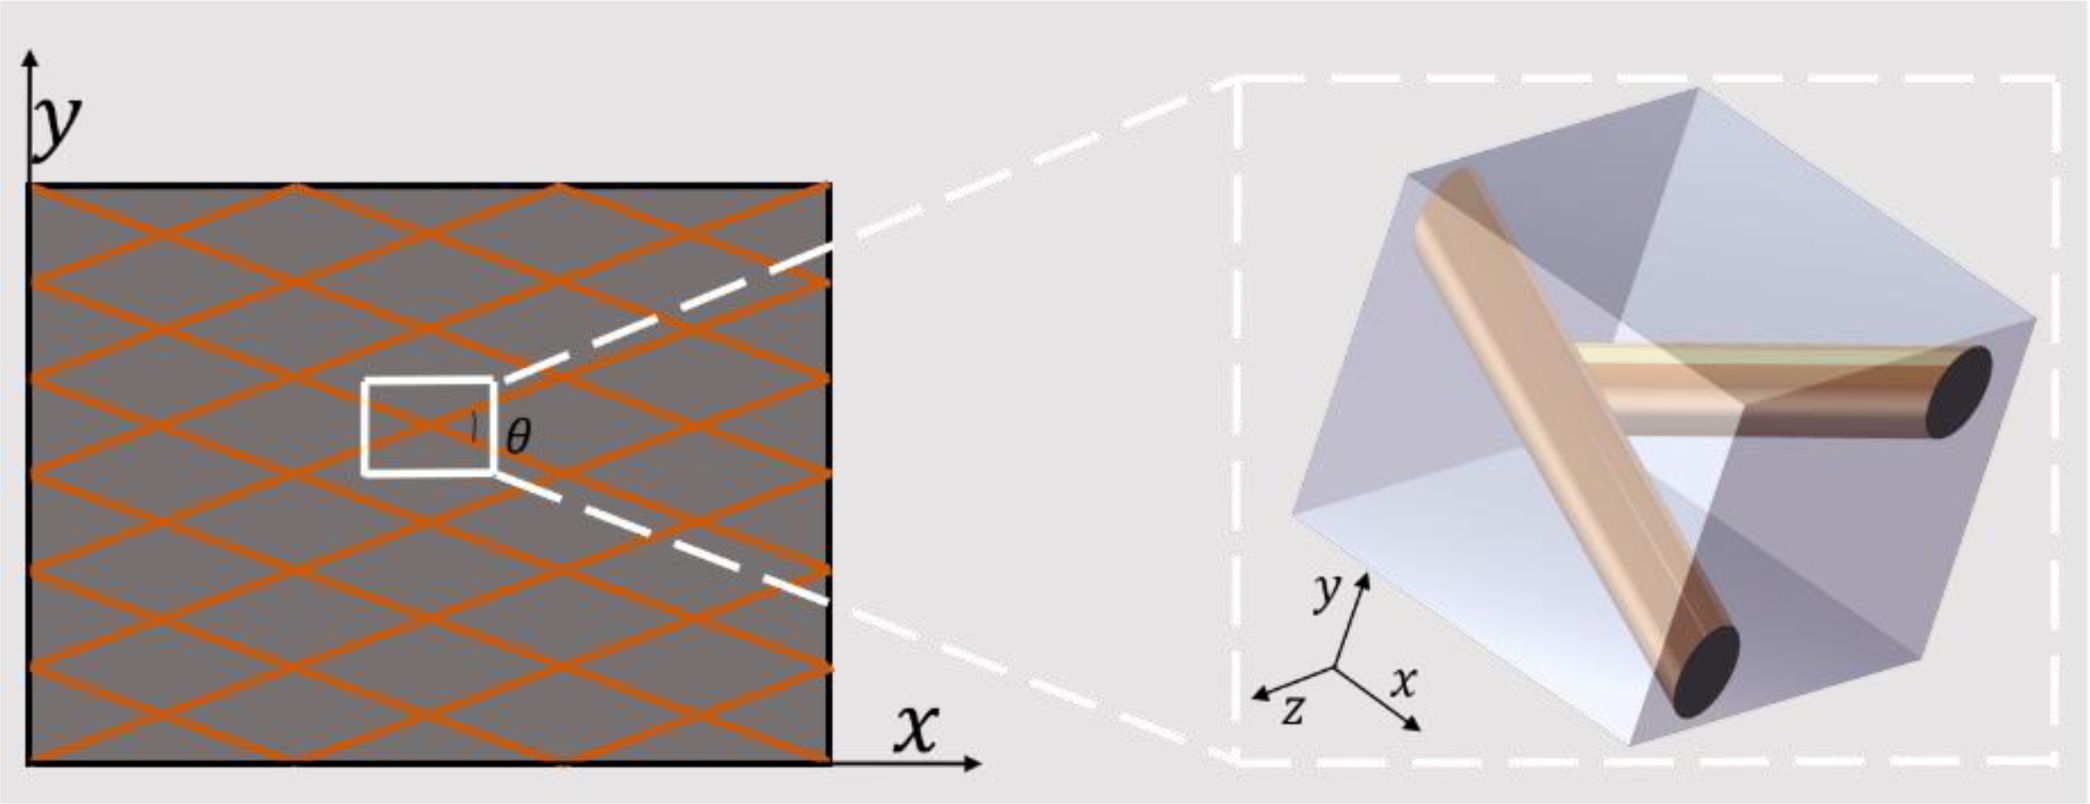
Studies have shown that the first failure of rubber cord composites under tensile load is usually interfaced failure [10, 11]. The existing literature has extensively studied the influence of environmental factors on the interface of rubber-cord composites [5, 12-14]. With the development of computer technology, the interface failure mechanism has been further revealed. However, most of the research on the rubber cord composites laid at a single angle has rarely been reported on the interface failure mechanism of the rubber cord composites applied with multiple angles [15]. This paper establishes a representative volume element finite element model of rubber cord composites laid at a symmetrical angle at the mesoscopic level, and a cohesive zone model is introduced at the interface. The failure mechanism of the interface under uniaxial tension is analyzed through the simulation results. The influence of the initial stiffness of the interface and the included angle of the cord on the damage evolution of the interface is studied.
Representative volume element model
The interfacial properties of cord-reinforced rubber composites have a crucial impact on their overall mechanical properties. However, experimental methods and macroscopic finite element modelling have great limitations in studying interfacial micromechanisms. To explore the microscopic mechanism of the interface of cord-reinforced rubber composites, a finite element model of its representative volume element was established at the mesoscopic level, as shown in Fig. 1.
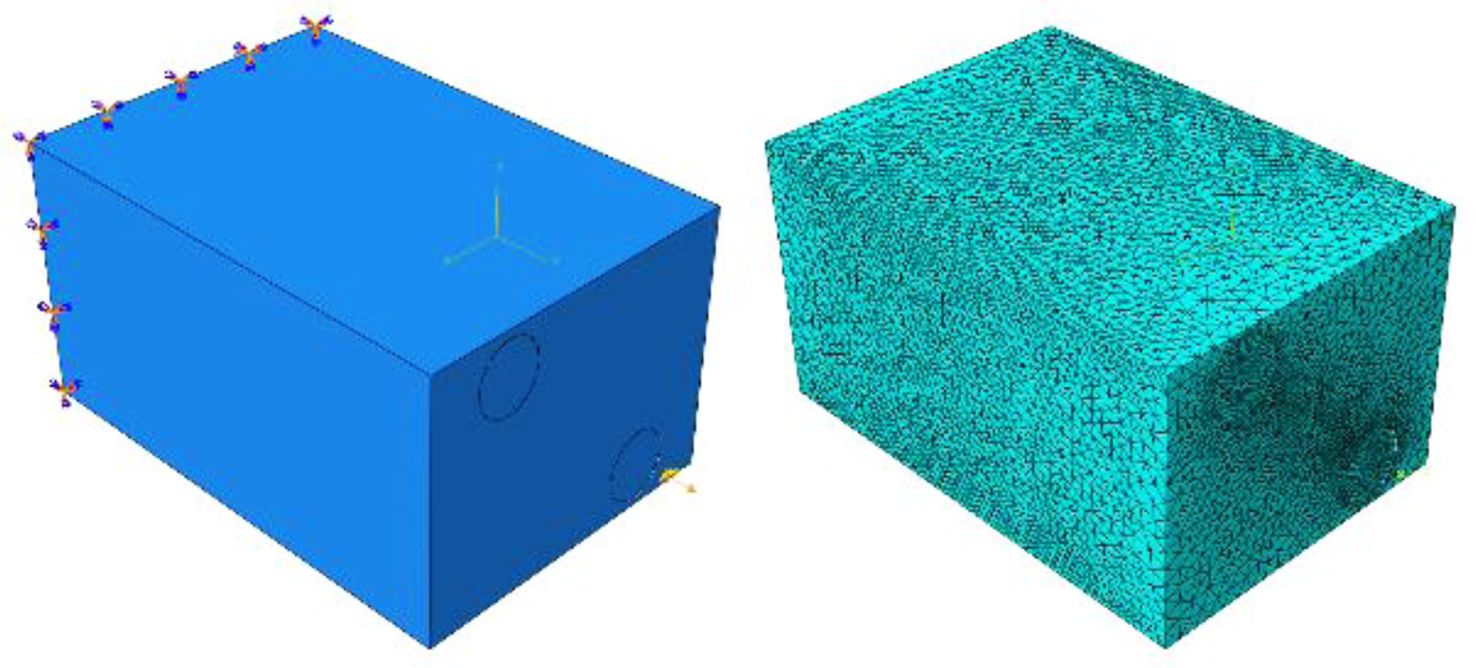
ABAQUS2020 finite element analysis software modelled the representative volume element model, and the mesh division is shown in Fig. 2. The rubber matrix and the cord are hyperelastic materials. The rubber adopts a four-node linear piezoelectric tetrahedron element (C3D4RH), and the solid cord adopts an eight-node linear hexahedron element (C3D8RH). A cohesive contact is set up between the matrix and the cord to simulate the damage behaviour of the interface. A reference point is set at the right end of the model to couple with the right end face, and the left end face of the model is set to be fixed entirely. A displacement along the positive X-axis is applied to the reference point to stretch the representative volume element. The specific loading method is as described in Eq. (1):
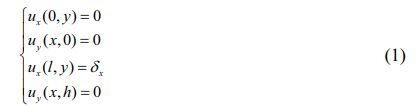
ux, uy are displacements along a given direction, l and h are the length and height of the volume element.
Material constitutive model and parameter solution
Rubber constitutive model
As a hyperelastic material, rubber has various constitutive relations to characterize its mechanical behavior, but different constitutive are suitable for different situations [16]. The selection of different constitutive models greatly influences the accuracy of finite element simulation and needs to be selected according to experimental data and specific conditions.
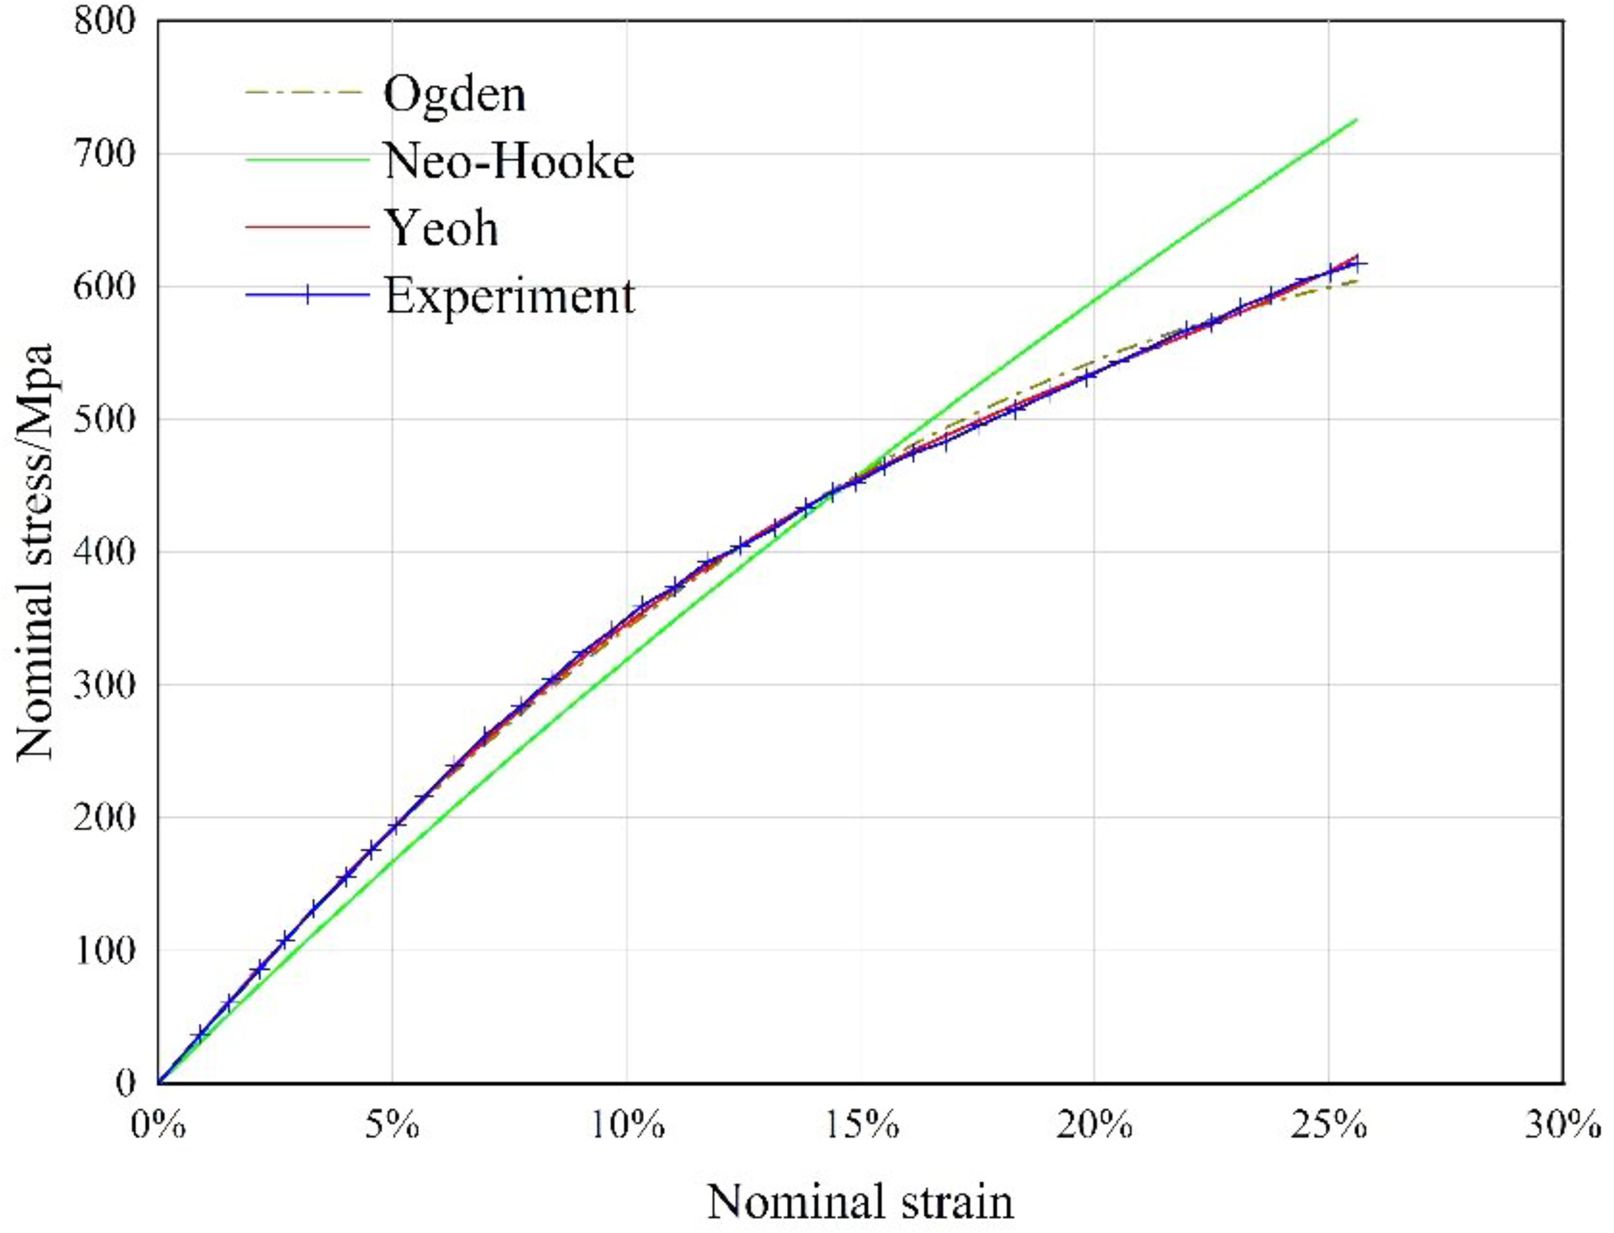
The data in the literature [17] was sampled, the experimental curve between 0-25% strain was taken, and the experimental curve was fitted by the constitutive model of the hyperelastic material that comes with the ABAQUS software. The obtained fitting curve is shown in the Fig. 3. It can be seen from the figure that both the Ogden constitutive model and the Yeoh constitutive model have good fitting results, but between 15% and 25% strain, the fitting result of the Yeoh constitutive model is better than that of the Ogden constitutive model, so choose Yeoh constitutive model as a hyperelastic constitutive model for rubber.
The description methods of rubber mechanical properties in academia are divided into two categories [18]: the method based on continuum mechanics and the other is the method based on thermodynamic statistics. The Yeoh constitutive model is a special form of the polynomial model in the constitutive model of continuum mechanics, and its strain energy function [19] is:
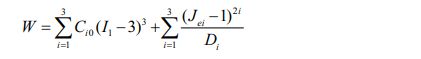
Among them Ci0 is the material parameter of the Yeoh hyperelastic model, C10 is the initial shear modulus, C20 the negative number, which causes softening at moderate deformation, C30 is the positive value, which means hardening at large deformation; I1 is the first strain invariant; Di is the compressibility of the material.
The constitutive model of the cord
The cord can be considered a linear elastic material in the small strain range (0-2.5%). After consulting the literature, it is known that the elongation at the break of most cords is between 15% and 25% [20]. At this time, it is inaccurate to describe the mechanical behaviour of the cords as linear elasticity, and the wrong simulation results will be obtained. The mechanical properties of the cord are therefore chosen to be superelastic.
Due to the twisted structure of the cords in the cord-reinforced composite material [21, 22], biaxial stretching and planar stretching cannot be performed on them, and only uniaxial tensile experimental data can be obtained. The Marlow model is the most commonly used first invariant model. It only uses a scalar function to define the mechanical properties. For the case of only a single tensile data, the Marlow model is more suitable [23]. The strain energy function [24] of the Marlow model is:

Among them, I1 is the first strain invariant, J el is the elastic volume ratio, and Wdev and Wvol are the offset part and the volume part.
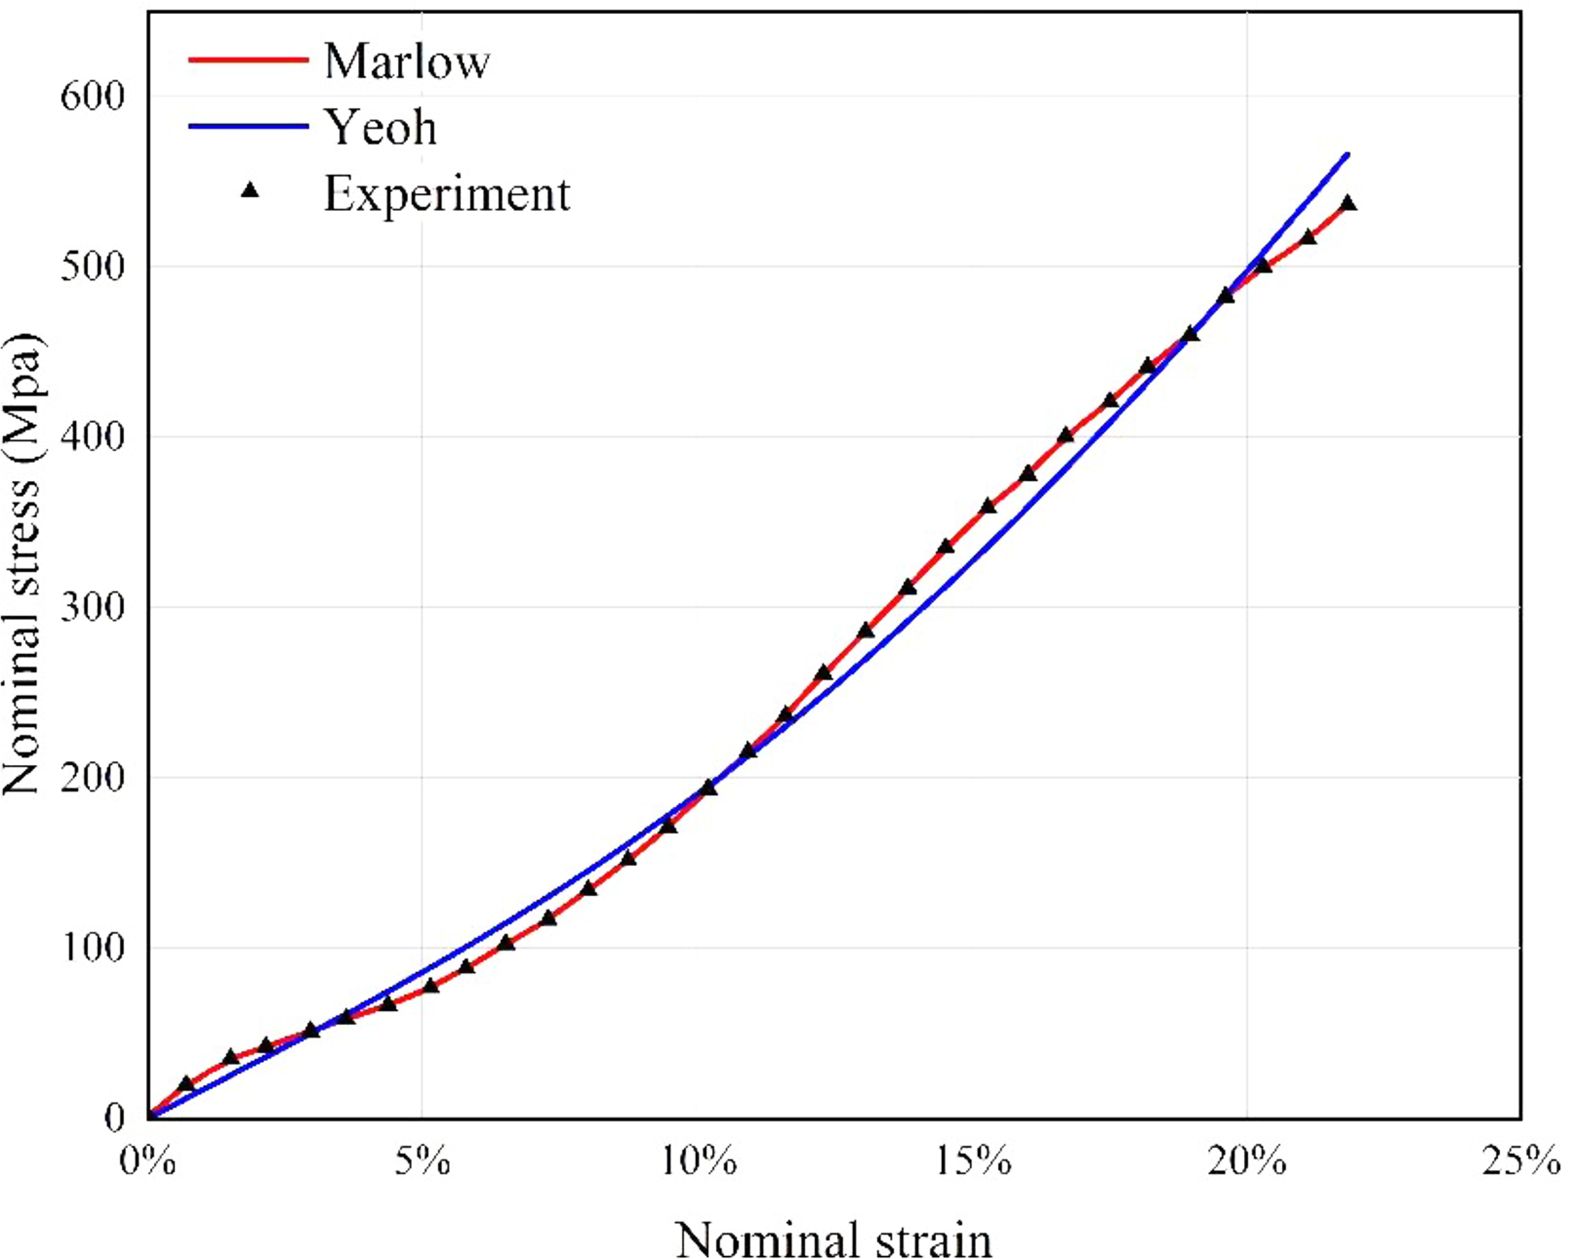
The data in the literature [17] was sampled, and the uniaxial tensile data of the cord was fitted by the Marlow constitutive model and the Yeoh constitutive model in Abaqus, as shown in the Fig. 4. The goodness of fit of the Marlow model to the experimental data is 0.9997, while the goodness of fit of the Yeoh model is 0.975, so it is more appropriate to use the Marlow model here.
|
Fig. 1 Representative volume element of rubber cord composite material. |
|
Fig. 2 Representative volume element meshing and boundary condition settings. |
|
Fig. 3 Hyperelastic constitutive model fitting curve and experimental data curve. |
|
Fig. 4 Fitting curve of Hyperelastic constitutive model and cord experimental data curve. |
The Cohesive Zone Model (CZM) expresses the bonding behaviour of the interface with the nonlinear relationship between the stress acting on the interface and the separation amount [25]. In the ABAQUS2020 software, there are two forms of addition of cohesion properties, namely cohesion element and cohesion contact. In this paper, the cohesive force contact method is adopted; the surface-surface connection is set between the cord and the rubber matrix, and the contact property is defined as the cohesive force contact.
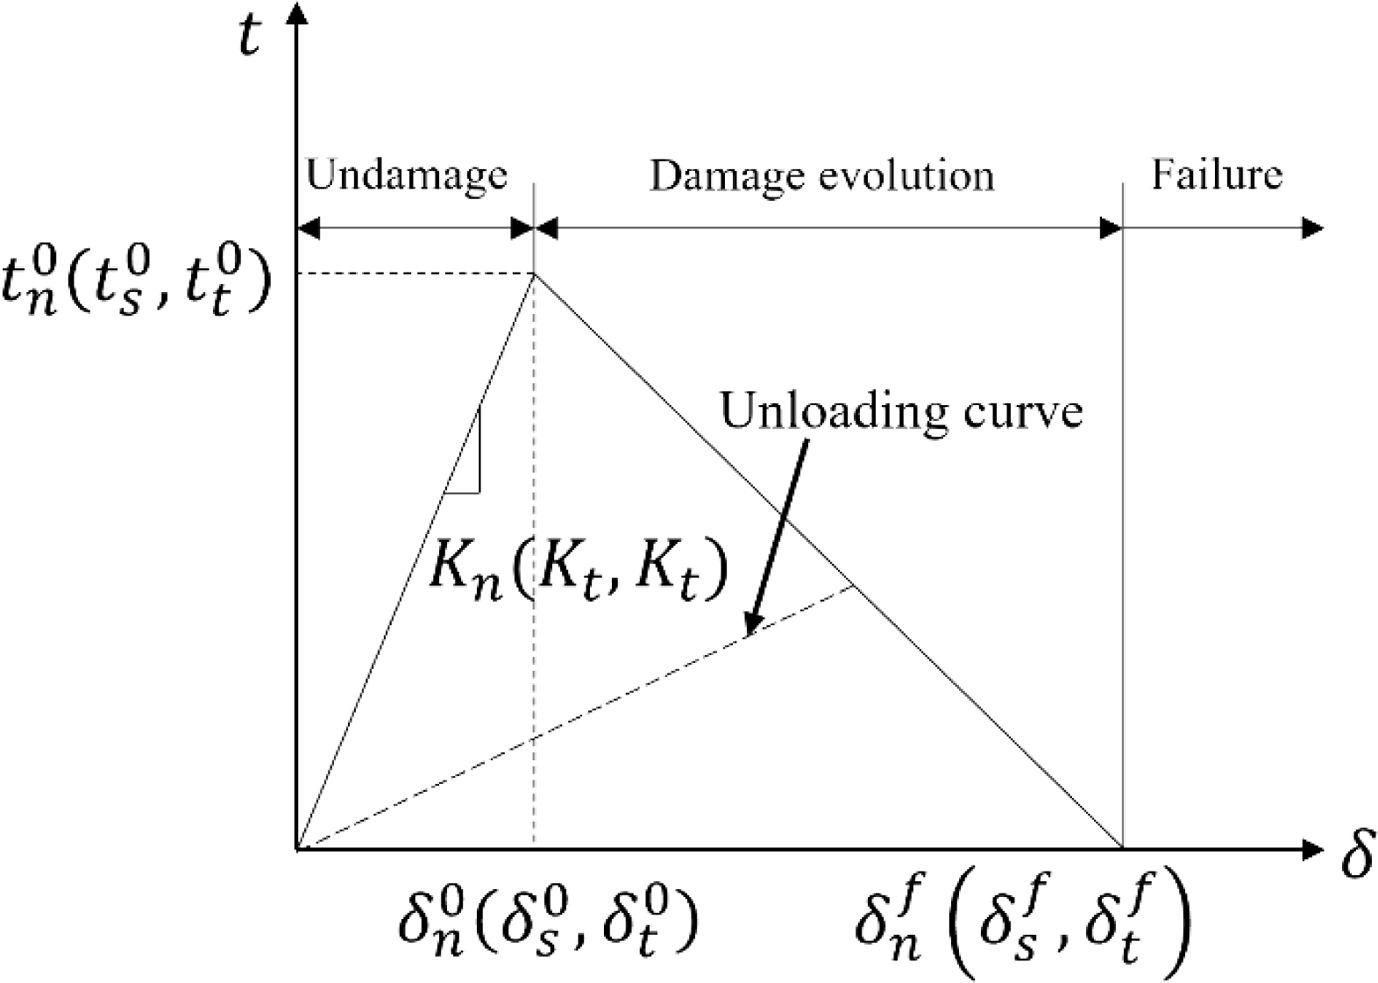
The tensile-separation curve of the bilinear cohesion model is shown in Fig. 5. Kn, Ks, and Kt are the normal direction of the interface before the adhesive layer is destroyed. The initial stiffness in the first and second shear directions, respectively, δ is the separation of the interface displacement, δ 0 is the opening displacement of the interface when the tensile load is the largest and δ f is the opening displacement of the interface when the adhesive layer fails completely.
The maximum stress criterion is selected as the damage initiation criterion, and the expression is as follows:

When any of the normal, first, and second shear stresses exceed their critical stress, the interface begins to damage.
The damage propagation option is based on the energy-based Power-Law criterion, which states that the failure of an interface in a mixed-mode is jointly determined by the energy required to cause a single failure (normal, first shear, and second shear) mode. Its expression is as follows:
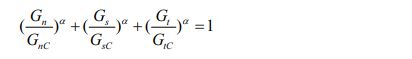
Among them Gn Gs Gt are the surface energies of normal, first, and second tangential crack propagation, respectively GnC GsC GtC are the critical surface energies of normal, first, and second tangential crack propagation, respectively, namely The area enclosed by the tensile separation curve in the figure, α is the material coefficient, which is determined by the viscose material.
The damage evolution variable D denoted as CSDMG, represents the degree of damage in the output variable. ABAQUS defines damage evolution as follows: As shown in the Fig. 5, when the stress state of the interface satisfies the damage initiation criterion, the interface enters the damage evolution stage, that is, the damage evolution stage in Fig. 5, and the unloading curve in this state always moves toward In the direction of the origin of the tensile separation curve, as shown by the in Fig. 5, the reloading is also carried out along this path until the linear damage stage is reached again. The damage evolution variable D is defined as follows:

T0ef is the effective traction force at the beginning of the damage and δmaxm is the maximum effective separation displacement during loading. When the damage evolution variable D is 0, the interface is in good condition. When D is between 0 and 1, the interface is in a state of damage evolution, and when D is 1, the interface fails.
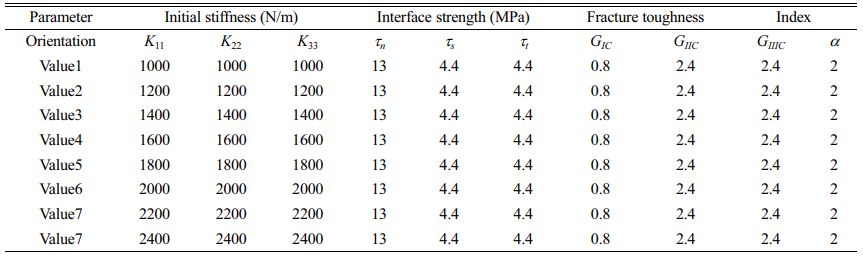
The parameters of the cohesion model are taken from the literature [2], as shown in Table 1.
|
Fig. 5 Typical tension-separation curve of cohesion zone bilinear model. |
Failure mechanism of cord-reinforced rubber interface
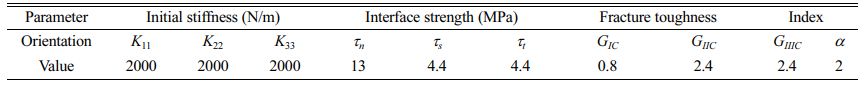
The Fig. 6 shows the local stress distribution of a representative volume element model with a cord angle of 40° at the initial loading stage. It can be seen that there is a significant stress concentration around the cord, reaching 34.6 MPa, which is significantly higher than the stress of other parts of the matrix. This indicates that the rubber bonded to the cord is subjected to more significant stress in the initial stretching stage.
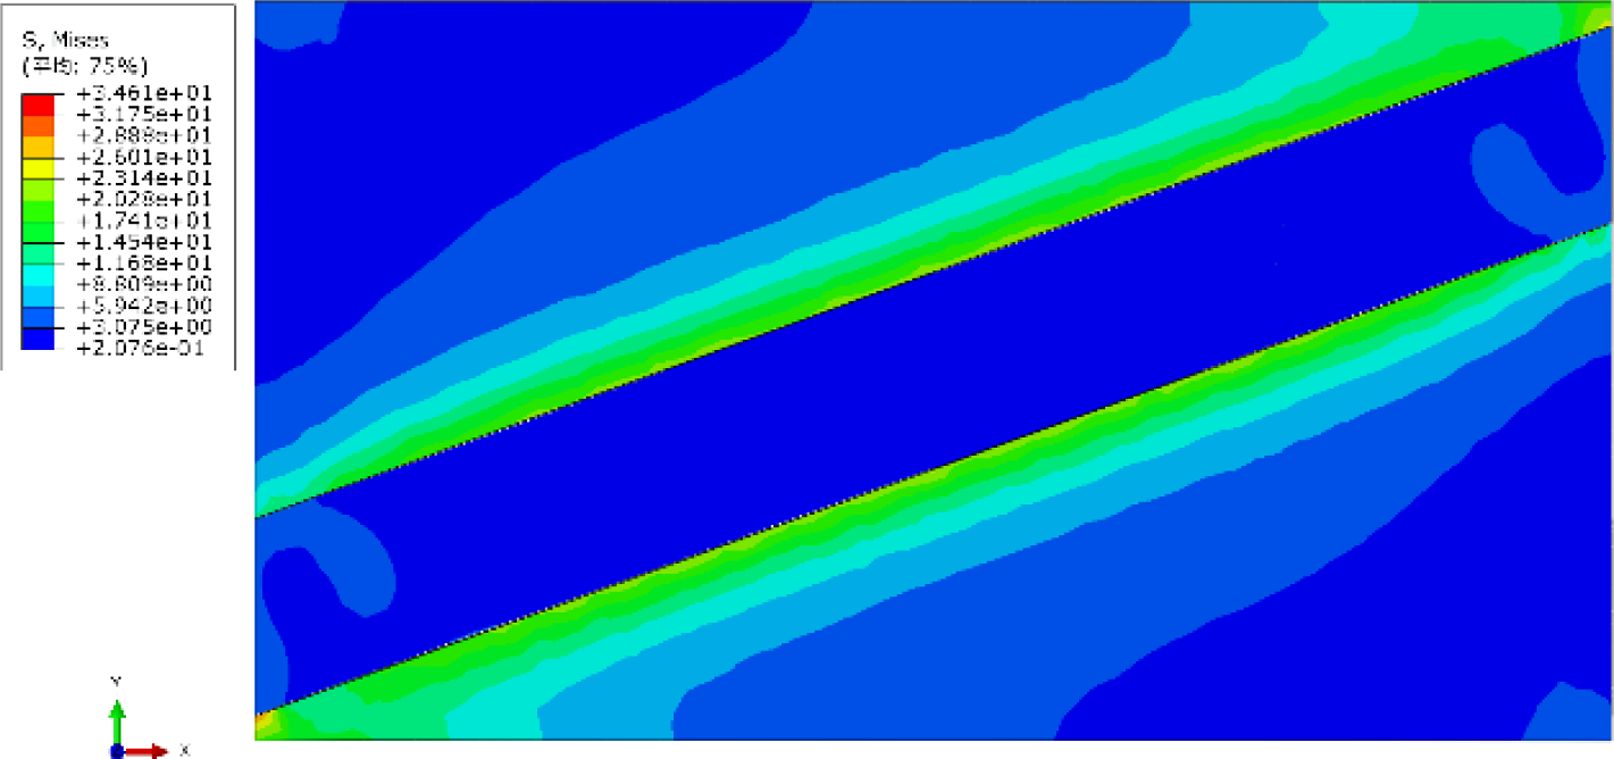
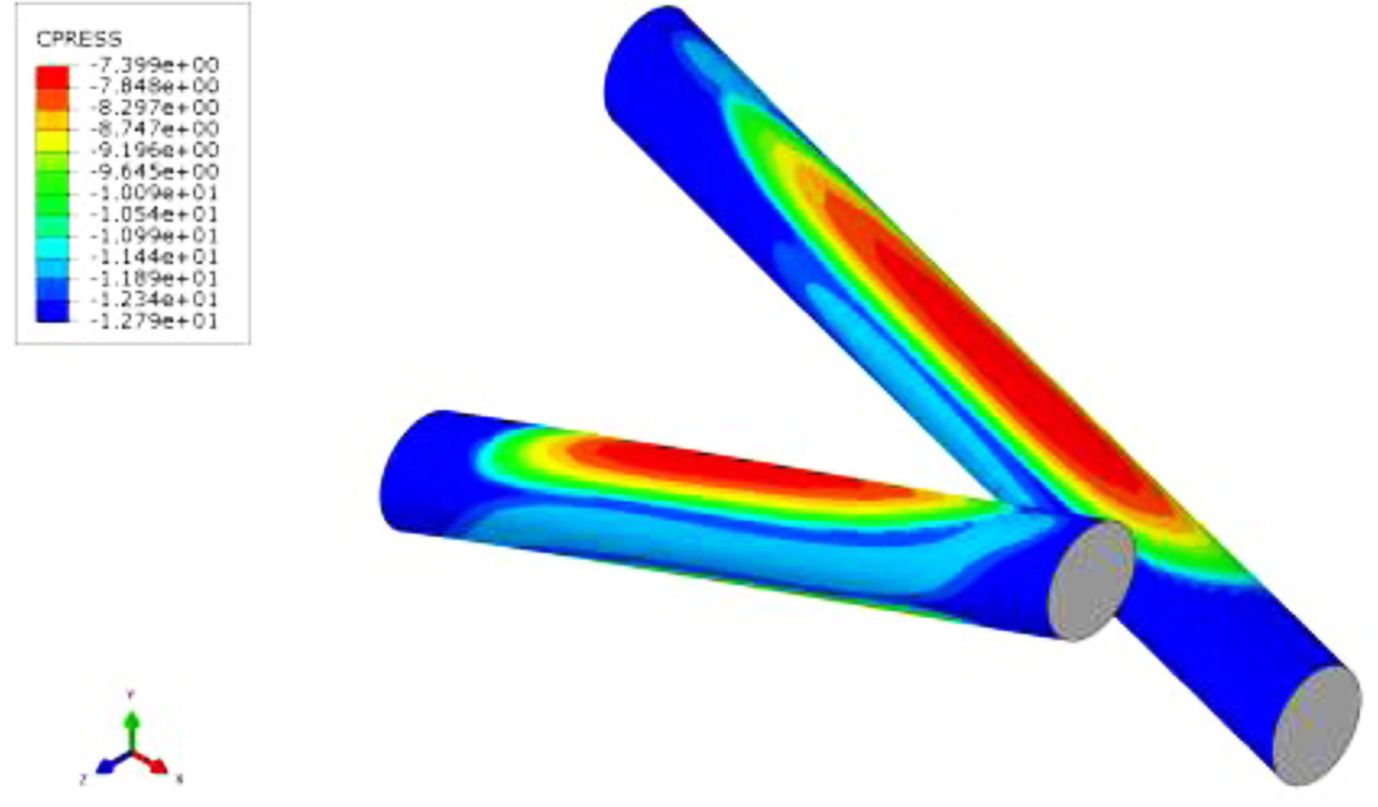
The contact stress during the loading process of the contact surface between the rubber matrix and the cord was further analyzed. The Fig. 7 and 8 shows the normal contact stress (CPRESS) and the first shear stress (CSHEAR1) distribution on the contact surface during loading. It can be seen from the figure that there are large normal contact stress and first shear stress distributed on the upper and lower sides of the cord. The normal contact stress is negative, indicating that the contact surface is subjected to normal tension. The first shear stress is in the opposite direction on the two intersecting cords, and gradually expands in the axial direction from the middle of the cord. Most of the contact surface is the region where the first shear stress reaches 4.34 MPa, close to the critical value of the first shear stress of 4.4 MPa.
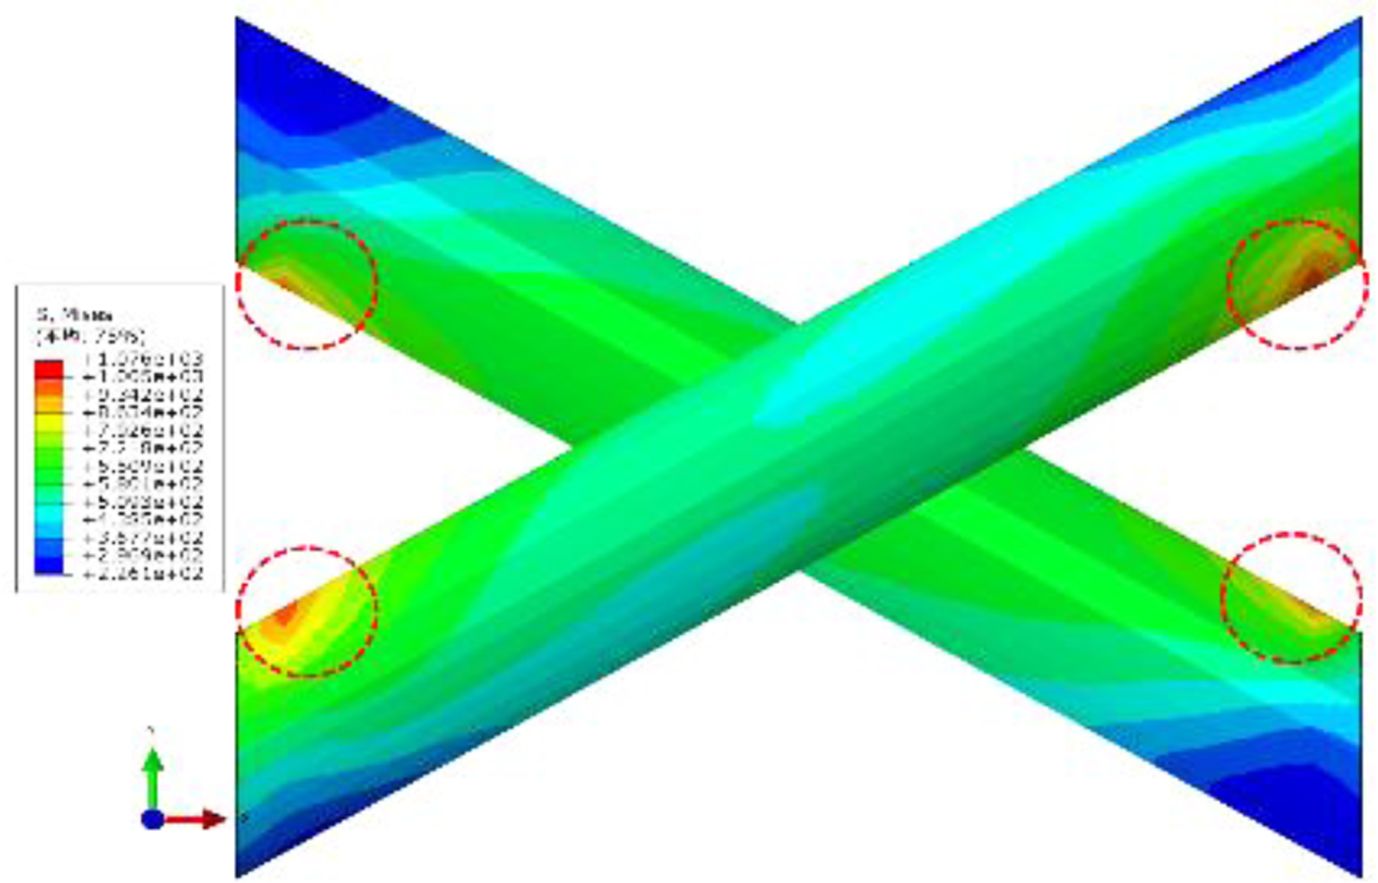
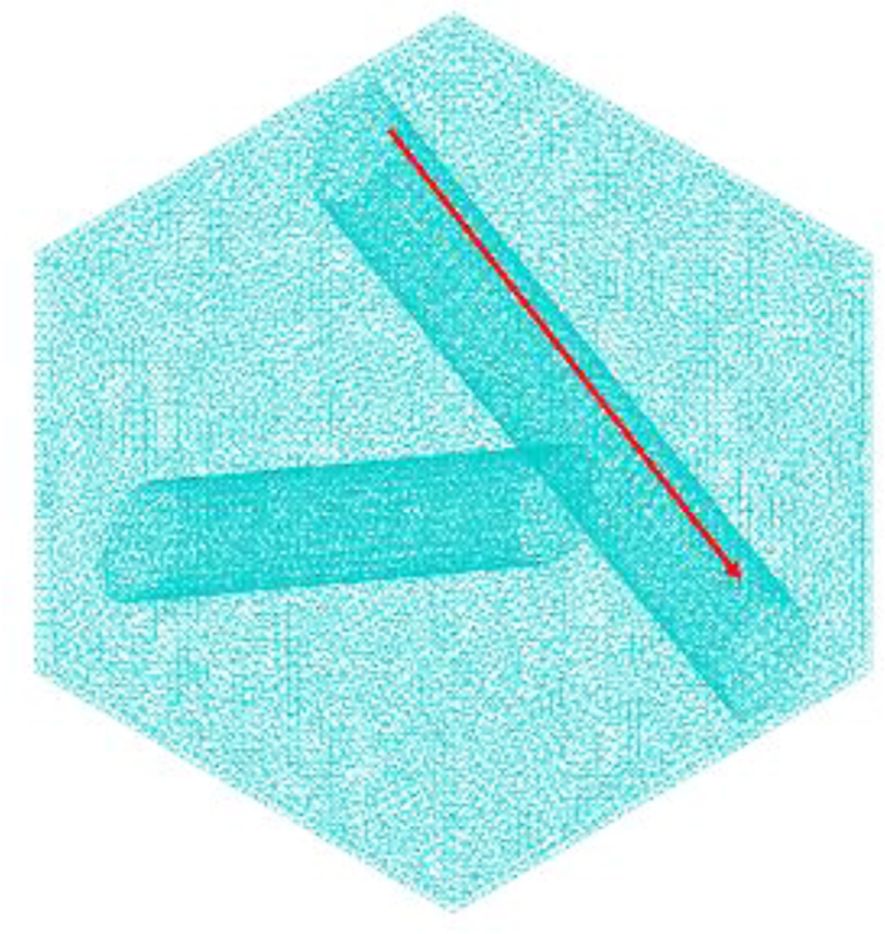
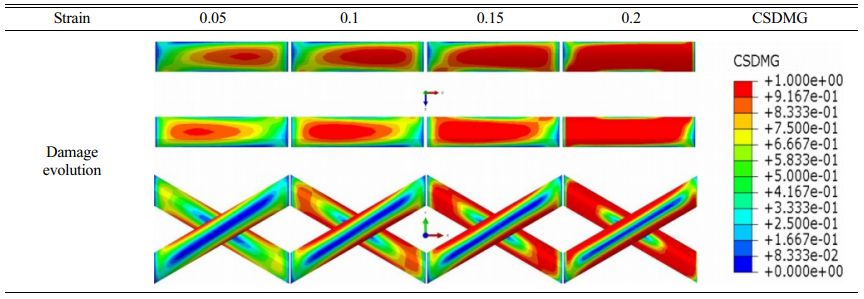
Table 2 shows the distribution of damage evolution variables for a representative volume element with a cord angle of 60° under different loading and displacement. The interface damage is mainly distributed on the upper and lower sides of the cord, matching the contact stress distribution. With the increase of the loading displacement, the damage gradually expands along the axial direction on the upper and lower sides of the cord, and the damage evolution variable gradually increases. The damage evolution variable reaches a maximum value of 1 at the position shown by the red dashed box in Fig. 9, indicating that the interface at this position fails. Table 2 is a schematic diagram of the damage evolution and expansion. The damage gradually expands from one end of the cord to the middle, and the damage expansion paths of the two intersecting cords are symmetrically distributed. Expand progressively, as shown in Fig. 10.
The interface failure first occurred at the position of the red dotted line shown in Fig. 10 and then gradually expanded in the direction of the arrow in the figure. The expansion directions of the upper and lower sides were opposite, and the failure area steadily increased. Since the left and right sides of the cord are subjected to clockwise torque during the loading process, and the torque is the largest at the initial failure position of the interface, it gradually decreases along the direction of the red arrow in the Fig. 10, which is consistent with the expansion law of the interface damage evolution. Figure 8 shows the local stress distribution on the surface of the cord during the loading process. It can be seen that there is a stress concentration at the position of the red dotted line, which is consistent with the initial failure position and decreases along the axial direction of the cord.
It can be seen that the moment generated during the stretching process is the main reason for the interface failure. During the stretching process, the torque is transmitted between the rubber and the cord through the interface, which leads to the separation failure of the interface. The moment on the two ends of the cord is the largest, so the interface failure at the two ends is the most serious, and it will gradually expand to the middle.
Influence of initial interface stiffness on damage evolution
The interface transmits the load between the rubber matrix and the cord, and the progressive damage of the interface leads to a continuous increase in the stress in the matrix. The matrix finally fully bears the load, causing the matrix to fracture [26]. Based on the selection of the cohesive force parameters in the literature [2], different initial stiffnesses of the interface are set, and the law of its influence on the interface failure is obtained.
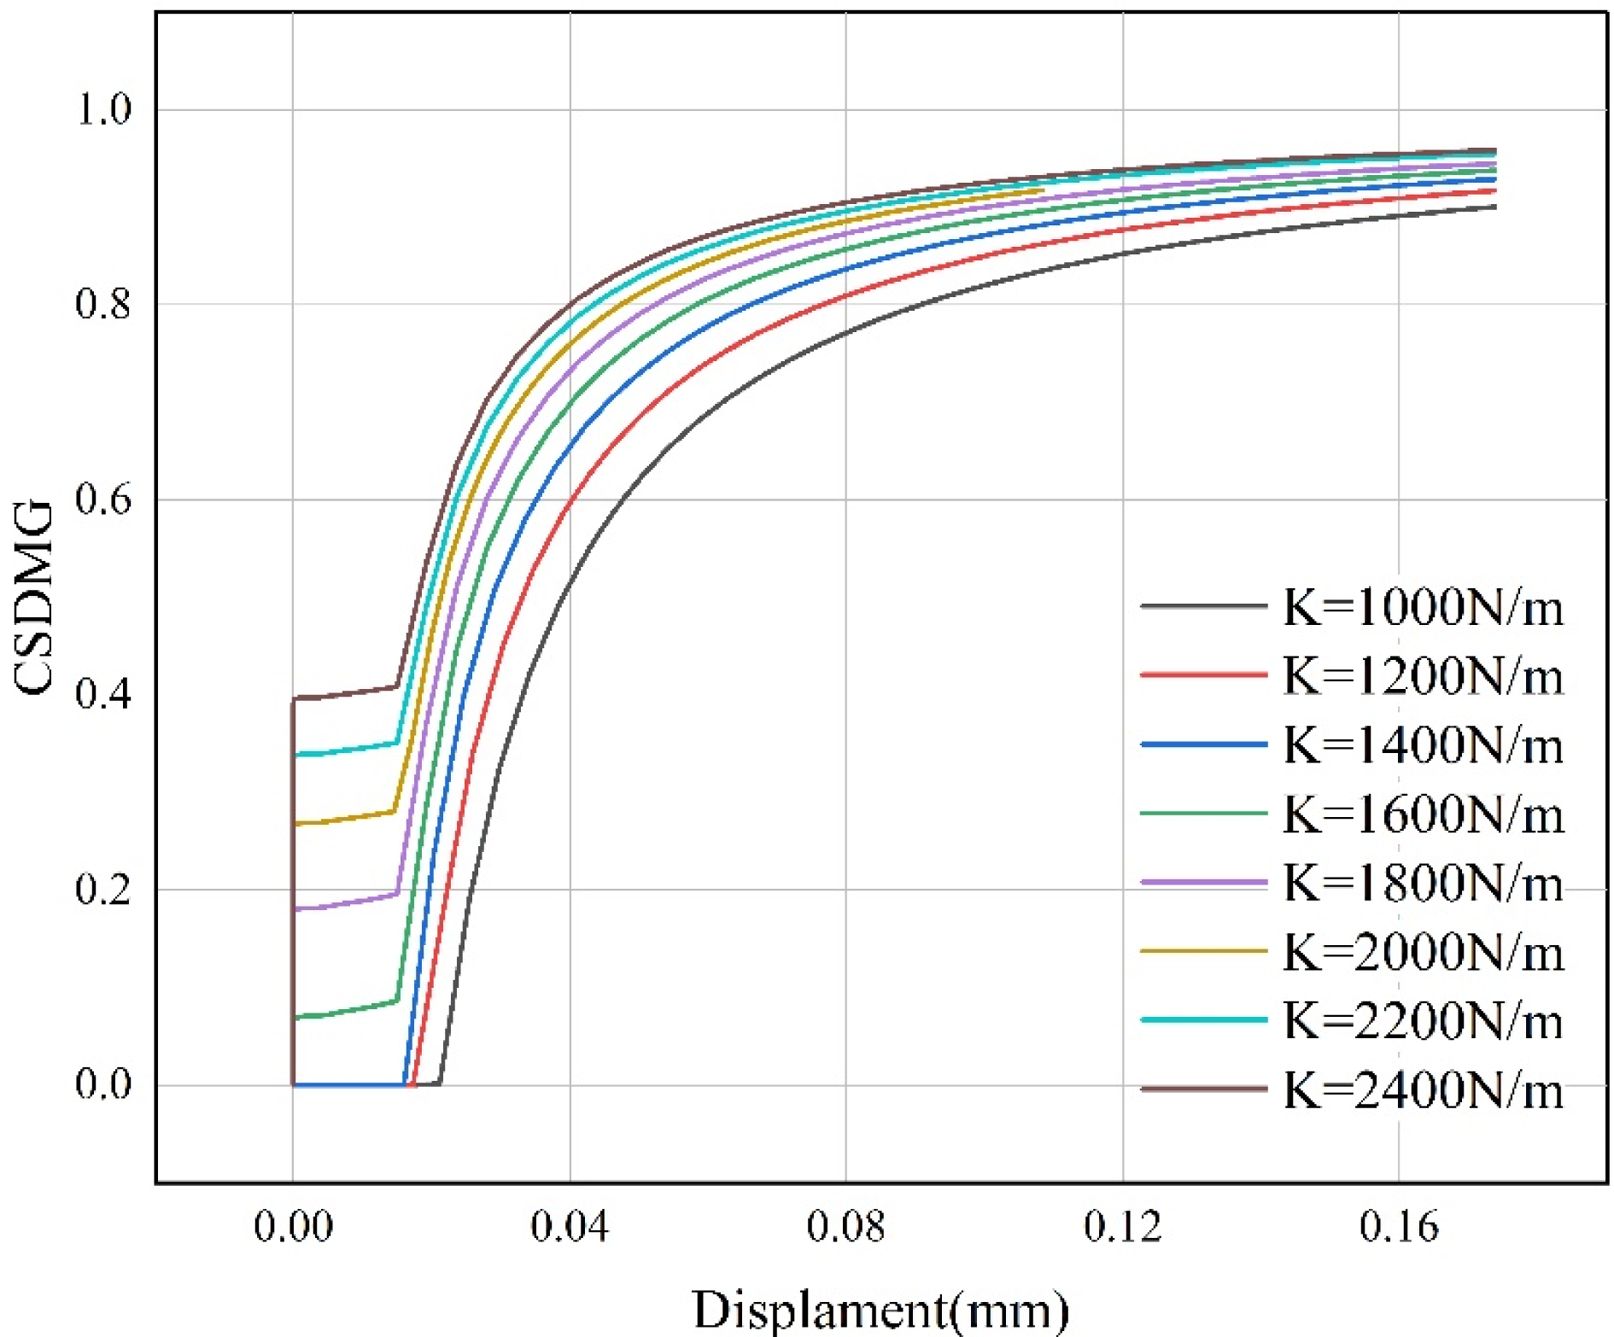
In viscous contact, the greater the stiffness, the less likely it is to produce relative motion between the contact surfaces. Under the same force, the relative displacement of the bonding surface with high rigidity is smaller. However, when the relative displacement occurs between the bonding surfaces with different stiffness, the bonding surfaces with higher stiffness will bear an enormous load. Under the same fracture toughness condition, the damage will occur earlier. In the case of the same fracture toughness, seven different viscous contact stiffness values are set, as shown in Table 3, and other model settings remain unchanged.
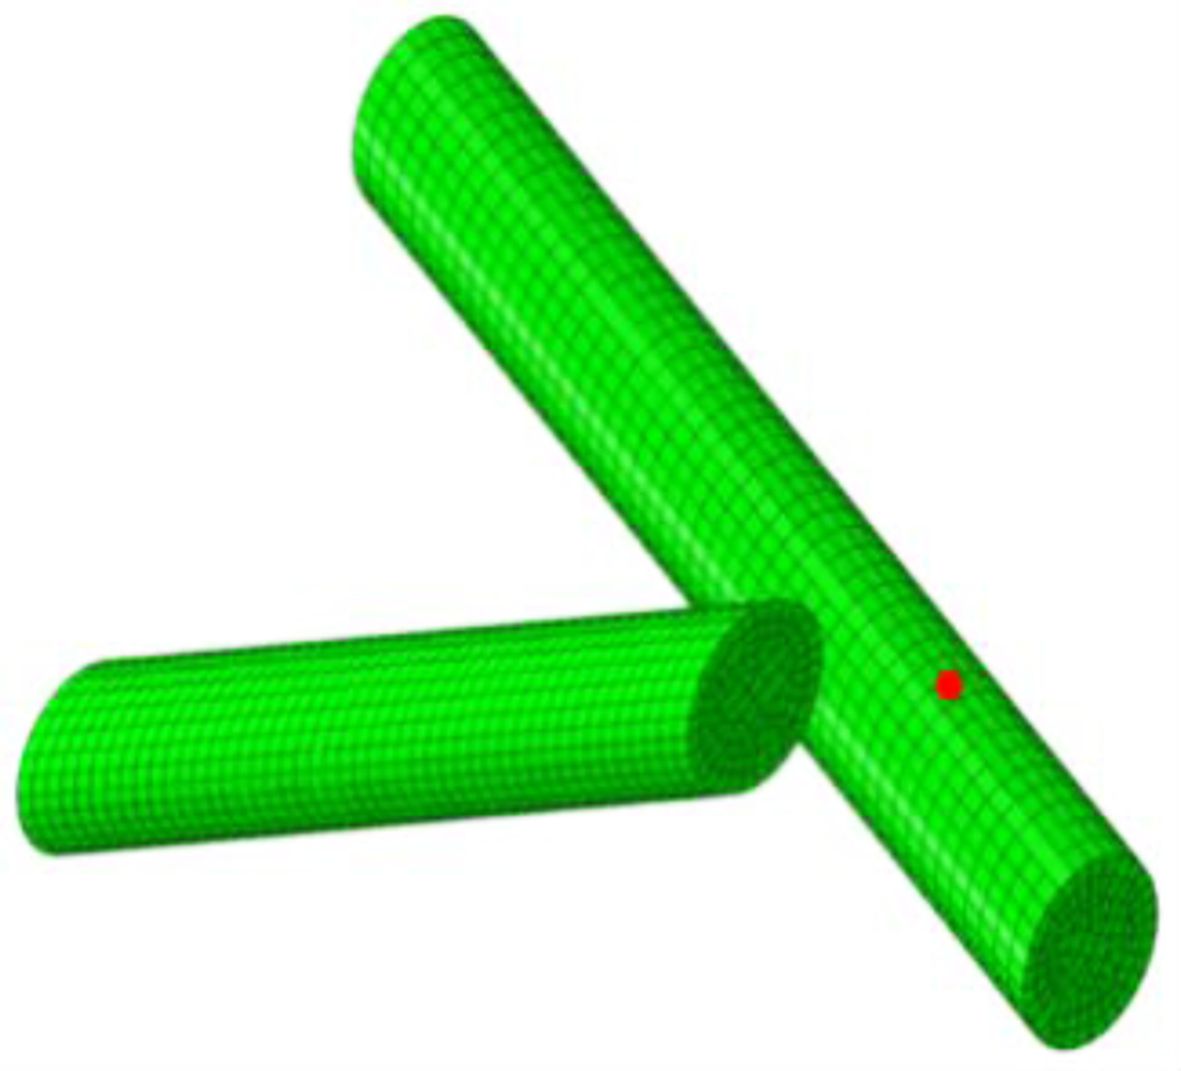
Considering that the damage is evident near the node shown in Fig. 11 during loading, the positioning node shown in Fig. 11 on the contact surface was selected, and the change curve of the damage evolution variable of the node with the displacement of the node under eight different stiffnesses was extracted, as shown in Fig. 12 shown. The evolution variable of the initial stiffness damage changes differently at various interfaces. There are two other variation laws in Fig. 12. When the initial stiffness is between 1000 N/m and 1400 N/m, the damage evolution variable is 0 in the initial loading stage, indicating that the interface is intact at this stage. When the loading reaches a particular location, the damage evolution variable increases exponentially. When the initial stiffness exceeds 1400 N/m, the damage evolution variable changes abruptly in the initial loading stage. The greater the stiffness, the higher the initial damage evolution variable, and then goes through a linear growth stage and finally enters an exponential function growth. Final, the stiffness has two effects on the damage to the interface: First, the higher the initial stiffness of the interface, the greater the degree of damage to the interface during the entire loading process. When the displacement in the figure is the same, the model D with higher initial stiffness is more. The second is that the higher the stiffness, the earlier the interface damage occurs. This may be because under the same displacement, the tensile force on the interface will increase with the increase of the initial interface stiffness, so the material with higher interface stiffness will be damaged earlier than the material with lower interface stiffness.It can be seen from the Fig. 12 that the higher the stiffness, the smaller the displacement of the damage evolution into the exponential growth stage.
Influence of cord angle on interface failure
The representative volume element models with cord included angles of 0°, 20°, 30°, 40°, 50°, and 60° were established, respectively. Apply the load so that it has the same nominal strain.
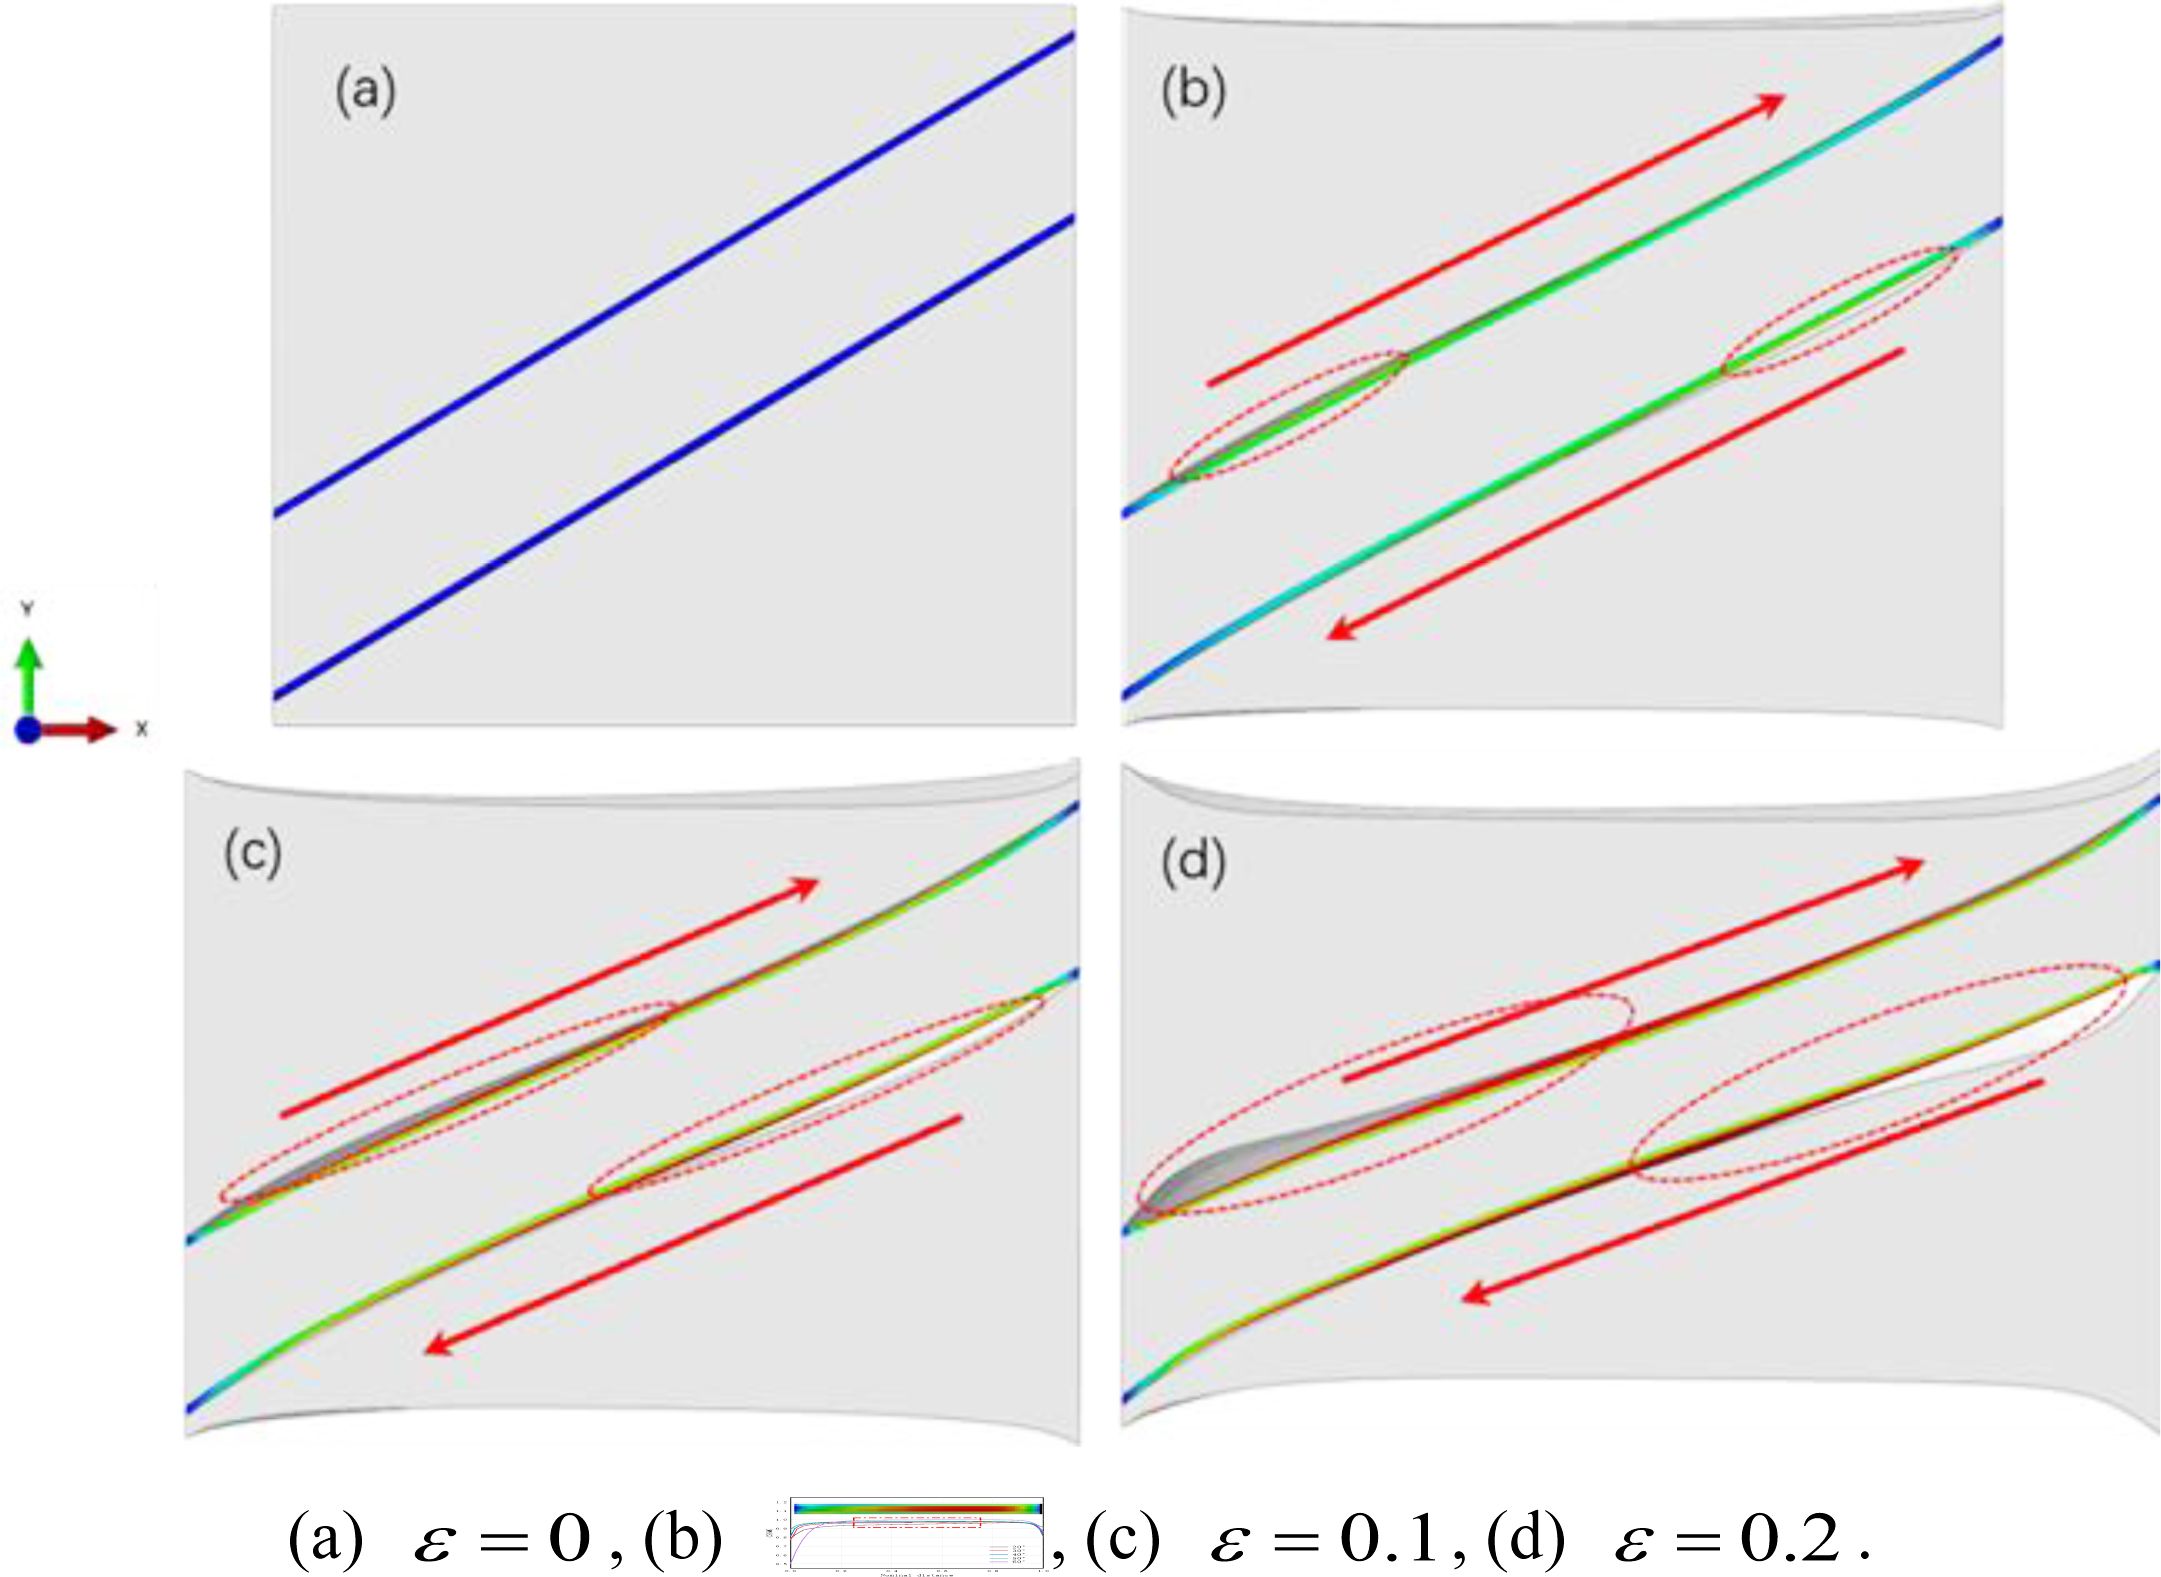
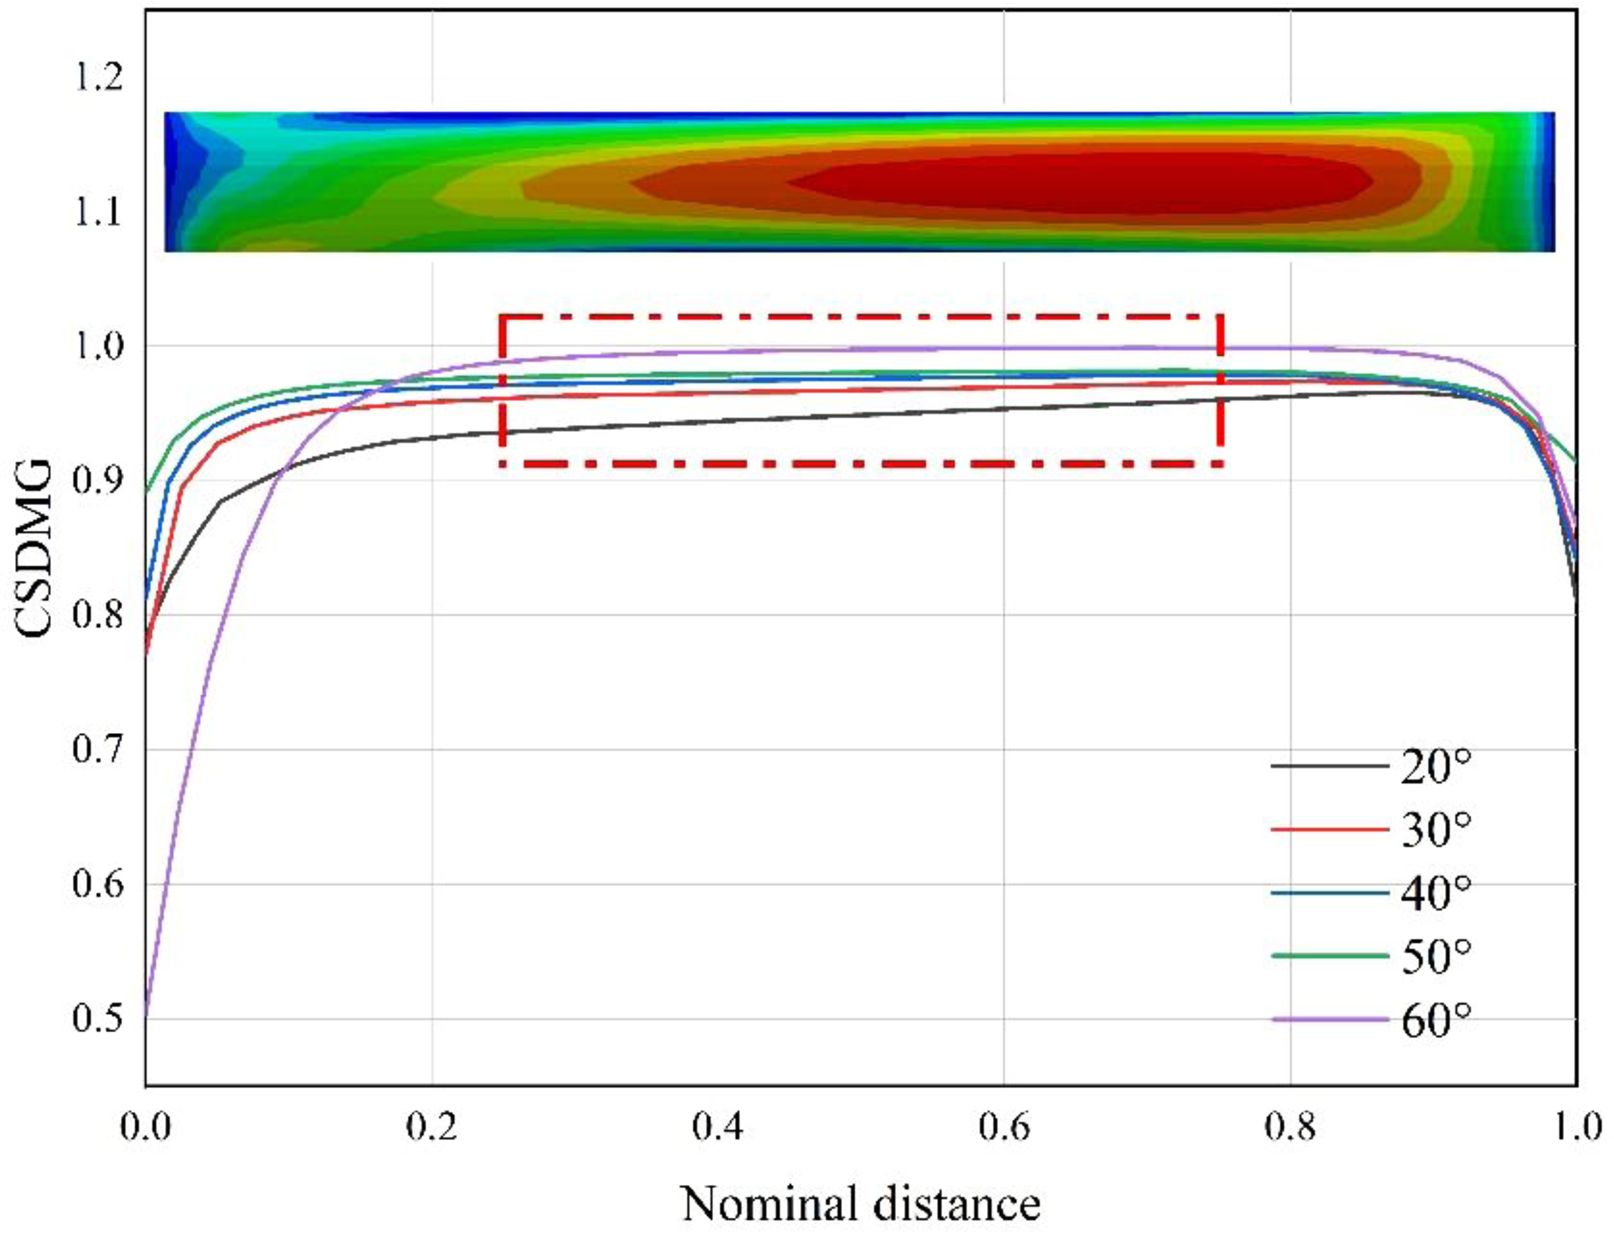
As shown in the Fig. 13, take the path along the axis direction on the contact surface of the model, and draw the damage evolution variable curve of each model along the path when each model is in the same nominal strain. Normalized processing.
Figure 14 shows the distribution of damage evolution variables on the path for different cord angle models when the nominal strain is 25%. It can be seen that the larger the included angle of the cord, the larger the average damage evolution variable and the higher the damage degree. In addition, it can be found that within the range of the dotted line in the figure, the stiffness decrease rate gradually increases from the start point to the endpoint of the path.
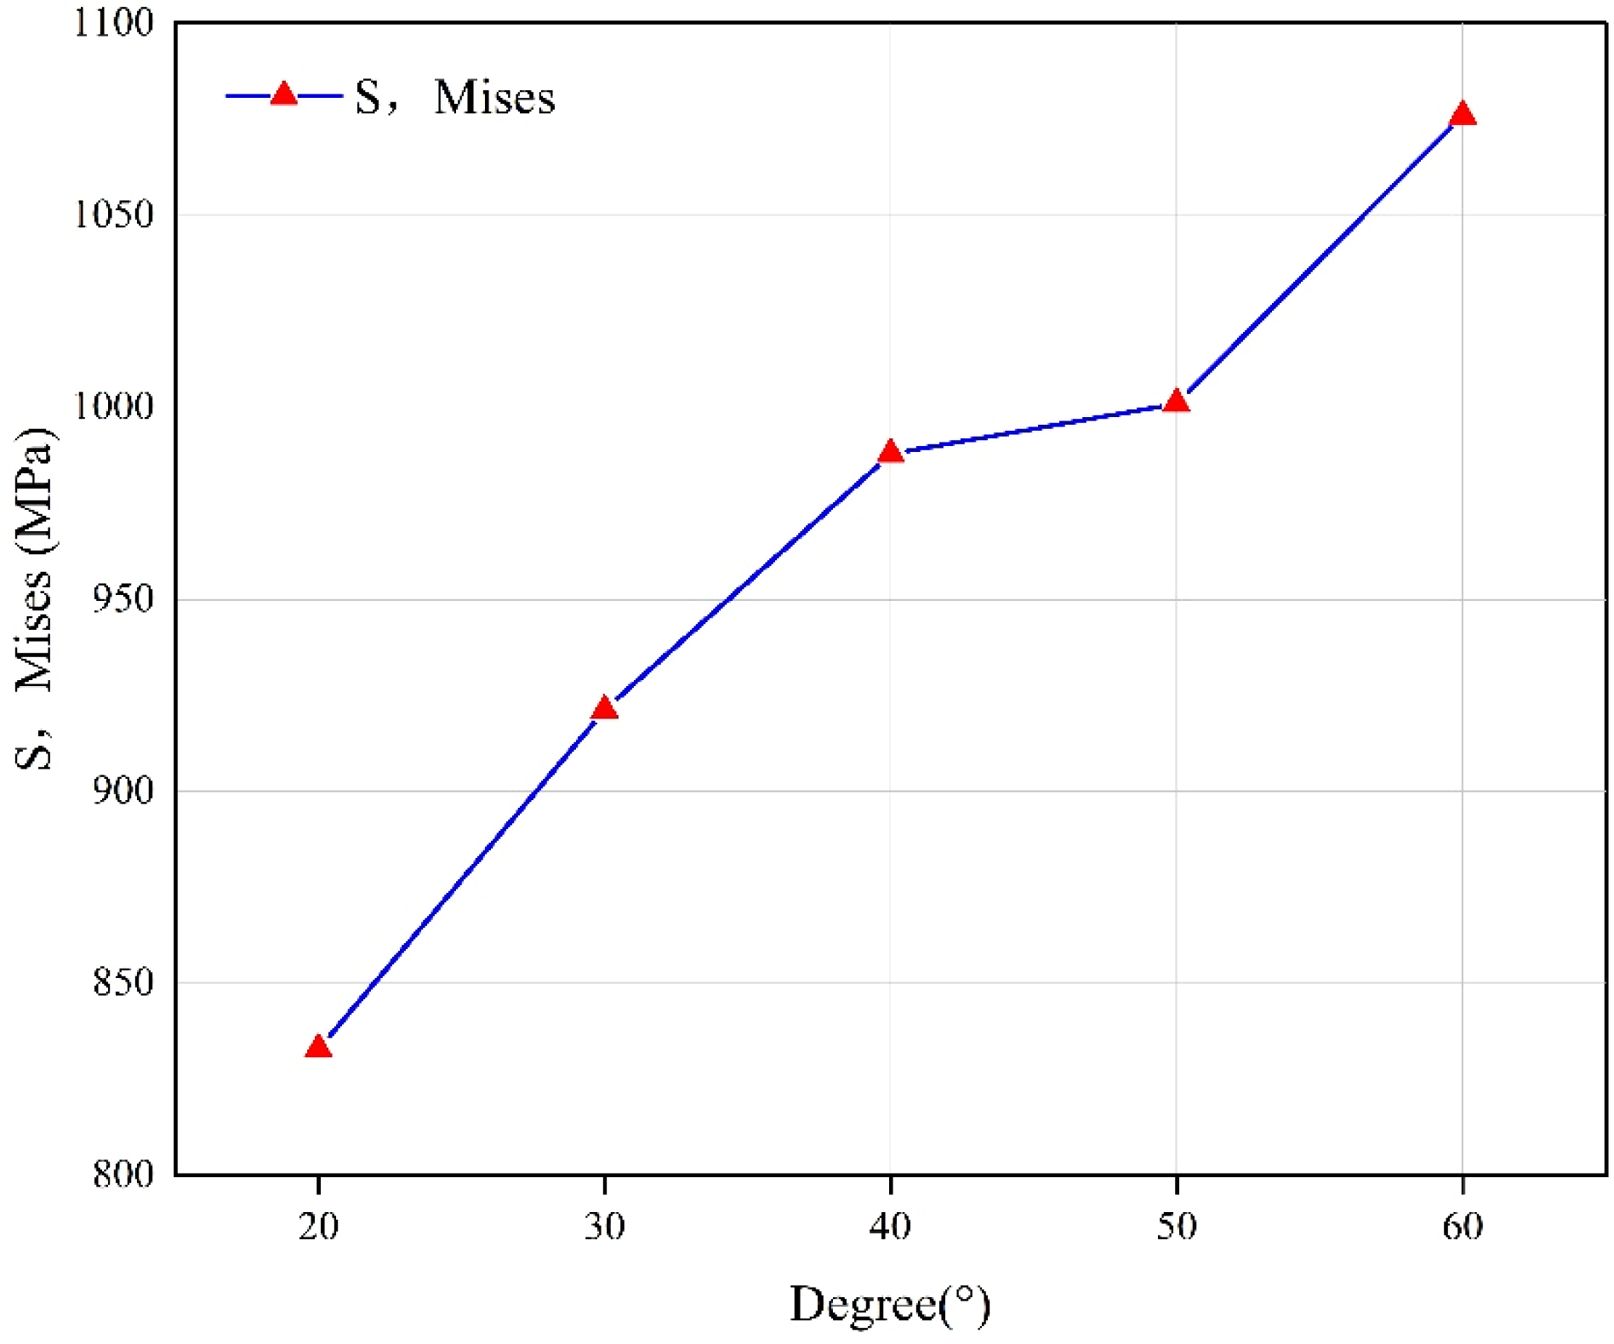
The simulation results show that, during the loading process, for the models with different initial angles of the cords, the location of the stress concentration of the cords is the same as that of the red dotted line in Fig. 9. The Fig. 15 shows the change law of the maximum value of Mises stress on the contact surface S and the initial angle of the cord. As the angle increases, the maximum value of S and Mises stress increases, indicating that the torque on the cord increases gradually, which follows the same change rule as the damage evolution variable. It shows that the angle leads to an increase in the torque on the cord during the loading process, which increases the surface stress of the cord and aggravates the damage to the interface.
Discussion
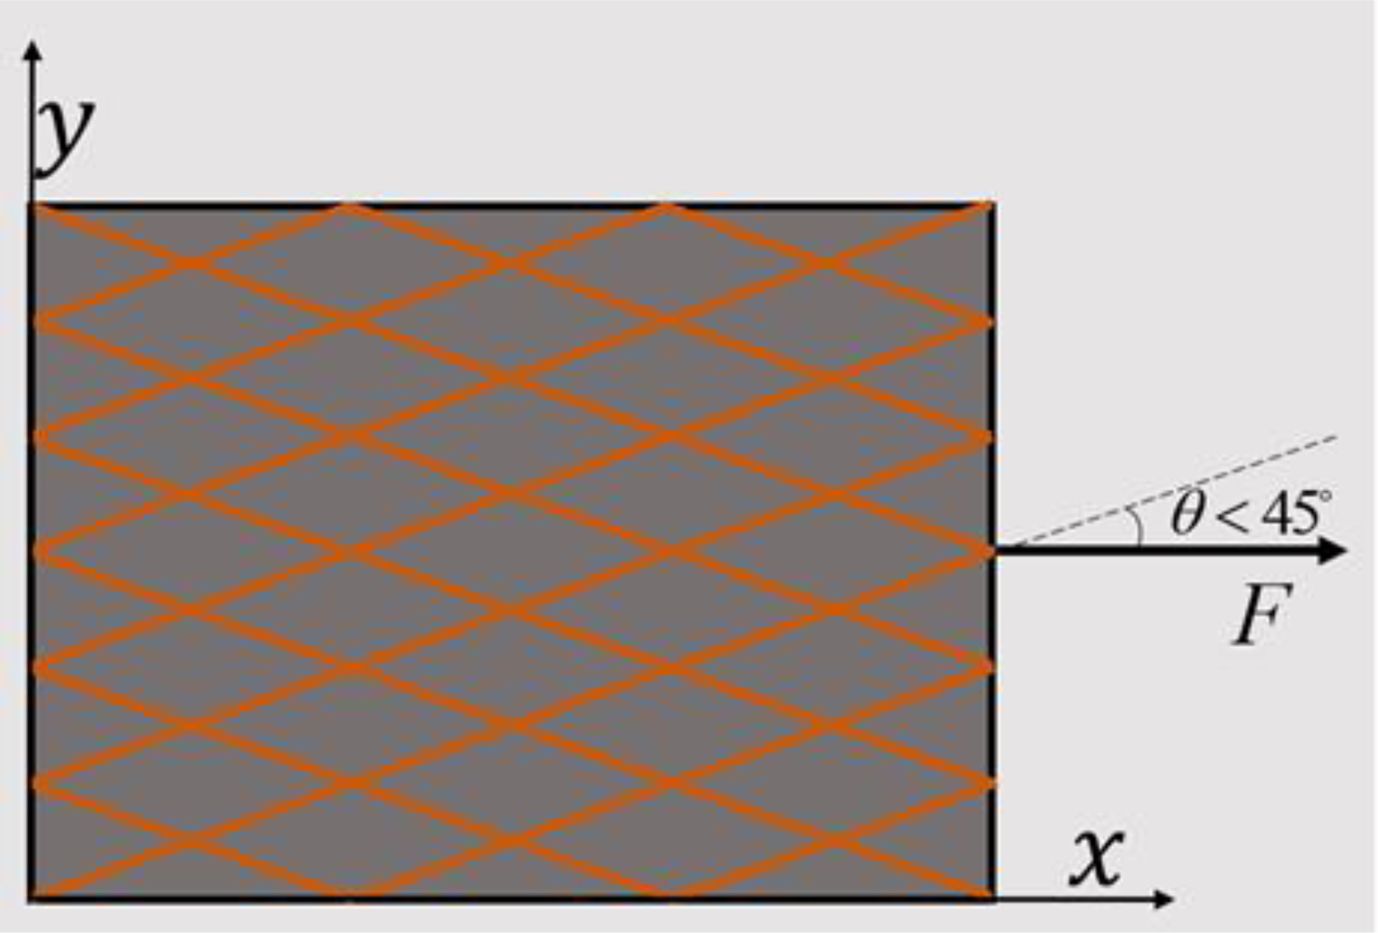
The effect of combining cord angle and initial interface stiffness on interface damage shows that there are many factors affecting the interface damage, including structural parameters and the mechanical properties of the interface itself. The basis of this study is that the angle between the stretching direction and the cord is less than 45°, as shown in Fig. 16. The effect of the angle of the cord on the interface damage is mainly attributed to its change in the torque of the interface [27]. When the angle of the cord increases, the tendency of the cord to rotate around the Z-axis during the stretching process will be more prominent, and it will also bear a greater torque. The torque to which the cord is subjected is provided on the one hand by the pressure of the rubber against it, and on the other hand by the tensile stress of the rubber, which acts on the cord through the interface [28]. Therefore, when the included angle of the cord is increased, the interface will bear more significant tensile stress, resulting in more severe interface damage. Only one loading case was considered in this study, and the interfacial failure case during biaxial stretching was not investigated. Still, the interfacial failure mechanism revealed by this study is fundamental.
After research, the influence of the initial stiffness of the interface on its failure is also apparent, and the increase of the initial stiffness will aggravate the failure of the interface. However, sufficient interfacial stiffness is still essential for the stress transfer between the rubber and the matrix [9]. These two factors need to be considered together, so there is an optimal value for the interfacial stiffness, which will be the content of follow-up research.
In general, there are two forms of interface failure, one is separation failure caused by tensile stress, and the other is sliding separation failure caused by shear stress, and there are many factors that affect interface failure, and many factors affect the interface failure. The change of the included angle of the cord will cause the change of the interface stress, which has a particular influence on the interface failure. The parameters of the interface itself will also affect its failure, but the fundamental failure mechanism is Interface failure due to torque due to angle. There are other structural parameters of rubber cord composites, such as the twist structure of the cord, the diameter of the cord, and the thickness of the interlayer intersections, which are limited in this study but are worth continuing research.
|
Fig. 6 Local stress distribution in the initial loading phase. |
|
Fig. 7 Cord/rubber interface contact pressure. |
|
Fig. 8 First contact shear stress of the cord/rubber interface. |
|
Fig. 9 Local stress distribution on the cord surface. |
|
Fig. 10 The failure process of rubber/cord composite material interface. |
|
Fig. 11 Node selection location |
|
Fig. 12 Variation law of damage evolution variable with displacement. |
|
Fig. 13 Path diagram. |
|
Fig. 14 Distribution of damage evolution variables along the path of different cord angle models. |
|
Fig. 15 The maximum value of S,Mises stress varies with the initial cord angle. |
|
Fig. 16 Sample Loading Diagram. |
|
Table 3 Cohesive zone model parameters for initial stiffness of different interfaces. |
The finite element method created a representative volume element model of rubber cord composites, and the interface failure mechanism of rubber cord composites under uniaxial tension was studied. The influence of different parameters on the interface damage evolution is discussed through the cohesive contact model.
(1) The interface damage of the rubber cord composite mainly occurs on the upper and lower sides of the cord, and expands in the axial direction with the loading. The most severe damage occurs at the inner side of the angle between the two ends of the cord, as shown in Fig. 9. The reason is that this part of the cord bears an ample torque, so stress concentration occurs on the contact surface, resulting in interface damage at this position to the greatest extent.
(2) The initial interface stiffness is an important parameter affecting the interface damage evolution. The greater the stiffness, the greater the interface damage evolution variable under the same displacement, and the more pronounced the damage.
(3) The angle of the cord is an essential structural parameter that affects the interface performance. The angle between the tensile direction and the cord causes the cord to be subjected to torque, and the normal tensile stress of the contact surface causes the interface damage. When the included angle of the cord is larger, the torque on the cord is larger, so the interface damage is also more severe.
- 1. S.K. Clark, Rubber Chem. Technol. 37[5] (1964) 1365-1390.
-

- 2. B. Su, S. Liu, P. Zhang, J. Wu, Y. Wang, Compos. Struct. 274 (2021) 114350.
-
- 3. D.K. Singh, A. Vaidya, V. Thomas, M. Theodore, S. Kore, U. Vaidya, J. Compos. Sci. 4[2] (2020) 58.
-
- 4. S. Enganati, F. Addiego, J.P.C. Fernandes, Y. Koutsawa, B. Zielinski, D. Ruch, G. Mertz, Polym. Test. 98 (2021) 107203.
-
- 5. M. Jamshidi, F. Afshar, N. Mohammadi, S. Pourmahdian, Appl. Surf. Sci. 249[1-4] (2005) 208-215.
-
- 6. C. Valantin, F. Lacroix, M.-P. Deffarges, J. Morcel, N.A. Hocine, J. Appl. Polym. Sci. 132[4] (2015).
-
- 7. S. Sheshenin and D. Yikun, Mech. Compos. Mater. 57[3] (2021) 275-286.
-
- 8. T. Lehmann and J. Ihlemann, Mater. Today: Proc. 32 (2020) 183-186.
-
- 9. Z. Zhao, X. Mu, F. Du, Mater. Today Commun. 23 (2020) 100937.
-
- 10. Mantič, Int. J. Solids Struct. 46[6] (2009) 1287-1304.
-
- 11. I. García, M. Paggi, V. Mantic, Eng. Fract. Mech. 115 (2014) 96-110.
-
- 12. M. Jamshidi and F.A. Taromi, J. Adhes. Sci. Technol. 21[2] (2007) 169-177.
-
- 13. Q.H. Fang, H.B. Wang, B.-Z. Huang, Surf. Interface Anal. 42[9] (2010) 1507-1513.
-
- 14. K. Ozawa, T. Kakubo, K. Shimizu, N. Amino, K. Mase, Y. Izumi, T. Muro, T. Komatsu, Appl. Surf. Sci. 268 (2013) 117-123.
-
- 15. M. Romanowicz, Comput. Mater. Sci. 47[1] (2009) 225-231.
-
- 16. M. Hossain and P. Steinmann, J. Mech. Behav. Mater. 22[1-2] (2013) 27-50.
-
- 17. F. Gao, M. Yao, J. Dhua. Univ. [3] (1996) 23-30.
- 18. P. Steinmann, M. Hossain, G. Possart, Arch. Appl. Mech. 82[9] (2012) 1183-1217.
-
- 19. O.H. Yeoh, Rubber Chem. Technol. 63[5] (1990) 792-805.
-
- 20. P. Zhang, in “STUDY ON MECHNICAL PROPERTIES OF CORD/RUBBER COMPOSITES LAP JOINTS 52” (Harbin Institute of Technology, 2020).
- 21. N. Nezafati, F. Moztarzadeh, S. Hesaraki, J. Ceram. Process. Res. 11[3] (2010) 367-371.
-
- 22. I.-J. Shon, J.-K. Yoon, K.-T. Hong, J. Ceram. Process. Res. 18[2] (2017) 98-102.
-
- 23. H. Luo, in “RESEARCH ON THE MECHANICAL PROPERTIES OF CORD/RUBBER COMPOSITE STRUCTURE UNDER HIGH STRAIN RATE 46” (Harbin Institute of Technology, 2021).
- 24. O. Hesebeck, Solids 1[1] (2020) 2-15.
-
- 25. L. Li, in “Study on static strength Performance Test and strength Prediction Method of single lap bonded joint of car body 35” (Jilin University, 2011).
- 26. N.K. Jha and U. Nackenhorst, Eng. Comput. 6 (2018) 2215-2233.
- 27. N. Eiamnipon, P. Nimdum, J. Renard, C. Kolitawong, Compos. Struct. 99 (2013) 1-7.
-
- 28. R.E. Swain, K.L. Reifsnider, K. Jayaraman, M. El-Zein, J. Thermoplast. Compos. Mater. 3[1] (1990) 13-23.
-
 This Article
-
2023; 24(1): 69-77
Published on Feb 28, 2023
- 10.36410/jcpr.2023.24.1.69
- Received on Jun 21, 2022
- Revised on Aug 2, 2022
- Accepted on Aug 8, 2022
Services
- Abstract
introduction
micro-modeling of rubber cord composites
cohesive zone model
results and discussion
conclusion
- References
- Full Text PDF
Shared
Correspondence to
- Xiaohui Guo
-
Rocket Force University of Engineering, Xi’an 715600
Tel : +15091095583 - E-mail: gxh19970902@163.com
Clean-Energy Research Institute(CRI), Hanyang University, 222, Wangsimni-ro, Seongdong-gu, Seoul, 04763, Korea
E-mail: jcpr@hanyang.ac.kr