


- Effect of impurity components in stainless steel dust on the coloring properties of the prepared black ceramic pigments
Zhiqiao Lia, Xiang Zhanga,*, Guojun Maa, Dingli Zhengb, Ruixiang Heb and Tianyu Dub
aThe State Key Laboratory of Refractories and Metallurgy, Wuhan University of Science and Technology, Wuhan 430081, P.R. China
bKey Laboratory for Ferrous Metallurgy and Resources Utilization of Ministry of Education, Wuhan University of Science and Technology, Wuhan 430081, P.R. ChinaThis article is an open access article distributed under the terms of the Creative Commons Attribution Non-Commercial License (http://creativecommons.org/licenses/by-nc/4.0) which permits unrestricted non-commercial use, distribution, and reproduction in any medium, provided the original work is properly cited.
Stainless steel dust (SSD) can be utilized as the primary raw material for the production of Fe-Cr-Ni-Mn system black ceramic pigments because it is high in transition metal elements. However, in addition to the ingredients required for the preparation of black pigments, it also contains some impurity elements like Ca, Mg, Si and Zn, and the influence of these impurity elements on the coloring performance of the pigments is unclear. In this paper, pure chemical reagents were used as raw materials to simulate the main components of SSD for the solid-phase synthesis of black ceramic pigments doped with various impurity components (CaO, MgO, SiO2 and ZnO). The results show that the doping of MgO can improve the purity of the prepared black ceramic pigments, whereas CaO, SiO2 and ZnO can turn the pigments become reddish yellow. In the doped samples, ZnO and MgO mainly react with Fe2O3 to form ZnFe2O4 and MgFe2O4. In addition, CaO reacts with Fe2O3 to generate CaFe4O7. The reactions described above can increase the average crystallite size and distort the crystal lattice of the crystals in the pigment samples. Moreover, SiO2 exists in amorphous form among spinel grains
Keywords: Stainless steel dust, Spinel, Black ceramic pigments, Impurity components
In the traditional production process, cobalt oxide needs to be added for pure black ceramic pigment, but its high price limits the development of cobalt-containing black ceramic pigment. As a result, some researchers have developed a Fe-Cr-Ni-Mn system for black ceramic pigments to address the challenges posed by cobalt content and to meet the demand for cumulative light absorption multiple chromophores in the production of black ceramic pigments [1, 2]. Currently, this series of pigments is produced using three different types of raw materials: chemical raw materials, mineral raw materials, and industrial solid waste [3]. Although chemical raw materials can be used to create high-purity spinel pigments, the cost is higher than other options [4, 5]. Mineral raw materials have the advantages of low cost and wide distribution, but their utilization rate is relatively low (30-40 wt%) [6]. Industrial solid waste contains a considerable amount of transition metal elements required for the preparation of this series of elements, and its preparation can aid in the resolution of solid waste pollution concerns, making it ideal for the production of this series of black pigments. Therefore, the preparation of black ceramic pigment from industrial solid waste rich in transition metal elements has attracted the interest of many academics.
Stainless steel dust (SSD) is a typical industrial waste produced during the of stainless steelmaking process by EAF and AOD converters. It has an abundance of Fe, Cr, Ni, and Mn transition metal resources, with Fe concentrations ranging from 21-60 wt%, Cr 8-17% wt%, Ni 3-9 wt%, and Mn 2-8 wt%. These transition metal elements are most commonly found as oxides and spinel [7-9]. Direct reduction or molten reduction processes in pyrometallurgy are commonly used to recover transition metal elements from SSD, such as Scan Dust AB plasma technology, Inmetco Process, one-step reduction direct recovery process, electric furnace direct reduction recovery technology, and so on. The aforementioned processes, on the other hand, have drawbacks such as a low recovery rate, a high reduction temperature, and secondary pollutants [10, 11].
Because of the abundant concentrations of transition metal elements in SSD, the economical cobalt-free black ceramic pigments with the Fe-Cr-Ni-Mn system can be prepared by using SSD, avoiding the problems associated with traditional treatment processes [12, 13]. Furthermore, the Cr in the black ceramic pigments is fixed as chromium spinel, which improves the antioxidant capacity of chromium and effectively inhibits chromium leaching [13]. According to the previous study [14], the primary phases of the pigments prepared by this method are FeCr2O4, NiMn2O4, and solid-solution oxides Cr1.3Fe0.7O3, and the pigments have good coloring properties. However, due to the complex compositions of SSD, a certain quantity of impurity elements such as Ca, Si, Zn, and Mg (0.83-14.78 wt% of Ca, 0.09-4.5 wt% of Si, 0.04-4.5 wt% of Zn and 0.04-3.76 wt% of Mg) may affect the properties and color of the prepared black ceramic pigments [14-16]. Further investigation is needed to determine the effect of impurity elements in SSD on the coloring properties and phase compositions during the preparation of Fe-Cr-Ni-Mn black ceramic pigments.
In this study, chemical reagents were prepared and used to simulate the main chemical components of SSD. By using the solid-phase synthesis method, the Fe-Cr-Ni-Mn black ceramic pigments were prepared from the simulated SSD and additional chemical components. The effects of the impurity components (CaO, MgO, SiO2 and ZnO) in SSD on the microstructure, phase compositions, and coloring properties of the created pigments were studied, and the findings can help guide the safe use of black ceramic pigments made from SSD.
Preparation of sample
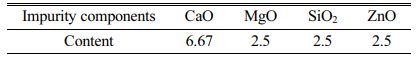
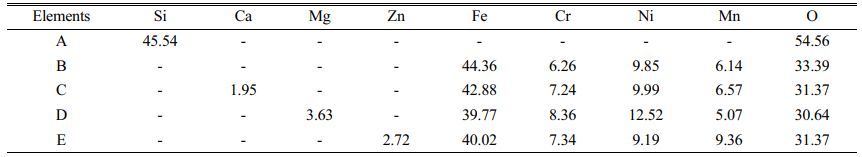
The chemical reagents Fe2O3, Cr2O3, MnO and NiO were mixed uniformly according to the molar ratio of 6:1:1:1 based on previous theoretical calculation results and experimental findings [17-19]. The corundum crucible containing the mixture was placed in a muffle furnace, calcined for 30 min at 1150 °C (heating rate of 10 °C/min), and then cooled with the furnace to obtain an undoped Fe-Cr-Ni-Mn system black pigment sample. Moreover, prior researches indicate that when SSD is used to synthesize Fe-Cr-Ni-Mn system black ceramic pigments, the percentage of SSD in the raw material is around 50 wt% [17-19]. Therefore, a certain amount of impurity oxides shown in Table 1 were respectively added to the raw materials based on the fluctuation range of each impurity oxide composition in SSD, with the molar ratios of the primary components Fe2O3, Cr2O3, MnO, and NiO maintained at 6:1:1:1. The doped pigment samples were prepared under the same conditions as the undoped samples to obtain different oxide-doped Fe-Cr-Ni-Mn system black ceramic pigments.
Characterization
The phase compositions of the pigment samples were analyzed by X-ray diffractometry (X'Pert PRO MPD, Cu Kα, tube voltage 40 kV, test current 40 mA, scanning speed 2°/min, 2θ scanning range 10°~70°). Emission scanning electron microscopy (Philips NanoSEM400) and energy dispersive X-ray spectroscopy were used to examine the micromorphology of the samples (FEI 350PentaFETX-3). The L*, a* and b* values of the samples were measured using a portable chromometer (3NH TS7010), which are the color models developed by CIE. By using Fourier transform infrared spectrometer (FTIR, Thermo Scientific Nicolet iS50), the infrared spectra of the samples were obtained by the KBr tablet method, and the wavenumber range was 400-4000 cm-1. The diffuse reflectivity spectrum of the samples in the range of 380~790 nm was measured by a UV-visible spectrophotometer (Shimadzu UV-2600), and the band gap width of the samples was calculated by using the Kubelka-Munk formula, as shown in Eq. (1) [20]:

where R is the reflectivity at a specific wavelength. Then, the curve of [F(R)hv]1/2 vs hv (h is Planck’s constant and v is the frequency of light) can be obtained. While the linear part of the curve is extrapolated to F(R)=0, the x-intercept value is the band gap width of the samples.
|
Table 1 The proportion of different impurity components in the raw material (wt%). |
XRD analysis
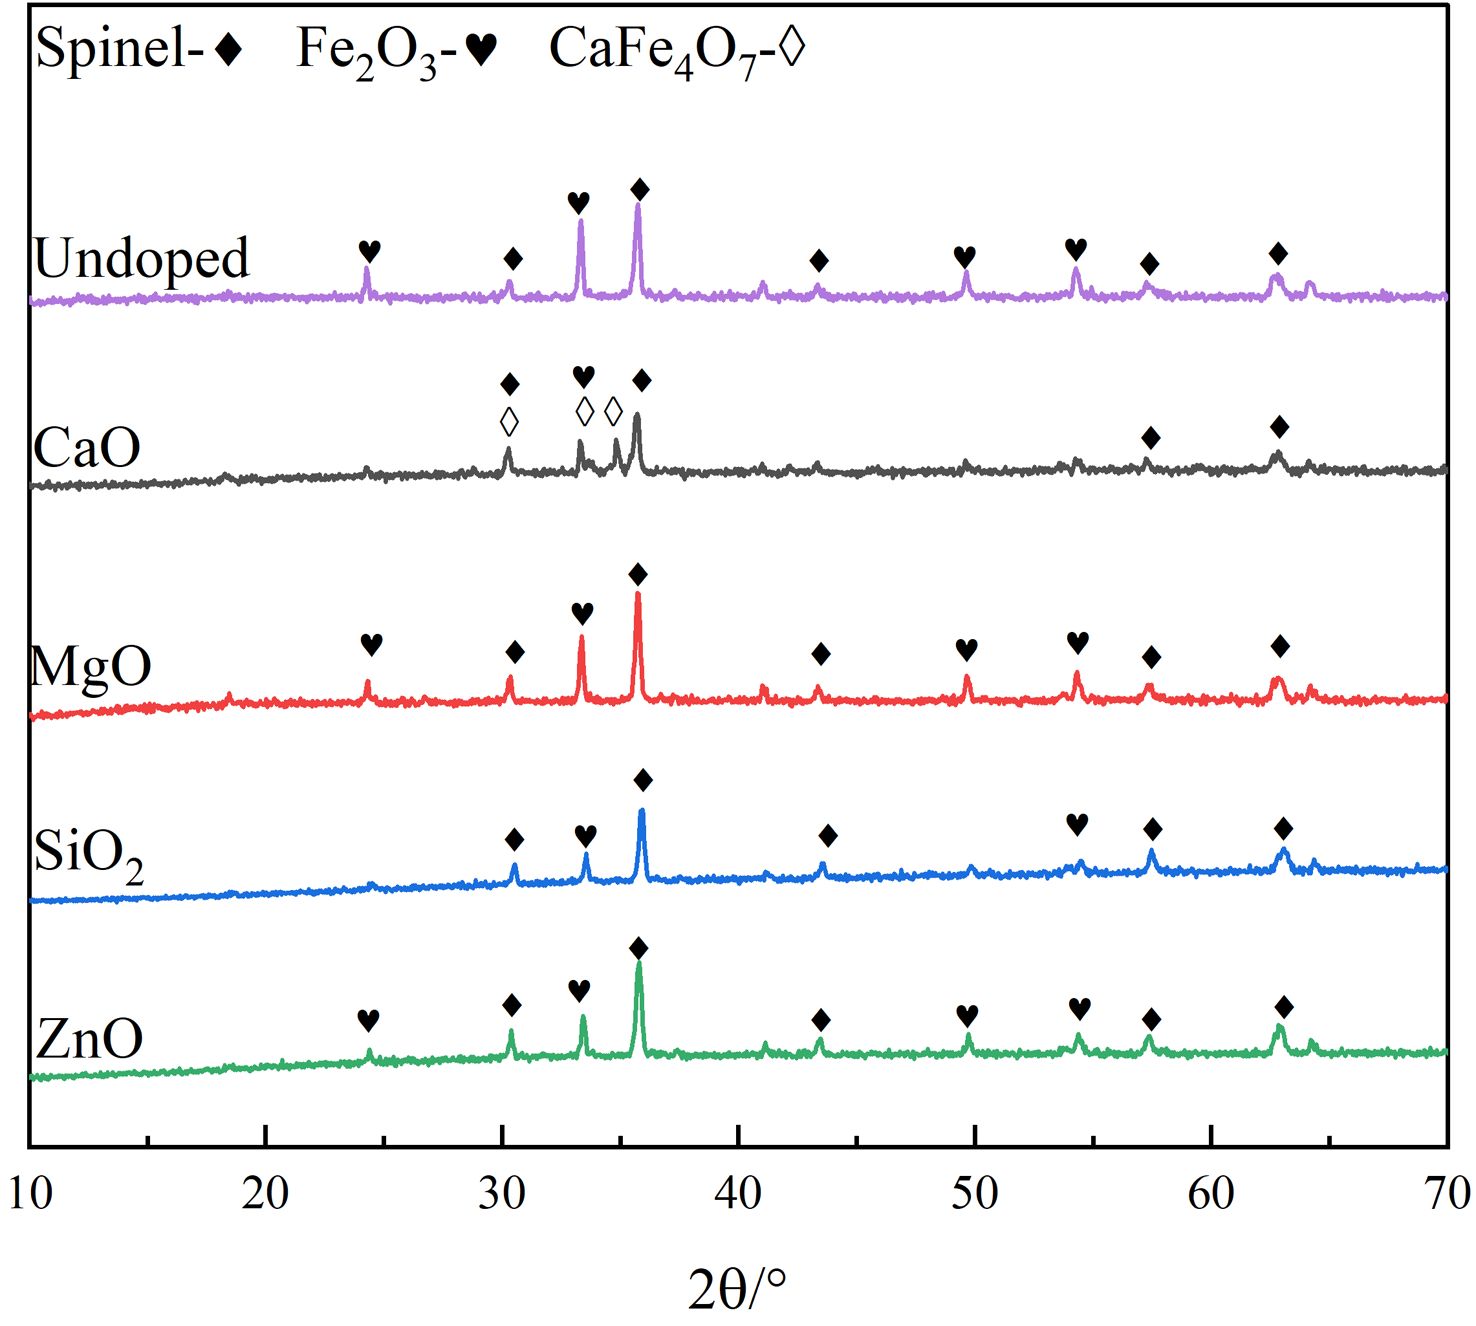
The XRD patterns of the undoped and doped pigment samples are shown in Fig. 1. According to Fig. 1, the undoped pigment sample is primarily made up of composite spinel phase and Fe2O3, which can cause the pigment’s color to become pure black. When MgO, SiO2, or ZnO are doped, the positions of the distinctive diffraction peaks of the pigment samples do not change obviously, and they are all composed of composite spinel phase and Fe2O3, which are consistent with the phases of undoped pigment samples. However, when the pigment is doped with CaO, the XRD pattern of the pigment exhibits monocline CaFe4O7, and the intensity of the diffraction peak of Fe2O3 decreases, indicating that the CaO in SSD can react with Fe2O3 as follows:

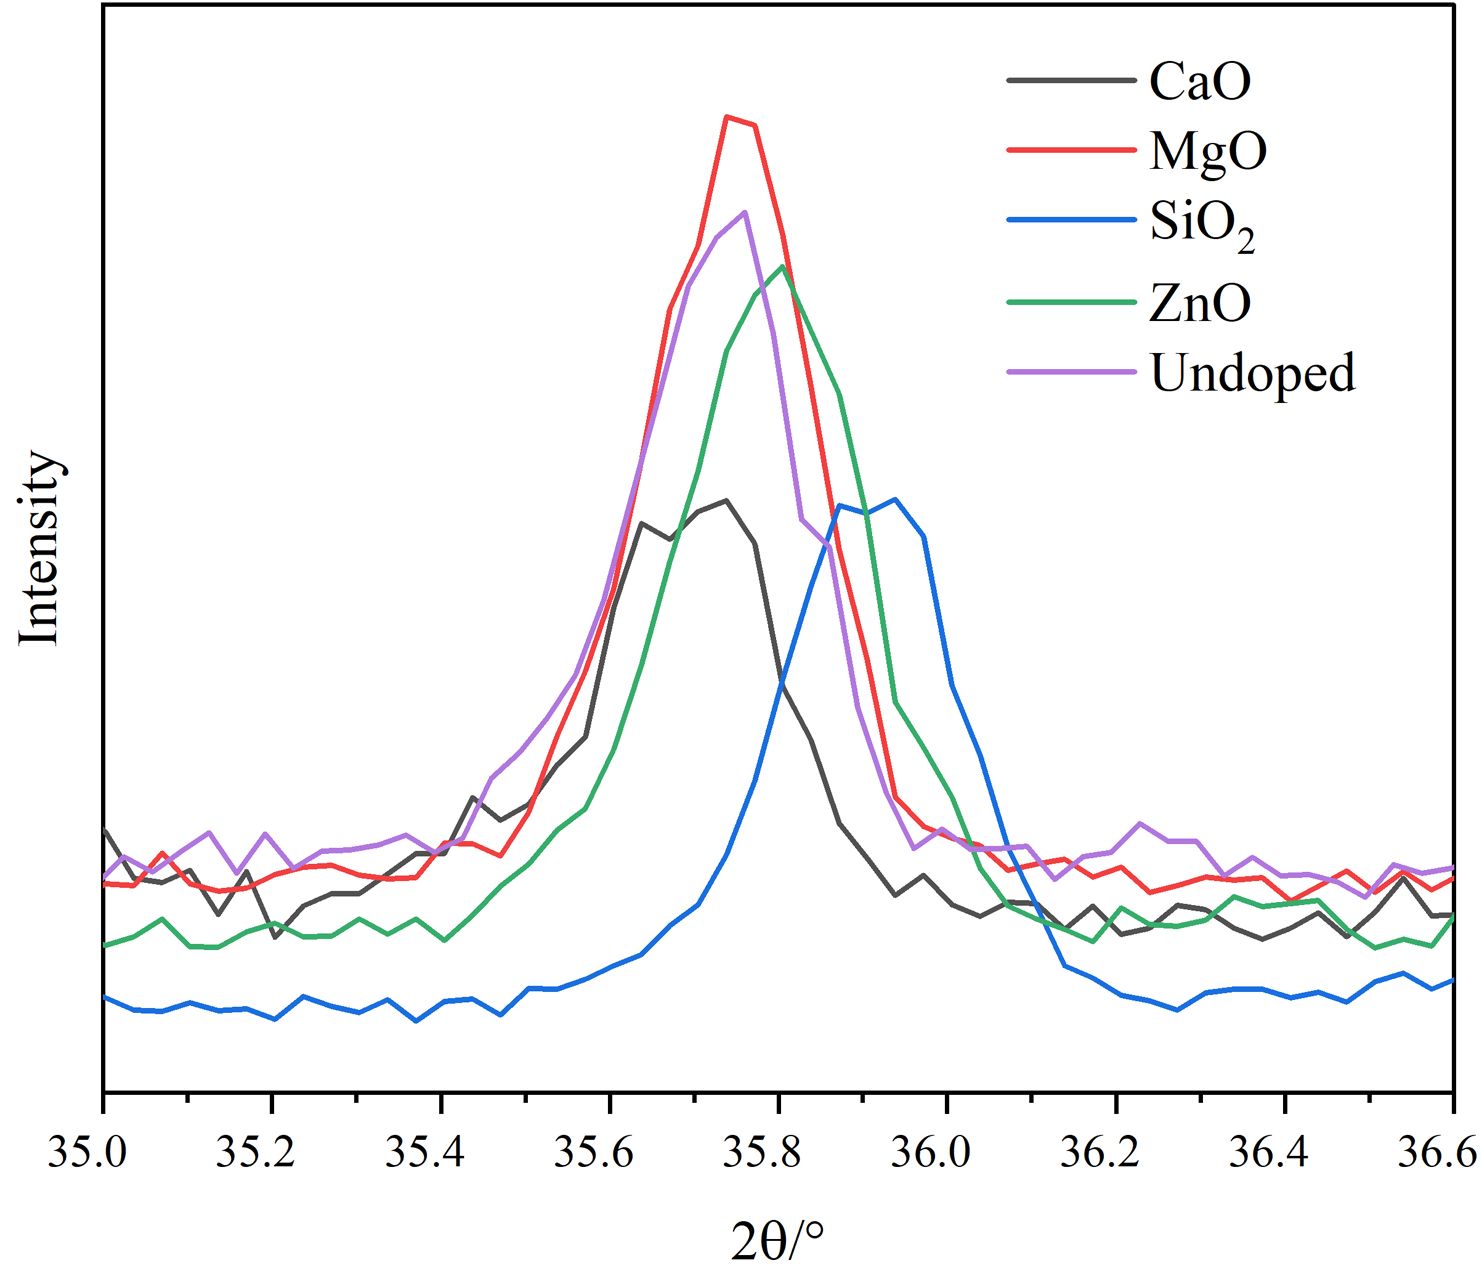
Fig. 2 shows the local enlargement of the distinctive diffraction peaks of the spinel phase of the doped pigment. The intensity and position of the distinctive diffraction peak of the spinel do not change appreciably when doped oxides are CaO and SiO2, as illustrated in Fig. 2. This is because neither CaO nor SiO2 engages in the solid-phase reaction of spinel, and SiO2 exists in an amorphous form between spinel grains during high-temperature solid-phase sintering [21], which is compatible with published research findings on cation distribution in spinel [22]. When the doped oxides are MgO and ZnO, the intensity of the spinel diffraction peak of the samples increases, indicating that the crystallinity of the spinel increases. The increase in the spinel diffraction peak intensity and decrease of the Fe2O3 diffraction peak intensity can be attributed mostly to the corresponding solid-phase spinel reaction, which has the following reaction equation:
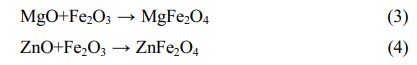
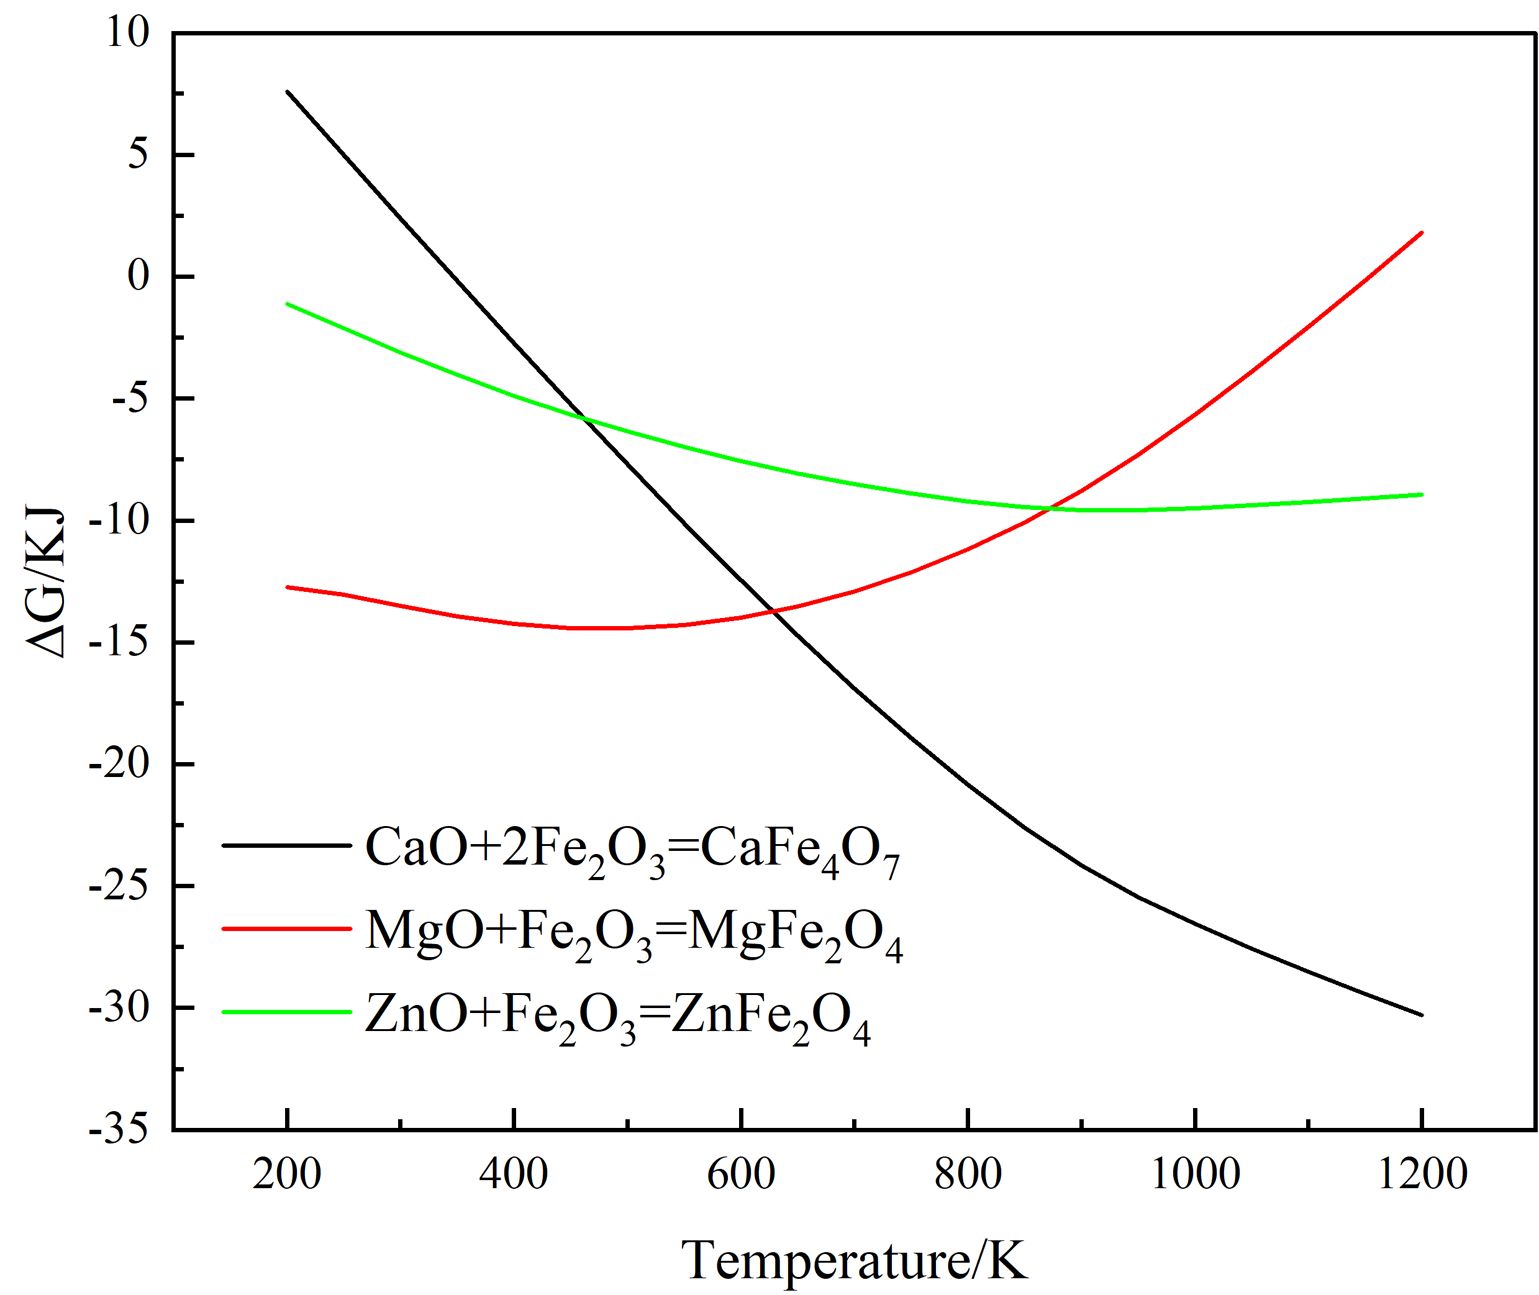
Moreover, the color of MgFe2O4 is black, while the color of ZnFe2O4 is brick red [23]. The Gibbs free energy of the Eqs. (2)-(4) is shown in Fig. 3. It can be found from Fig. 3 that the reactions (2)-(4) can take place, and the Gibbs free energy of formation of ZnFe2O4 at 1000-1200 °C is much lower than that of MgFe2O4. The MgO-doped sample has a higher intensity of the spinel phase diffraction peak than the ZnO-doped sample due to the chemical process being controlled by both thermodynamics and kinetics, with kinetics having a greater influence in this case. Since the rate control step of the spinel solid-phase reaction is frequently a diffusion step, the MgO-doped sample diffuses faster under the same conditions. When the doped oxides are MgO and ZnO, in addition to the direct spinel solid-phase reaction with Fe2O3, Mg2+ (0.80 Å) and Zn2+(0.74 Å) may occupy the lattice positions of the Ni2+ and Fe2+ because their ionic radii are similar to those of Ni2+(0.69 Å) and Fe2+(0.78 Å) in spinel.
For the distinctive diffraction peak corresponding to spinel in the doped pigment (3 1 1), the Scherrer formula (Eq. 5) was used to calculate the crystal size of the sample [24]:
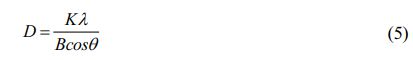
where D is the crystallite size, nm; K is Scherrer's constant, which is 0.9; lis X-ray wavelength, which is 1.54 Å; B is half peak width; q is the diffraction Angle, °.
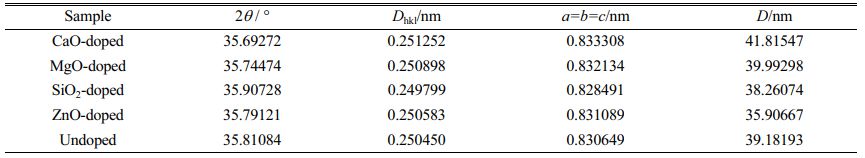
Table 2 displays data such as lattice constants and average crystallite size of different doped samples calculated from the above equation and Bragg's formula, where Dhkl denotes the crystallite plane spacing and a, b and c denote the lattice constants. Because the spinel structure belongs to the cubic crystal system, a=b=c. As can be seen from Table 2, except for the SiO2-doped sample, the distinctive diffraction peaks of the spinel phase are shifted to a small angle in comparison to the undoped sample. This is mainly due to the fact that, with the exception of SiO2, all doped oxides will react with the original system, leading to the presence of macroscopic residual stresses and distortions in the lattice anisotropy contraction. Moreover, the differences between the lattice constants of the prepared pigment samples and those of the single spinel phase, such as NiFe2O4 (ICDD 00-023-1119, lattice constant of 8.367 Å), indicate that the pigment is composed of a composite spinel phase. The average crystallite size will also change as a result of doping with different oxides, which will alter the sample’s microstructure and physical properties.
FTIR analysis
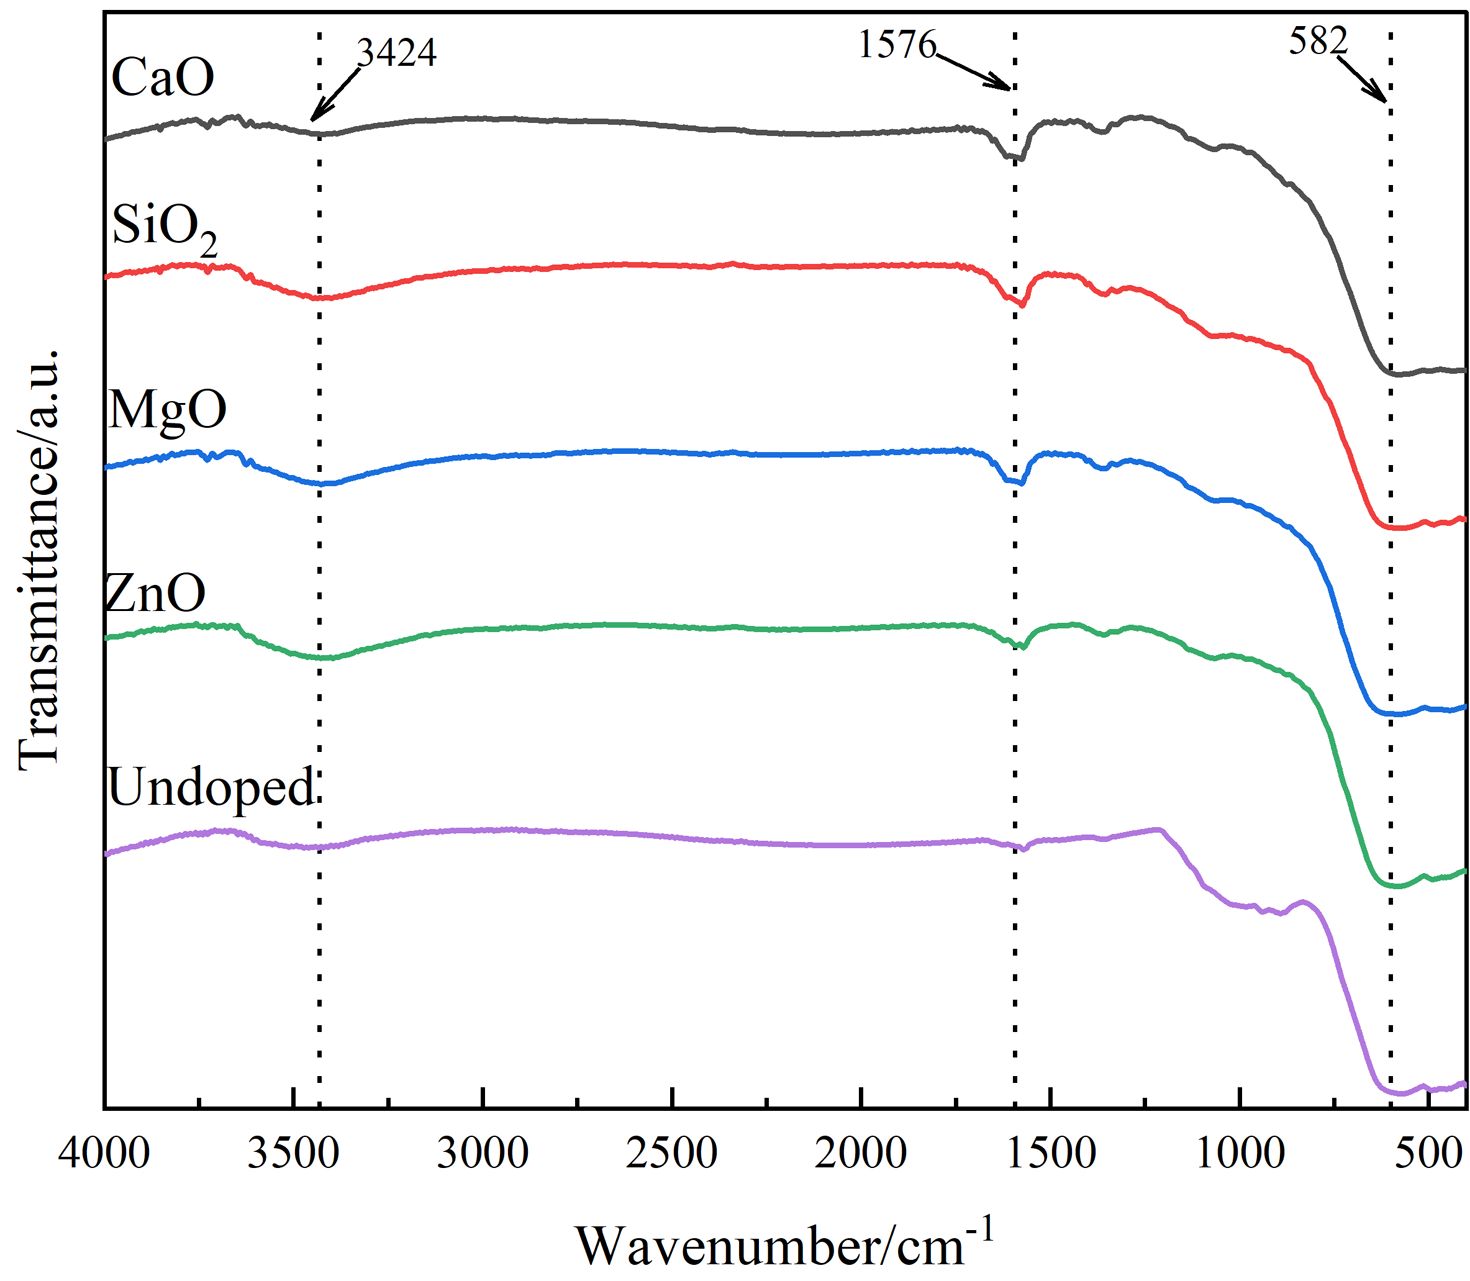
To further analyze the functional groups contained in the pigment generated by doping, the infrared analytical spectra of various doped pigment samples are given in Fig. 4. As shown in Fig. 4, two distinct absorption peaks are visible in the range of 1400-4000 cm-1, with the broad absorption band near 3424 cm-1 corresponding to the stretching vibration of the O-H bond and the other near 1576 cm-1 corresponding to the bending vibration of the H-O-H bond, both of which are associated with water molecules on the sample surface [25]. The absorption vibration peaks in the 400-600 cm-1 range correlate to the absorption vibration peaks in the tetrahedral and octahedral positions of spinel [26], which are primarily generated by the difference in distance between the metal cation and O2- in the octahedral and tetrahedral locations. The higher absorption vibration band at 600 cm-1 is the natural vibration of the tetrahedral complex, and the lower absorption vibration band at 400 cm-1 is the vibration of the octahedron [27, 28]. However, the vibrational peak corresponding to the octahedral position around 400 cm-1 for each doped pigment sample is not obvious due to the broadening of this peak caused by the fine spinel crystal. Furthermore, the ZnO-doped and MgO-doped pigment samples show a redshift, indicating a shift toward longer wavelengths when compared to the undoped pigment sample. This is because Zn2+ and Mg2+ enter the spinel lattice and replace the ions that are initially at the tetrahedral position, introducing new structural flaws in the spinel structure and causing a redshift in the average lattice constant and lattice vibration. This conclusion is supported by XRD analysis.
SEM analysis
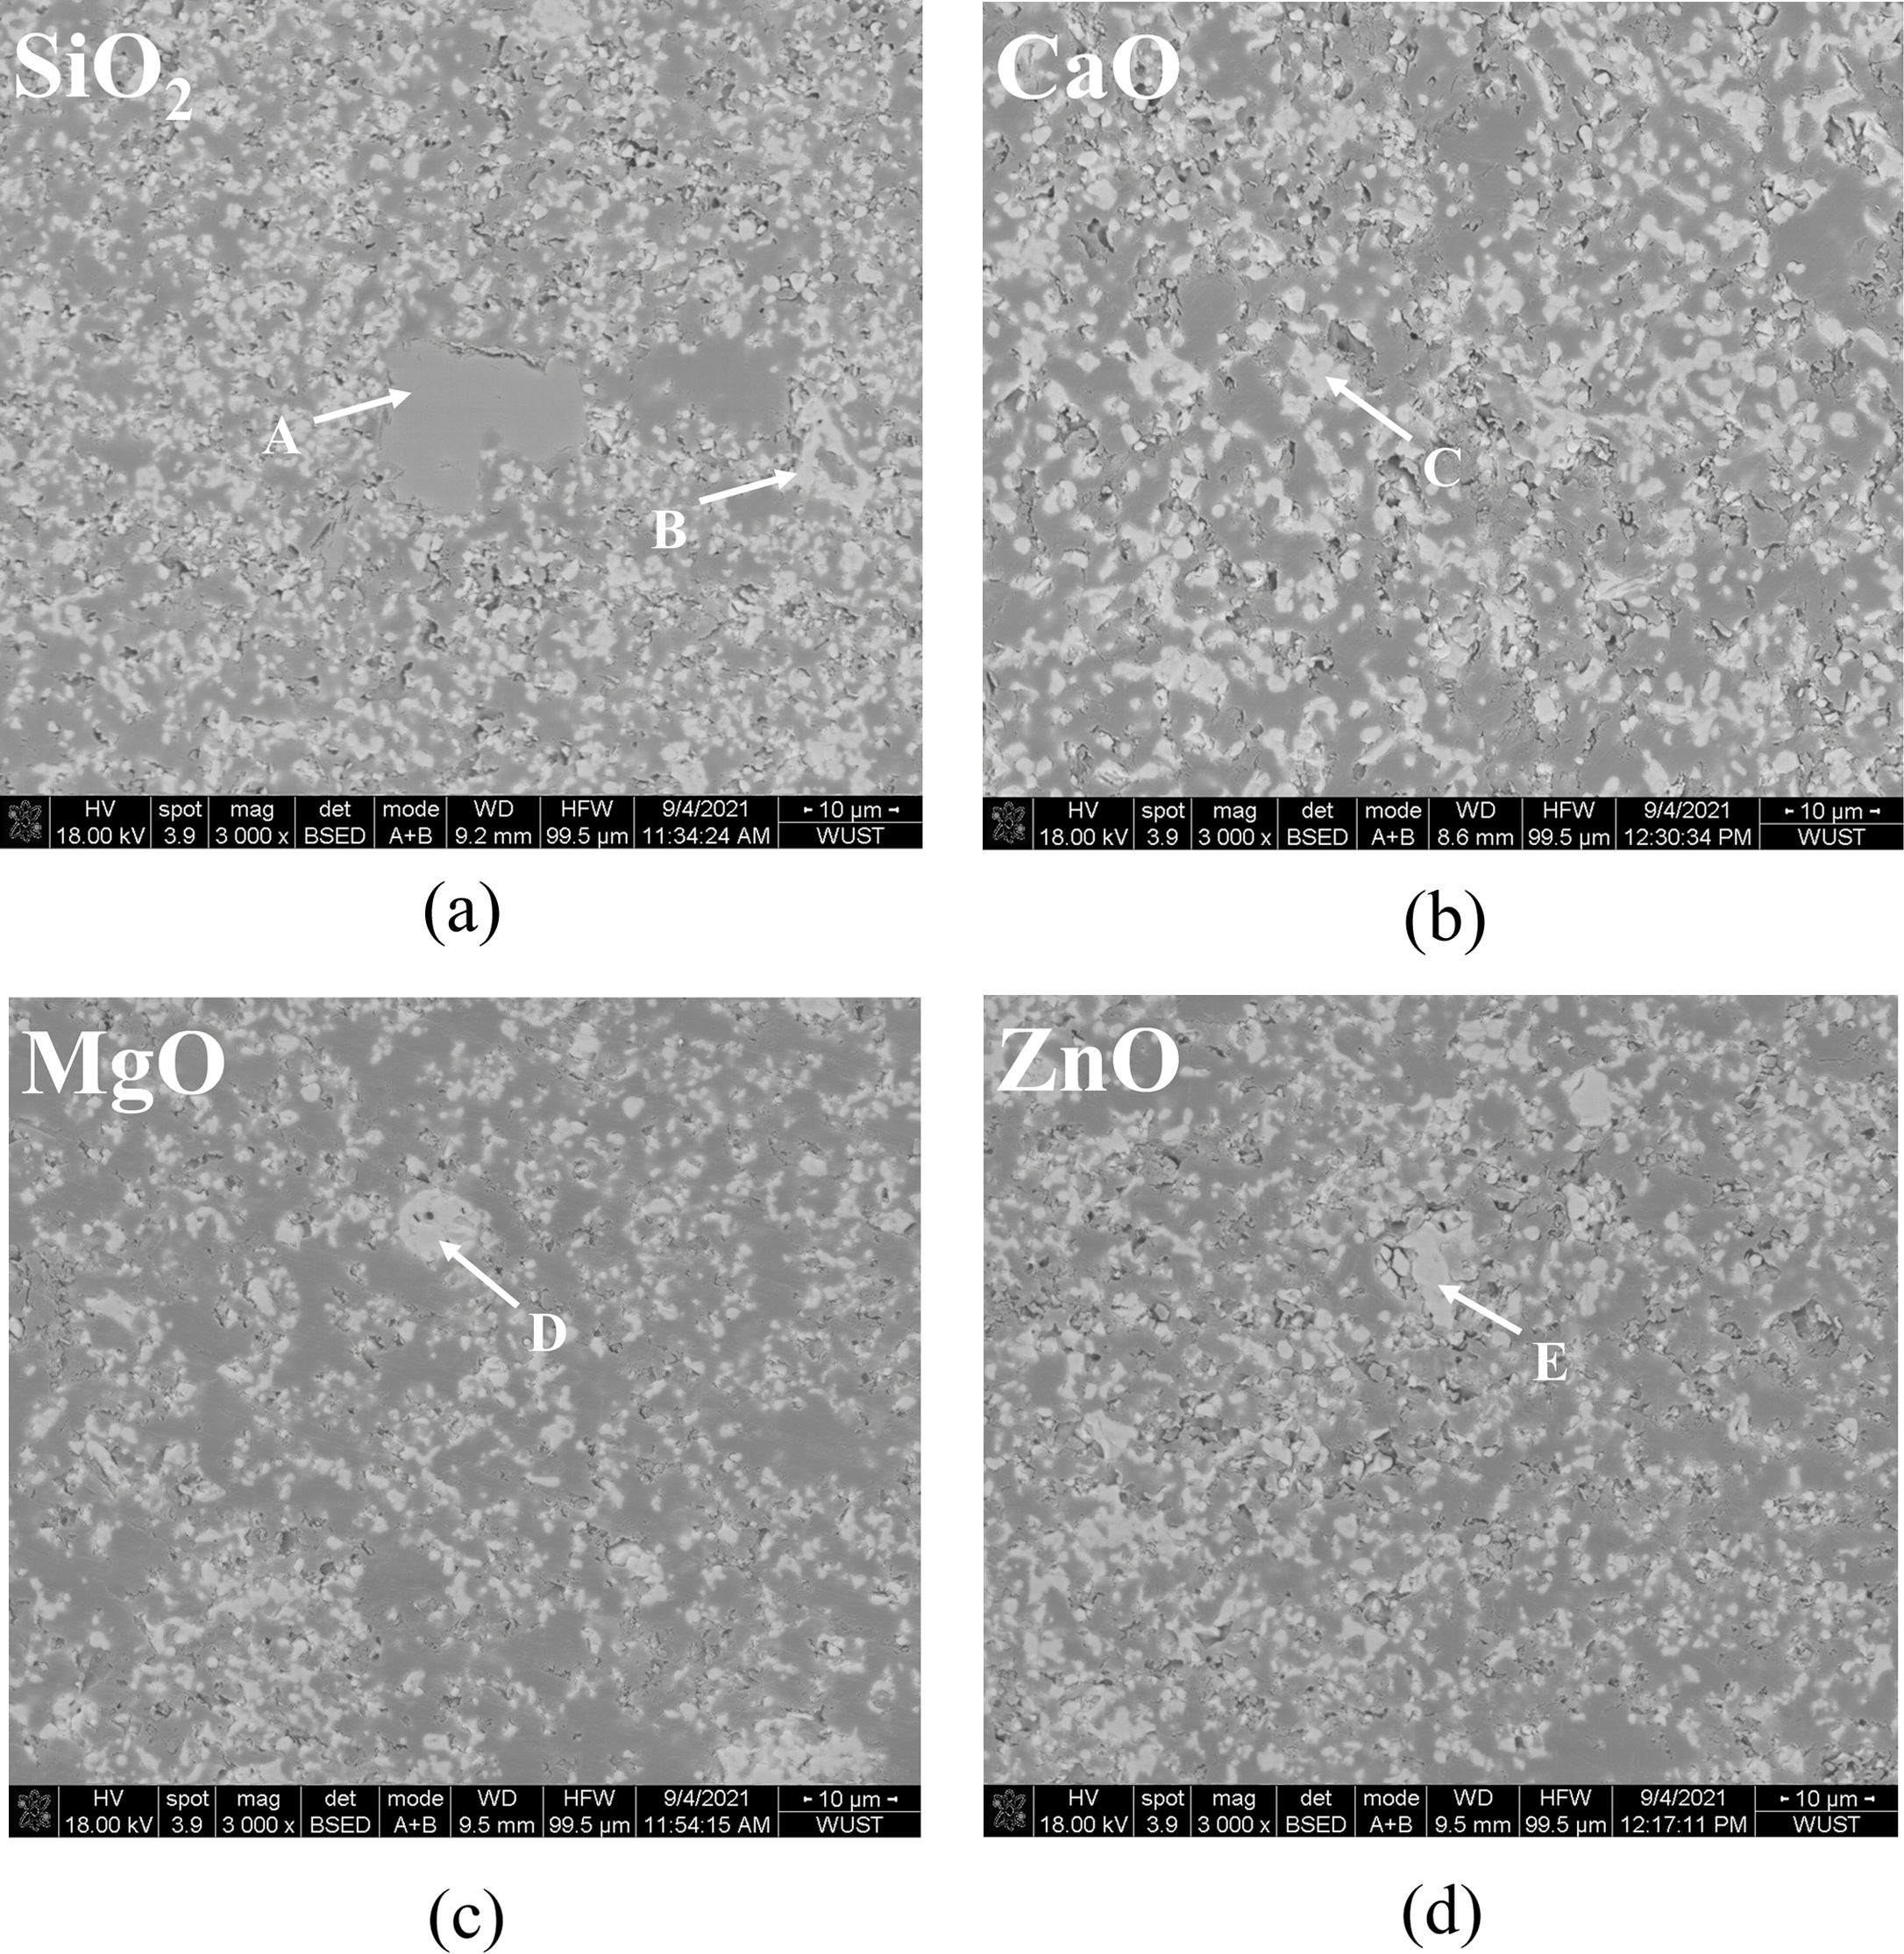
SEM images of pigment samples with different doping are shown in Fig. 5. Table 3 shows the results of the energy spectrum analysis for each typical region (A-E) depicted in the figures. According to the SEM images, the particles of the doped pigment samples are mostly polyhedra with irregular shapes, with particle sizes ranging from 1-10 mm. There are also some small aggregates produced by the proximity of crystal boundaries due to the magnetic dipole-dipole interaction of the magnetic Fe3O4 particles in the pigment [29]. As shown in Fig. 5, the microscopic morphology of the pigment samples doped with different oxides varies slightly. When the results of the energy spectrum analysis at each position in Table 3 are combined, it is clear that when doped with SiO2, position A in Fig. 5(a) represents the amorphous presence of SiO2, which is consistent with the results of XRD analysis. In addition, only the corresponding doping elements are detected in the pigment particles of the MgO, CaO, and ZnO doped pigment samples, with no significant changes in microscopic morphology and size.
Analysis of optical properties
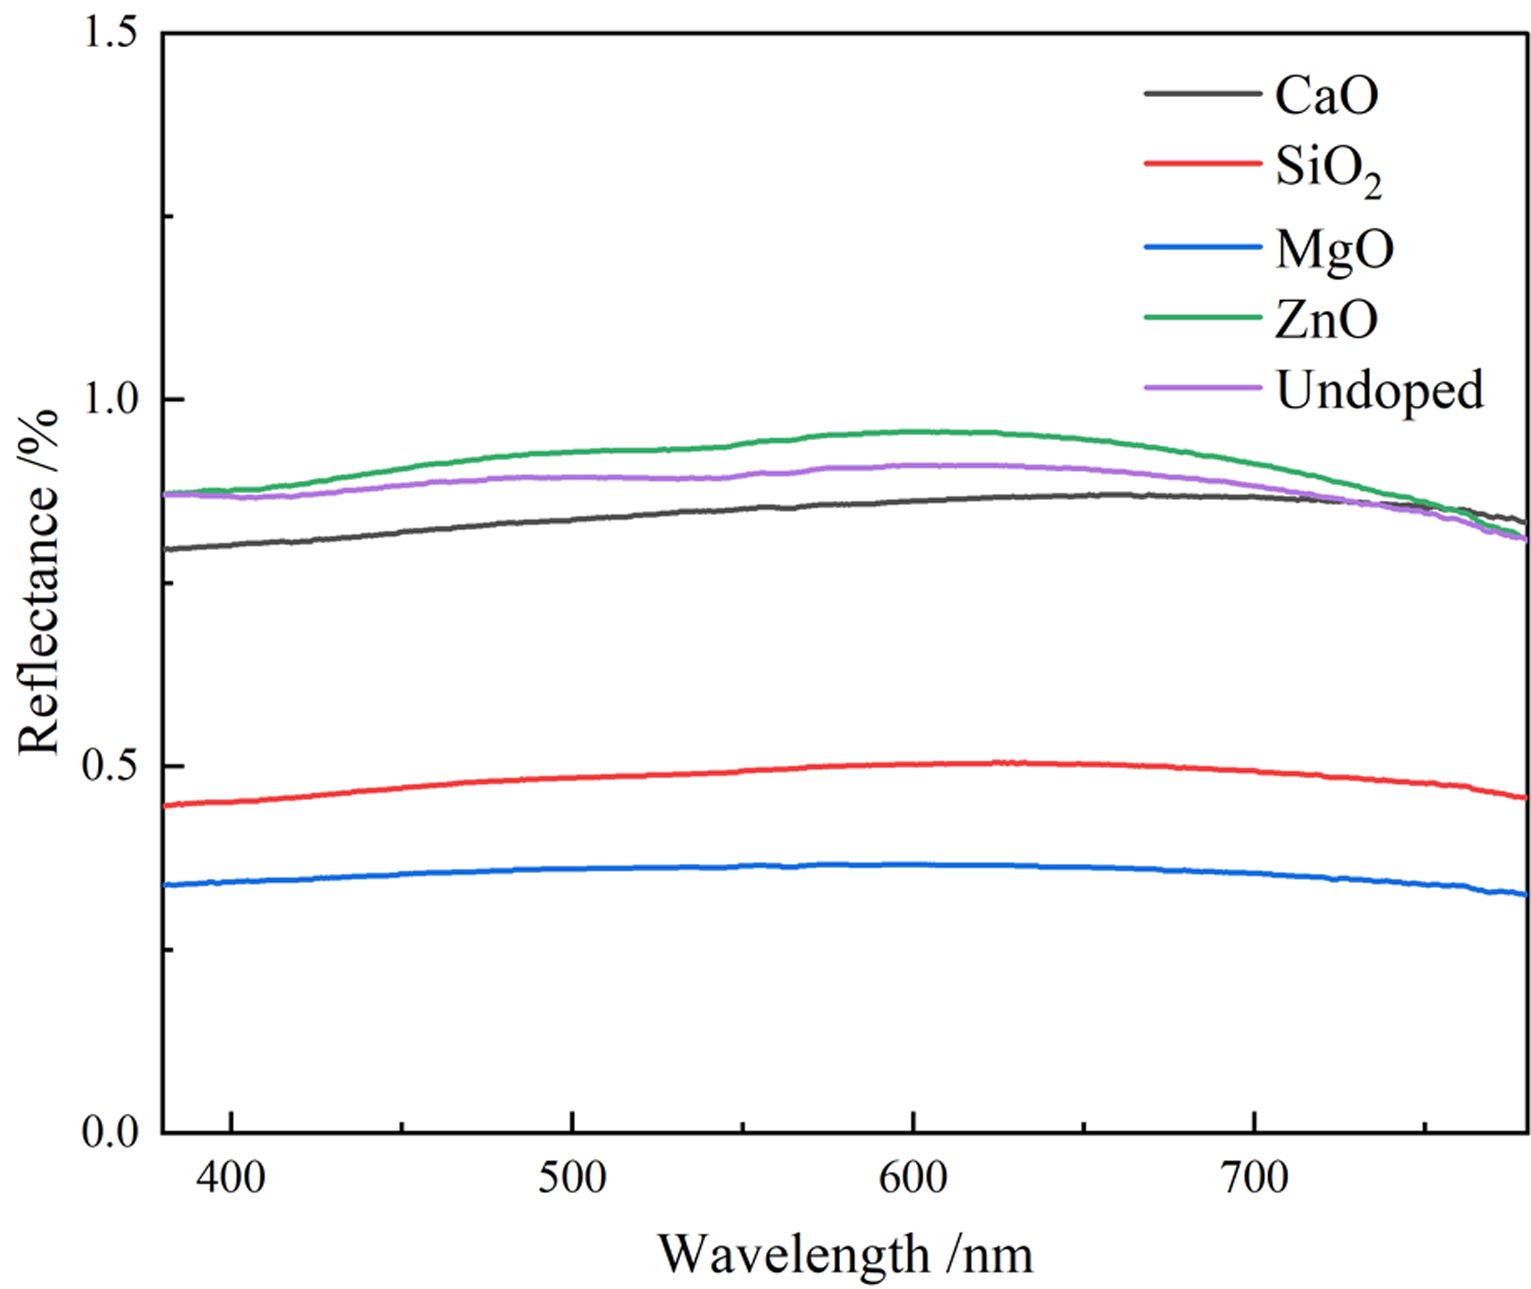
To investigate the color performance of pigments generated by doping different oxides, the UV-vis spectra of pigment samples with different doping are shown in Fig. 6. Fig. 6 indicates the lowest reflectance of MgO-doped pigment samples to visible light, suggesting that it has the strongest monochromatic light absorption capability and the highest black purity. The reflectance of the ZnO-doped pigment sample is the highest, and therefore the pigment black coloring is the worst, which is related to the coloring of the corresponding products generated after doping. When the pigment sample is doped with CaO, the absorption curve of the pigment sample dropped at around 700 nm in the red and purple region, which was linked to the synthesis of CaFe4O7, resulting in the light green of the sample. When the pigment sample is doped with ZnO The absorption curve of the pigment sample increases slightly in the range of 580-700 nm, resulting in a reddish yellow pigment. In comparison to the undoped pigment samples, the pigment samples doped with MgO and SiO2 had higher overall absorption intensity of visible light and consistency of absorption intensity for each band, however, doping ZnO has the reverse effect.
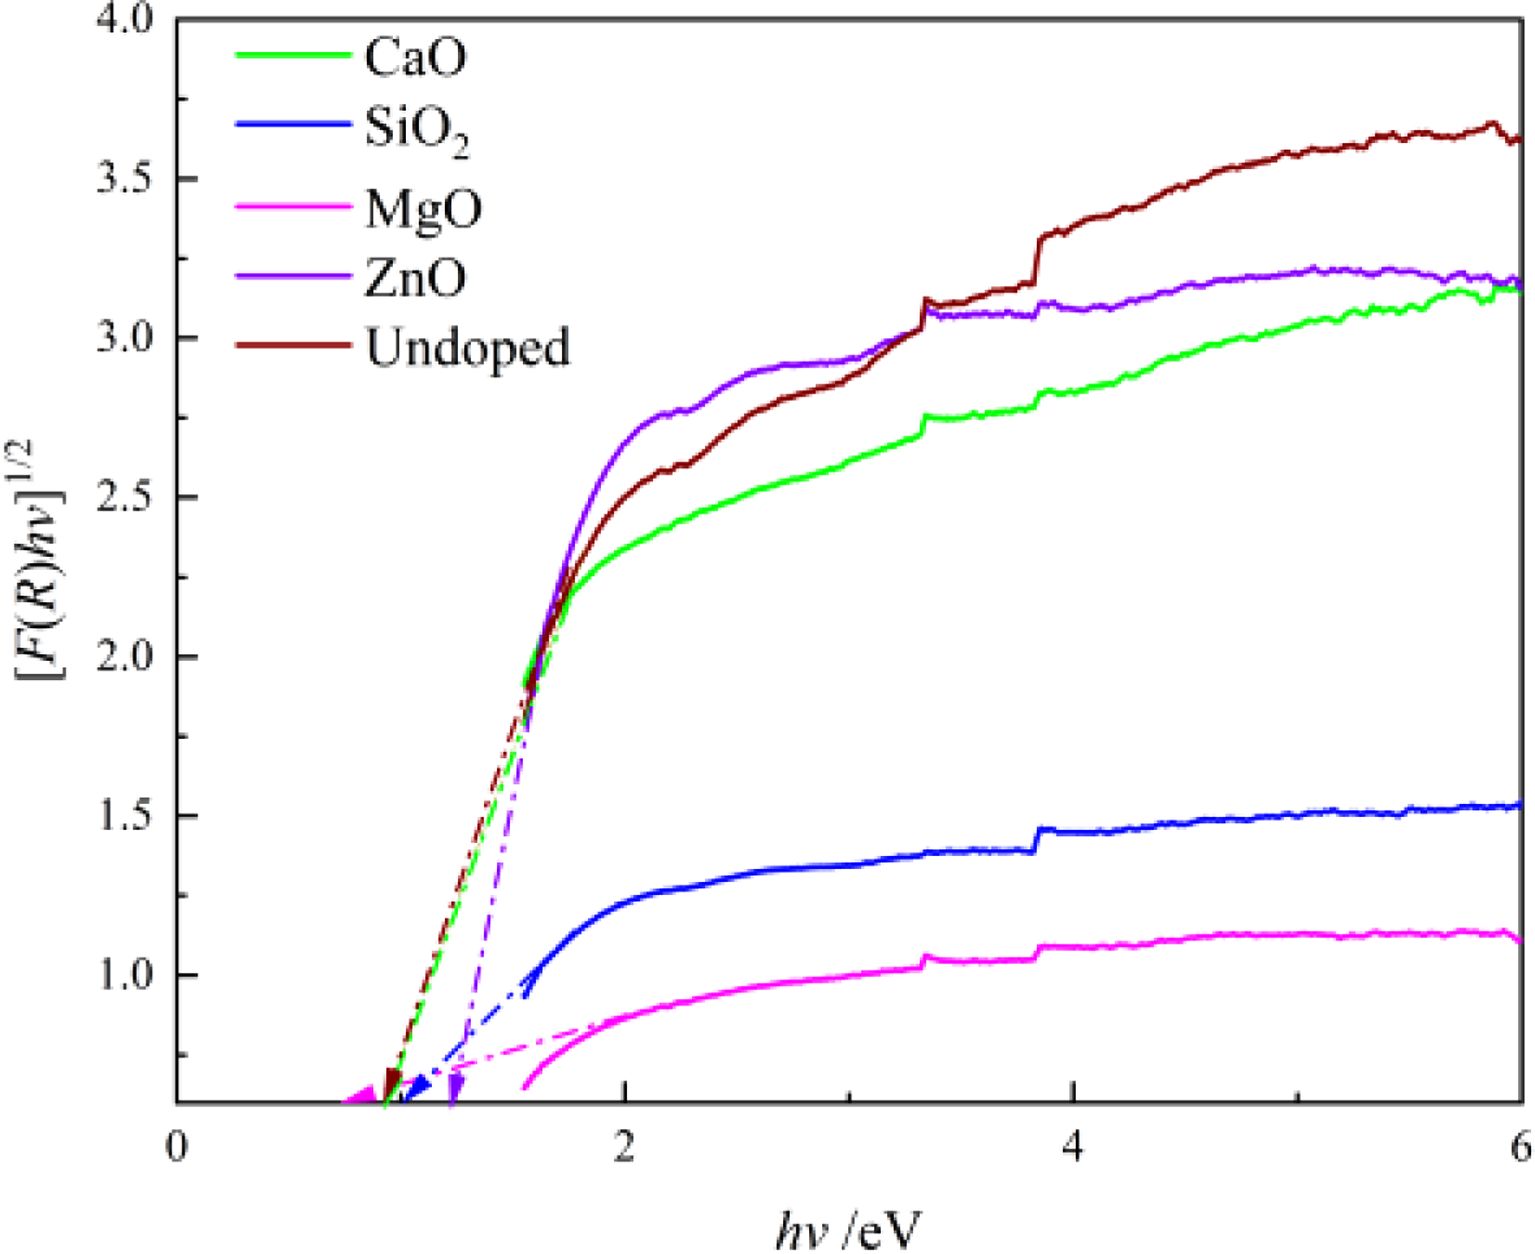
The magnitude of the band gap widths can determine the final color presentation of the pigments, as shown in Fig. 7, which was calculated using the Kubelka-Munk formula and UV-vis spectral data. Fig. 7 indicates the band gap widths (Eg) of all pigment samples are in the black range (Eg < 1.7 eV) [30]. The samples doped with MgO and SiO2 have smaller band gaps than other pigment samples, while ZnO samples have the largest. The charge migration between the 4d conduction band and the valence band of the outermost non-spherically symmetric structure of the transition metal elements Fe, Cr, Ni, and Mn (the hybridized orbitals composed of B-site elements and O 2p) is the main cause of Fe-Cr-Ni-Mn black ceramic pigments, and the minimum energy required for migration is the band gap width. The smaller the band gap of the black pigment, the darker the color of the pigment. As a result, doping with MgO reduces the activation energy required for charge transfer from the conduction band to the valence band, but doping with SiO2 and ZnO raise it.
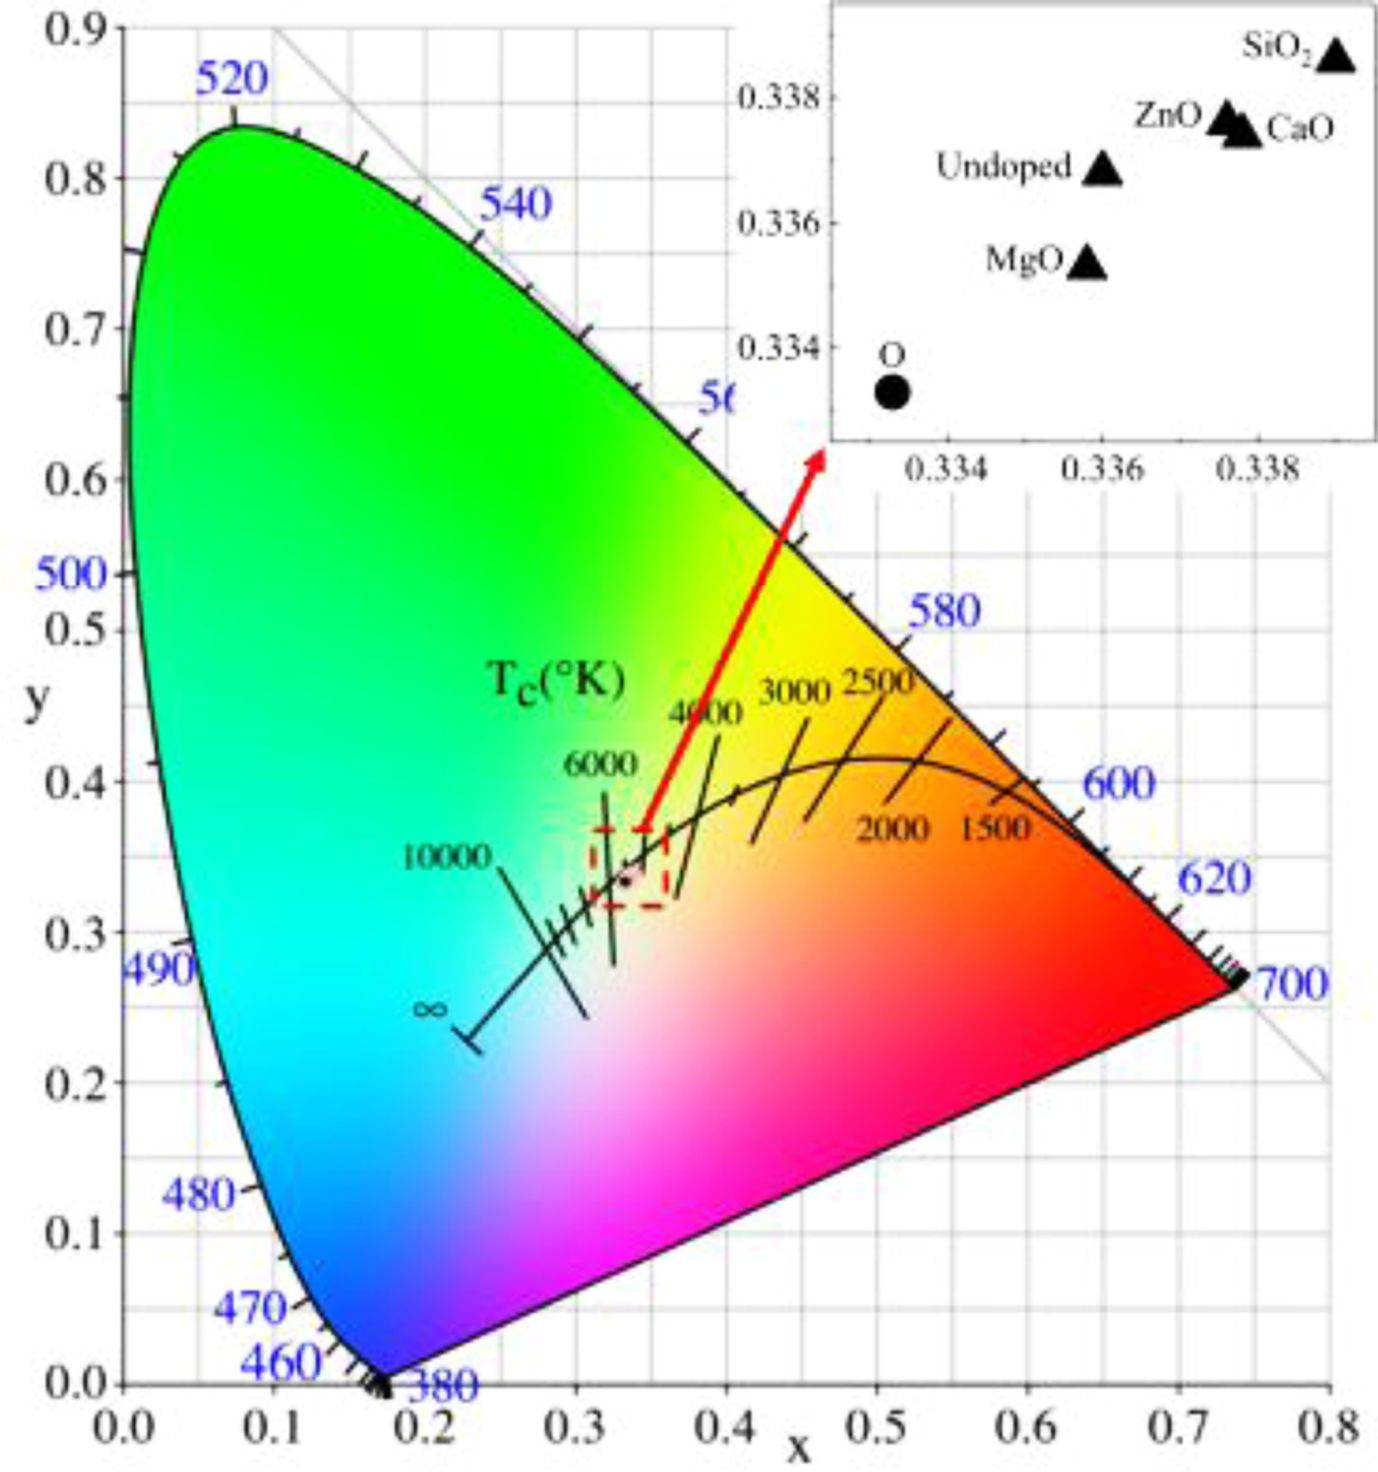
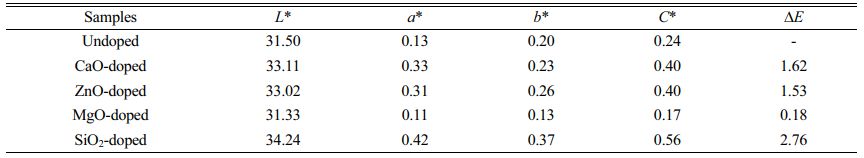
Table 4 shows the changes in chromaticity value of produced pigment after doping. As indicated in Table 4, the undoped pigment sample is pure black with low a* and b* values. The L*, a*, b* and color saturation C* values of the pigment prepared by doping CaO, ZnO, and SiO2 all increase slightly, resulting in a decline in black color performance. When the doped oxide is MgO, the foregoing metrics decrease to varying degrees when compared to the undoped pigment samples, resulting in a reduction in black pigment brightness, color saturation, and black color presentation purity. The CIE chromaticity diagram for the relevant pigment samples is shown in Fig. 8. Point O in Fig. 8 is the extinction point, with color coordinates x=0.3333 and y=0.3333. The color saturation of this point is 0, and the color becomes blacker as the color coordinates get closer to this point. As shown in Fig. 8, the color coordinates of the undoped and doped pigment samples are very close, indicating that impurity oxides in SSD have little influence on the color of black ceramic pigments. The MgO-doped sample has the best black color, and the x and y coordinates of the samples are greater than 0.3333, indicating that the pigment samples are slightly red and yellow (a* and b* values are greater than 0).
|
Fig. 1 XRD patterns of different doping pigment samples. |
|
Fig. 2 XRD patterns of spinel characteristic diffraction peaks in different pigment samples. |
|
Fig. 3 Variation of Gibbs free energy of the related equation with temperature |
|
Fig. 4 FTIR spectra of different doping pigment samples |
|
Fig. 5 SEM image of different doping pigment samples; (a) SiO2, (b) CaO, (c) MgO, (d) ZnO |
|
Fig. 6 UV-vis spectra of different doping pigment samples. |
|
Fig. 7 Band gap of different doping pigment samples. |
|
Fig. 8 Chromaticity diagram of different doping pigment samples. |
|
Table 2 Lattice parameters and crystallite size of different doping pigment samples. |
|
Table 3 Energy spectrum analysis of different microdomains (atom percentage, at%). |
In the preparation of Fe-Cr-Ni-Mn black ceramic pigments using SSD, the presence of MgO in the dust can enhance the coloring properties of the black ceramic pigments, while the presence of CaO, SiO2 and ZnO will cause the pigments to be reddish yellow. Impurity oxides ZnO and MgO combine with Fe2O3 to produce brick red ZnFe2O4 and black MgFe2O4, respectively, whereas CaO reacts with Fe2O3 to form CaFe4O7. Among the spinel grains, SiO2 exists in the form of amorphous. In comparison to the undoped pigment samples, the absorption intensity of pigment samples doped with MgO and SiO2 is higher and more consistent for all bands of visible light, but the absorption intensity of pigment samples doped with ZnO is lower and inconsistent. Doping with MgO, on the other hand, reduces the activation energy of the ion charge transition dramatically, but doping with SiO2 and ZnO increases the activation energy of the transfer. When pigment samples are doped with CaO, the visible light absorption intensity and charge transition activation energy do not change considerably.
The authors sincerely acknowledge the National Natural Science Foundation of China (51904212) for financial support
The authors declare that they have no known competing financial interests or personal relationships that could have appeared to influence the work reported in this paper.
- 1. M. Dondi, C. Zanelli, M. Ardit, G. Cruciani, L. Mantovani, M. Tribaudino, and G.B. Andreozzid, Ceram. Int. 39[8] (2013) 9533-9547.
-

- 2. Z.Q. Li, X. Zhang, G.J. Ma, R.A. Muvunyi, and D.L. Zheng, J. Ceram. Process. Res. 23[3] (2022) 344-349.
-
- 3. X. Zhang, Z.Q. Li, G.J. Ma, Q. Wang, and M.K. Liu, Bull. Chin. Ceram. Soc. 40[4] (2021) 1318-1329.
- 4. Á.G.D.L. Torre, M.A.G. Aranda, L. León-Reina, and P. Javier, Int. J. Appl. Ceram. Technol. 8[4] (2011) 905-910.
-
- 5. J.H. Lee, J.W. Kweon, W.S. Cho, J.H. Kim, K.T. Hwang, H.J. Hwang, and K.S. Han, Ceram. Int. 44[12] (2018) 14151-14157.
-
- 6. B. Tanisan and S. Turan, J. Ceram. Process. Res. 12[4] (2011) 462-467.
-
- 7. G.J. Ma, W. Fan, Z.L. Xue, W. Wang, and H. Tang, Acta. Metall. Sin. Engl. Lett. 23[4] (2010) 267-276.
-
- 8. P. Liu, Z. Liu, M.S. Chu, R.J. Yan, F. Li, and J. Tang, Adv. Powder Technol. 32[11] (2021) 4273-4285.
-
- 9. G.J. Ma and A.M. Garbers-Craig, J. Hazard. Mater. 169[1] (2009) 210-216.
-
- 10. Y. Hara, N. Ishiwata, H. Itaya, and T. Matsumoto, ISIJ Int. 40[3] (2000) 231-237.
-
- 11. X.F. She, J.S. Wang, Q.G. Xue, Y.G. Ding, S.S. Zhang, J.J. Dong, and H. Zeng, Int. J. Miner. Metall. Mater. 18[3] (2011) 277-284.
-
- 12. J. Peng, B. Peng, D. Yu, M.T. Tang, J. Lobel, and J.A. Kozinski, T. Nonferr. Metal. Soc. 14[2] (2004) 392-396.
- 13. J.L. Li, A.J. Xu, D.F. He, Q.X. Yang, and N.Y. Tian, Int. J. Miner. Metall. Mater. 20[3] (2013) 253-258.
-
- 14. X. Zhang, G.J. Ma, Y.B. Jin, and P.H. Cheng, Ceram. Int. 40[7] (2014) 9693-9700.
-
- 15. F.R. Wei, Y.L. Zhang, W.J. Wei, and X.G. Yang, Chin. J. Process. Eng. 11[5] (2011) 786-793.
- 16. X.M. Li, J.X. Zhao, Y.R. Cui, and J. Yang, Mater. Sci. Forum. 620-622 (2009) 603-606.
-
- 17. Z.Q. Li, X. Zhang, G.J. Ma, M.K. Liu, and Q. Wang, Bull. Chin. Ceram. Soc. 40[12] (2021) 4092-4101.
- 18. Z.Q. Li, X. Zhang, G.J. Ma, D.L. Zheng, M.K. Liu, and Q. Wang, J. Chin. Ceram. Soc. 50[6] (2022) 1557-1565.
- 19. Q. Wang, G.J. Ma, X. Zhang, M.K. Liu, and W.L. Yao, J. Wuhan Univ. Sci. Technol. 43[6] (2020) 413-418.
- 20. S. Suwanboon, P. Amornpitoksuk, P. Bangrak, and A. Sukolrat, J. Ceram. Process. Res. 11[5] (2010) 547-551.
-
- 21. J.H. Chen, M.W. Yan, J.D. Su, B. Li, Y. Li, Z.H. Li, J.L. Su, and D.F. Liu, J. Chin. Ceram. Soc. 43[3] (2015) 340-344.
- 22. G. Menegazzo, S. Carbonin, and A. Giust, Mineral. Mag. 61[406] (1997) 411-421.
-
- 23. B. He, Y. Du, H.X. Xu, and J.C. Ma, Trans. Indian Ceram. Soc. 80[2] (2021) 103-109.
-
- 24. A.A. Ozkenter, H.E. Camurlu, and N. Sevinc, J. Ceram. Process. Res. 13[5] (2012) 533-540.
-
- 25. M. Zarinkamar, M. Farahmandjou, and T.P. Firoozabadi, J. Ceram. Process. Res. 17[3] (2016) 166-169.
-
- 26. T. Mariam, I.N. Esha, M.N.I. Khan, S. Choudhury, and K. H. Maria, J. Ceram. Process. Res. 21[4] (2020) 442-449.
-
- 27. S. Kumar, J.A. Azurdia, and R.M. Laine, J. Ceram. Process. Res. 11[5] (2010) 517-522.
-
- 28. A.D. Khalaji, R. Rahdari, F. Gharib, and J. Sanmartín, J. Ceram. Process. Res. 16[5] (2015) 486-489.
-
- 29. Z.Q. Li, X. Zhang, G.J. Ma, D.L. Zheng, T.Y. Du, and R.X. He, Mater. Today Commun. 32 (2022) 104151.
-
- 30. Z.Q. Li, X. Zhang, G.J. Ma, D.L. Zheng, J. Xu, and J. Xu, J. Clean. Prod. 372 (2022) 133751.
-
 This Article
-
2023; 24(1): 51-57
Published on Feb 28, 2023
- 10.36410/jcpr.2023.24.1.51
- Received on Jun 13, 2022
- Revised on Aug 11, 2022
- Accepted on Aug 12, 2022
Services
- Abstract
introduction
experimental
results and discussion
conclusion
- Acknowledgements
- Disclosure Statement
- References
- Full Text PDF
Shared
Correspondence to
- Xiang Zhang
-
The State Key Laboratory of Refractories and Metallurgy, Wuhan University of Science and Technology, Wuhan 430081, P.R. China
Tel : +86-158-2718-1426 Fax: +86-027-68862529 - E-mail: zx91@wust.edu.cn
Clean-Energy Research Institute(CRI), Hanyang University, 222, Wangsimni-ro, Seongdong-gu, Seoul, 04763, Korea
E-mail: jcpr@hanyang.ac.kr