


- Effect of MgO on migration and distribution of chromium in stainless-steel slag glass–ceramics and glass properties
Zhifang Tonga,*, Congcong Xua, Jiaxing Wanga and Zhiheng Jiab
aFaculty of Materials Metallurgy and Chemistry, Jiangxi University of Science and Technology, Ganzhou 341000, China
bChangchun Gold Deign Institute Co., Ltd., Changchun 130000, ChinaThis article is an open access article distributed under the terms of the Creative Commons Attribution Non-Commercial License (http://creativecommons.org/licenses/by-nc/4.0) which permits unrestricted non-commercial use, distribution, and reproduction in any medium, provided the original work is properly cited.
Herein, stainless-steel slag was used to prepare glass–ceramics. The effects of the MgO content on the occurrence, distribution state, and migration behavior of Cr in glass–ceramics as well as glass properties were systematically studied. Results revealed that in the nucleation stage, the number of Cr-spinel (Cr spinel) nanocrystals initially increased and then decreased with the increasing MgO content. In the crystallization stage, the diopside crystal phase considered Cr-spinel nanocrystals as heterogeneous nuclei, which gradually nucleated and grew. Transmission electron microscopy and X-ray photoelectron spectroscopy analyses showed that part of Cr in the spinel migrated into the diopside lattice and some other parts remained in the Cr spinel wrapped by the diopside. Cr in the glass phase also diffused and migrated into the diopside lattice with the formation of diopside crystals. When the MgO content was 12.3 wt.%, 97.33 wt.% of the total amount of Cr was observed in the diopside crystal phase and the leaching concentration of Cr in the glass–ceramics was only 0.006 mg/L. The compressive strength of the glass–ceramics was 261.7 MPa, and the Vickers hardness was 1007.7 HV. The research results provide theoretical and technical support for strengthening Cr fixation and realizing harmless and high-value utilization of stainless-steel slag
Keywords: Stainless-steel slag, Glass–ceramics, Cr, Migration–distribution, Performance
As an important raw material, stainless steel is widely used in metallurgy, construction, transportation, food, medicine, and other fields [1-3]. In 2020, the total output of crude stainless steel in China was 30.139 million tons and more than 9 million tons of stainless-steel slag was produced. Cr in stainless-steel slag often exists in the form of Cr3+, and a small amount exists in the form of Cr6+. Studies have shown that when stainless-steel slag is stored in the natural environment for long durations, Cr3+ can oxidize into highly toxic Cr6+, which can be easily dissolved in water and can enter the environment, thereby harming the environment and human body [4-6]. Therefore, the large number of stacked stainless-steel slag has seriously restricted production in the stainless-steel industry. Innocuously disposing this slag has become a bottleneck in the sustainable development of the stainless steel manu- facturing industry. Currently, harmless and high-value utilization of stainless-steel slag has become an international research hotspot.
Glass–ceramics is a type of polycrystalline solid material that contains a large amount of microcrystalline and glass phases. Glass–ceramics is obtained by nucleation and crystallization of a parent glass with a specific composition in the heating process [7-10]. Compared with an ordinary glass, glass–ceramics offers the advantages of high mechanical strength, good wear resistance, and stable chemical properties. Therefore, it is widely used in many fields such as in construction, chemical industry, and medical treatment [11-14]. Because the main chemical composition of stainless-steel slag is similar to that of glass–ceramics and Cr2O3 in the slag can be used as the main nucleation agent to produce glass–ceramics, preparation of glass–ceramics from stainless-steel slag can solidify Cr in the slag, which is an effective method of realizing harmless and high-value utilization of stainless-steel slag.
In recent years, research on the preparation of glass–ceramics from stainless-steel slag has gradually increased [15-20]. Ouyang et al. [21] used stainless-steel slag to prepare glass–ceramics using diopside as the main crystalline phase in which the maximum addition of stainless-steel slag was 20 wt.%. Zhang et al. [22] used 37.8 wt.% stainless-steel slag to prepare glass–ceramics, which further improved the utilization rate of stainless-steel slag. Research on the preparation of glass–ceramics has shown that the MgO content in the parent-glass composition introduces a certain effect on the properties of glass–ceramics [23]. Deng et al. [24] pointed out that following the increase in the MgO content, the precipitated ordinary pyroxene crystals were gradually refined, and the morphology changed from strip to granular. The study of Dechandt et al. [25] and Salman et al. [26] demonstrated that in the crystallization stage, increase in the MgO content made the glass precipitate more crystals, resulting in the increase in hardness of the glass–ceramics. In the research of Li et al. [27], when the MgO content increased from 1.1 wt.% to 7.5 wt.%, the diopside spherical crystal became more uniform, and the content gradually increased in the crystallization stage.
As a summary, existing studies focus on the influence of MgO content on the crystal growth and glass properties during the crystallization stage of glass–ceramics, whereas on a few studies focus on the influence of MgO content on the occurrence, distribution, and migration behavior of Cr from the nucleation to crystallization stage. Because the migration–distribution trend and occurrence state of Cr in the nucleation and crystallization process of glass–ceramics significantly affect the Cr-fixation effect of glass–ceramics, investi- gating the occurrence state and migration behavior of Cr in glass–ceramics is very important for strengthening the Cr fixation.
In the present study, stainless-steel slag was used as the main raw material for glass–ceramics preparation using the melting method. The effects of MgO on the types and morphology of the nuclei and the occurrence, distribution, and migration behavior of Cr between the nuclei and glass phase in the nucleation stage were investigated. In the crystallization stage, the migration behavior of Cr from nuclei to crystal and the effect of MgO on the occurrence and distribution of Cr between the crystal and glass phase were studied. Finally, the mechanical properties and Cr-fixation effect of the glass–ceramics were verified to explore the curing behavior of glass–ceramics on Cr. The research results provided theoretical and technical support for strength- ening the Cr fixation and realizing harmless and high-value utilization of stainless-steel slag.
Sample preparation
Raw materials and formula
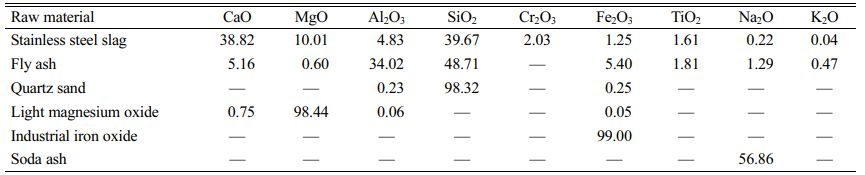
We used stainless-steel slag as the main raw material for the glass–ceramics preparation together with fly ash, a small amount of quartz sand, light magnesium oxide, soda ash, and an industrial iron oxide for adjusting its composition. X-ray fluorescence spectro- meter (XRF, Axios Max, Netherlands) was used to detect the main chemical components of the raw materials, as listed in Table 1.
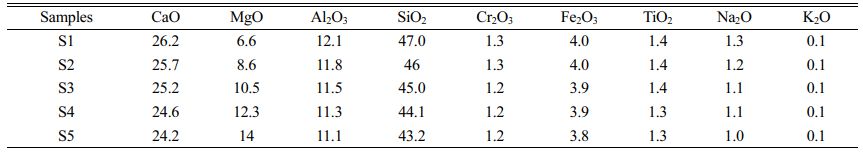
In this study, CaO–MgO–Al2O3–SiO2 (CMAS) glass–ceramics with diopside as the main crystalline phase was prepared. By referring to relevant literature [5,28-31] and the previous work of our research group [32], the S3 formula listed in Table 2 was used as the basic glass formula in which the added amount of stainless-steel slag was 60 wt.% and that of fly ash was 20 wt.%. The added amount of the main raw materials remained unchanged. The MgO content in the basic S3 formula was varied by adding a light magnesium oxide to obtain five groups of glass–ceramics formulas, namely, S1, S2, S3, S4 and S5 (S1–S5). Their chemical compositions are listed in Table 2.
Technological process
All raw materials were crushed, dried at 100 °C for 24 h, and sieved using a 200-mesh sieve. The raw materials were weighed according to the formula. They were then ball-milled in a ball mill for 3 h (the ball-to-material ratio was 10:1). The mixed raw materials were put into a 200-mL alumina crucible and subsequently placed in a tubular furnace. They were then heated to 1550 °C at 10 °C/min and kept warm at this temperature for 1 h. Finally, nitrogen was injected into the entire process for protection. Simultaneously, a stainless-steel mold was put into the muffle furnace and heated to 550 °C. The molten glass was poured into the mold, placed in the muffle furnace, annealed at 550 °C for 1 h, and cooled in the furnace to prepare the parent glass. The parent glass was placed in an isothermal-gradient furnace and heated according to the heat-treatment system to obtain a nucleation glass and crystallized glass–ceramics.
Testing and characterization
Thermal analysis
The glass was cut into 20 mm × 10 mm × 10 mm strips. The thermal-expansion curve of the parent glass was measured using a thermal-expansion analyzer (CTE, ZRPY-1000, China), and the transformation temperature (Tg) of the glass was analyzed. The test temperature ranged from room temperature to 780 °C, and the heating rate was 5 °C/min. The crystallization temperature of the parent glass in argon atmosphere was measured using a differential scanning calorimeter (DSC, NETZSCH STA449F5, Germany) at a heating rate of 10 °C/min, and the measurement temperature range was 30 °C–1000 °C.
X-ray diffraction (XRD)
The glass sample was ground to less than 200-mesh size and was analyzed using XRD (D/max 2500 PC, Japan) under Cu–Kα radiation at a working voltage of 40 kV and working current of 30 mA. The scanning range was 10°–90°, and the scanning angular velocity was 0.2°/s.
Scanning electron microscopy (SEM)
The internal crystal morphology of the glass samples was observed using SEM (Philips XL30, America). The sample was flooded with HF solution (5 vol.%) for 20 s, immediately washed with distilled water, sub- sequently washed with ethanol, and finally dried. Before the test, gold was sprayed on the sample surface, which was fixed on the stage using a conductive adhesive.
Transmission electron microscopy (TEM)
The types and morphology of the nanocrystals in the nucleation glass were analyzed using TEM (Tecnai G2-20, America). The sample was thoroughly ground in an agate crucible. A 10-mg sample was obtained and placed in a centrifugal tube containing 10-mL ethanol solution. Ultrasonic dispersion was then carried out in an ultrasonic disperser for 30 min. After letting the sample stand for 20 min, the solution was dropped on a copper net using a dropper. The solution was irradiated for 5 min using a baking lamp. The acceleration voltage of TEM was 300 kV, and the point resolution was 0.24 nm.
X-ray photoelectron spectroscopy (XPS)
The nucleation glass and glass–ceramics powder were tested using XPS (ESCALAB 250XI, America). The test condition was Al Kα X-ray (1486.6 eV). The passing energy of the high-resolution scanning was 30.0 eV at 0.05-eV step, and the peak position was calibrated using the standard C1s peak (284.8 eV).
Mechanical-property test
The glass–ceramics sample was processed into a 10 mm × 10 mm × 10 mm block. The upper and lower surfaces of the sample were polished, and the compressive strength of the glass–ceramics was measured using a universal testing machine. A HV-100A Vickers-hardness tester was used to measure the Vickers hardness of the glass–ceramics under a load of 9.8 N for 15 s.
Cr leaching test
In this study, a liquid–solid ratio of 10:1 (L/kg) was used to leach Cr in the glass–ceramics using the overturning oscillation method to investigate the Cr-fixation effect of the glass–ceramics. The samples were oscillated for 1, 3, 5, 7, and 24 h and allowed to stand for 4 h. Then, a pressure filter (0.45-μm filter membrane) was used to extract the leachate and stored it at 25 °C. The Cr concentration in the leaching solution was measured using an inductively coupled plasma mass spectrometer (ICP, Thermo ICAP 6300, America).
Determination of the heat-treatment system
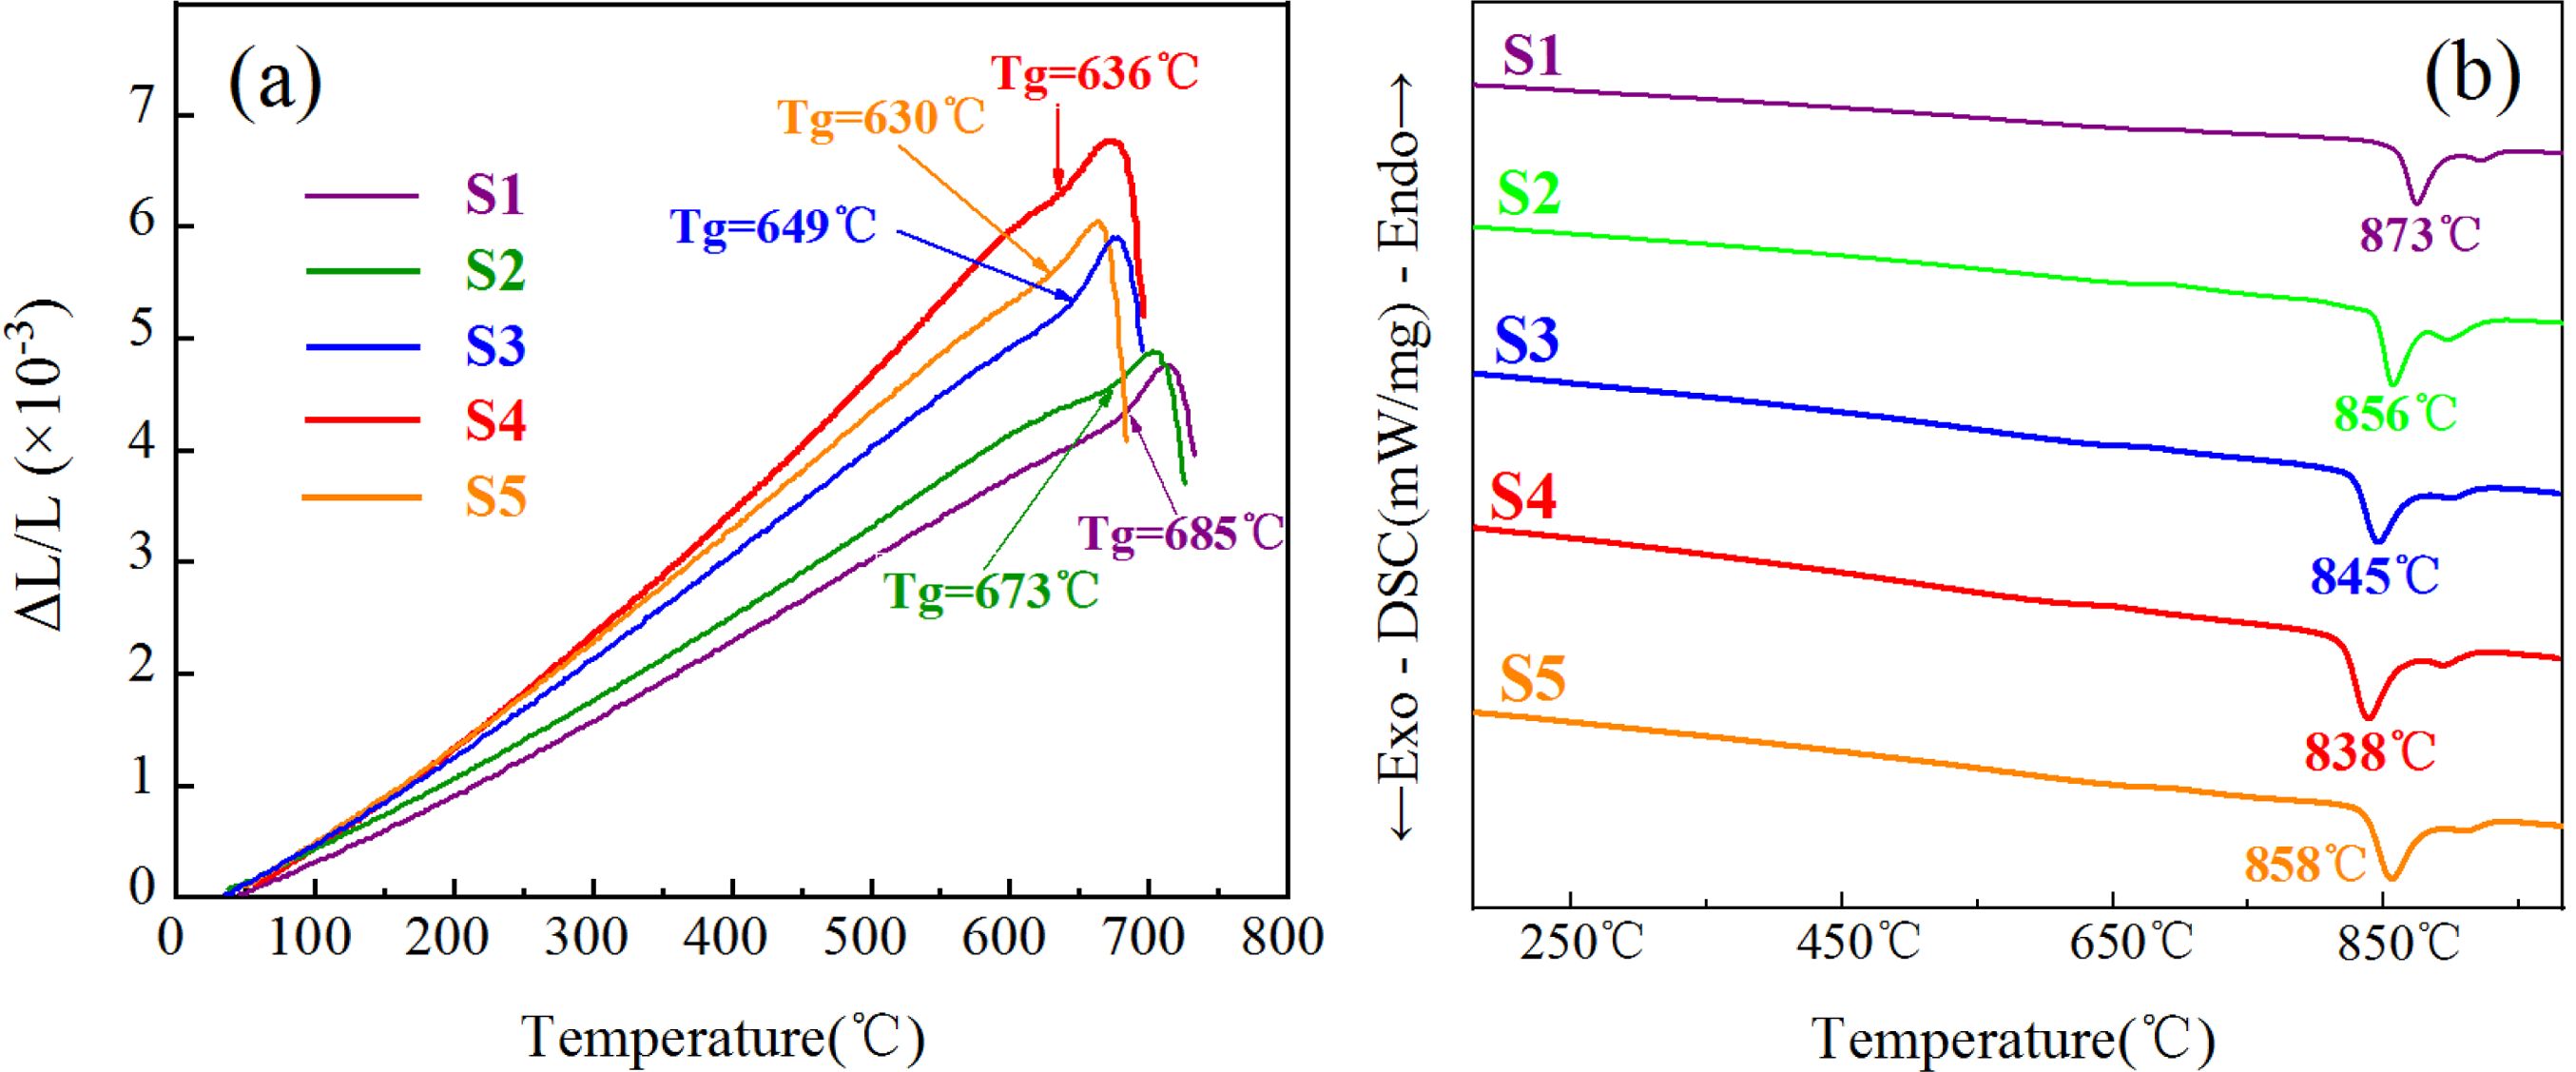
CTE and DSC tests were performed to determine the nucleation and crystallization heat-treatment systems of the S1–S5 glass–ceramics. Fig. 1(a) shows the thermal-expansion curve of the S1–S5 parent glasses. Fig. 1(a) shows that the Tg of the parent glass varied with the addition of MgO. Studies have shown that the nucleation temperature of glass–ceramics is generally 30 °C–50 °C above Tg [30-32]. In conjunction with our previous research, the present study selected nucleation temperatures of 725 °C, 713 °C, 689 °C, 676 °C, and 670 °C and a nucleation time of 2 h to represent the nucleation heat-treatment system of the S1–S5 glass–ceramics. Fig. 1(b) shows the DSC curve of the S1–S5 parent glasses. From Fig. 1(b) and our previous work, the S1–S5 glass–ceramics showed crystallization temperatures of 873 °C, 856 °C, 845 °C, 838 °C, and 858 °C, respectively, and the crystallization time of 2.5 h.
Effect of MgO on the internal micromorphology of glass
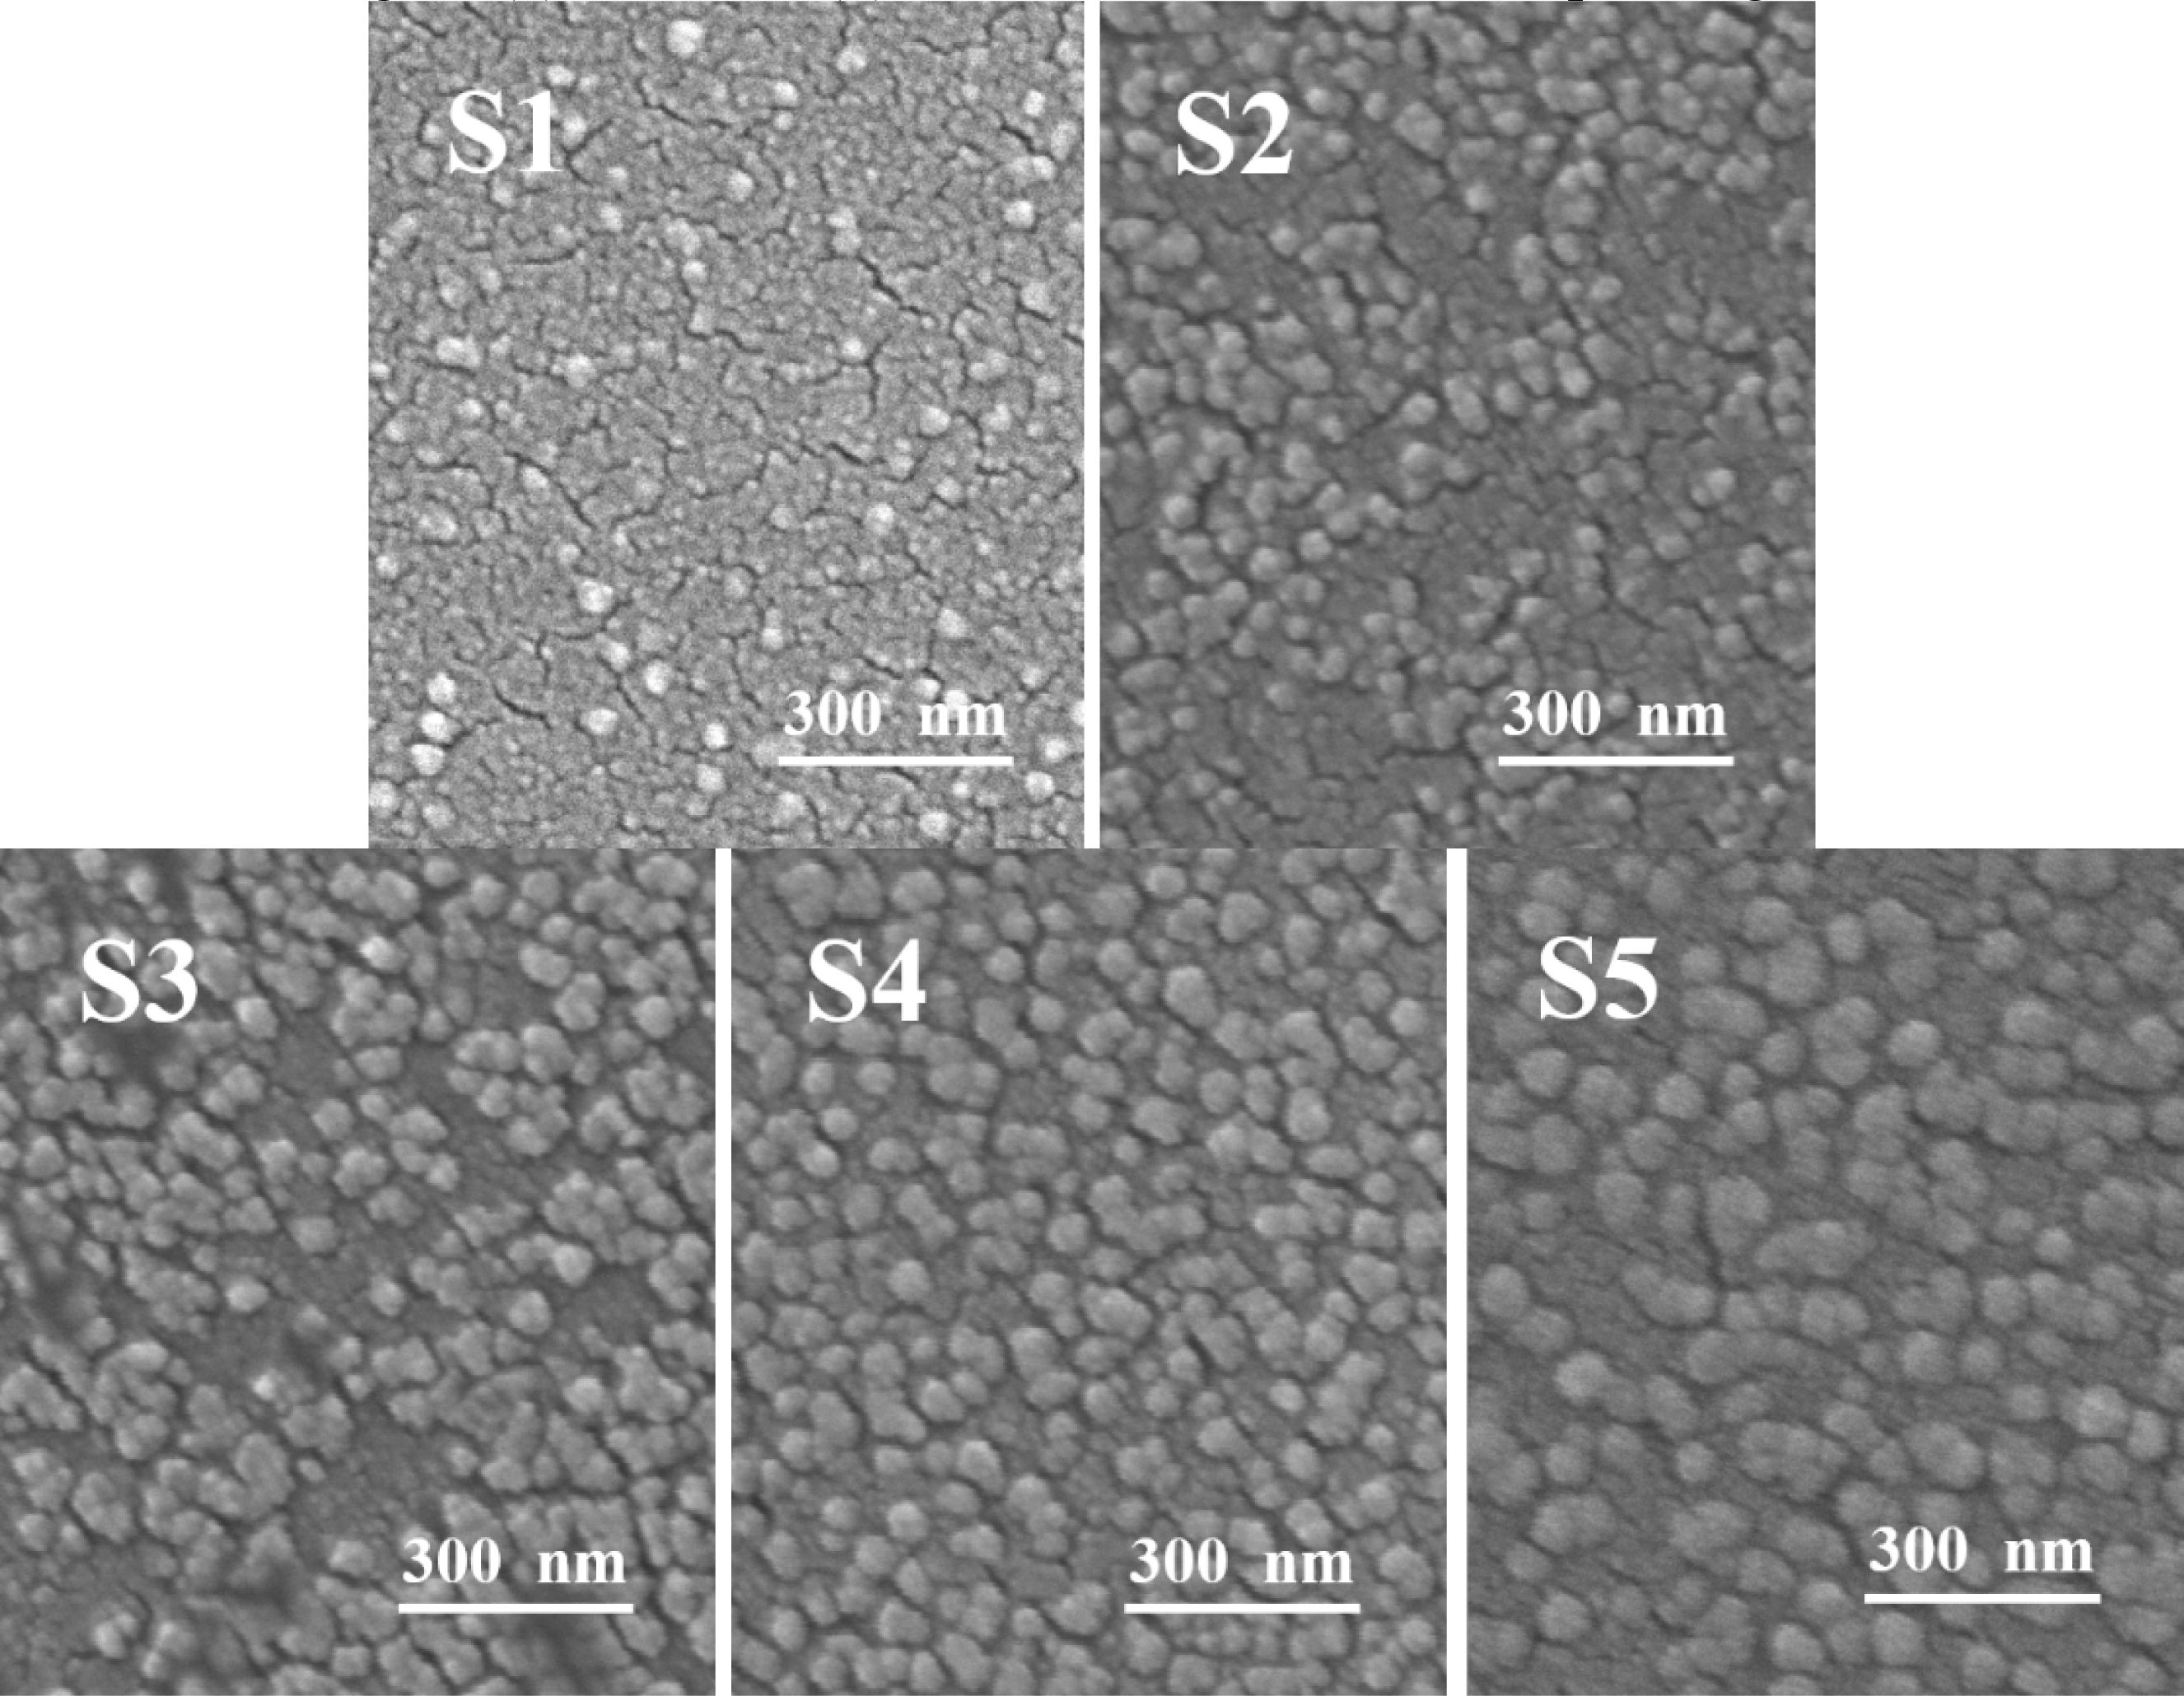
The morphology of the S1–S5 glass after the nucleation treatment was analyzed using SEM, and the results are shown in Fig. 2, which shows that a large number of nanocrystals with a particle size of 20–60 nm were generated in the S1–S5 glass matrix. The added MgO increased from 6.6 wt.% to 12.3 wt.%, and the number of grains gradually increased. Xu et al. [36] pointed out that the addition of MgO could provide “free oxygen” and break the silicon–oxygen network in the glass matrix. Following the increase in the MgO content, the “free oxygen” gradually increased, the fracture in the silicon–oxygen-network structure in the glass matrix increased, the glass viscosity decreased, the ion-migration rate in the glass increased, and the number of precipitated grains gradually increased. When the MgO content was 12.3 wt.%, the nanocrystals were evenly distributed, the largest number, and the particle size was approximately 40 nm. When the MgO content was 14 wt.%, the number of grains decreased, and the particle size increased to 55 nm. This result was due to the excessive addition of MgO, more fracture in the silicon–oxygen network, faster migration rate of the ions, and higher grain-growth trend per unit time than those of the grain formation, which increased the size and decreased the number of nanocrystals.
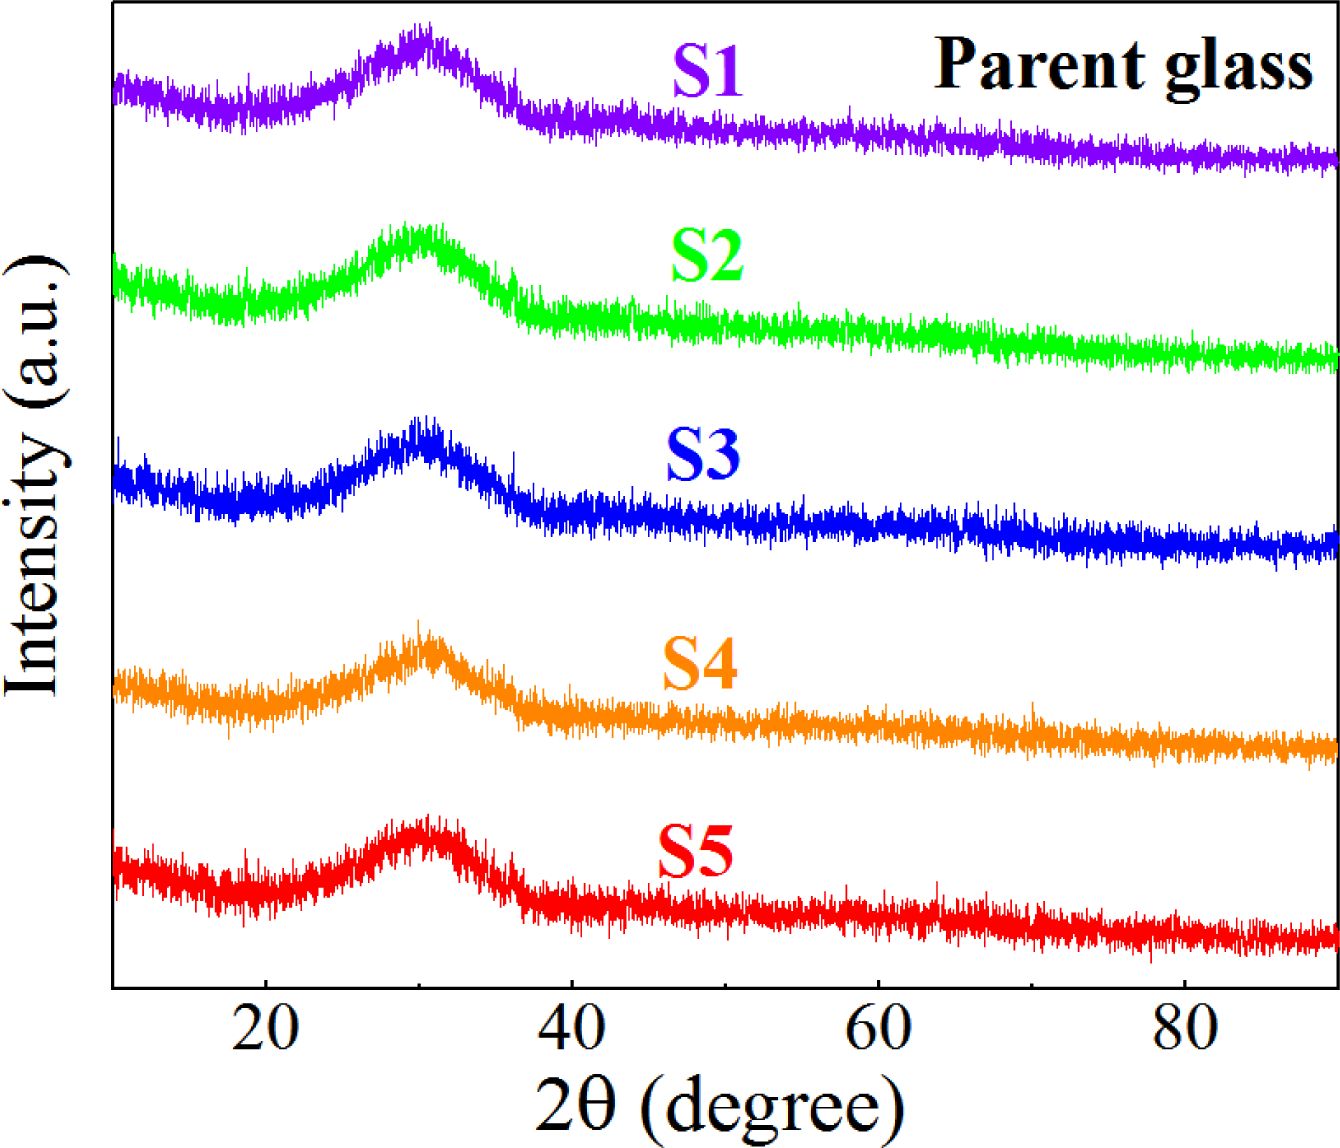
The phase of the S1–S5 nucleation glass was detected using XRD, and the results are shown in Fig. 3, which shows that only the typical wide glass peak of the inorganic glass appeared at 20°–40°. No obvious crystal diffraction peak was observed. The reason could be that the size of the generated nanocrystals was small, the dispersion of the grains in the glass was high, and the diffraction peaks of the crystals were widened, overlapped, and blurred, which exhibited the characteristics of amorphous diffraction peaks.
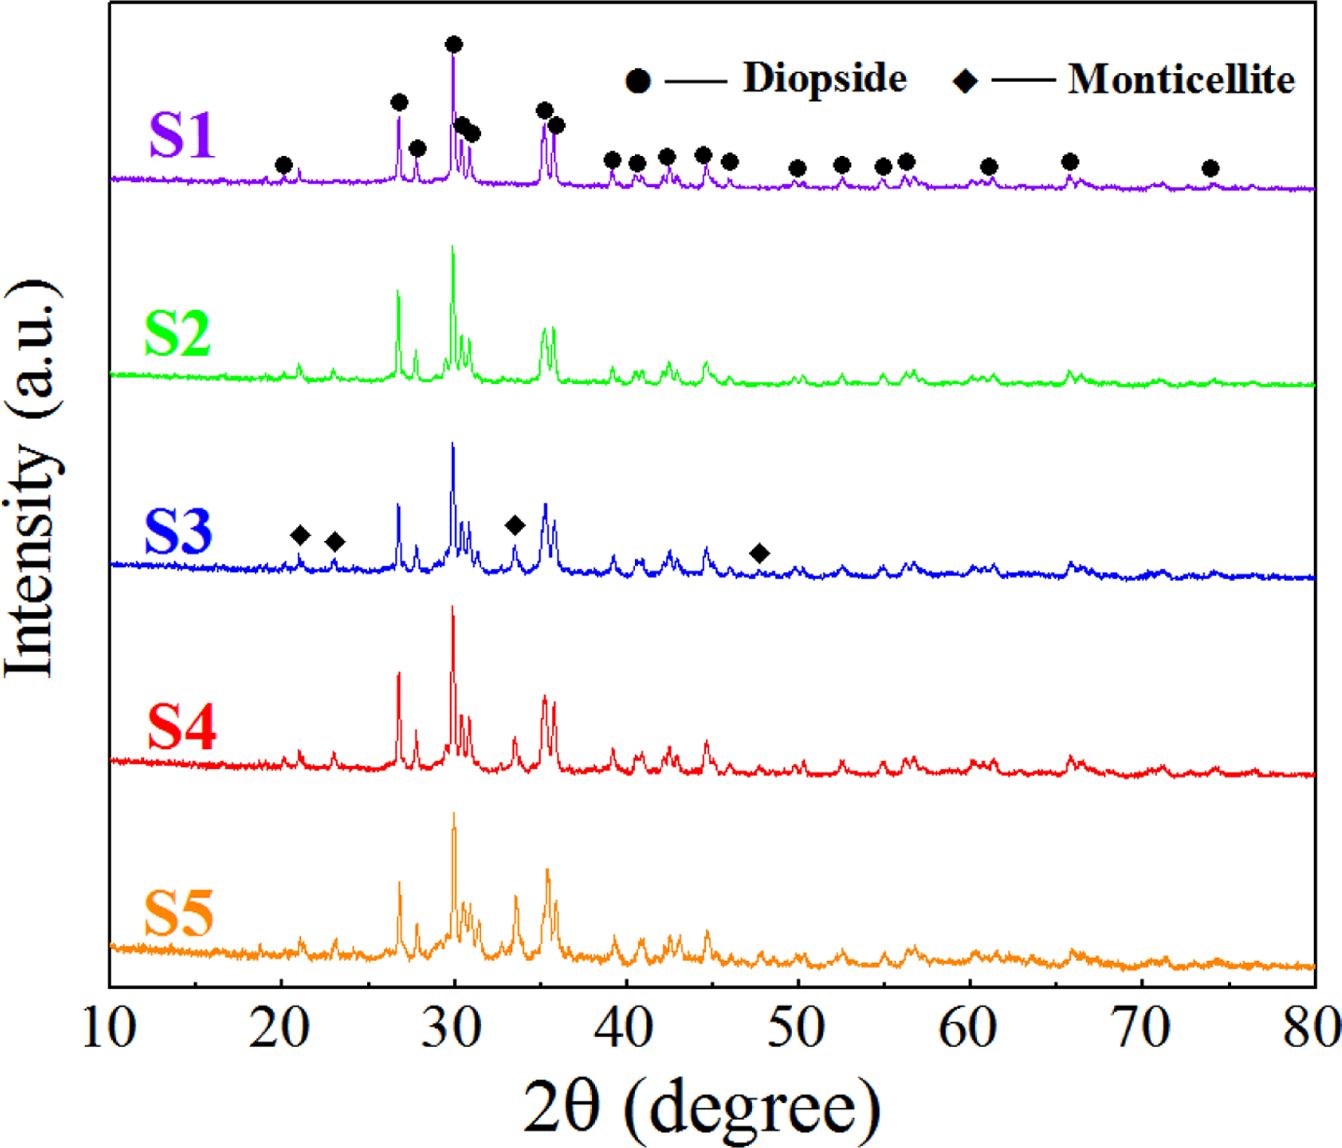
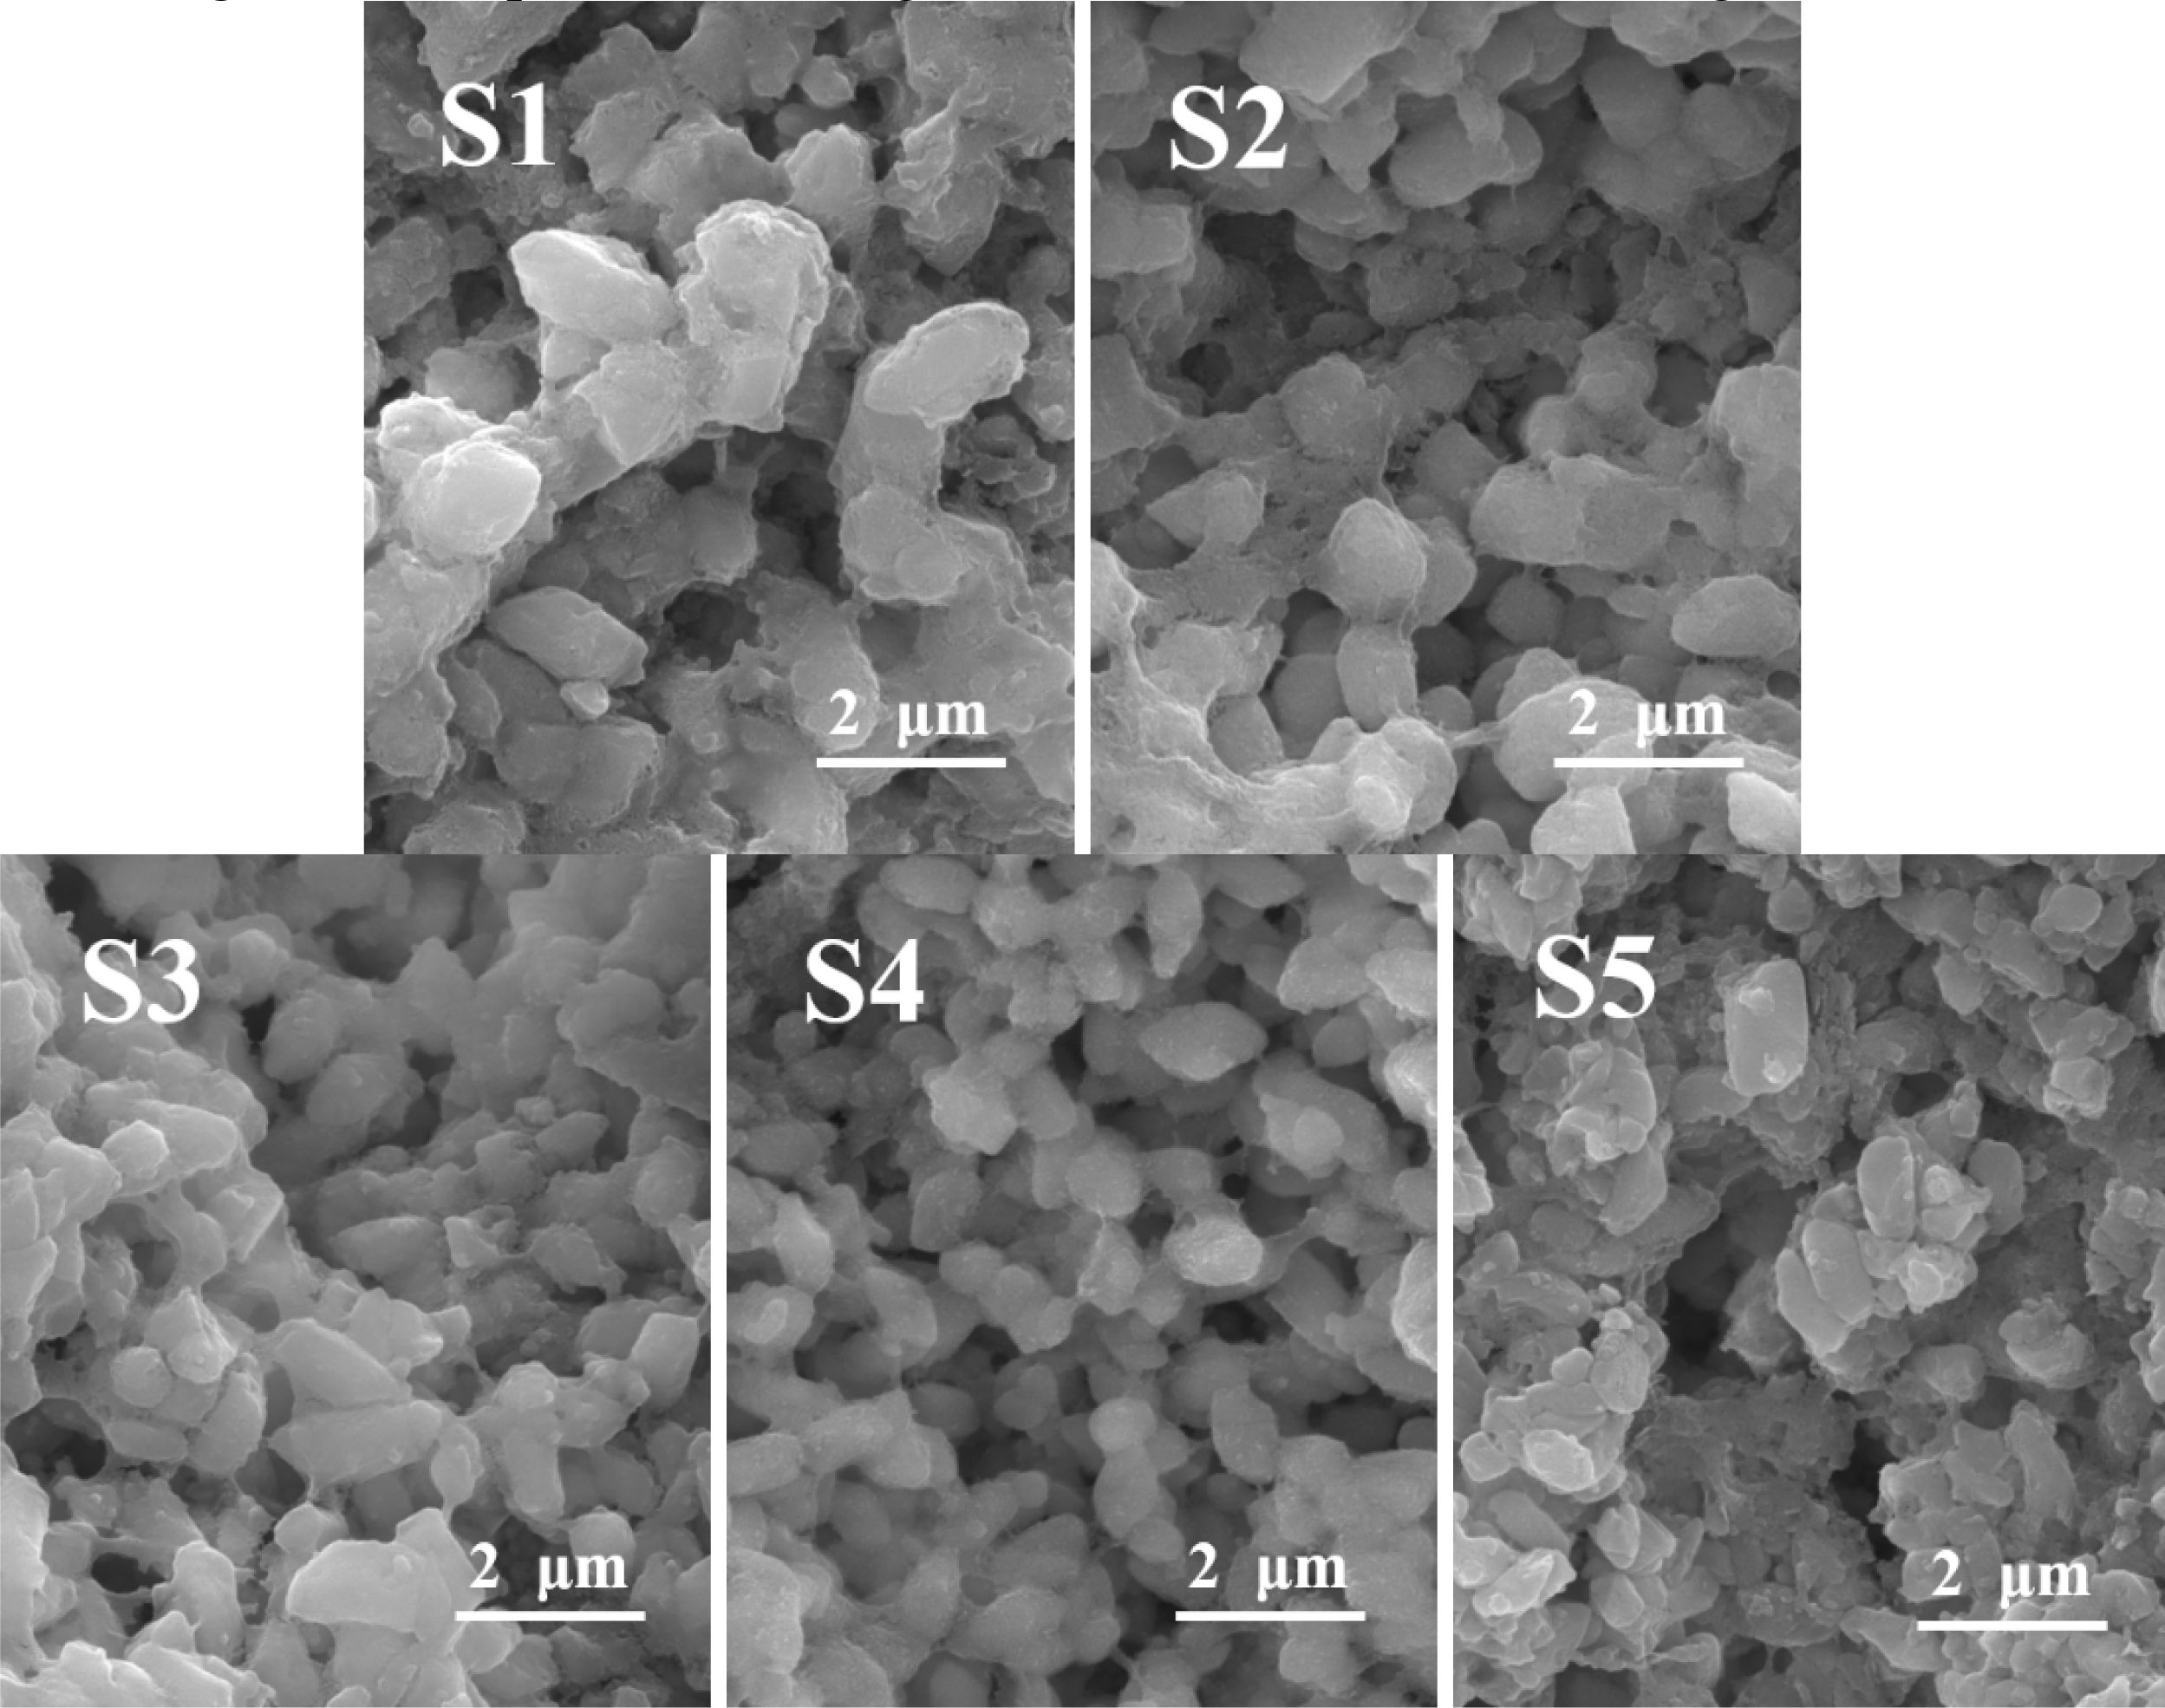
The morphology and phase of the S1–S5 glass–ceramics after crystallization heat treatment were detected using XRD and SEM. The results are shown in Figs. 4 and 5. According to the XRD and SEM results, the main crystal phase of the S1–S5 glass–ceramics was diopside (CaMgSi2O6), and the small amount of secondary crystal phase was monticellite (CaMgSiO4).
When the MgO content increased from 6.6 wt.% to 12.3 wt.%, the number of diopside crystals gradually increased, and its particle size decreased from 1.5 to 1 μm. When the MgO content continued to increase, the number of diopside crystals decreased, and the particle size increased. The reason was that the number of nanocrystals generated in the nucleation stage directly affected the number and particle size of the diopside crystals during the crystallization process. When the MgO content was 12.3 wt.%, the number of nanospinel grains generated in the nucleation glass was the highest, and diopside grew with the spinel grains as heterogeneous nuclei during the crystallization process. The growth interfaces of the diopside crystals contacted with each other to prevent continuous growth of grains, which resulted in the largest number of diopside crystals, and the particle size became smallest.
Effect of MgO on the migration behavior and occurrence distribution of Cr in the nucleation stage
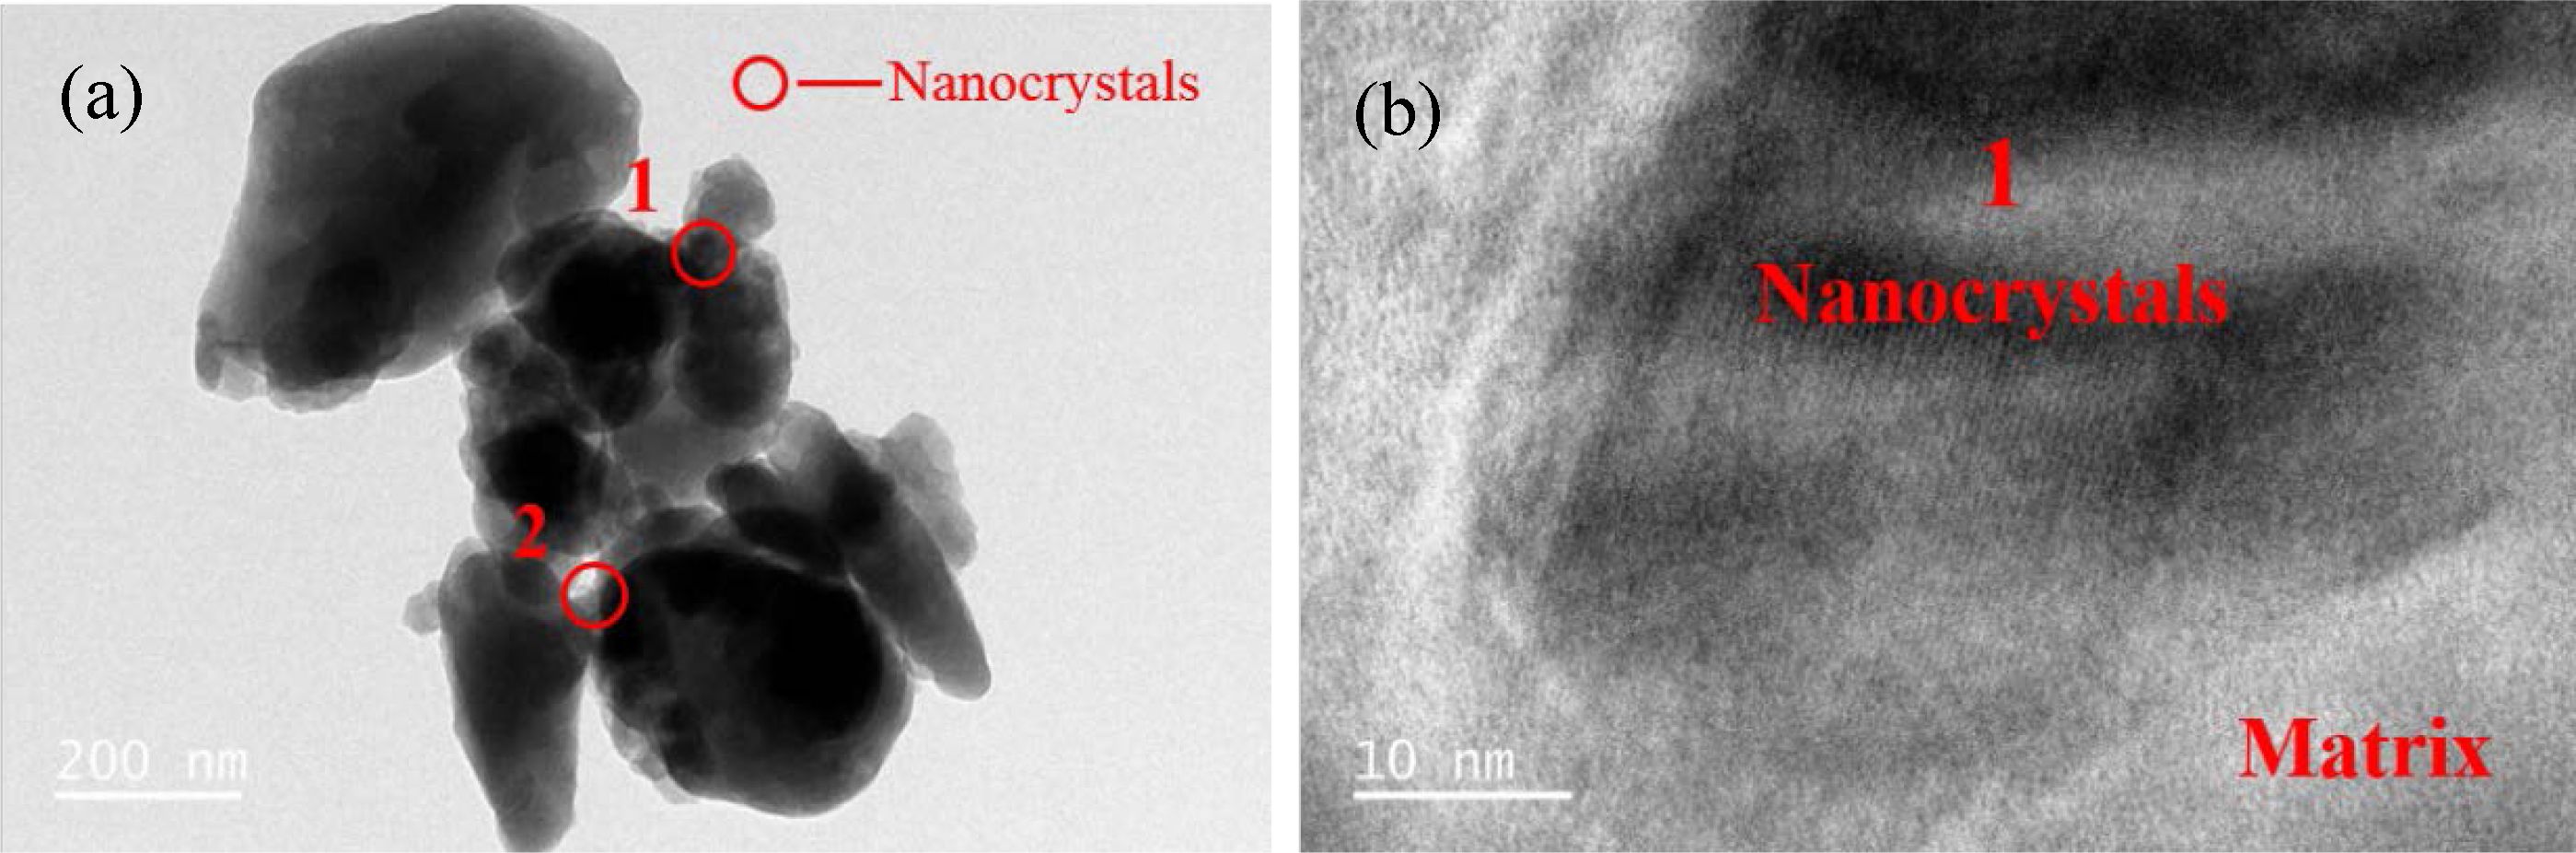
Because the nanocrystals formed in the nucleation stage of glass–ceramics were relatively small and highly dispersed, their phases were difficult to analyze by XRD. Many researchers indirectly speculated that the nanocrystals formed in the glass are MgCr2O4 spinel based on theoretical analysis and EDS test results [37-39]. Direct detection of whether the nanocrystals are Mg–Cr spinel has not been reported. In the present study, TEM test analysis was conducted on the S1–S5 nucleation glass powder to determine the phase type of the nanocrystals. We considered the S4 nucleation glass as an example. The test results are shown in Fig. 6.
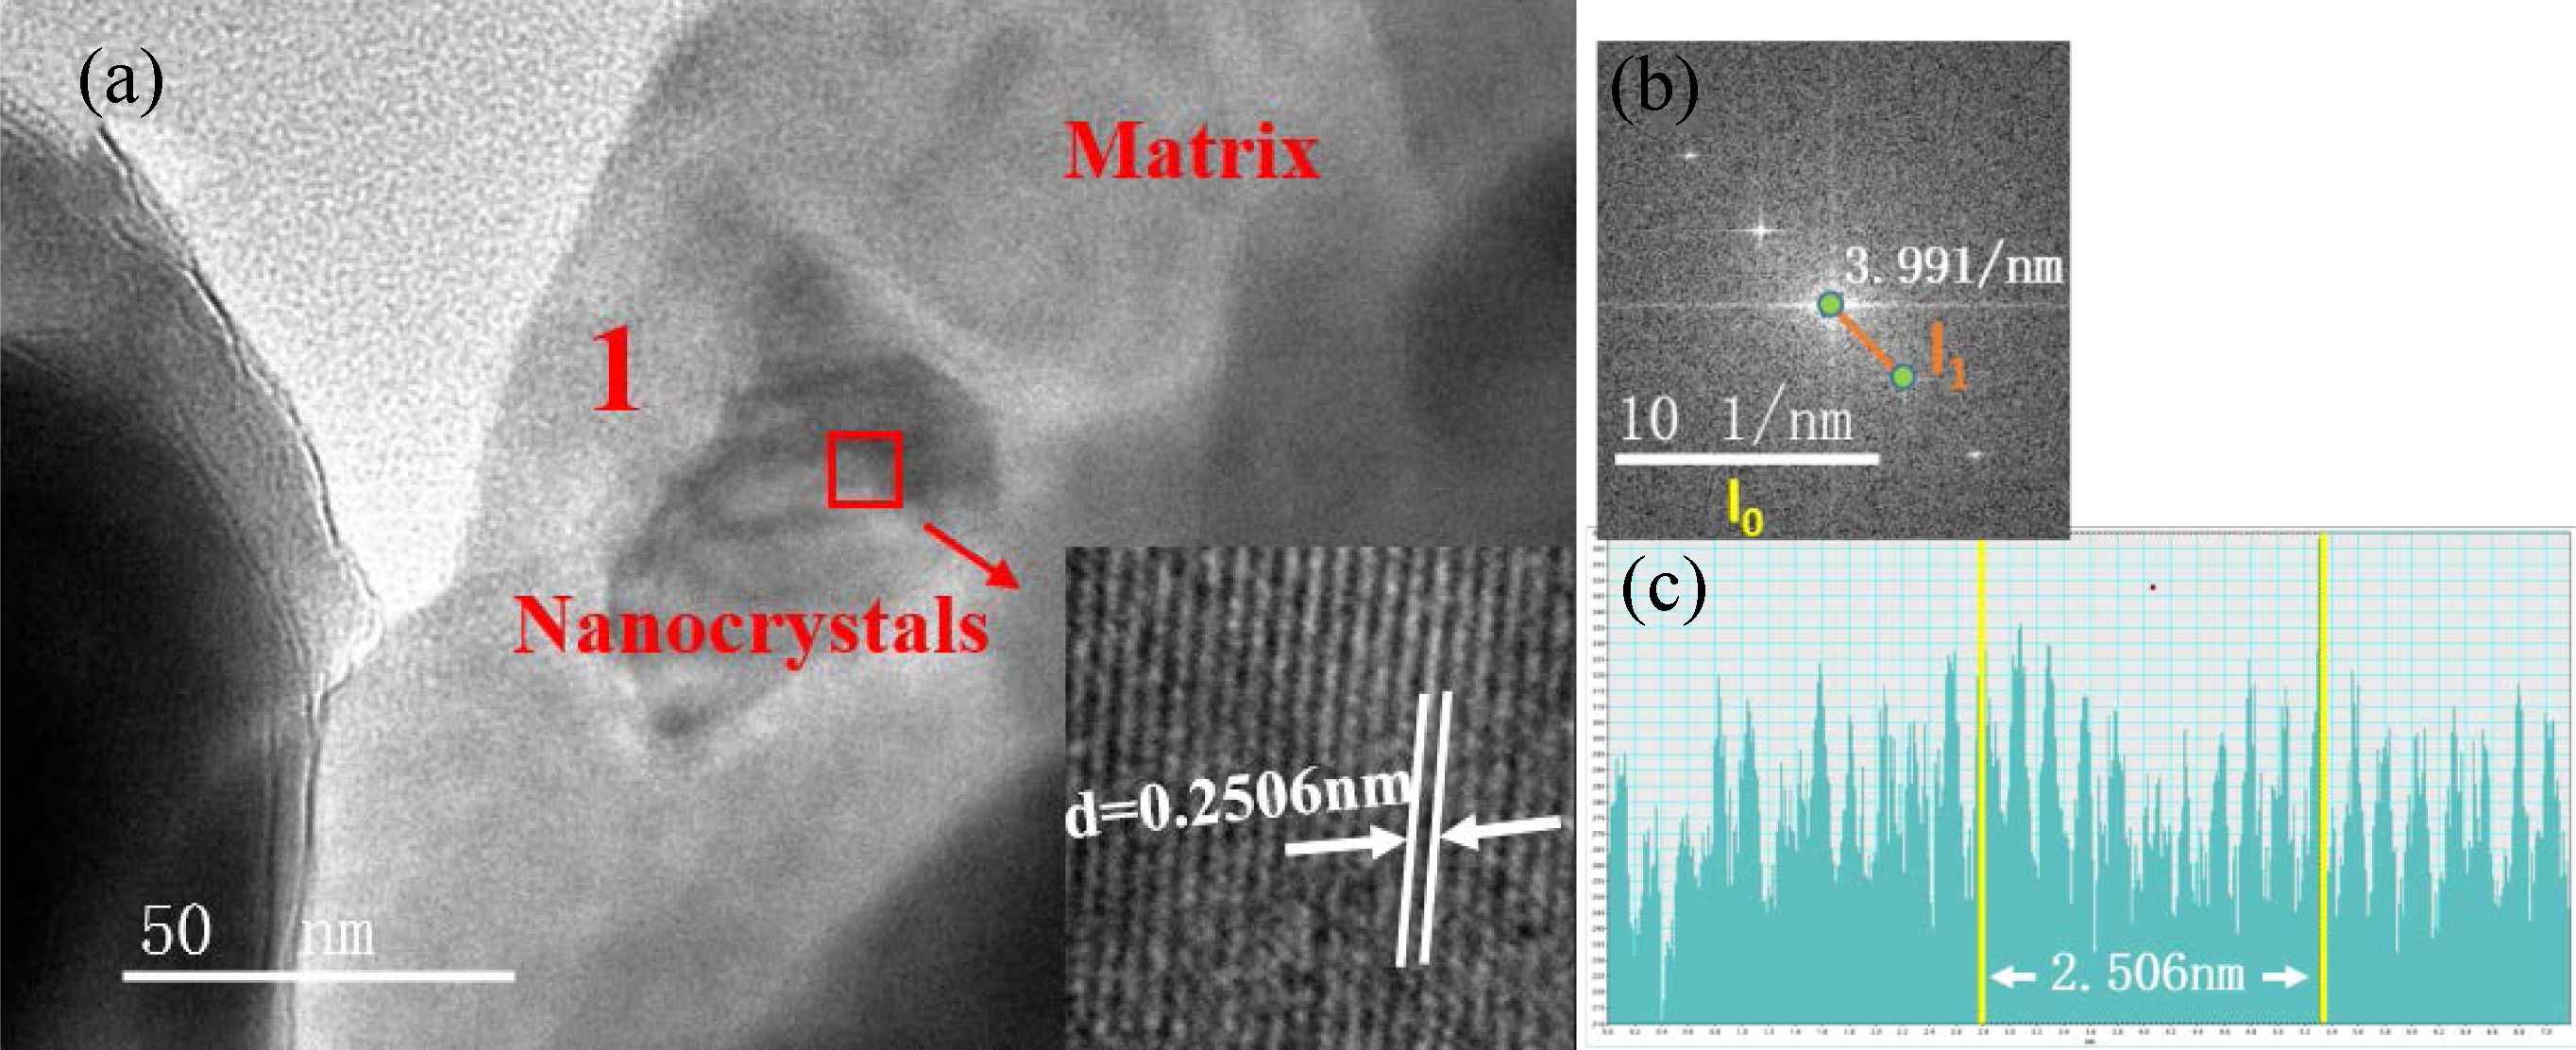
Fig. 6(a) shows the TEM bright-field image of the S4 nucleation glass. We can observe from the image that the nanocrystals were precipitated in zones 1 and 2. Fig. 6(b) shows the HRTEM image of zone 1 in Fig. 6(a). Lattice fringes can clearly be observed in the nanocrystals in HRTEM, whereas the region without lattice fringes was an amorphous glass phase. The crystal lattice fringes of zones 1 and 2 shown in Fig. 6(a) were analyzed. The calibration results of the crystal plane spacing are shown in Figs. 7 and. 8. Fourier transform was applied to the HRTEM images of the crystals shown in Figs. 7(a) and 8(a) to obtain the diffraction patterns, as shown in Figs. 7(b) and 8(b). After the measurement, distance l1 from the diffraction spot to the diffraction center in the reciprocal lattice was obtained. The calculation formula for crystal plane spacing d is expressed as follows:
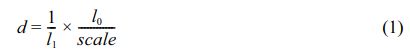
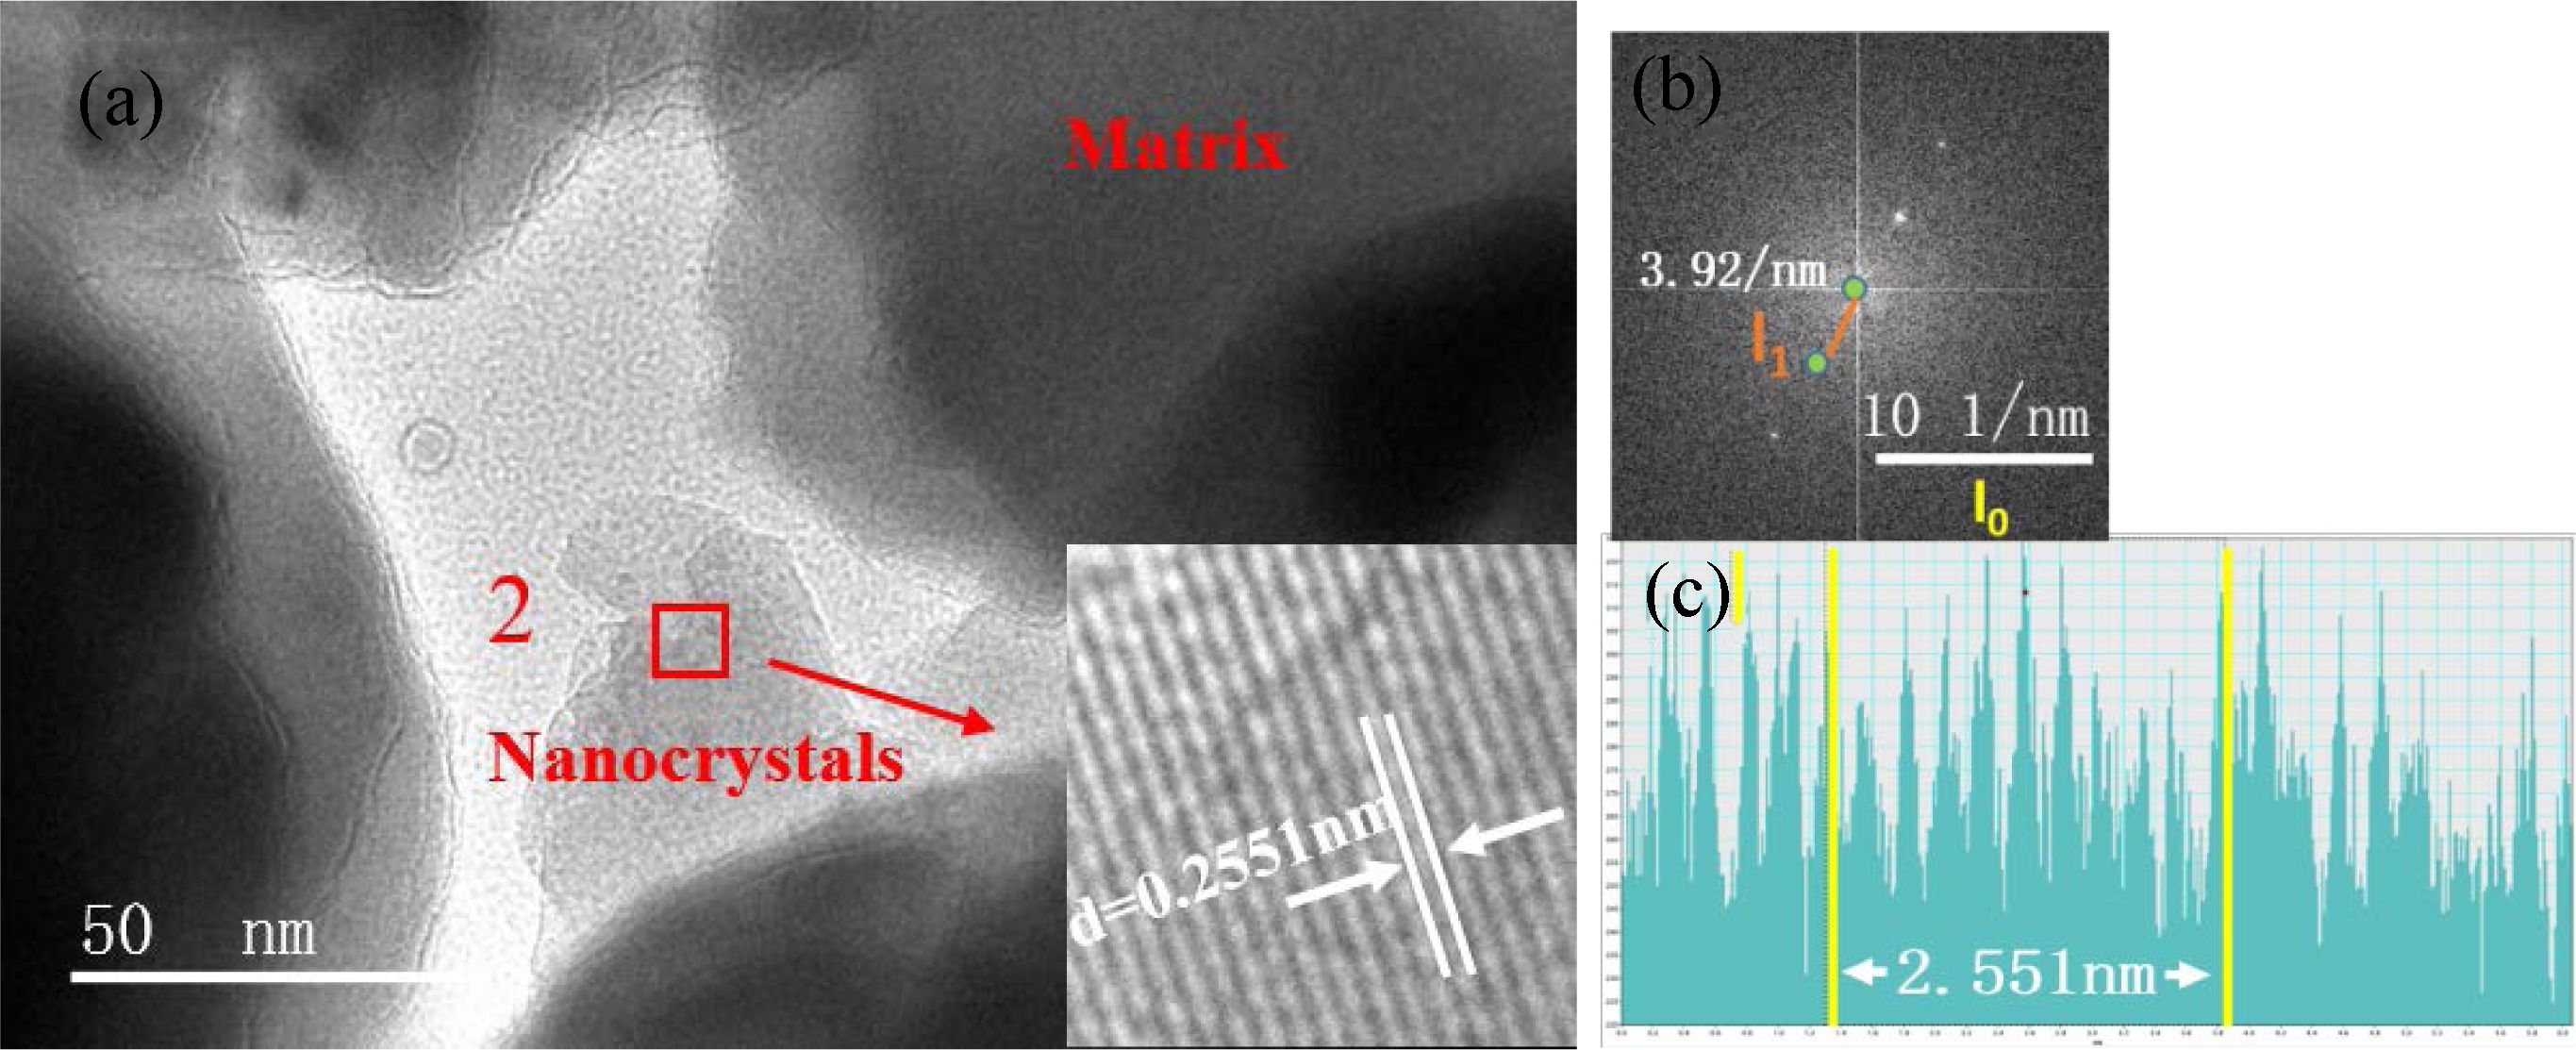
In Eq. (1), l0 is 10 nm−1, l1 represents the actual measured lengths shown in Figs. 7(b) and 8(b), which were 3.991 and 3.92 nm−1 respectively, and “scale” is 10 nm−1. According to Eq. (1), the crystal-plane-spacing values of the nanocrystals in zones 1 and 2 were 0.25056 and 0.25510 nm, respectively. To verify the accuracy of the calculation results, the calibration-diagram profile of the lattice stripes was measured and analyzed, and the results are shown in Figs. 7(c) and 8(c), which show that the measured results of the crystal plane spacing were 0.2506 and 0.2551 nm, respectively. We found that the calculation results were consistent with the measurement and analysis results of the calibration-diagram profile.
Based on the ICDD-PDF database, the plane spacing of the crystal in zone 1 (Fig. 7) corresponded to the (3 1 1) crystal plane of MgCr2O4 (PDF#: 77-0007), indicating that the nanocrystal phase in zone 1 was MgCr2O4. Fig. 8 shows that the crystal plane spacing in zone 2 was 0.2551 nm, which corresponded to the (3 1 1) crystal plane of FeCr2O4 (PDF#: 24-0511), indicating that the nanocrystal phase in zone 2 was FeCr2O4. The TEM results showed that in the nucleation stage of the glass–ceramics, the nanocrystals were Mg–Cr and Fe–Cr spinels.
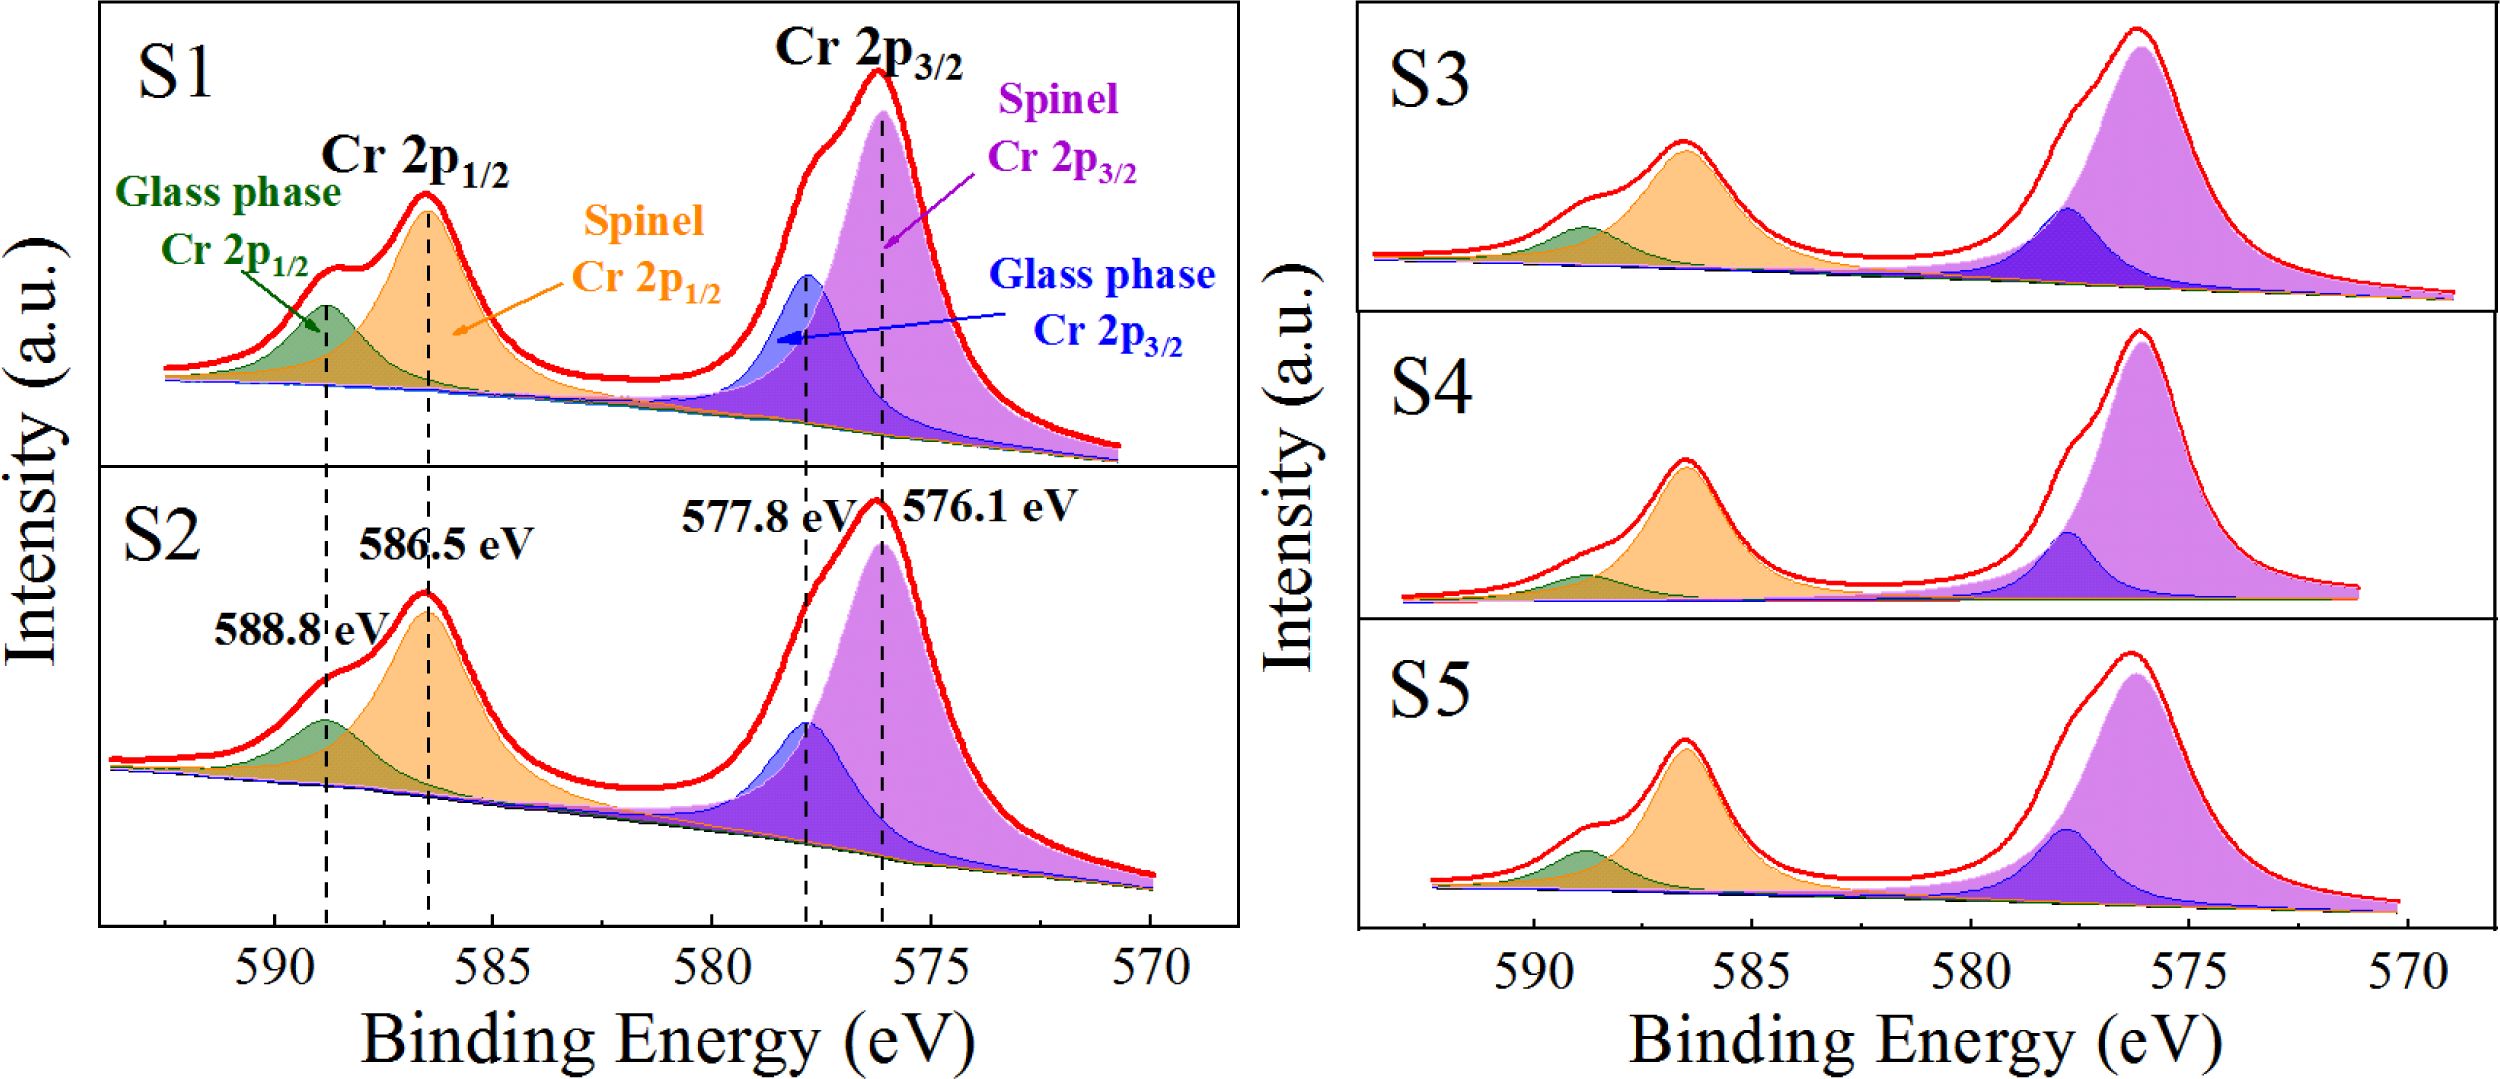
The chemical state of Cr3+ in the S1–S5 nucleation glass was analyzed using XPS, and the effect of the different MgO contents on the occurrence and distribution of Cr in the Cr spinel and glass phase was investigated. Dïngkun et al. [40] found that because of the different ligands of Cr3+ in glass, isolated Cr3+ ions and exchange-coupled Cr3+ pairs that formed Cr spinel changed the linear width and symmetry of resonance to different degrees, which resulted in different ESR spectral signals. In the nucleation stage in the present study, we considered that Cr3+ existed as exchange-coupled Cr3+ pairs in the Cr-spinel crystals and free Cr3+ ions in the glass matrix. The binding energy of Cr3+ was different in the two different chemical environments.
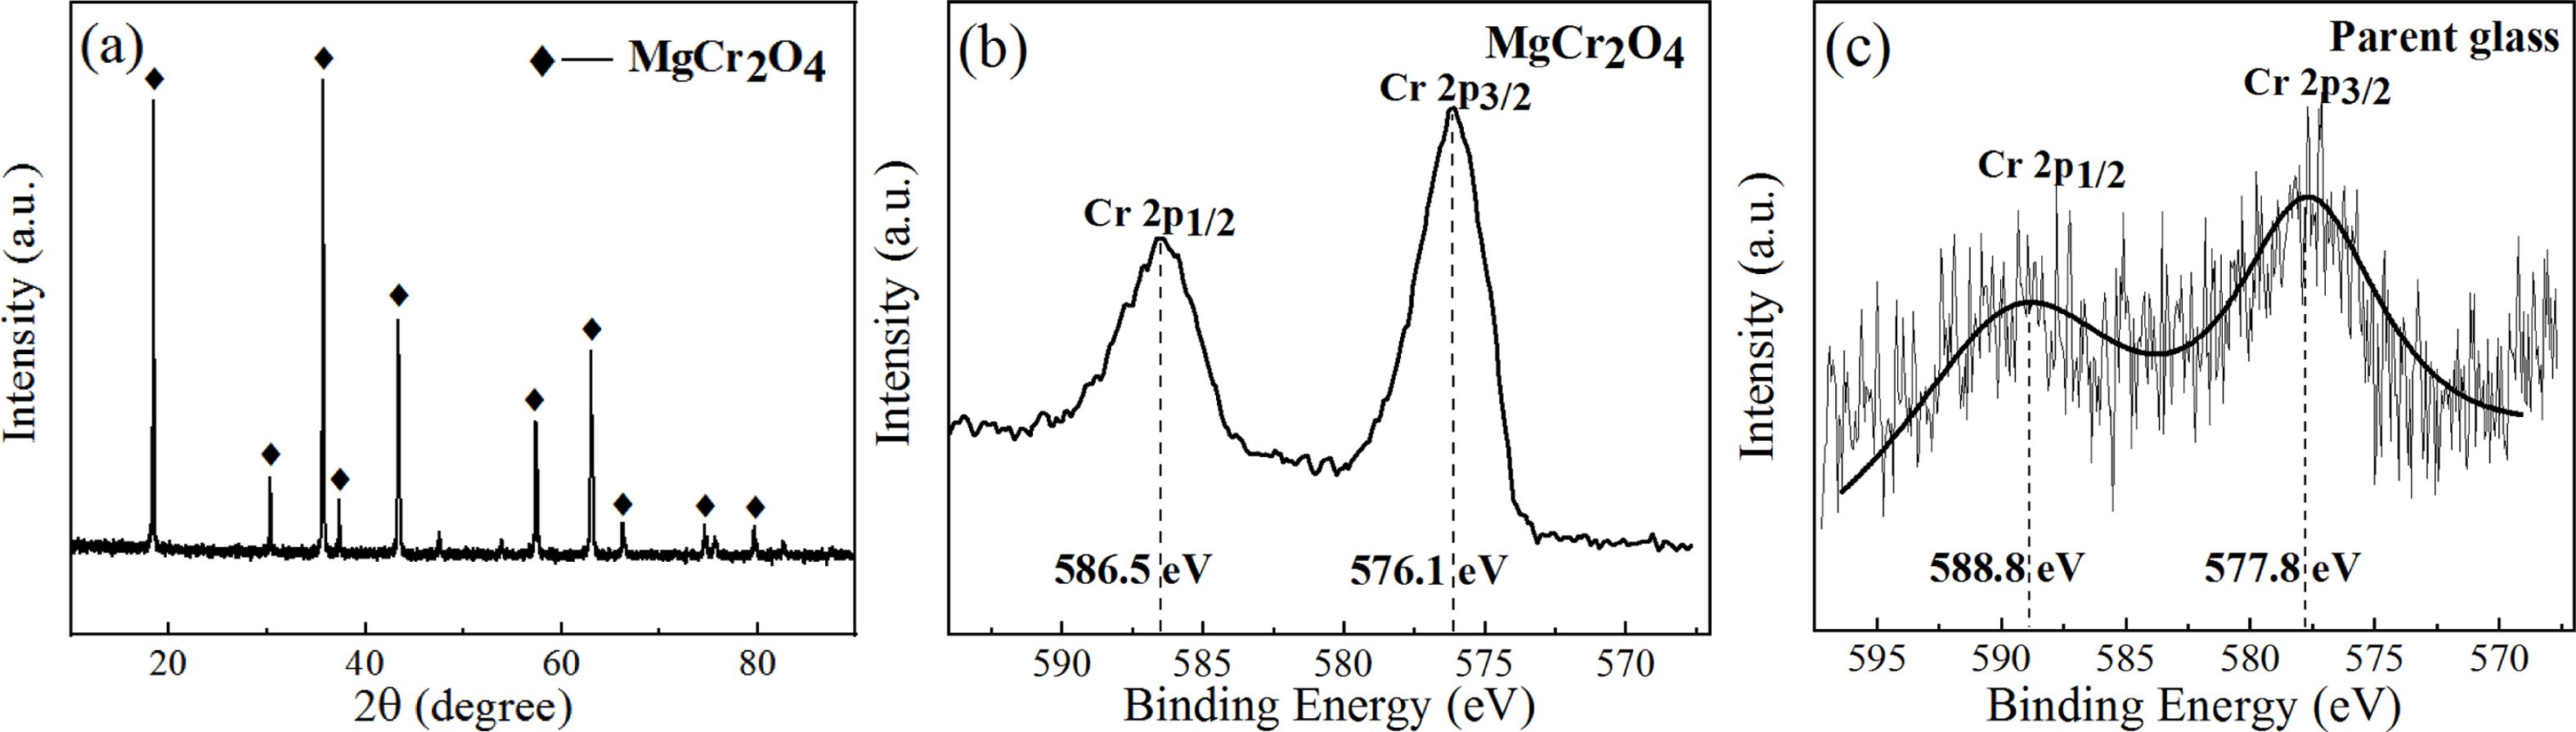
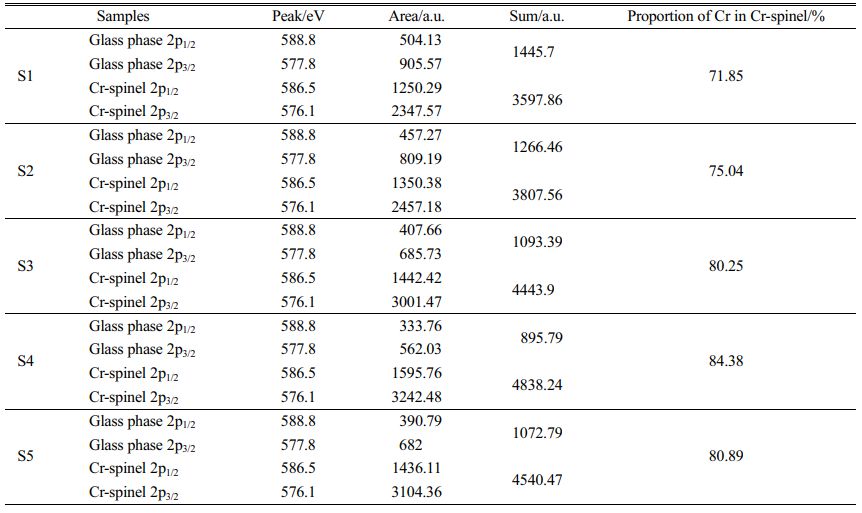
On the basis of the XPS electron binding-energy spectrum of Cr ion in the Mg–Cr spinel and parent glass, the XPS electron energy spectrum of Cr in the S1–S5 nucleation glass was fitted and divided into peaks, and the peak area was integrated. The area ratio of the fitting peak represented the percentage of Cr in the spinel crystal and glass phase to explore the distribution behavior of Cr in the spinel crystal and glass phase. In this study, pure MgCr2O4 was first synthesized. The phase XRD test results are shown in Fig. 9(a), and the XPS test results of Cr in pure MgCr2O4 and S4 parent glass are shown in Figs. 9(b) and (c).
Fig. 9(a) shows that only the diffraction peak of MgCr2O4 was present in the spectrum without other impurities, which indicated that pure MgCr2O4 was synthesized. Figs. 9(b) and (c) show that the binding-energy values of 2p1/2 and 2p3/2 of Cr in MgCr2O4 were 586.5 and 576.1 eV, respectively. The binding-energy values of 2p1/2 and 2p3/2 of Cr in the S4 parent glass were 588.8 and 577.8 eV, respectively. The XPS electron spectrum peak-splitting results of Cr in the S1–S5 nucleation glass are shown in Fig. 10 and Table 3. The list in Table 3 illustrates that with the increase in the MgO content, the proportion of Cr in the form of Cr spinel in the total Cr first gradually increased and then decreased. When the MgO content was 12.3 wt.%, the proportion was 84.38 wt.%, which reached the maximum value. This result was consistent with the trend in the SEM analysis. The XPS results demon- strated that in the nucleation stage of the glass–ceramics, an increase in added MgO could promote migration of Cr in the glass phase to Cr spinel; thus, more Cr existed in the finely dispersed Cr-spinel crystals.
Effect of MgO on the migration behavior and occurrence distribution of Cr in the crystallization stage
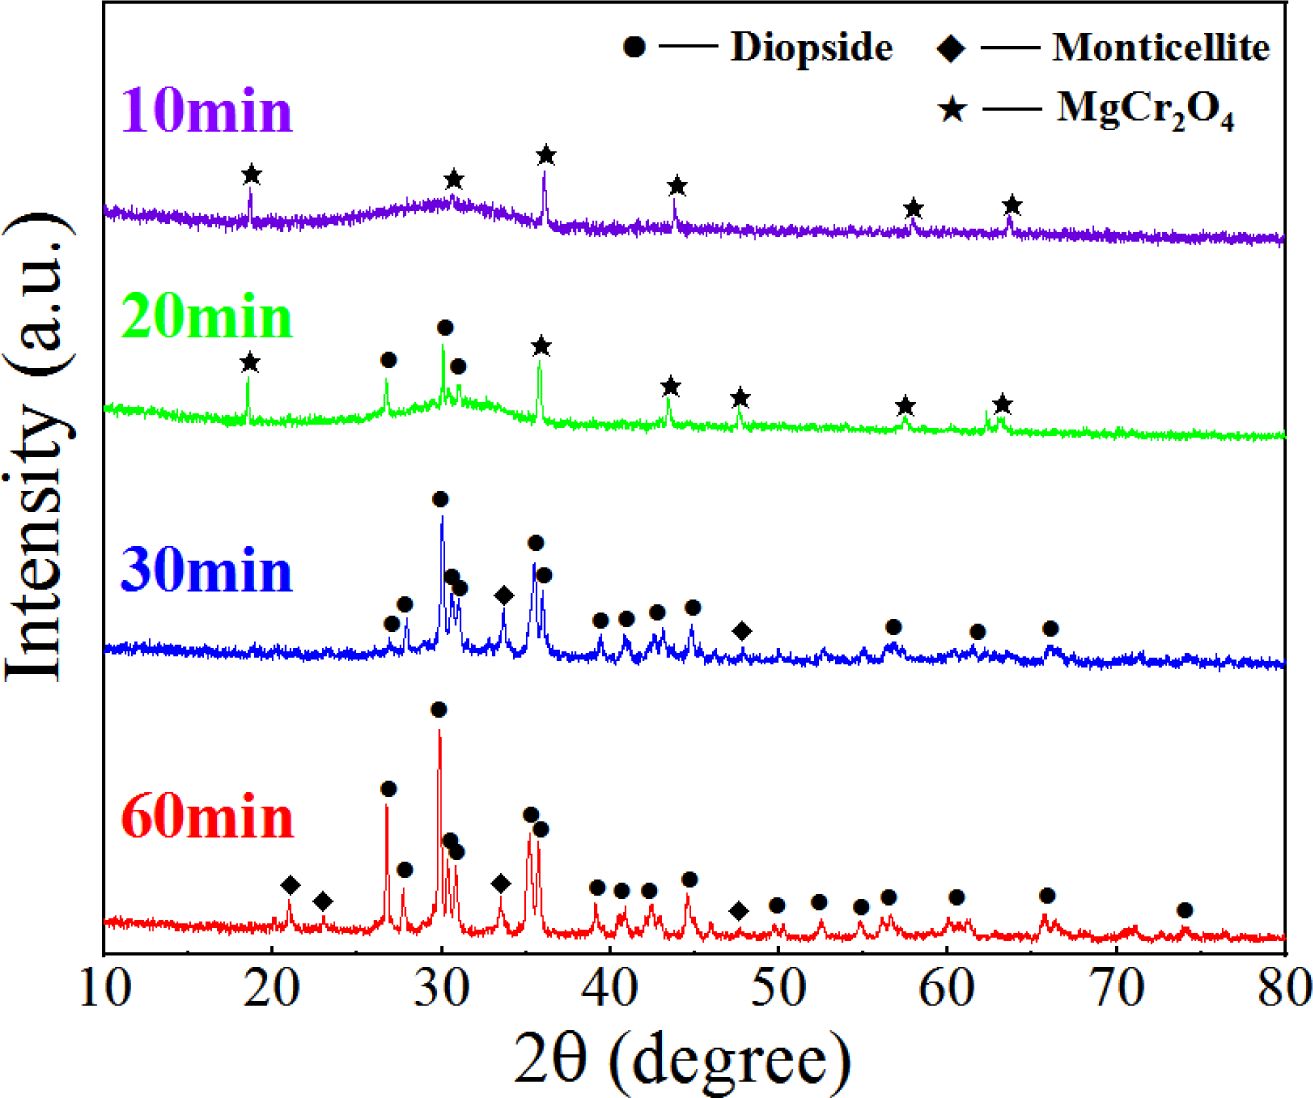
We considered the S4 sample as an example. Four S4 nucleation glasses were kept at 860 °C for 10, 20, 30, and 60 min. The heated glass samples were investigated using XRD (Fig. 11). The phase transformation pattern of the nanospinel in the glass at different crystallization times was investigated, and the migration behavior of the Cr element in the crystallization stage was analyzed.
Fig. 11 shows that when the glass was crystallized for 10 min, a small diffraction peak of MgCr2O4 appeared in the diffraction pattern, which indicated that the nanograins formed in the nucleation stage were mainly MgCr2O4. After the 20-min crystallization, a diopside crystal phase was formed, and MgCr2O4 still existed. After the 30-min crystallization, MgCr2O4 disappeared in the XRD pattern, and only the diopside crystalline phase remained. After the 60-min crystallization, the type of crystal phase in the glass was consistent with that of the 30-min crystallization, and the XRD intensity of the crystal increased, which indicated that the crystallization degree of the crystal at 60 min was higher than that at 30 min. The XRD results showed that because of the similar lattice constants of MgCr2O4 and diopside, the diopside nucleated and grew with MgCr2O4 as a heterogeneous core during the crystallization process.
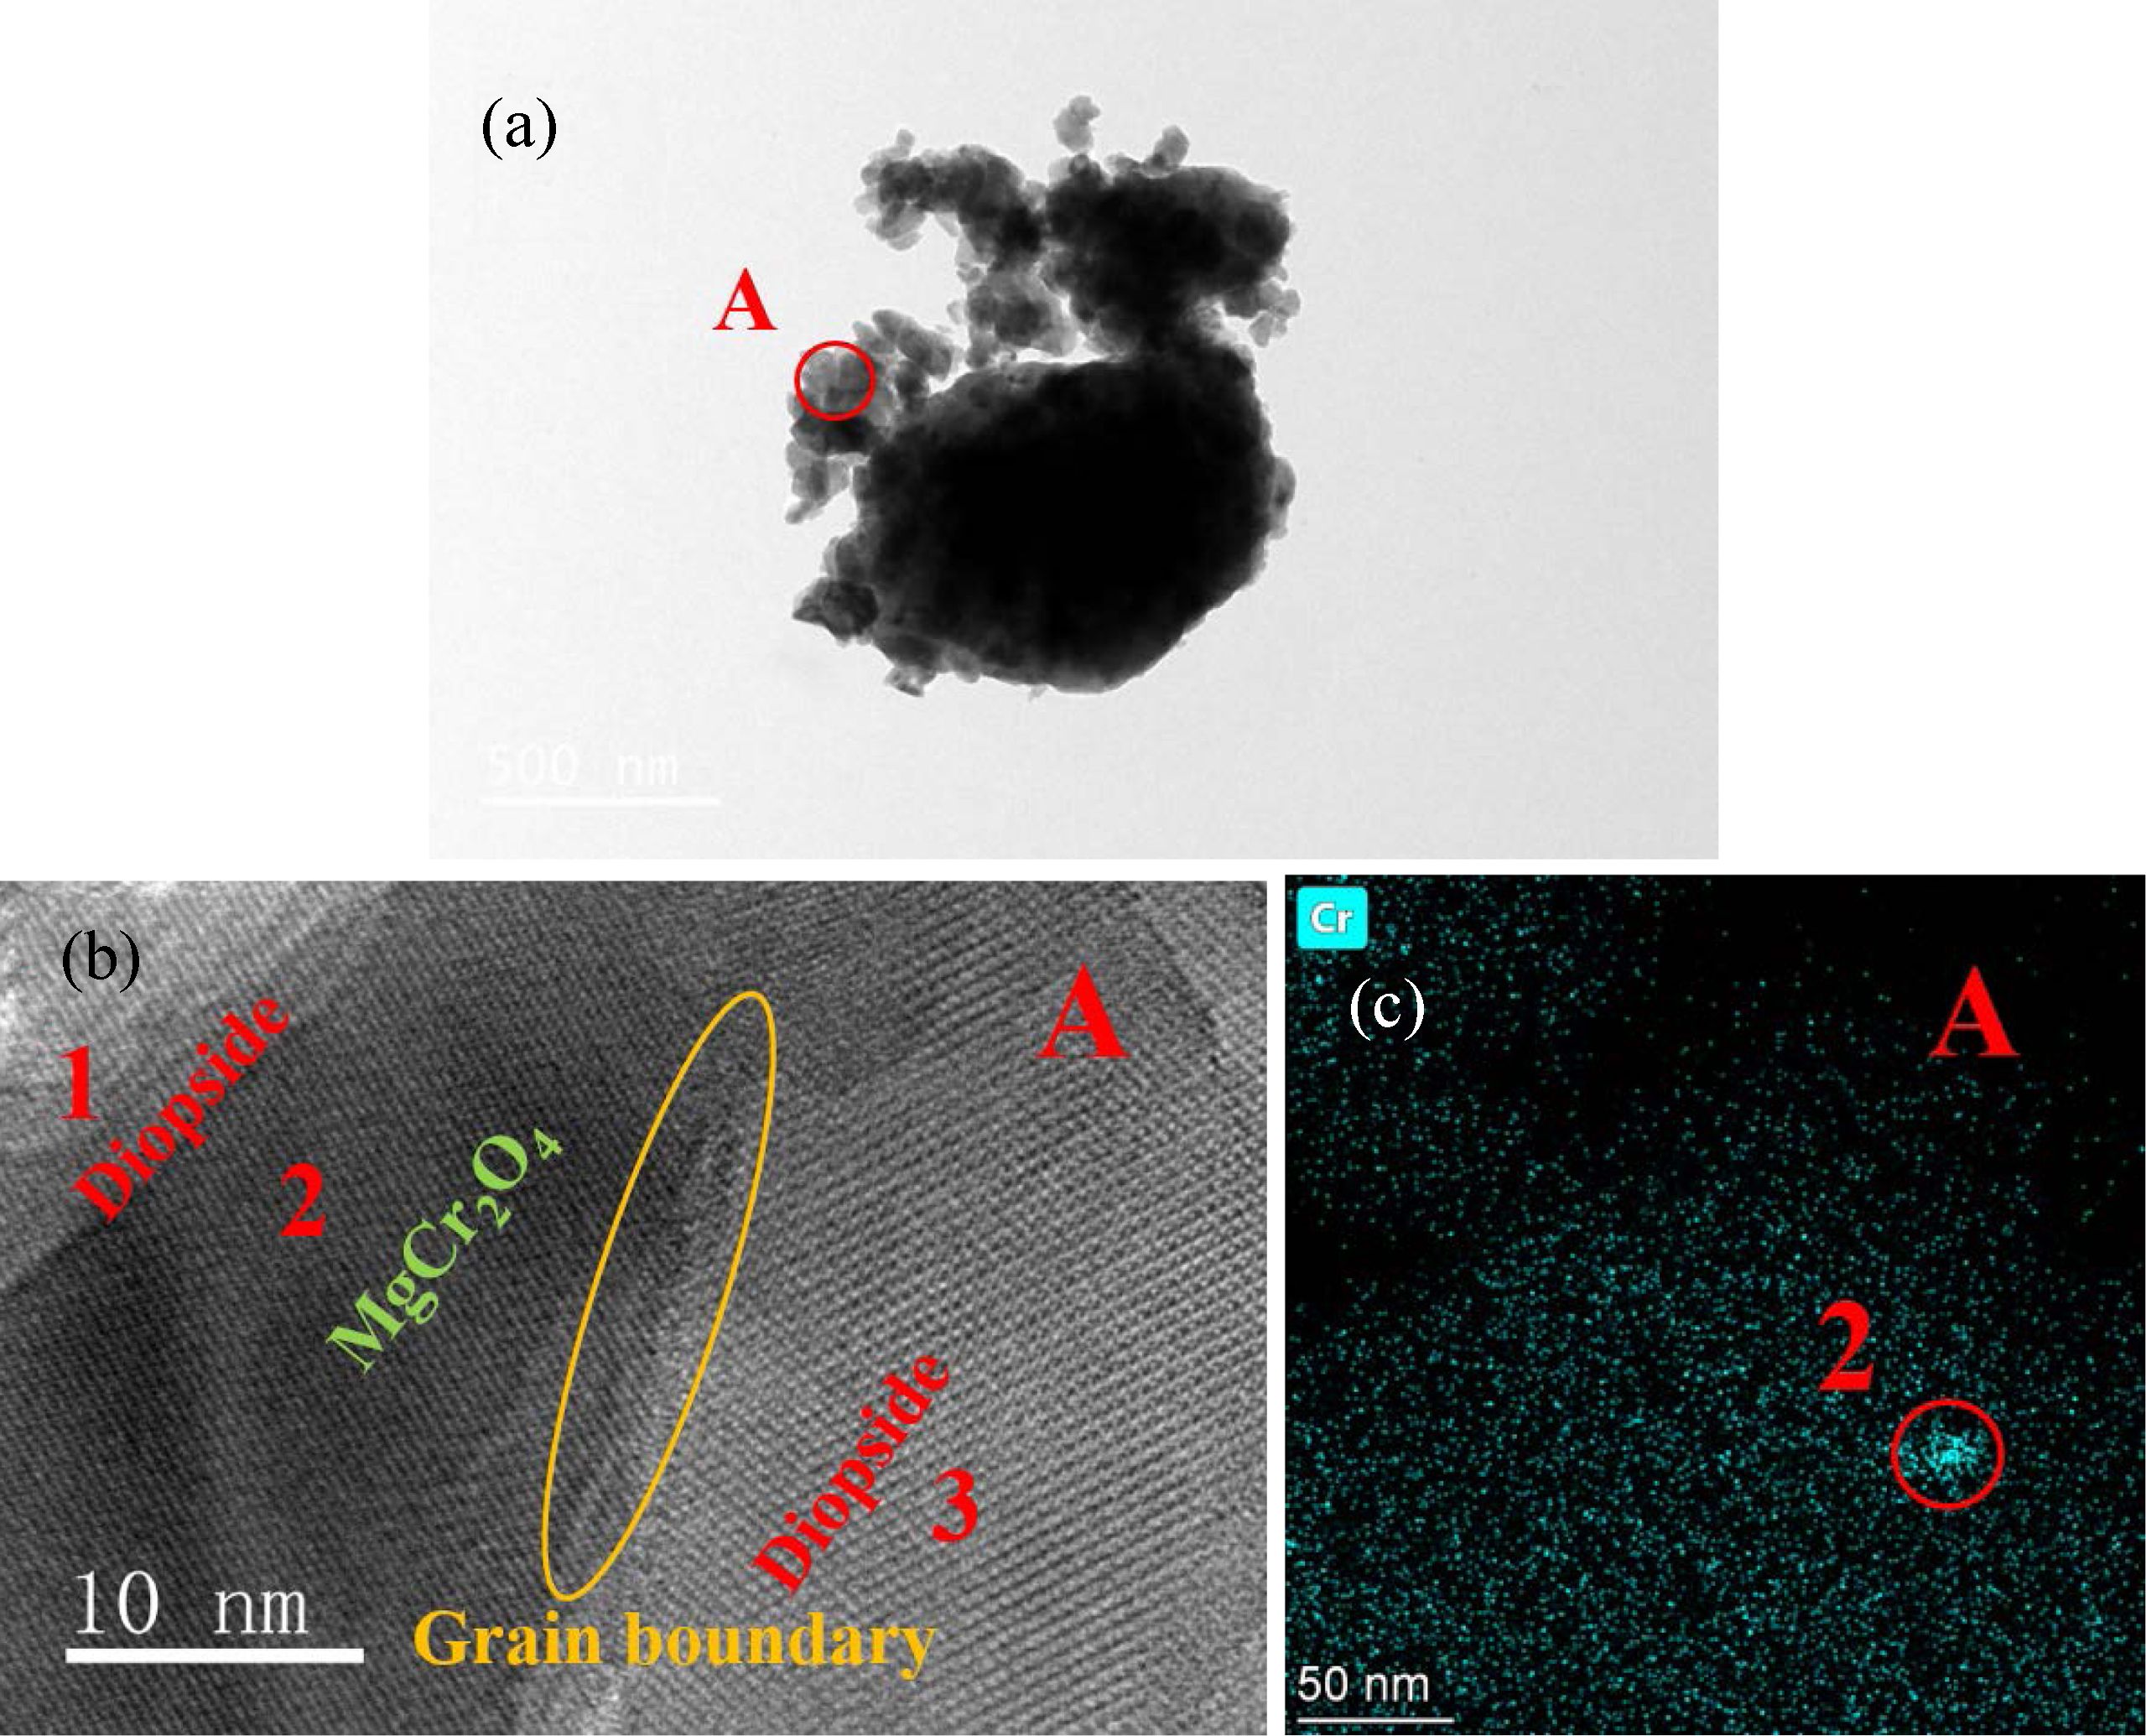
To explore the transformation relationship between the Cr spinel and diopside, the glass–ceramics crystallized for 2.5 h was investigated using TEM, and the result is shown in Fig. 12.
Fig. 12(a) shows the TEM image of the S4 glass–ceramics. Two different lattice fringes were observed in zone A with high resolution [Fig. 12(b)]. We calibrated the lattice fringes of the crystals in zones 1–3, as shown in Fig. 12(b), and found that all crystal-plane-spacing values of the crystals in zones 1 and 3 were 0.2993 nm. The crystal plane spacing corresponded to the (2 2 1) crystal plane of CaMgSi2O6 (PDF#: 78-1390), which indicated that the crystals in zones 1 and 3 were diopside. The crystal plane spacing in zone 2 was 0.2506 nm, which corresponded to the (3 1 1) crystal plane of MgCr2O4 (PDF#: 77-0007), indicating that the crystal in zone 2 was MgCr2O4. Fig. 11 shows that after 30 min of crystallization, the spinel dis- appeared, and only the diopside crystal phase existed. Meanwhile, the crystal in zone 2 shown in Fig. 12(b) was MgCr2O4, which indicated that when the diopside grew with MgCr2O4 as the core, some Cr-spinel crystal structures were not damaged and were wrapped by the diopside.
A TEM-mapping test was performed on the Cr element in zone A, and the result is shown in Fig. 12(c). Fig. 12(c) shows that the Cr distribution in zone 2 was relatively concentrated, which was a Mg–Cr spinel wrapped by diopside. The distribution of Cr around zone 2 was relatively dispersed, which could be considered as Cr diffused into a diopside lattice. The TEM analysis showed that in the crystallization stage of the glass–ceramics, when diopside was formed with the Cr spinel as the core during the extension of the crystallization time, part of the crystal structure of the Cr spinel was destroyed, and the components were integrated into the diopside crystal. Some Cr spinel remained preserved and wrapped in diopside.
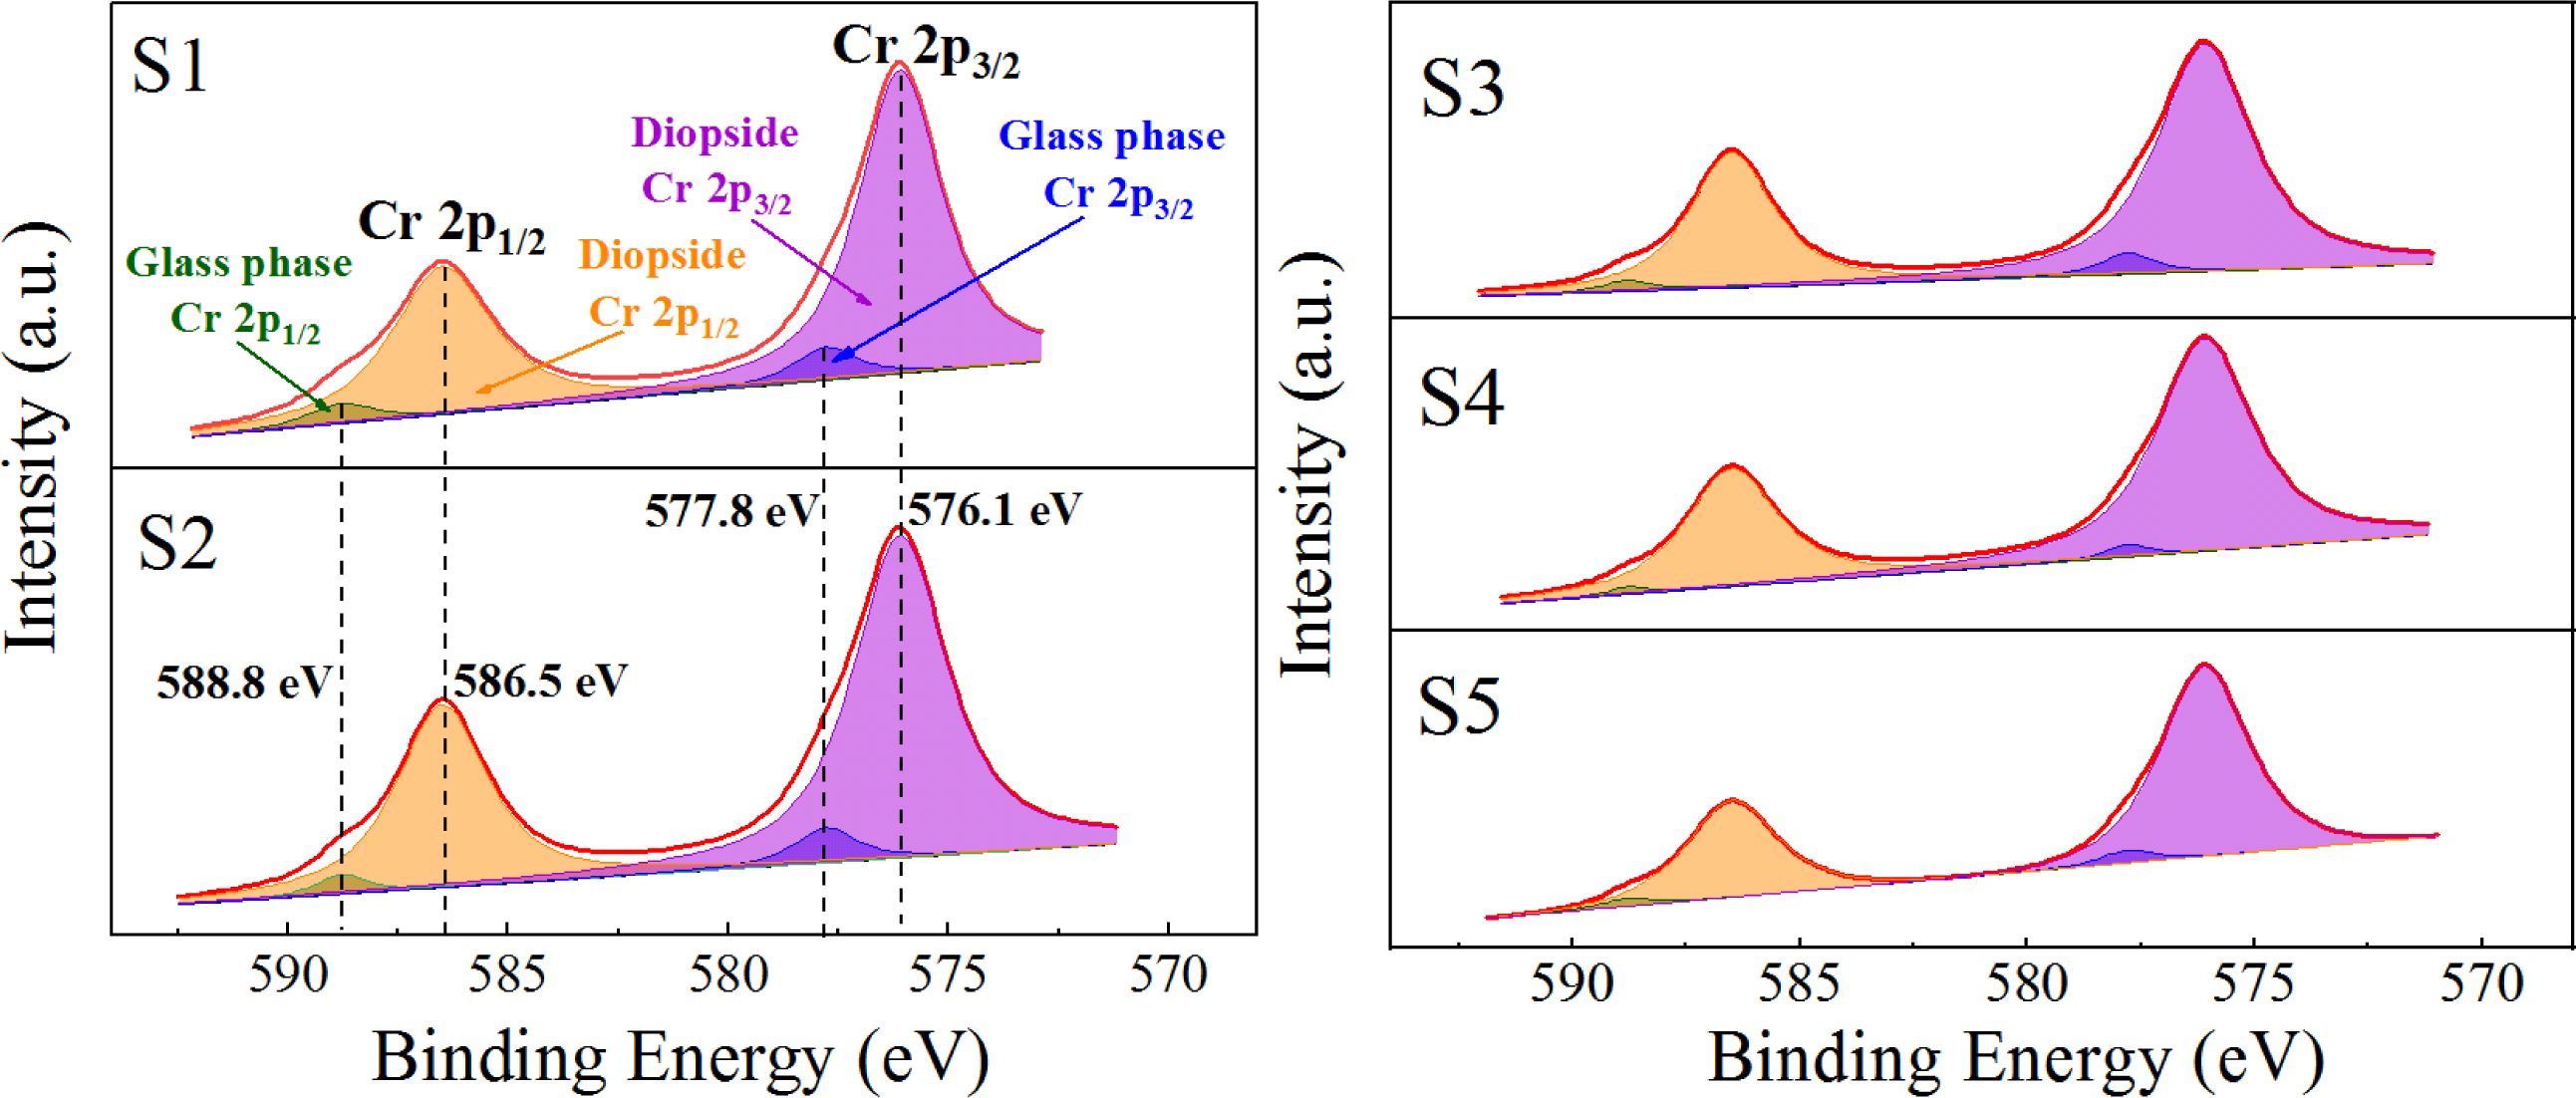
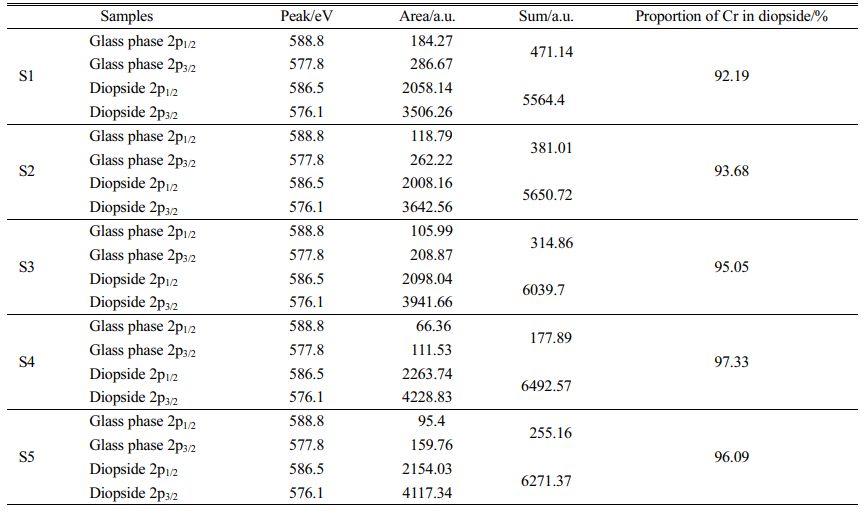
The chemical state of Cr in the S1–S5 glass–ceramics was detected using XPS, and the occurrence and distribution of Cr in the crystalline and glass phases with different MgO contents were analyzed. The results are shown in Fig. 13 and Table 4. Fig. 13 and Table 4 show that with increasing MgO content, Cr in the diopside crystal phase initially increased and then decreased. When MgO was added at 12.3 wt.%, the Cr content in the diopside was the largest, which accounted for 97.33 wt.% of the total Cr. This result also indicated that in the crystallization process of the nucleation glass, the glass phase gradually decreased and Cr in the glass phase gradually diffused and migrated to the diopside phase with the growth of the diopside crystal phase. From the nucleation to the crystallization stage, the amount of Cr in spinel nanocrystals in the diopside phase increased from 84.38 wt.% to 97.33 wt.%.
Mechanical properties and Cr curing effect of glass–ceramics
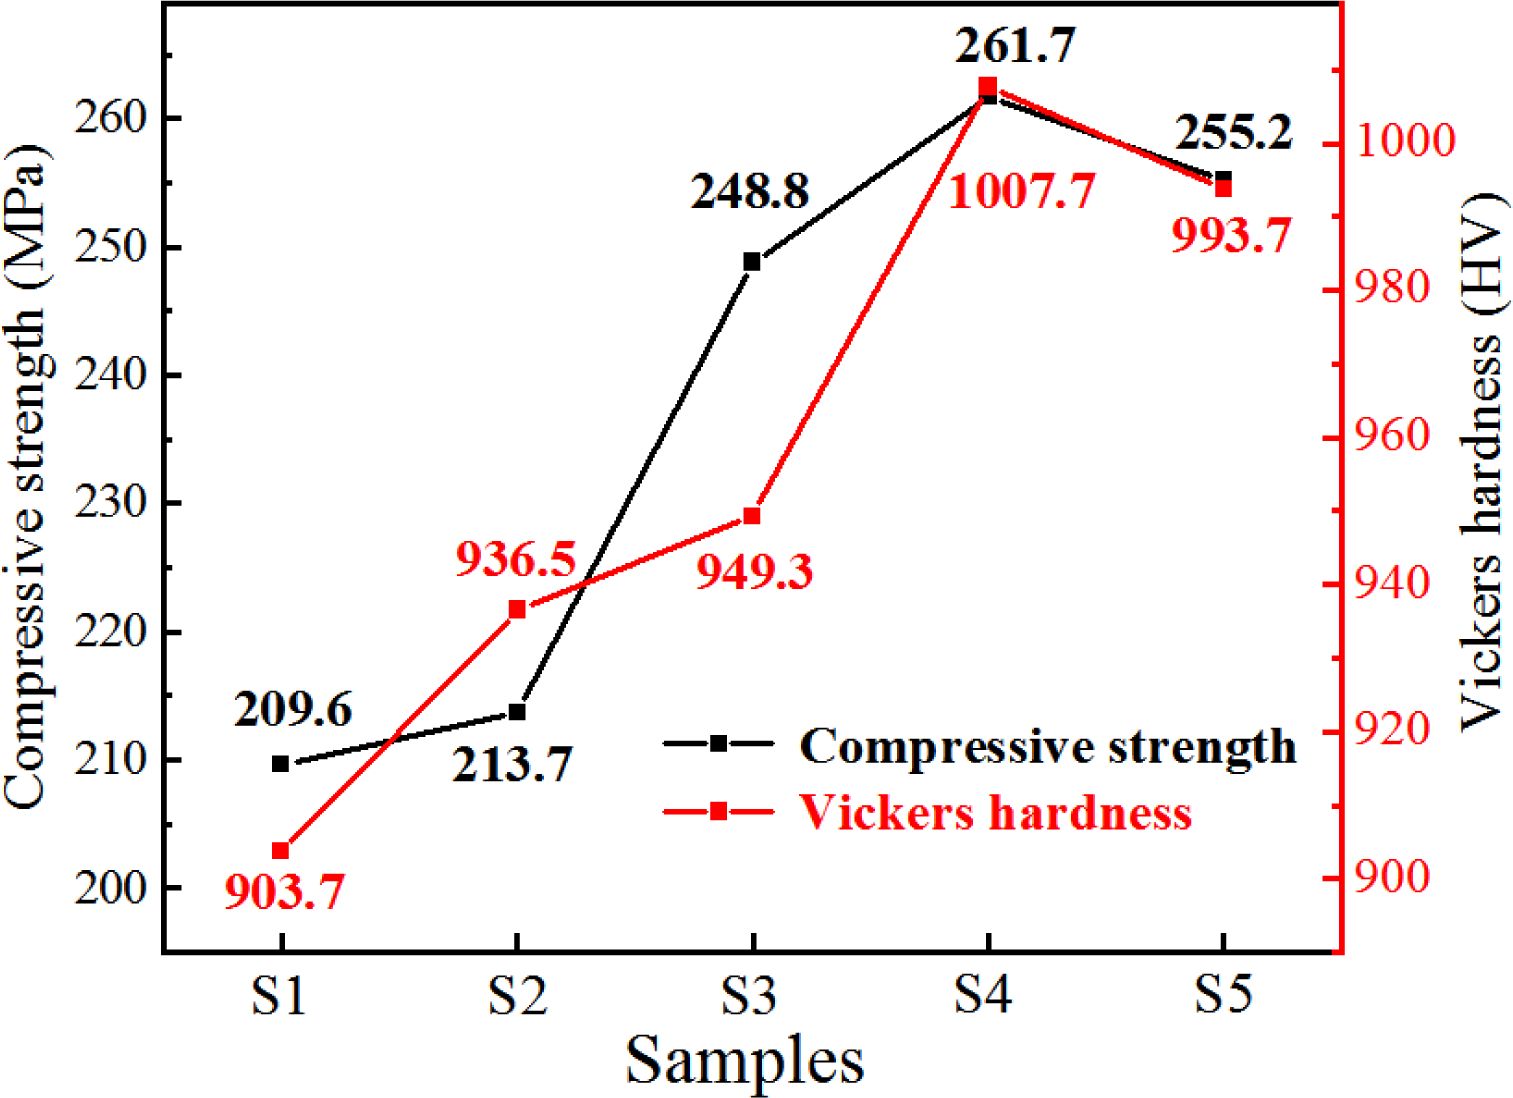
The compressive strength and Vickers hardness of the S1–S5 glass–ceramics were tested to investigate their mechanical properties. The results are shown in Fig. 14, which shows that when the MgO content was 12.3 wt.%, the compressive strength was 261.7 MPa, the Vickers hardness was 1007.7 HV, and the mechanical properties of the glass–ceramics were the best.
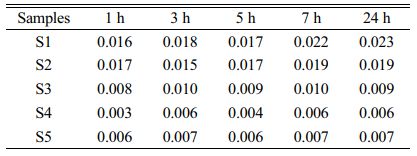
Toxicity-leaching experiments of the S1–S5 glass–ceramics were carried out for 1, 3, 5, 7, and 24 h to investigate the Cr-fixation effect of the glass–ceramics. The Cr-ion concentration in the leaching solution was detected using ICP, and the results are listed in Table 5.
The list in Table 5 shows that when the leaching time was extended, the Cr leaching concentration increased and tended to stabilized at 24 h. When the MgO content was 12.3 wt.%, the lowest Cr leaching concentration of the glass–ceramics was only 0.006 mg/L, which indicated that the glass–ceramics prepared in this study has achieved a good Cr-fixation effect.
|
Fig. 1 (a) CTE and (b) DSC curves of the S1–S5 parent glass. |
|
Fig. 2 SEM images of the different amounts of added MgO. |
|
Fig. 3 XRD diffraction pattern of the S1–S5 nucleation glass |
|
Fig. 4 XRD spectrum of the glass–ceramics with different MgO contents |
|
Fig. 5 SEM image of the glass–ceramics with different MgO contents. |
|
Fig. 6 (a) TEM and (b) HRTEM images of the S4 nucleation glass sample. |
|
Fig. 7 (a) MgCr2O4 nanocrystals in the S4 nucleation glass. (b) Fourier-transform diffraction pattern. (c) Profile of the calibration diagram. |
|
Fig. 8 (a) FeCr2O4 nanocrystals in the S4 nucleation glass. (b) Fourier-transform diffraction pattern. (c) Profile of the calibration diagram. |
|
Fig. 9 (a) XRD spectrum of pure MgCr2O4. (b) Electron binding-energy spectrum of Cr in MgCr2O4. (c) Electron binding-energy spectrum of Cr in the parent glass. |
|
Fig. 10 XPS fitting peak-splitting spectrum of Cr in the S1–S5 nucleation glass. |
|
Fig. 11 XRD patterns of the S4 glass–ceramics crystallized for 10, 20, 30, and 60 min. |
|
Fig. 12 (a) TEM image of the S4 glass–ceramics. (b) HRTEM image in zone A. (c) TEM-mapping diagram of Cr in zone A |
|
Fig. 13 XPS fitting peak-splitting spectrum of Cr in the S1–S5 glass–ceramics. |
|
Fig. 14 Test of compressive strength and Vickers hardness of the S1–S5 glass–ceramics. |
|
Table 3 Proportion of the Cr distribution in the Cr spinel/glass phase to the total Cr content in the S1–S5 nucleation glass. |
|
Table 4 Proportion of the Cr distribution in the diopside/glass phase to the total Cr content in the S1–S5 glass–ceramics |
|
Table 5 Leaching concentration of Cr in the S1–S5 glass– ceramics at different times (mg/L). |
In this study, glass–ceramics were prepared from stainless-steel slag. The MgO content on the occurrence, distribution, and migration of Cr in the nucleation and crystallization stages of the glass–ceramics were systematically studied, and the mechanical properties and Cr-fixation effect of the glass–ceramics were verified. The conclusions are enumerated as follows.
(1) Stainless-steel slag (60 wt.%) was used as the main raw material to prepare glass–ceramics. In the nucleation stage of the glass–ceramics, Cr mainly existed in the forms of MgCr2O4 and FeCr2O4 nano- crystals and the glass phase. When the MgO content was increased, the number of Cr-spinel grains that were precipitated in the glass gradually increased, and Cr in the glass phase gradually migrated to the spinel. When the MgO content was 12.3 wt.%, the amount of Cr spinel was the largest and the Cr content in the Cr spinel accounted for 84.38 wt.% of the total Cr.
(2) From the nucleation to the crystallization stage, Cr spinel as nuclei gradually generated the diopside with increasing crystallization time. The TEM analysis demonstrated that during the transformation from the Cr spinel to diopside, some of the crystal structures of the Cr spinel were destroyed and the components were integrated into the diopside crystal. Some Cr spinels remained preserved and wrapped in the diopside.
(3) In the crystallization stage, the amount of generated diopside increased with the increase in the MgO content. Cr that existed in the glass phase gradually diffused and migrated to the diopside phase, and the occurrence and distribution of the Cr content in the diopside phase accordingly increased. When the MgO content was 12.3 wt.%, the diopside grains generated in the glass–ceramics became fine, the number was the largest, and the occurrence of Cr was mostly distributed in the diopside phase, which accounted for 97.33 wt.% of the total Cr.
(4) By adjusting the MgO content, glass–ceramics realized good mechanical properties and Cr-fixation effect. When the MgO content was 12.3 wt.%, its compressive strength was 261.7 MPa, the Vickers hard- ness was 1007.7 HV, and the Cr leaching concentration was 0.006 mg/L.
This work was supported by the National Natural Science Foundation of China (No. 52064019), and the Key Fund of Jiangxi Provincial Department of Science and Technology (No. 2019ACBL20015).
- 1. A. Zaffora, F.D. Franco, and M. Santamaria, Curr. Opin. Electrochem. 29 (2021) 100760.
-

- 2. F.-Q. Gu, Y.-B. Zhang, Z.-J. Su, Y.-K. Tu, S. Liu, and T. Jiang, J. Clean. Prod. 296 (2021) 126467.
-
- 3. K.D. Ramkumar, A. Singh, S. Raghuvanshi, A. Bajpai, T. Solanki, M. Arivarasu, N. Arivazhagan, and S. Narayanan, J. Manu. Process. 19 (2015) 212-232.
-
- 4. G.-Y. Wang, Y.-S. Du, J. Ma, H.-X. Zhang, S.-L. Ou Yang, L.-B. Deng, C. Chen, and M. Zhao, J. Ceram. Process. Res. 22 (2021) 665-674.
-
- 5. C.-Z. Liao, Y.-Y. Tang, C.-S. Liu, K. Shih, and F.-B. Li, J. Hazard. Mater. 311 (2016) 246-253.
-
- 6. U. Bulut, A. Ozverdi, and M. Erdem, J. Hazard. Mater. 162 (2009) 893-898.
-
- 7. K.-Y. Chen, Y. Li, X.-Y. Meng, L. Meng, and Z.-C. Guo, Ceram. Int. 45 (2019) 24236-24243.
-
- 8. C.-H. Li, W. Zhao, J.-L. Zhang, W. Lu, P. Li, B.-J. Yan, and H.-W. Guo, J. Ceram. Process. Res. 22 (2021) 409-420.
-
- 9. H.-X. Lu, M. He, Y.-Y. Liu, J.-F. Guo, L.-W. Zhang, D.-L. Chen, H.-L. Wang, H.-L. Xun, and R. Zhang, J. Ceram. Process. Res. 12 (2011) 588-591.
-
- 10. M. Erol, S. Küçükbayrak, and A. Ersoy-Meriçboyu, Chem. Eng. J. 132 (2007) 335-343.
-
- 11. H.-T. Gao, X.-H. Liu, J.-Q. Chen, J.-L. Qi, Y.-B. Wang, and Z.-R. Ai, Ceram. Int. 44 (2018) 6044-6053.
-
- 12. V.O. Soares, F.C. Serbena, G.S. Oliveira, C. Cruz, R.F. Muniz, and E.D. Zanotto, Ceram. Int. 47 (2021) 4707-4714.
-
- 13. C.Y. Pack, S.D. Yoon, and Y.H. Yun, J. Ceram. Process. Res. 8 (2007) 435-439.
-
- 14. S.D. Yoon and Y.H. Yun, J. Ceram. Process. Res. 9 (2008) 135-139.
-
- 15. M.J. Cattell, C. Patzig, S. Bissasu, A. Tsoutsos, and N. Karpukhina, Dent. Mater. 36 (2020) 592-602.
-
- 16. Z.-J. Wang and I. Sohn, Ceram. Int. 46 (2020) 903-912.
-
- 17. S.-Y. Liu, Y.-X. Chen, S.-L. Ouyang, H.-R. Li, X. Li, and B.-W. Li, Ceram. Int. 47 (2021) 1284-1293.
-
- 18. R.-X. Li, Q. Zhang, X.-L. Peng, and W.-Z. Liu, J. Ceram. Process. Res. 21 (2020) 86-91.
-
- 19. W. Dang and H.-Y. He, J. Ceram. Process. Res. 21 (2020) 69-74.
-
- 20. J. Temuujin, U. Bayarzul, E. Surenjav, K.D. Sung, and C.Y. Sik, J. Ceram. Process. Res. 18 (2017) 112-115.
-
- 21. S.-L. Ouyang, Y.-X. Zhang, Y.-X. Chen, Z.-W. Zhao, M. Wen, B.-W. Li, Y. Shi, M.-Z. Zhang, and S.-L. Liu, Sci. Rep. 9 (2019) 1964.
-
- 22. S.-G. Zhang, J. Yang, B. Liu, D.-A. Pan, C.-L. Wu, and A.A. Volinsky, J. Iron. Steel Res. Int. 23 (2016) 220-224.
-
- 23. S. Jang and S. Kang, Ceram. Int. 38 (2012) S543-S546.
-
- 24. L.-B. Deng, F. Yun, R.-D. Jia, H. Li, X.-L. Jia, Y. Shi, and X.-F. Zhang, Mater. Chem. Phys. 239 (2020) 122039.
-
- 25. S.M. Salman, S.N. Salama, H. Darwish, and E.A. Mahdy, Ceram. Int. 36 (2010) 55-61.
-
- 26. I.C.J. Dechandt, P. Soarea, M.J. Pascual, and F.C. Serbena, J. Eur. Ceram. Soc. 40 (2020) 6002-6013.
-
- 27. B.-Q. Li, Y.-P. Guo, and J.-Z. Fang, J. Alloys Compd. 881 (2021) 159821.
-
- 28. D. Kim, H.J. Kim, and S.I. Yoo, Mater. Sci. Eng. A 804 (2021) 140564.
-
- 29. M. Rezvani, B.E. Yekta, M.S. Hashjin, and V.K. Marghussian, Ceram. Int. 31 (2005) 75-80.
-
- 30. X.-Z. Guo, X.-B. Cai, J. Song, G.-Y. Yang, and H. Yang, J. Non-Cryst. Solids 405 (2014) 63-67.
-
- 31. Y. Shi, B.-W. Li, M. Zhao, and M.-X. Zhang, J. Am. Ceram. Soc. 101 (2018) 3968-3978.
-
- 32. Z.-F. Tong, Z.-H. Jia, Q.-P. Zeng, and C.-C. Xu, Nonferrous Metals Science and Engineering 11 (2020) 1-10 [in Chinses].
-
- 33. C.S. Ray and D.E. Day, J. Am. Ceram. Soc. 73 (1990) 439-442.
-
- 34. A. Karamanov and M. Pelino, J. Eur. Ceram. Soc. 19 (1999) 649-654.
-
- 35. E. Kleebusch, C. Patzigb, T. Höcheb, and C. Rüssel, Ceram. Int. 43 (2017) 9769-9777.
-
- 36. X.-Y. Xu and X.-B. Lao, J. Eur. Ceram. Soc. 41 (2021) 1593-1602.
-
- 37. Y.-X. Zhang, S.-L. Liu, S.-L. Ouyang, X.-F. Zhang, Z.-W. Zhao, X.-L. Jia, Y.-S. Du, L.-B. Deng, and B.-W. Li, Mater. Chem. Phys. 252 (2020) 123061.
-
- 38. L. Barbieri, C. Leonelli, T. Manfredini, G.C. Pellacanl, and C. Siligardi, J. Mater. Sci. 29 (1994) 6273-6280.
-
- 39. V.K. Marghussian, U. Balazadegan, and B. Eftekhari-yekta, J. Eur. Ceram. Soc. 29 (2009) 39-46.
-
- 40. S. Dïngkun and L.A. Orlova, J. Non-Cryst. Solids 112 (1989) 207-210.
-
 This Article
-
2023; 24(1): 17-28
Published on Feb 28, 2023
- 10.36410/jcpr.2023.24.1.17
- Received on May 12, 2022
- Revised on Aug 12, 2022
- Accepted on Sep 3, 2022
Services
- Abstract
introduction
experimental
results and discussion
conclusion
- Acknowledgements
- References
- Full Text PDF
Shared
Correspondence to
- Zhifang Tong
-
Faculty of Materials Metallurgy and Chemistry, Jiangxi University of Science and Technology, Ganzhou 341000, China
Tel : +86-13879715231 Fax: +86-07978312204 - E-mail: tongzhifang1998@126.com
Clean-Energy Research Institute(CRI), Hanyang University, 222, Wangsimni-ro, Seongdong-gu, Seoul, 04763, Korea
E-mail: jcpr@hanyang.ac.kr