


- Tribological and characterization studies of aluminium alloy 6061 reinforcement with aluminium oxide and copper metal matrix composites
D. Elil Raja*, S. Prathap Singh, V. Rangarajan and M. Chrispin Das
Department of Mechanical Engineering, St. Joseph’s Institute of Technology, OMR, Chennai, Tamilnadu, India
This article is an open access article distributed under the terms of the Creative Commons Attribution Non-Commercial License (http://creativecommons.org/licenses/by-nc/4.0) which permits unrestricted non-commercial use, distribution, and reproduction in any medium, provided the original work is properly cited.
Ultrasonic assisted stir casting was used to fabricate aluminium based metal matrix composite reinforcement with 4% copper and various combinations (0, 1 or 2 wt.%) of aluminium oxide. In this study, Taguchi Grey Relational Analysis (GRA) was used to optimise the wear behaviour of the metal matrix composite reinforcement. Reinforcing elements were visualised using SEM, which shows that a uniform distribution is possible with just 1% aluminium oxide additions. In order to better understand the association between wear factors such as sliding distance, sliding speed and applied load, we looked at the wear rate and friction coefficient. According to the Taguchi L9 orthogonal array, we conducted the trials. In each experiment, the rate of wear as well as the coefficient of friction were measured. If you apply a force of 10 N, slide at 1 m/s for 1500 metres, the Taguchi GRA concluded that this was the best combination for your experiment. There is a 61 percent correlation between the sliding velocity and composite wear. After all was said and done, the most well-worn surface was found to have the fewest scratches and fine grooves
Keywords: Tribology, Optimization, Aluminium oxide, Taguchi grey relational analysis
MMCs are metal matrix composites (Mg, Al, Cu, Fe, etc.) with a dispersed ceramic (oxides, carbides) or metallic phase in the metallic matrix (Al) (Pb, Mo, W etc.). While metallic reinforcements include tungsten and beryllium, ceramic reinforcements include silicon carbide (SiC), alumina (SiN), Silicon Nitride (SiN), Boron Nitride (BoN), and Boron Nitride (BN). The commercial planes, space shuttle, bicycles, electronic substrates, cars, and golf clubs are all examples of applications where MMCs are used. The advantages of MMCs over polymer matrix composites include superior abrasion and creep resistance, as well as high strength and stiffness at extreme temperatures. The bulk of matrix-matrix composites (MMCs) are still in the development or production stages as opposed to polymer matrix composites. Because of their high manufacturing costs, MMCs have been unable to achieve their full potential. Because of their low electrical and thermal conductivity and resistance to most radiation, MMCs are an excellent choice for a variety of applications. Magnesium and silicon are both present in the aluminium 6061 alloy, making it particularly heat treatable. By including aluminium oxide as reinforcement in the copper matrix, the wear resistances continue to rise, and the stability of the thermo dynamical characteristics is also maintained. Particles of aluminium oxide are added, which also improves compressive strength. The bond between the ceramic aluminium oxide and the copper matrix is strong, the enhancement promotion effect is clear, and when the ceramic aluminium oxide is exposed to an external force, a good combination interface can more effectively play a role in load transfer, reduce stress concentration, and reduce defects.
The increased strength-to-weight ratio, lower energy consumption, and greater wear resistance of aluminium hybrid matrix composites have made them the material of choice in place of ordinary aluminium alloys [1, 2]. Due to RAHM's physical and mechanical properties, the use of the material in automobiles has grown. Hybrid aluminium metal matrix composites can be reinforced with a number of materials, including Al2O3 and graphite, as well as industrial waste by products [3]. Researchers have fabricated aluminium hybrid metal matrix composites, which are now being used in a wide range of commercial and industrial applications [4]. Research into new compositions is still underway, and past researchers' discoveries have been shared with the current group of researchers. To find out more about the tensile strength, wear resistance and hardness, of these metal matrix composites, Veeresh Kumar et al. [5] performed experiments on Al6061/SiC and Al7075/Al2O3 composites. Hardness and density were improved by including SiC and Al2O3 in the relevant composites.
A study by Anilkumar et al. [6] found that the compressive strength, hardness and tensile strength of Al6061 composites supplemented with fly ash decreased with increasing particle size. The composite's ultimate compressive strength, hardness and tensile strength rise when fly ash particles are added at a higher proportion, while the composite's ductility decreases. Aluminum-based hybrid metal matrix composites for heavy-duty applications have been researched by Asif et al. in the creation of composites containing SiC particles and graphite/antimony trisulphide solid lubricants [7]. In comparison to a binary composite, hybrid composites have a minimum wear rate. Wear rate is reduced by increasing load and increasing speed.
When SiC and alumina were added to aluminium, Singh et al. [8] studied the mechanical properties of the alloy. As a result, mechanical properties such as hardness, yield strength, and ultimate strength improved as the weight percentage of reinforcement increased in this inquiry into the behaviour change of aluminium by mixing a variable age percentage amount of SiC and Al2O3 composite. In addition to losing elongation, the material also loses ductility, making the final product more brittle. The wear and corrosion properties of Al/Al2O3/graphite hybrid composites have been examined by Gaitonde1 et al. [9]. The influences of reinforcing, time, and particle size on composite samples produced have been studied. Microhardness of the composites has also been tested in addition to corrosion testing. Improved hardness and reduced wear rates and corrosion were achieved by incorporating reinforcement into Al5083/Al2O3/graphite hybrid composites.
Materials like fly ash and aluminium alloy enhanced with alumina were tested for mechanical qualities in this investigation. Samples of fly-ash-reinforced aluminium alloy (LM25) composites were tested utilising the stir casting method. Increases in Al2O3 weight percentage were shown to boost the tensile strength and hardness of aluminium alloy composites. The mechanical properties of the composites based on aluminium were studied by Kuma and Singh [11]. It was shown that when compared to a SiC, graphite-reinforced material, the new composite containing SiC and B4C particles showed an improvement in hardness value, flexural strength, tensile strength, and ultimate hardness.
An electro discharge machining method for milling Al6061/Al2O3 composite materials was investigated by Wang and Yan [12], who assessed the rates at which material, surface roughness and tool wear were eliminated under various input settings when used for blind hole drilling [13]. Unpredictable material removal rates were seen as peak current increased, according to Yan and Wang [13]. Flushing pressure enhances material, tool wear rate, surface roughness and removal rate during rotary electro discharge machining of Al6061/Al2O3 composites. Disk-like electrodes are essential for rotary electro discharge machining of Al6061/Al2O3 composites, according to Yan et al. [14]. A study by Veeresh kumar et al. [15] revels that the amount of filler in Al6061 and Al7075 composites increased micro hardness linearly as the filler content rose [16]. Increased surface roughness is seen while cutting Al2O3 particles reinforced by aluminium metal matrix composites using carbide coated tools. By 20.8 percent, the cutting velocity has an effect on the A356/20/SiC/T6 composite's surface roughness [17, 18]. Machining with 5% SiCp aluminium metal matrix composites resulted in a superior surface polish. Metin Kok [19] observed that cutting speed had the biggest impact on the surface roughness of Al2024/Al2O3 composites when using uncoated and coated carbide tools. A rougher machined surface can be found on Al-Si alloy and graphite composites because they contain deeper holes or valleys. As cutting speed increases, the value of surface roughness decreases.
Researchers have evaluated the mechanical and wear properties, as well as the machining characteristics, of aluminium metal matrix composites supplemented with SiC and Al2O3. Study into hybrid Al6061/Al2O3/MoS2 composites' mechanical properties and wear behaviour is lacking, as is research into their machining. Due to its aluminium foundation, Al2O3 composite materials are lightweight, heat resistant, wear resistant, and cost effective. Automobile pistons, cylinder block liners, and drive shafts are among the many applications for which they are employed by engineers. Tough-to-manufacture materials include materials with hard and abrasive reinforcing elements like those found in ceramics [21]. Composites can benefit from the usage of MoS2 as a hybrid reinforcement. Because of the stable and MoS2-rich mechanically mixed layer, metal-to-metal contact is avoided, decreasing wear on the composite. When the lubricant phase is missing from hybrid composites, the mechanically mixed layer is more susceptible to wear [22]. The hybrid composite of Al6061, Al2O3, and MoS2 was studied to learn more about its properties in this regard. M. Rajeswaran et al [26] Mullite-lanthanum oxide (ML) ceramic composite has been recommended as TBC coatings in IC engines after conducting experimental setup for 3Al2O3·2SiO2· La2O3 ceramic-coated piston. As an additional adhesive layer, nickel-chromium (NiCr) ceramic composite has been employed. R.Sivabalan et al. [27] examining the characteristics of a hybrid magnesium (Mg) metal matrix composite (MMC) that was made employing an integrated squeeze-cum stir casting technique. Silicon nitride (Si3N4) and aluminium oxide (Al2O3), respectively, are the major and secondary reinforcements examined in this work. Tamilanban et al. [28] focuses on the optimization of stir casting parameters, such as stirring rate, pouring temperature, and stirrer blade design, and how these affect how an Al/SiC composite created by stir casting behaves mechanically. Taguchi grey is the optimization methodology employed. The wear parameters, such as wear rate (WR) and coefficient of friction (COF), were improved using Taguchi-Grey Relational Approach in A.Kanakaraj et al. [29] study on TiB2 & ZrO2 included A356 based hybrid composites (GRA). The best conditions for obtaining the lowest WR and COF were determined to be 10 N of load, 2 m/s of sliding velocity, 1500 m of sliding distance, and reinforcement with 0.5%TiB2+ 2.5%ZrO2 nanoparticles.
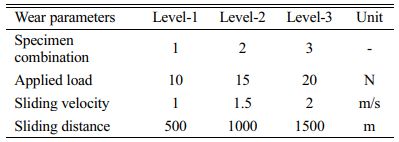
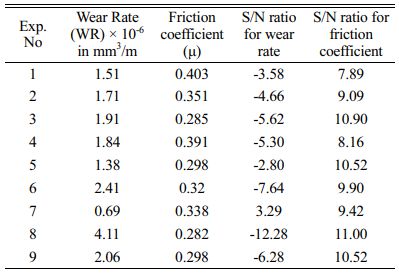
Because of its excellent mechanical qualities and weldability, the aluminium alloy AA6061 is widely employed in engineering and commercial applications. Table 1
Fabrication of Composites
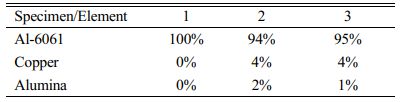
Ultrasonic probe and the stir casting process are coupled in this work. The technique is known as the stir casting method with ultrasonic probe assistance. The procedure combines the benefits of stir casting and ultrasonic probing. Due to the ultrasonic cavitation effect and constant stirring with the stirrer, the combined process will increase particle homogeneity in dispersion and prevent particle settlement in metal matrix. The ultrasonic aided stir casting method is used to create composite materials from aluminium 6061 as the base metal and copper and alumina as reinforcement. An open mouth electric resistance furnace was involved to melt the aluminium alloy between 600 and 650 oC. The mechanical stirrer was used to develop a vortex in the melt, and particles were poured into it to mix. Aluminium foil was used to create little packets containing around 1 gram of particle. It was then added to the melting mixture. Prior to and following the addition of particles, the melt was stirred to ensure a homogeneous mixture. Using a muffle furnace, the particles were heated to 800 oC for 2 hrs before being added to the melt. Melt was poured into metal dies when the mixing procedure had been completed. Three examples are made of pure aluminium, 4% copper, 1% alumina, and 2% alumina, respectively. Table 2 displays the material composition of various specimens that were created.
A pin-on-disc configuration was utilised to study the dry sliding wear characteristics of the composite in accordance with ASTM G99-05 criteria. Engineers produced a composite specimen for wear testing with dimensions of 10×50 mm. Facing operations were performed on the specimens after each test to remove the worn surfaces to a depth of 0.5 mm. In order to disclose a new surface for each test the disc was polished with different (400, 600, 800 and 1,200) grit emery paper in succession. It's for the sake of consistency across all testing scenarios. Before and after each test, samples were weighed with an electronic balance that had a precision of 0.01 mg. The rate of wear was computed by dividing the volume by the distance travelled and the equation is given in (1). The coefficient of friction was calculated by dividing tangential load (Ft) with normal load (Fn) and the equation is given in (2).
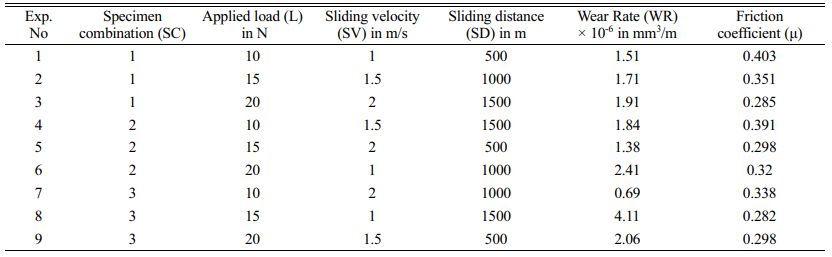
Ws stands for wear rate in mm3/m, ∆M for mass loss in g, g/mm3 for material density ρ, and L for sliding distance in m. Table 3 lists the variables and their weights. Table 4 displays the wear rate data for composites made of copper and alumina. With the aid of the MINITAB17 programme, the analysis for signal/noise ratios was carried out.
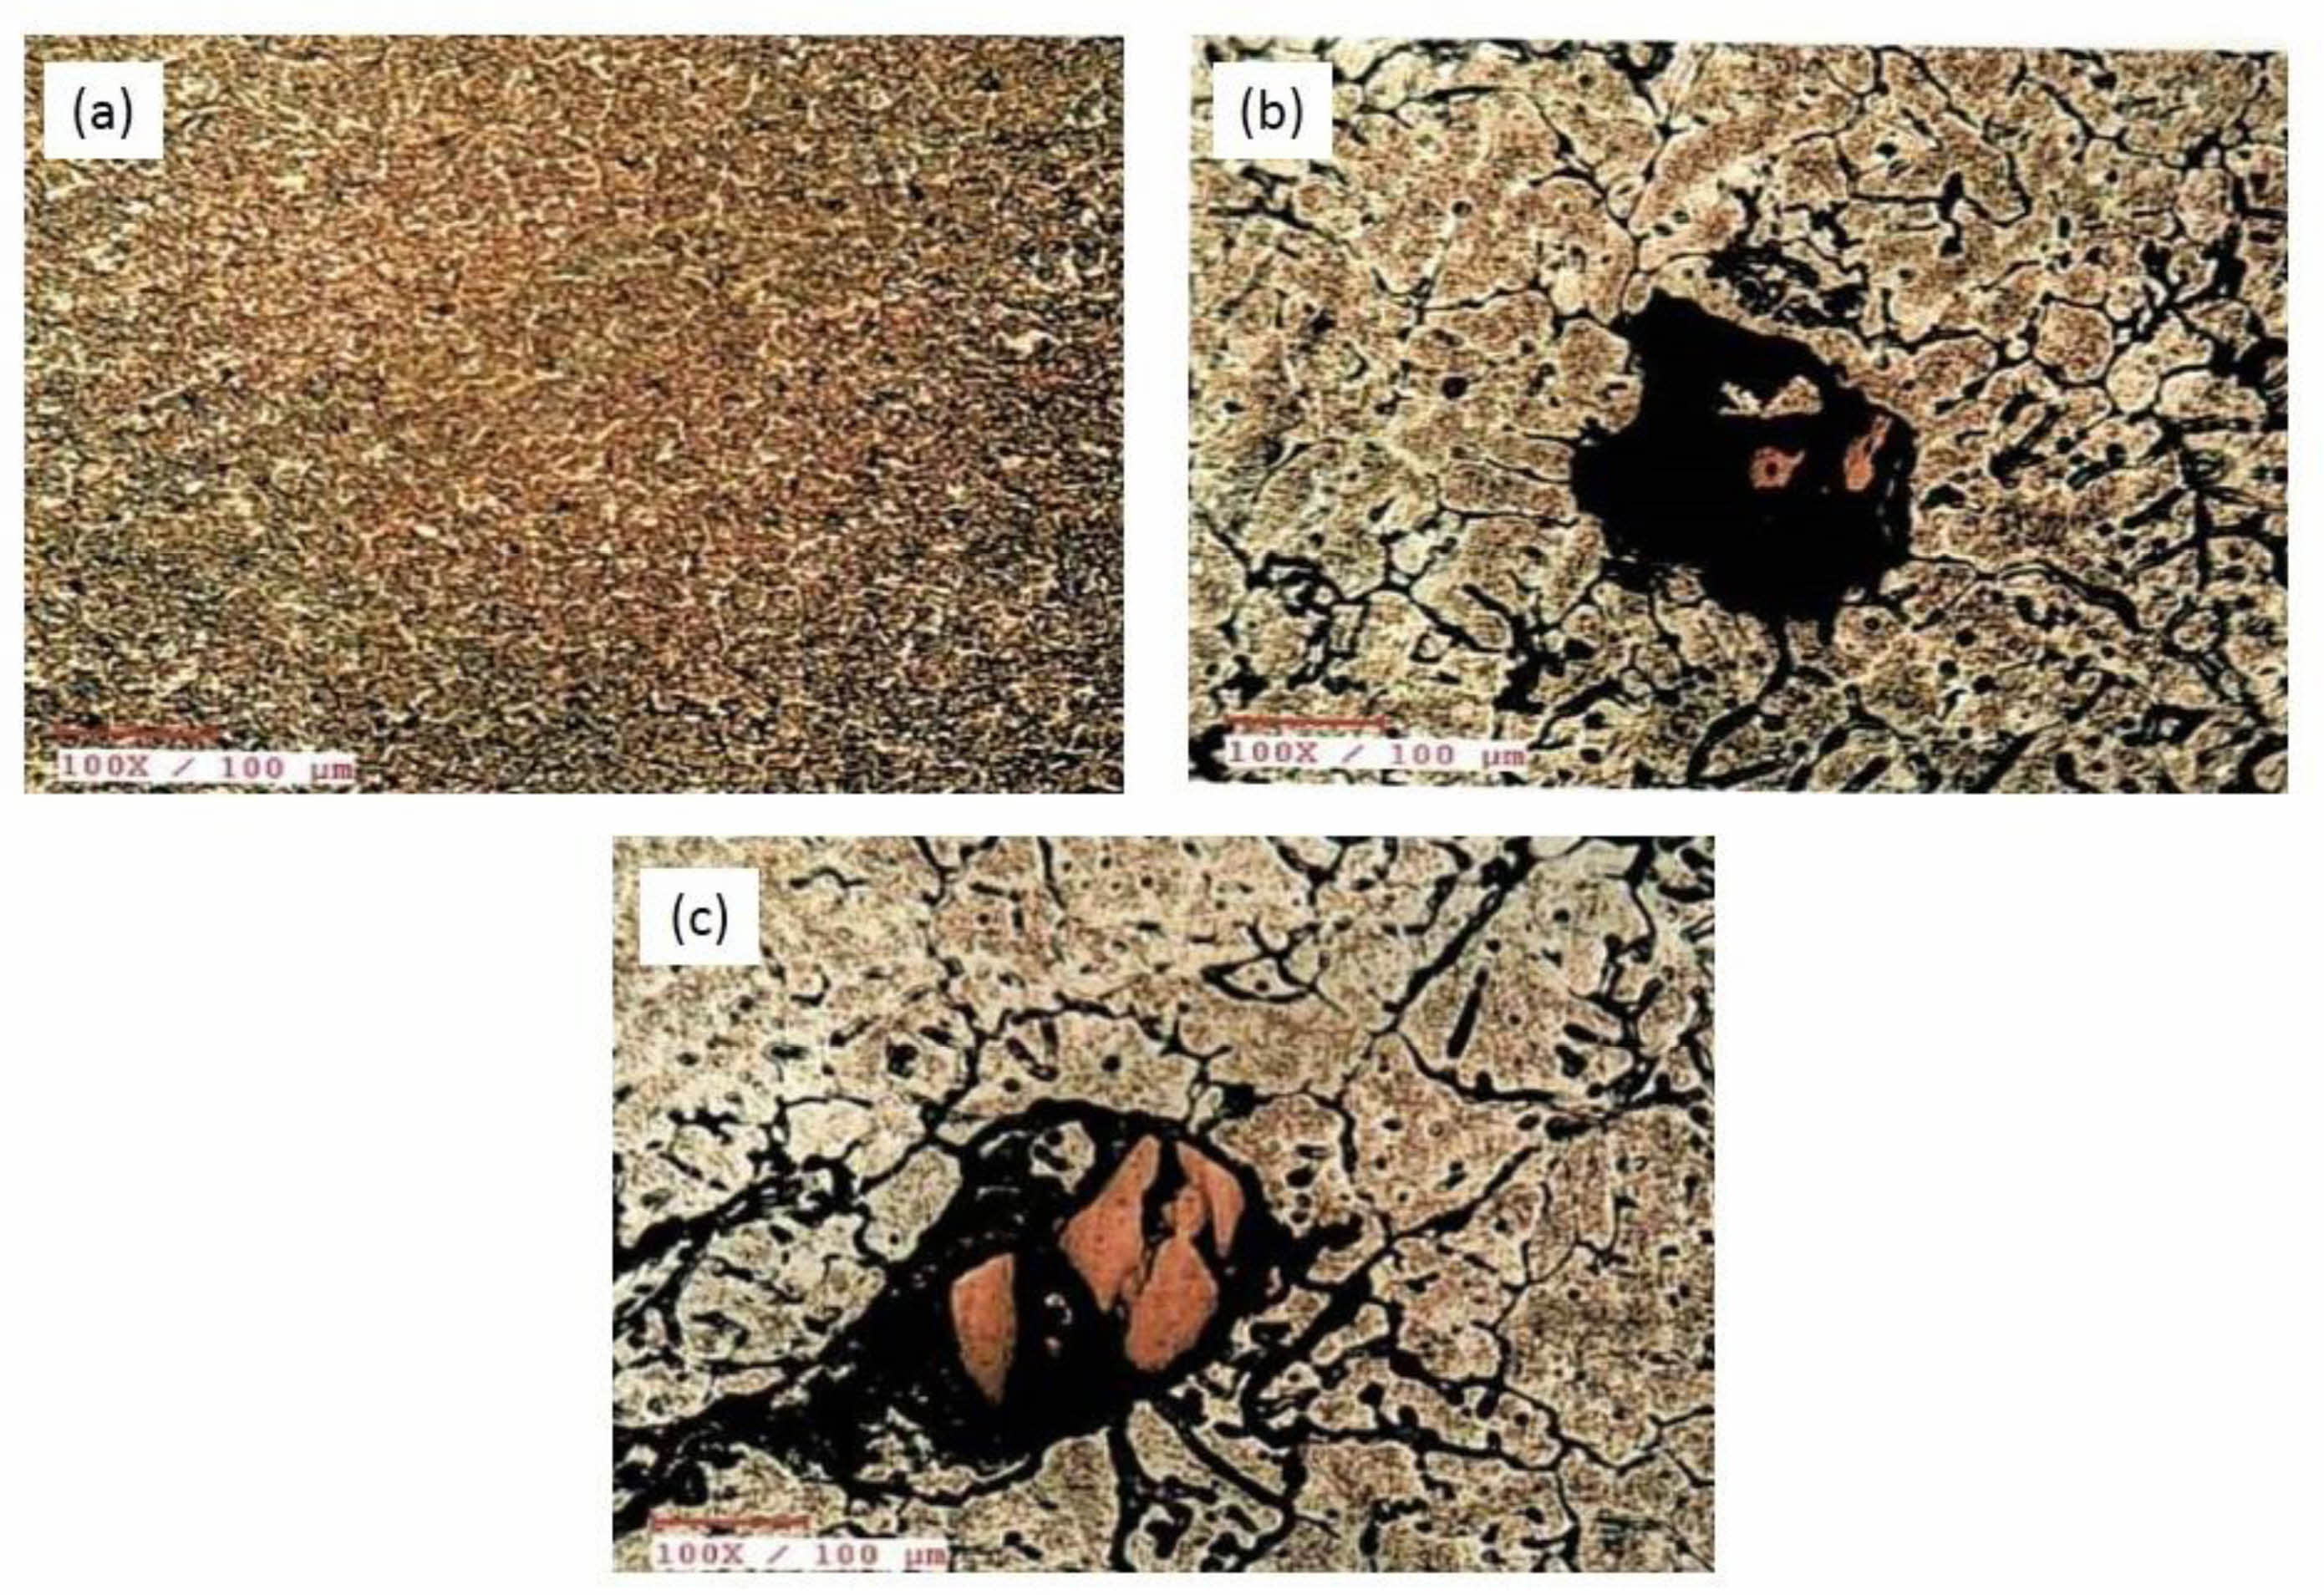
Microstructure Examination Fig. 1 Fig. 2
The microstructure of Aluminum 6061 alloy is seen in Fig. 3(a). The Al6061 alloy matrix contains Al-Si fine eutectic particles. Microstructures of aluminium 6061 reinforced with 1% alumina and 4% copper metal matrix composite can be seen in Fig. 3(b), whereas Fig. 3(c) displays the microstructure of aluminium 6061 reinforced with 2% alumina and 4% copper metal matrix composite can be seen. The existence of alumina and copper particles was confirmed in the final two microstructures.
Influence of Wear Parameters
The S/N ratio, displayed in Table 5, was calculated using Minitab 17 with the wear rate and friction coefficient. We used a 'lower-the-better' technique because we wanted to find out how different parameters affected the different types of answers. Equation (3) shows the formula for S/N ratio of the wear rate and coefficient of friction.
Where n = Number of repetitions of the experiment; pi = Evaluated experimental response values where i = 1, 2, ………n
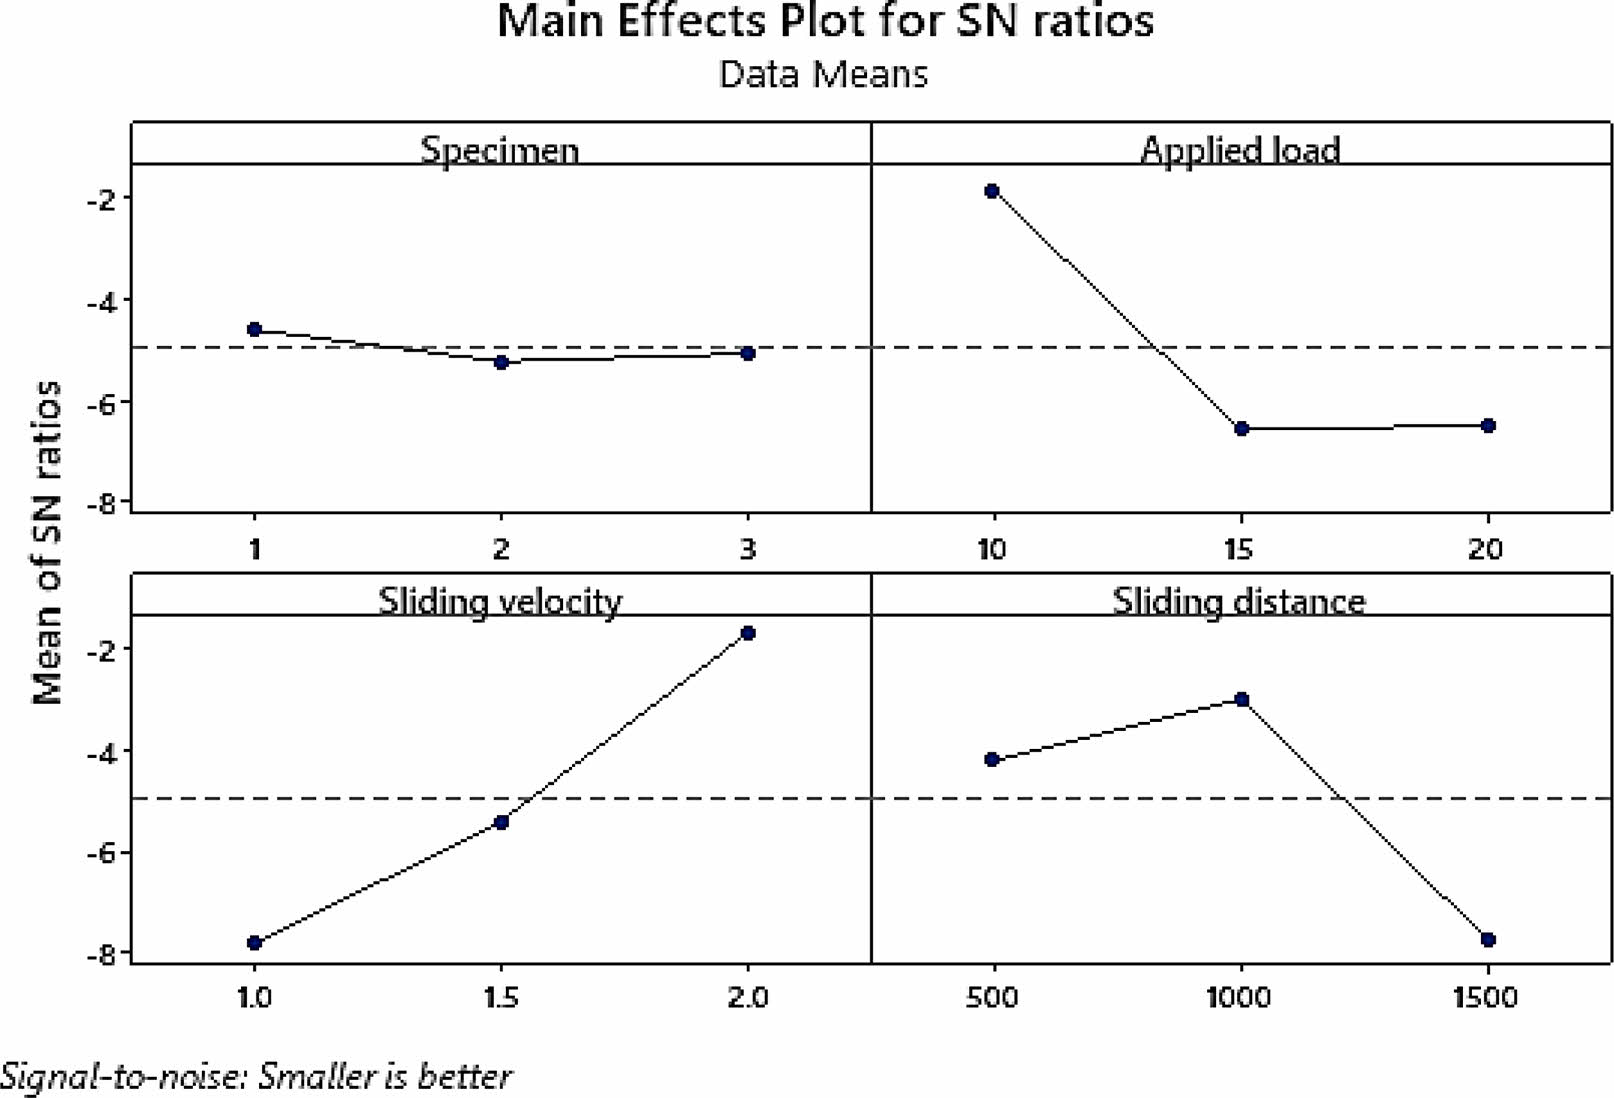
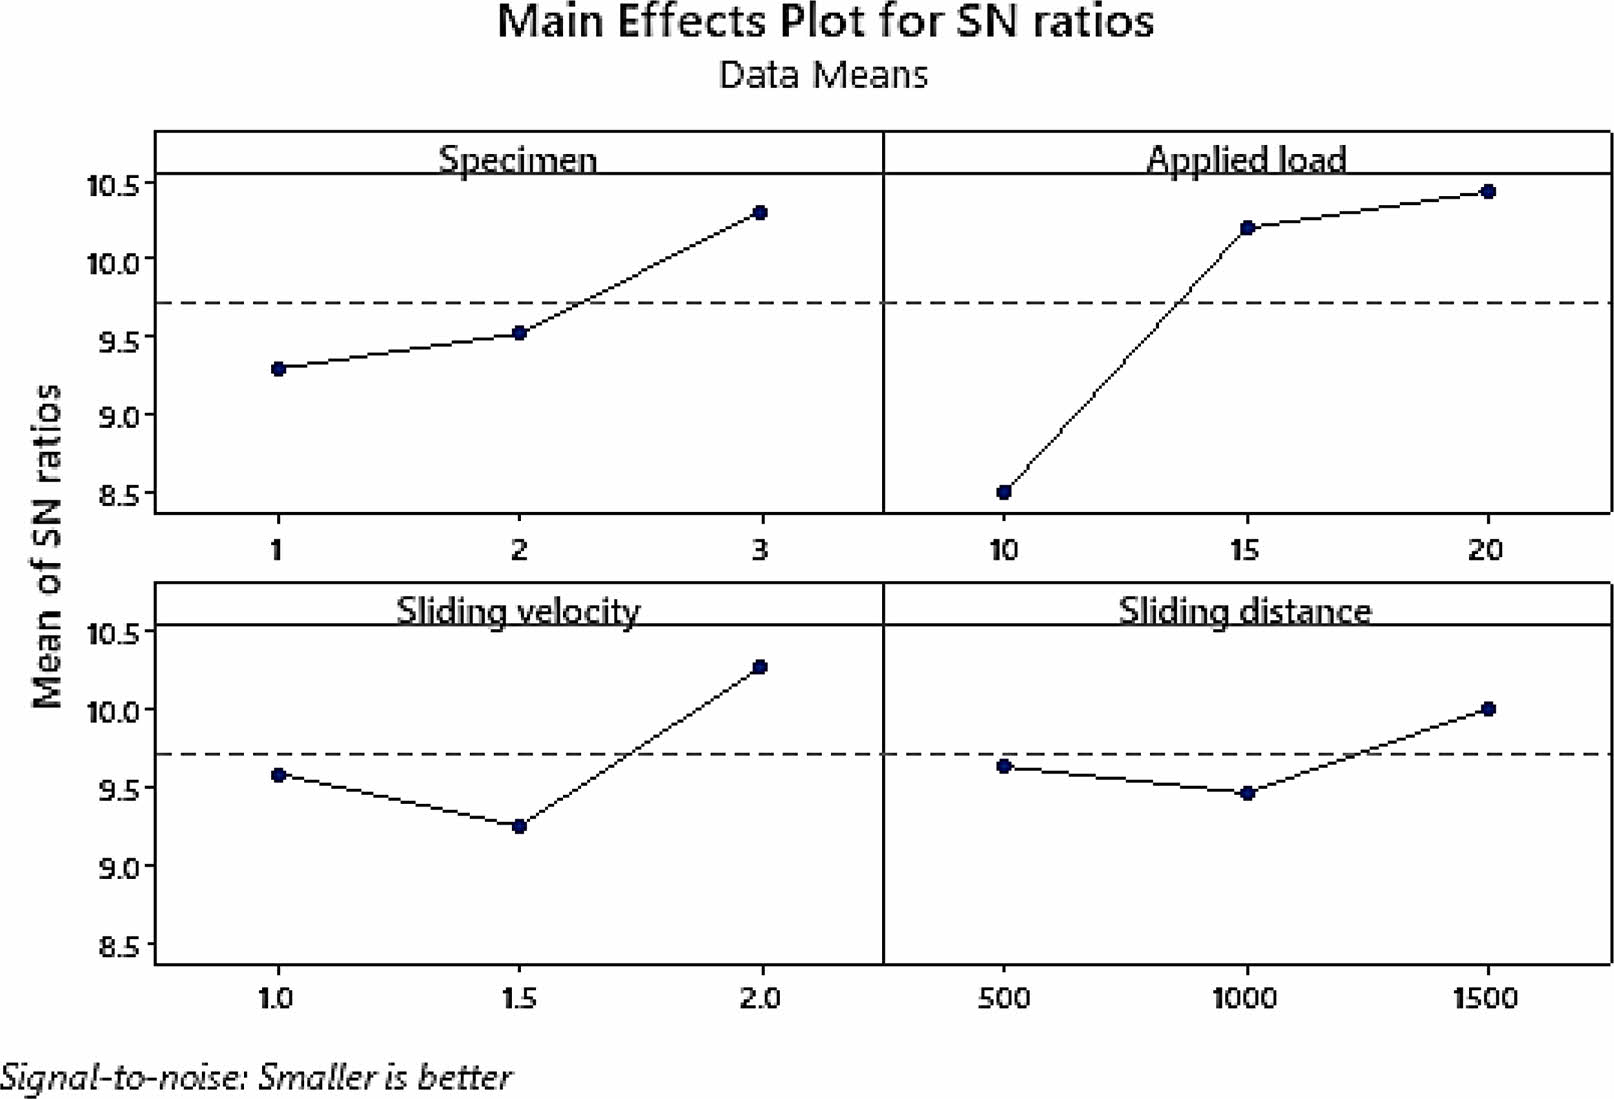
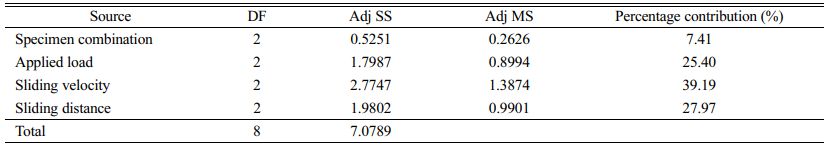
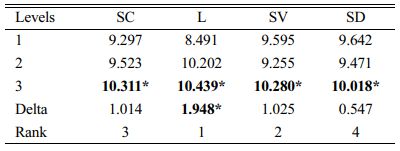
Wear rate S/N ratios were utilised to identify the elements affecting the wear rate in Table 5. The impact of wear factors was studied with the lower-the-better Taguchi approach. Table 6 illustrates the wear rate S/N ratios. It was necessary to calculate the delta value between the pair of points of a parameter before ranking them. By comparing the ranks of the wear parameters, we were able to identify the most important ones. Table 6 revealed that sliding velocity was the most important factor, with the top rank. The sliding distance ranked second, followed by the combination of applied load and specimen.
In Fig. 3, the primary effects of S/N ratios on wear rate are shown. A decrease in the S/N ratio was found as the applied load increased. In addition, as the sliding speed rose, the S/N ratio improved. This ratio rose from 500 to 1000 metres to 1500 metres, but only marginally so. First-level characteristics (SC1, L1, SV3, and SD2) all had a positive effect on the wear rate S/N ratios, as seen in the figure.
The effects of each parameter on the wear rate's quality performance were examined using ANOVA, and the results are shown in Table 7. With a contribution of 39%, the highest sliding velocity had a significant impact on quality performance, followed by a contribution of 29% from the sliding distance, a contribution of 26% from the applied load, and a contribution of 7.41% from specimen combination. The sliding velocity was recognised as a crucial factor in determining the quality of wear rate performance.
Wear Parameter influence on Friction Coefficient
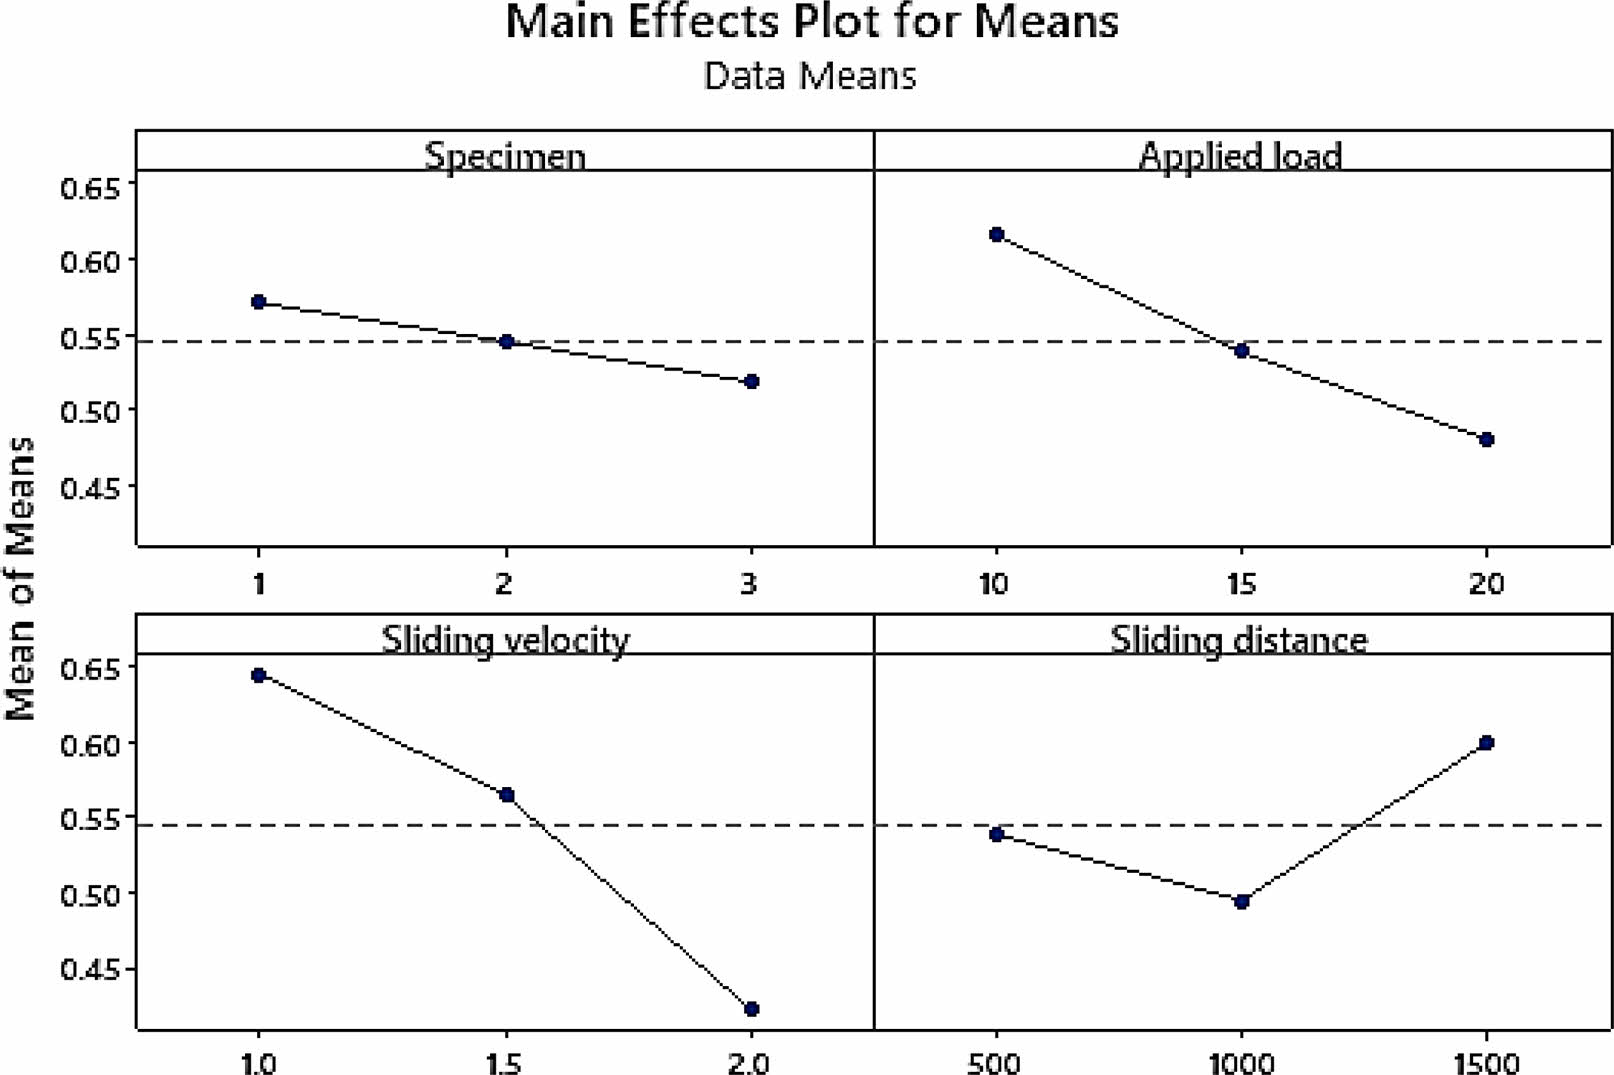
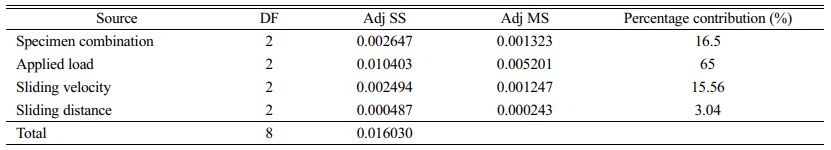
Calculating the S/N ratios of the friction coefficient testing data allowed us to identify the variables that have an impact on it, as shown in Table 7. The Taguchi method's lower-the-better-quality perspective was used to investigate the impact of wear factors. Using the friction coefficient's S/N ratios, the response table is provided in Table 7 to put it another way, the applied load was ranked as the most important factor. The specimen combination and sliding distance were both important, but the sliding velocity came in second.
Fig. 4 depicts the primary implications of friction coefficient. According to the study, the S/N ratio increased with increasing load and dropped with increasing sliding speed (from 1 m/s to 1.5 m/s). The S/N ratio dropped from 500 to 1000 m and then rose to 1500 m for sliding distance. S/N ratios for friction coefficient were found to be best at SC3, SV3, and SD3 in the figure.
Table 8 lists the ANOVA of the friction coefficient. The specimen combination with a contribution of 16.5% had the greatest impact on quality performance, followed by the applied load at 65%. The friction coefficient's quality performance was thought to be strongly influenced by the applied load.
Multi-response Optimization using GRA
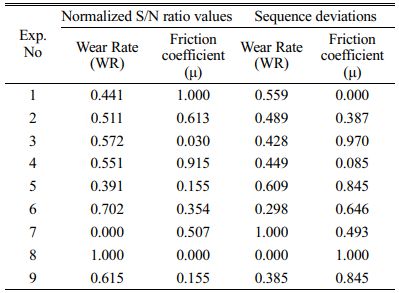
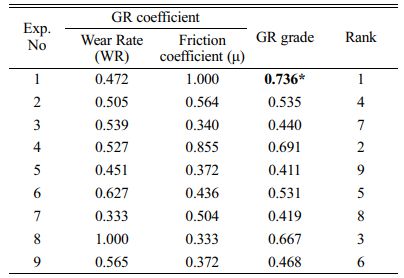
Table 4 lists the wear response under various wear circumstances. The lower the wear rate and friction coefficient, the better the wear performance of the material. Table 9 shows the normalised values. Table 9 lists the deviation sequences based on the normalised S/N ratio of both replies, which is set to 1. Table 10 lists the grey relational coefficients and GRG for all the experiments in the L9 orthogonal array. Table 10 clearly shows that experiment 1 revealed the highest GRG in agreement with the experiments done.
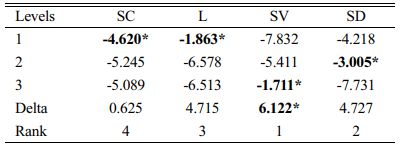
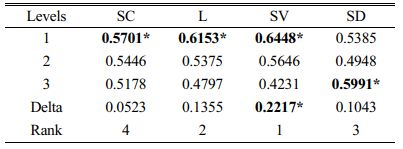
A higher grey relationship grade in GRA always produced better results. As a result, the S/N ratio for the GRG was calculated using the bigger, better approach. The experiment with the highest signal-to-noise ratio was given the top ranking because of its high S/N ratio. Table 11 lists the most significant influences on wear performance. Wear performance was shown to be influenced primarily by the sliding speed. The sliding distance came in third, with the applied load coming in second. The study's optimal parameters were found to be SC1, L1, SV1, and SD3, according to the findings.
Fig. 5 depicts the GRG's principal effects. The higher GRG values resulted in a better quality output. From 10 to 20 N of applied load, the S/N ratio declined significantly. S/N ratio dropped as sliding speed increased. The GRG fell from 500 to 1000 metres for the sliding distance before rising to 1500 metres. For GRG's purposes, it was clear from the graphic that the desirable values were: SC1, L1, SV1, and SD3. With this information in hand, it was determined that first specimen combination with 10 N applied force, 1 m/s sliding velocity and 1500 m sliding distance provided the best tribological performance for the composite material under test.
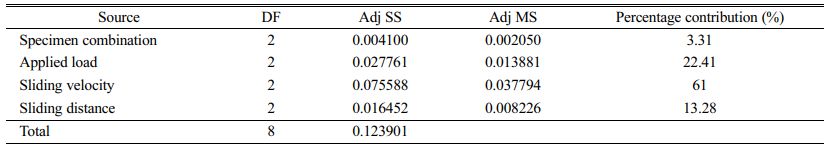
Table 12 shows the GRG's ANOVA results. The applied load had a contribution of 22.41 percent, but the sliding velocity accounted for 61 percent of the total influence on quality performance. Sliding velocity and the applied load were recognised as essential quality performance factors.
Confirmation Tests
The quality features were predicted and validated once the optimum variables were discovered using GRG. The GRG's mean value was calculated using the optimum parameters in the confirmation experiments. Wear rate and friction coefficient were 0.11 × 10⁻⁵ and 0.244667, respectively, the best values for these two metrics According to Table 13 (confirmation experiments), the projected outcomes were very close to what actually happened.
Worn surface analysis
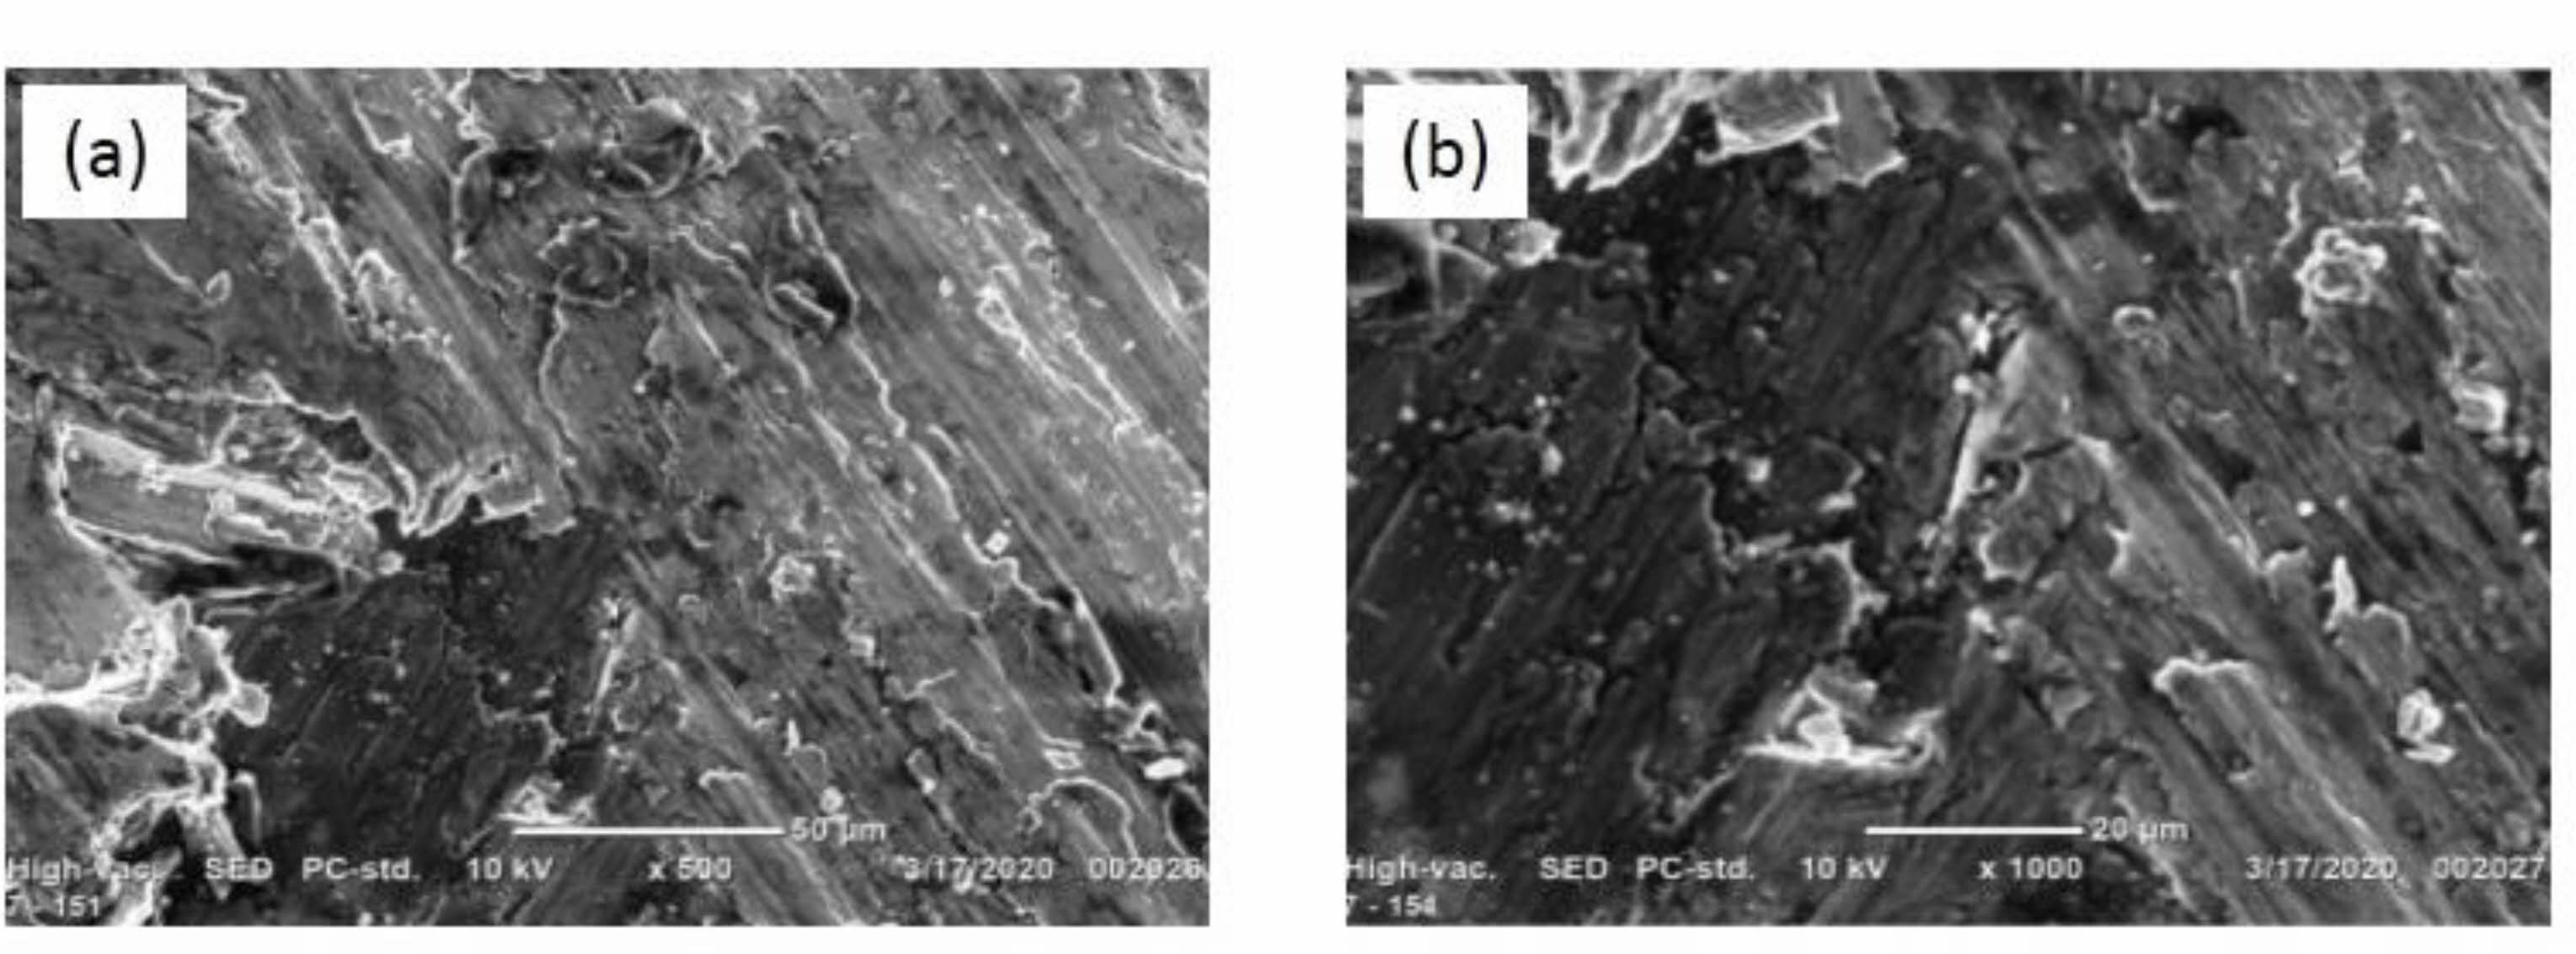
It has also been used to examine the wear process in order to ensure that the model generated is accurate. Fig. 6 shows the surface wear at various magnifications when specimen combination (sample 1) is subjected to a 10 N load, sliding velocity of 1.0 m/s, and a sliding distance of 1500 m. (500× and 1000×). The surface has fewer scratches and fine grooves, indicating that the model for evaluating wear behaviour has been designed properly.
|
Fig. 1 (a) Microstructure of Al6061 alloy; (b) Microstructure of Al6061 with 1% Alumina and 4% Copper MMC; (c) Microstructure of Al6061 with 2% Alumina and 4% Copper MMC. |
|
Fig. 2 Main effects of wear rate. |
|
Fig. 3 Main effects plot for friction coefficient. |
|
Fig. 4 Main effect plots of GRG. |
|
Fig. 5 (a) Scanning electron microscope image at 500×; (b) Scanning electron microscope image at 1000X for the optimum condition (Specimen combination 1, applied load 10 N, sliding velocity 1 m/s and sliding distance 1500 m) |
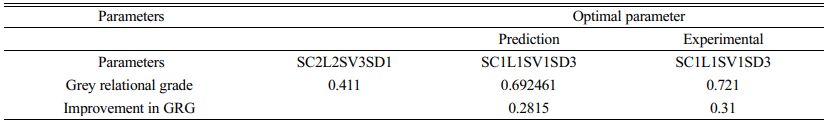
To produce the alumina (0, 1 or 2 percent), copper (4 percent) reinforcing Aluminum 6061 alloy metal matrix composite, the stir casting technique was employed. Analysis of the samples' microstructures verified the presence of alumina and copper particles with varying weight percentages. It was discovered that Taguchi's L9 orthogonal array with GRA approach was used to analyse how testing parameters affected the friction coefficient and wear rate of the aluminium 6061 alloy reinforced with alumina and copper metal matrix composites. The GRG found that sample 1 specimen combination, 10 N applied stress, 1 m/s sliding velocity, and 1500 m sliding distance were the most effective factors for enhancing wear performance over the test set. The sliding velocity and the applied load were considered to be important criteria in determining the quality of the finished product. There is a 61 percent correlation between the sliding velocity and composite wear. Testing confirmed that the GRG improvement from 0.411% to 0.721% was possible using the optimal design parameters (SC1, L1, SV1, SD3), based on the initial design parameters (SC2, L2, SV3, SD1). After all was said and done, the most well-worn surface was found to have the fewest scratches and dings.
- 1. L. Poovazhagan, K. Kalaichelvan, A. Rajadurai, and V. Senthilvelan, Procedia Eng. 64 (2013) 681-689.
-

- 2. A. M. Al-Qutub, A. Khalil, N. Saheb, and A. S. Hakeem, Wear 297 (2013) 752-761.
-
- 3. K. Umanath, K. Palanikumar, and S. T. Selvamani, Comp. Part B: Eng. 53 (2013) 159-168.
-
- 4. K. Umanath, S.T. Selvamani, and K. Palanikumar, Int J of Eng. Sci and Tech. 3 (2011) 5441-5551.
- 5. G. B. Veeresh Kumar, C. S. P. Rao, N. Selvaraj, and M. S. Bhagyashekar, J of Min Mat Cheract Eng. 9 (2011) 454-461,
- 6. H. C. Anilkumar, H. S. Hebbar, and K. S. Ravishankar, Int J of Mech and Mat. Eng. 6 (2011) 225-233.
- 7. M. Asif, K. Chandra, and P. S. Misra, J of Min Mat Cheract Eng. 10 (2011) 115-134.
- 8. D. Singh, H. Singh, S. Kumar, and G. Singh, Int. Journal on Emer. Tech. 3 (2012) 178-184.
- 9. V. N. Gaitonde1, S. R. Karnik, and M. S. Jayaprakash, J of Min Mat Cheract Eng. 11 (2012) 695-703.
-
- 10. R. Sharanabasappa and B. S. Motgi, IOSR J of Mech and Civil Eng. 7 (2013) 14-21.
- 11. D. Kuma and J. Singh, Int. J of Eng Res App. 1 (2014) 31-36.
- 12. C. C. Wang and B. H. Yan, J of Mat Process Tech. 102 (2000) 90-102.
-
- 13. B. H. Yan and C. C. Wang, J of Mat Process Tech. 95 (1999) 222-231.
-
- 14. B. H. Yan, C. C. Wang, W. D. Liu, and F. Y. Huang, Int J of Adv Manu Tech. 16 (2000) 322-333.
-
- 15. G. B. Veeresh Kumar, C. S. P. Rao, N. Several, and M. S. Bhagyshekar, J of Min Mat Chract Eng. 9 (2010) 43-55.
-
- 16. Y. Sahin, M. Kok, and H. Celik, J of Mat Process Tech. 128 (2002) 280-291.
-
- 17. J. P. Davim, J of Mat Process Tech. 132 (2003) 340-344.
-
- 18. E. Kiliçkap, O. Çakir, M. Aksoy, and A. Inan, J of Mat Process Tech. 164-165 (2005) 862-867.
-
- 19. A. Metin Kok, in Pro. of the 11th Inorg Bond Fib. Comp. Conf. 1 (2008) 272-281.
- 20. C. A. Brown and M. K. Surappa, Mat. Sci. and Eng. 102 (1998) 31-37.
-
- 21. M. Kök and K. Özdin, J of Mat Process Tech. 183 (2007) 301-309.
-
- 22. H. Kato, M. Takama, Y. Iwai, K. Washida, and Y. Sasaki, Wear 255 (2003) 573-578.
-
- 23. A. Baradeswaran, S. C. Vettivel, A. Elaya Perumal, N. Selvakumar, and R. Franklin Issac, Mat. and Des. 63 (2014) 620-632.
-
- 24. A. Baradeswaran and A. Elaya Perumal, Comp. Part B: Eng. 56 (2014) 464-471.
-
- 25. S. Mahdavi and F. Akhlaghi, Trib Letts 44 (2011) 1-12.
-
- 26. M. Rajeshwaran, B. Shreeram, T. Thangeeswari, and D. Elil Raja, J. Ceram. Process. Res. 23 (2022) 459-465.
- 27. R. Sivabalana, K. R. Thangadurai and K. Lenin, J. Ceram. Process. Res. 22 (2021) 605-614.
- 28. T. Tamilanban,T. S. Ravikumar, C. Gopinath, and S. Senthilraj, J. Ceram. Process. Res. 22 (2021) 629-635.
- 29. A. Kanakaraj, R. Mohan R and R. Viswanathan, J. Ceram. Process. Res. 23 (2022) 268-277.
 This Article
-
2022; 23(6): 926-933
Published on Dec 31, 2022
- 10.36410/jcpr.2022.23.6.926
- Received on Sep 16, 2022
- Revised on Oct 12, 2022
- Accepted on Oct 26, 2022
Services
- Abstract
introduction
material selection and methodology
results and discussion
conclusions
- References
- Full Text PDF
Shared
Correspondence to
- D. Elil Raja
-
Department of Mechanical Engineering, St. Joseph’s Institute of Technology, OMR, Chennai, Tamilnadu, India
Tel : +91-9443949827 Fax: +04424503132 - E-mail: elilraja76@gmail.com
Clean-Energy Research Institute(CRI), Hanyang University, 222, Wangsimni-ro, Seongdong-gu, Seoul, 04763, Korea
E-mail: jcpr@hanyang.ac.kr