


- Spatial Analysis of Ground water and their treatment with Low-Cost Ceramic membrane
K. Santhosh Kumaara, N. Muralimohanb, P. Kulanthaivelc and S. Sathiskumard
a,cAssistant Professor, Department of Civil Engineering, Kongu Engineering College, Perundurai, Erode, Tamil Nadu, India
bAssociate Professor, Department of Civil Engineering, KSR College of Engineering, Tiruchengode, Namakkal, Tamil Nadu, India
dAssistant Professor, Department of Automobile Engineering, Kongu Engineering College, Perundurai, Erode, Tamil Nadu, IndiaThis article is an open access article distributed under the terms of the Creative Commons Attribution Non-Commercial License (http://creativecommons.org/licenses/by-nc/4.0) which permits unrestricted non-commercial use, distribution, and reproduction in any medium, provided the original work is properly cited.
Urbanisation is major reason for the contamination of Ground Water (GW) due to the movement of people from rural area to urban areas. The GW quality worsening due to the water security issues in Erode by the rapid growth of number of Tannery and Dyeing industries around the city limits. These waters contain harmful chemicals and toxins which makes the water more degrades the quality of water which affects the aquatic animals and plants. Now a days, People in urban cities are exposed to more polluted water without realizing its potential danger to health. The Spatial analysis of GW which is determined by the values of pH, Turbidity, TDS, TSS, Alkalinity, Nitrate, Sulphate, Chlorides, Phosphates, Dissolved Oxygen, Chromium and Lead and mapping done with sample taken from different locations. The intensity of the chemical parameters above the permissible limits which cause disturbance in living beings. With the help of GIS technologies, identifies the areas where the ground water quality is depleted more. The GW is treated with help of Ceramic membranes as it has good chemical stability, as heavy metal plays a major role in water treatment. Heavy metal ion separations from contaminated water are all discussed as low-cost ceramic membrane applications. This study highlights the upcoming technologies and hurdles of updating low-cost ceramic membranes that aid the treatment of water pollution levels at various sampling locations in Erode municipal corporation with the goal of creating a water quality map identifying areas that are highly polluted using Arc GIS 10.3
Keywords: Spatial analysis, Urbanisation, Water quality, Ceramic membrane
Groundwater is almost universally important for human consumption, habitat support, and the reliability of stream flow to rivers. They are usually of extremely high quality. Even though they are naturally filtered on their passage through the earth, they are often clear, colorless, and bacteria free, demanding minimal treatment like ceramic membrane. The chemistry of groundwater is impacted by climatic inputs, soil and water-rock processes, and pollutant sources such as mining, land reclamation, agricultural practices, acid rain, and home and industrial waste [17]. When groundwater is polluted, it is impossible to recover it eliminates pollutants from their sources. GIS (Geo- graphical Information System) has emerged as a strong tool for storing, analyzing, and displaying spatial data and using it to make decisions in a variety of domains, including engineering and the environment.
GIS is an effective tool for assessing and mapping quality of ground water, understanding the natural environment, and developing solutions for water resources issues assessing and managing water resources on a wide scale pollution vulnerability in groundwater [15].
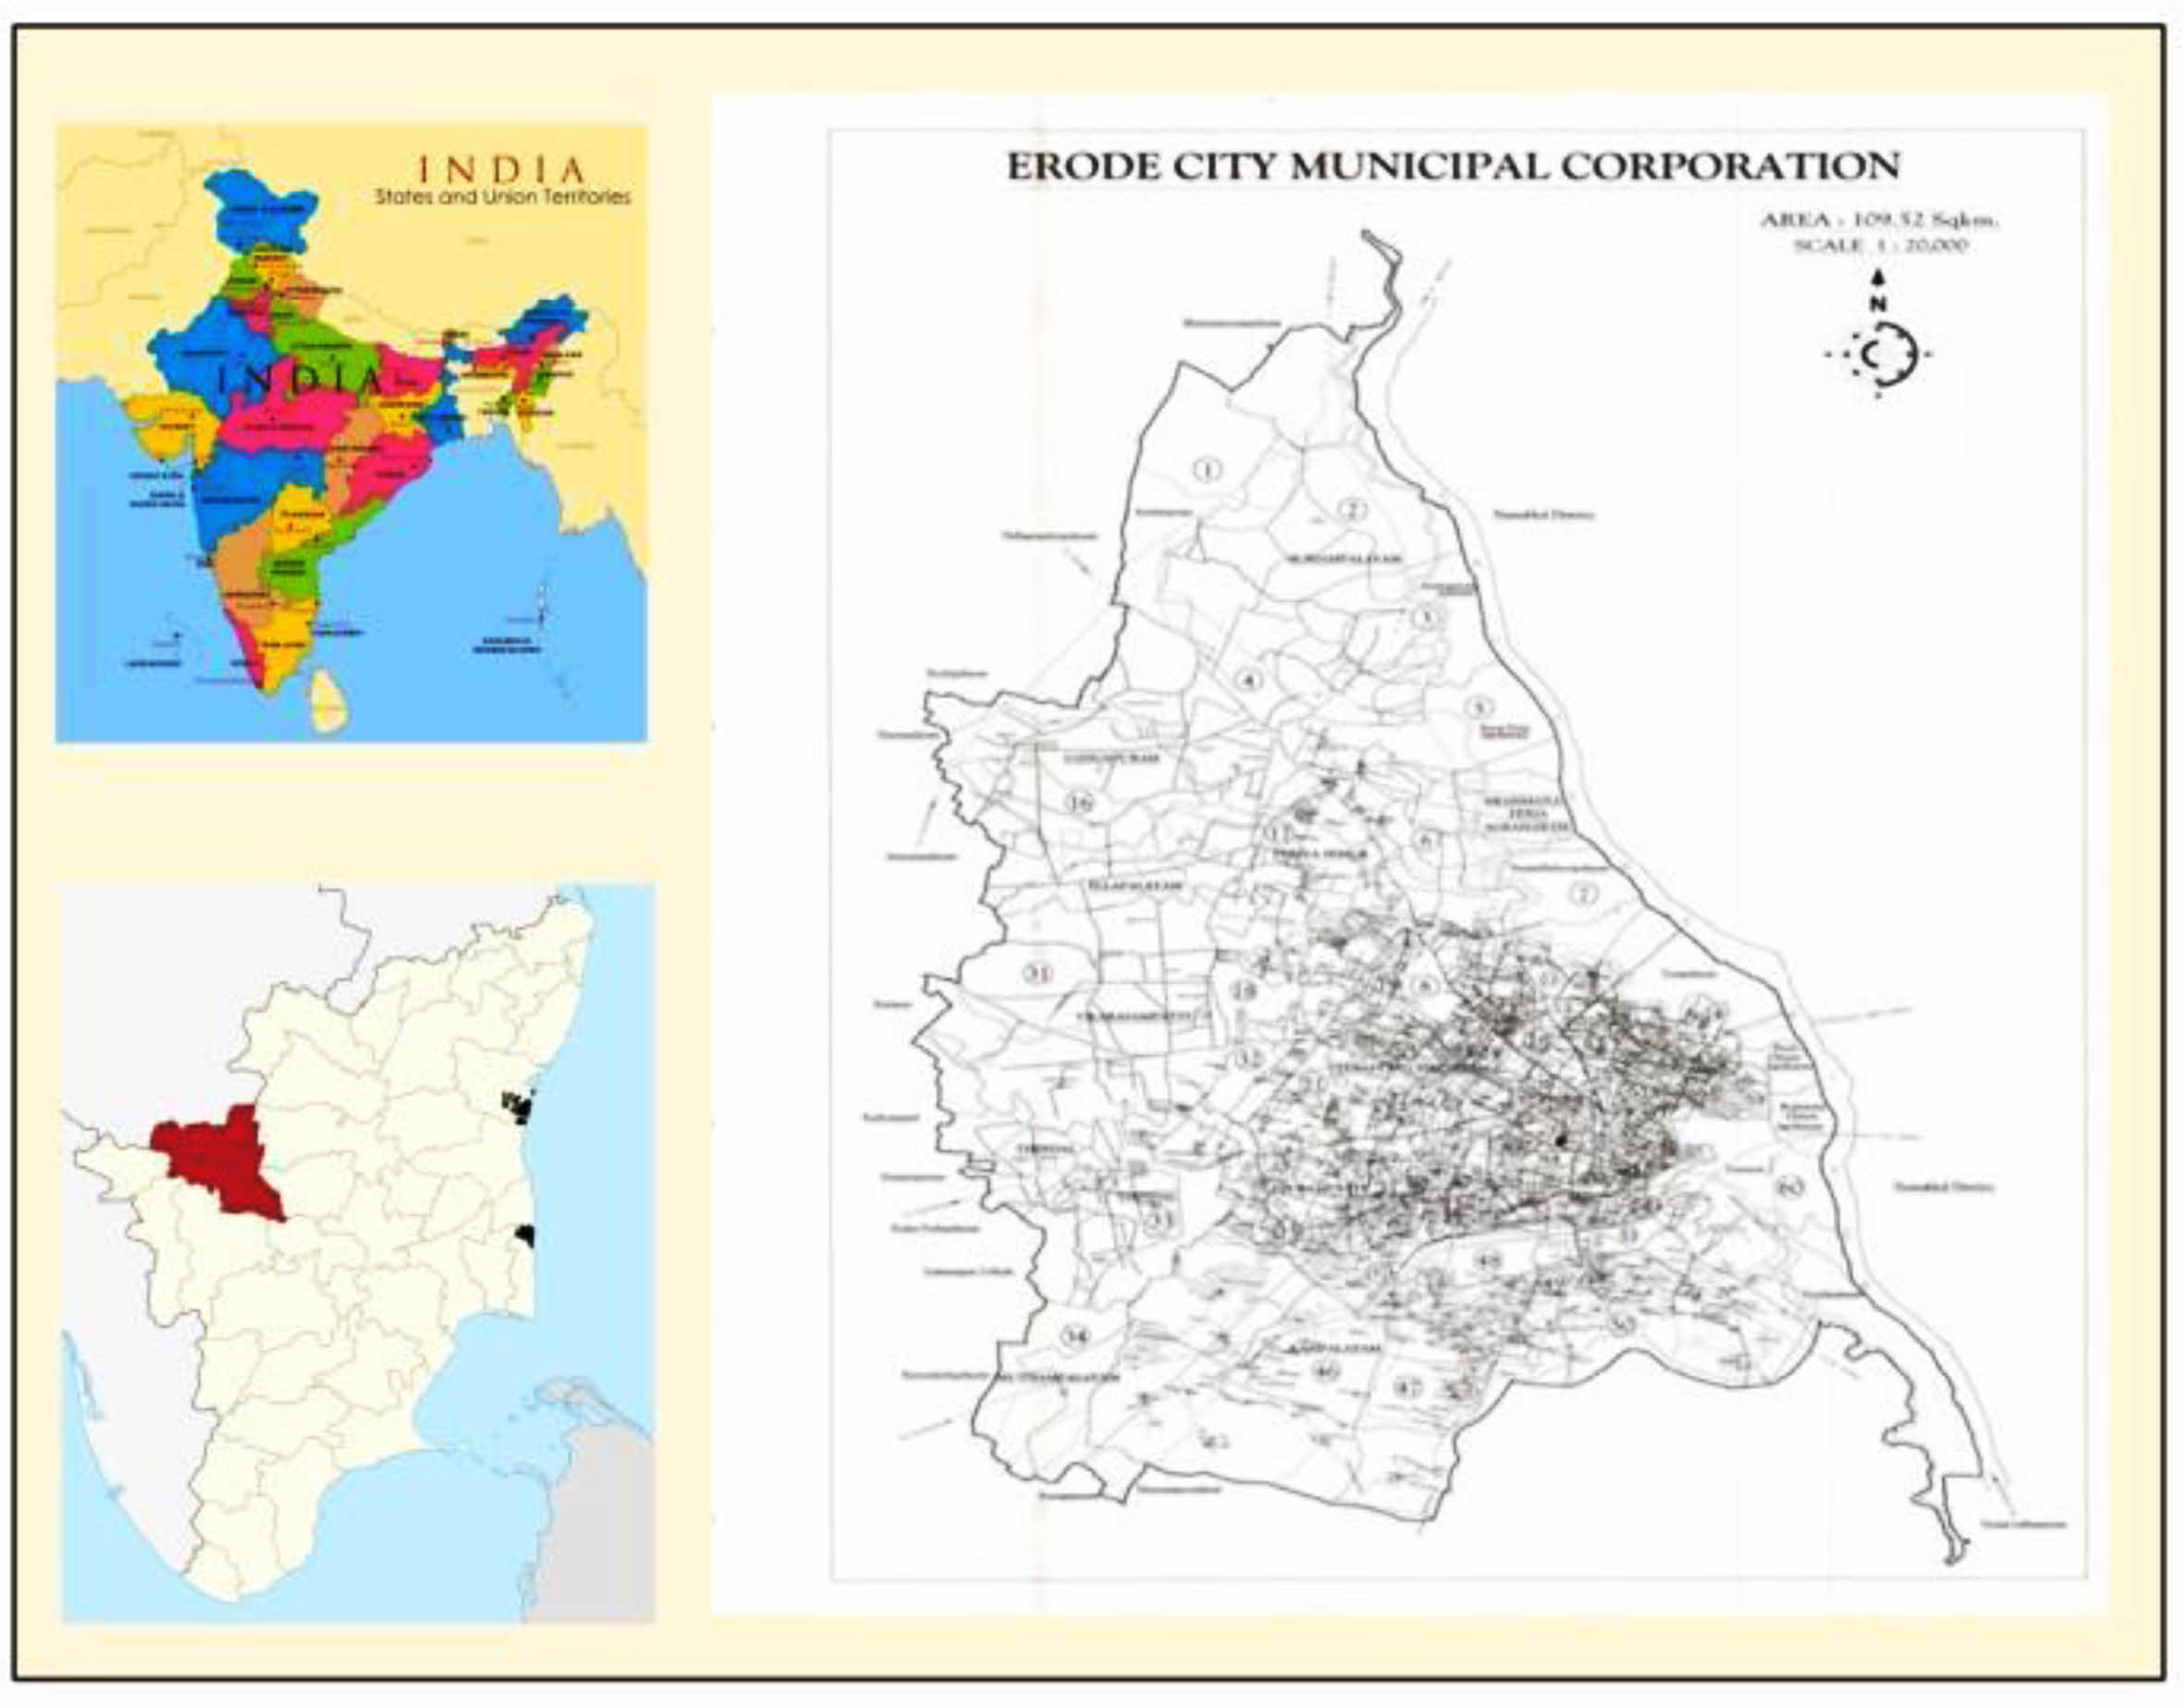
Erode District, one of the main district in Tamil Nadu's, is positioned between Latitude 11° 20'27.2" and Longitude 77° 43'1.6". Erode town is the admini- strative centre of the erode district. It is one of Tamil Nadu's most industrial districts, known for its textile, industrial, commercial, institutional, and agriculture sectors, and even the turmeric market. Its borders are in east Namakkal and Karur districts, west Coimbatore and Nilgiri districts, and south Dindugul district. Fig. 1 depicts Erode City's borders.
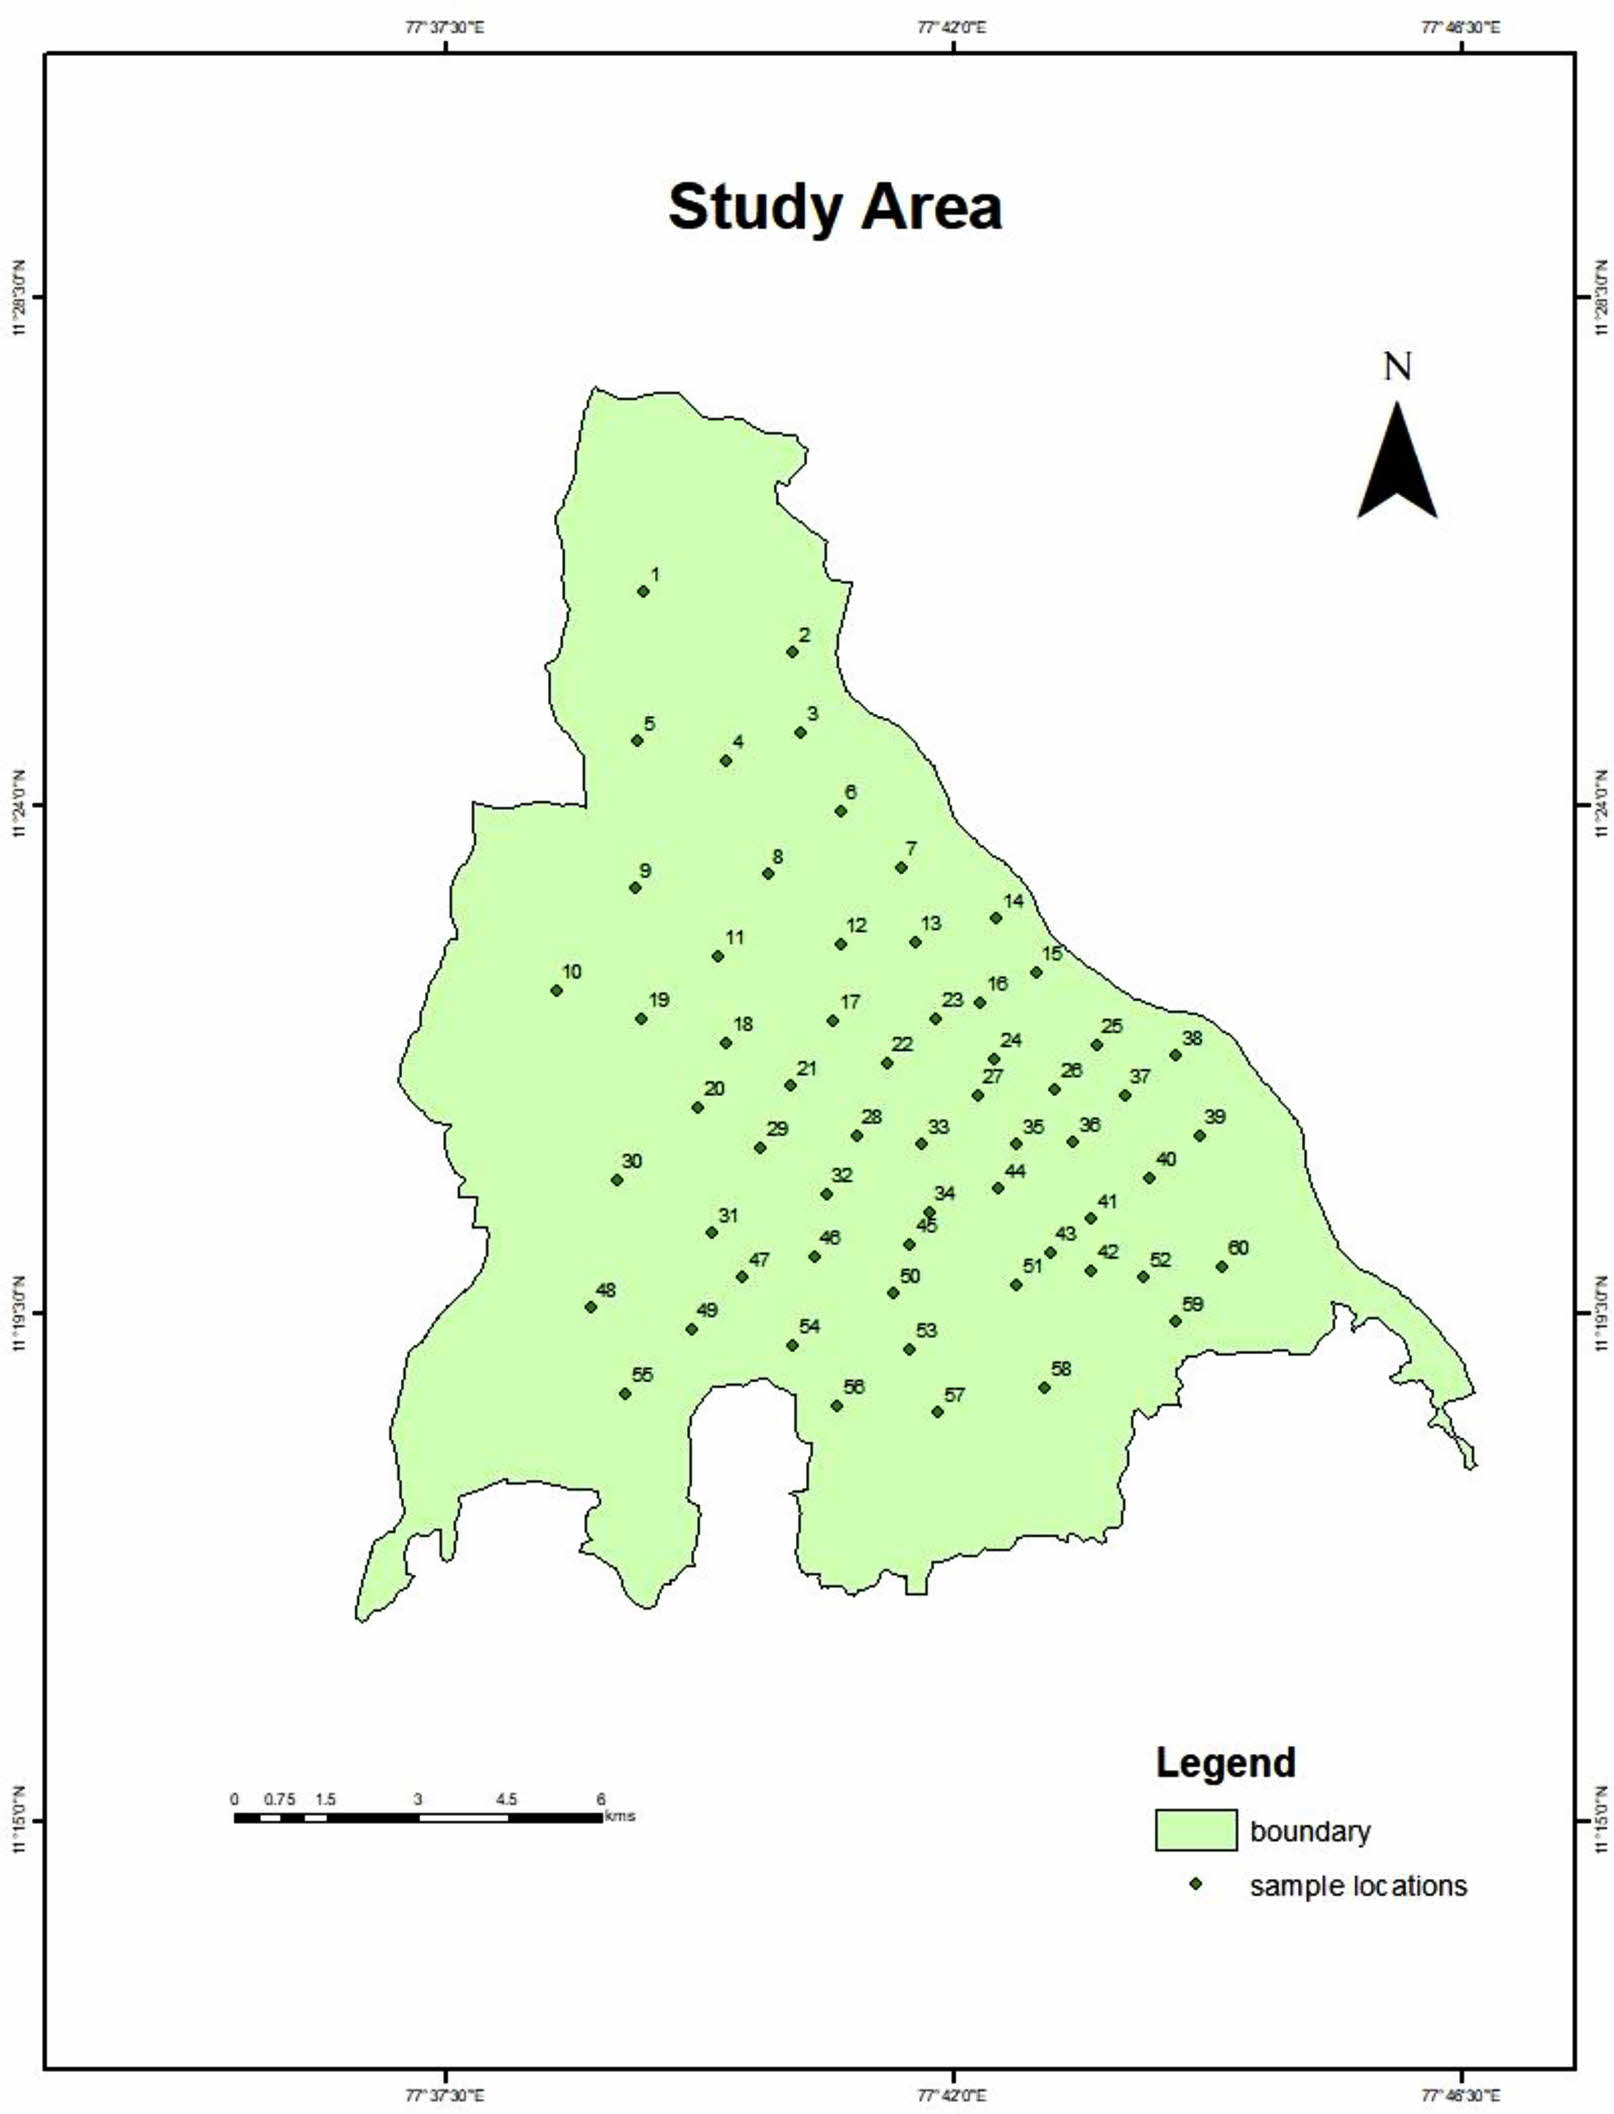
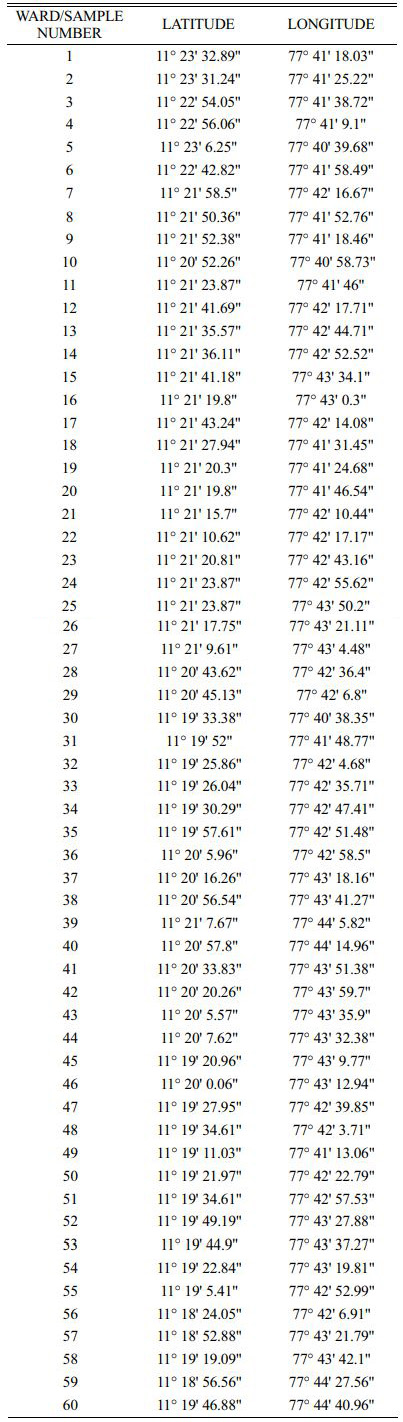
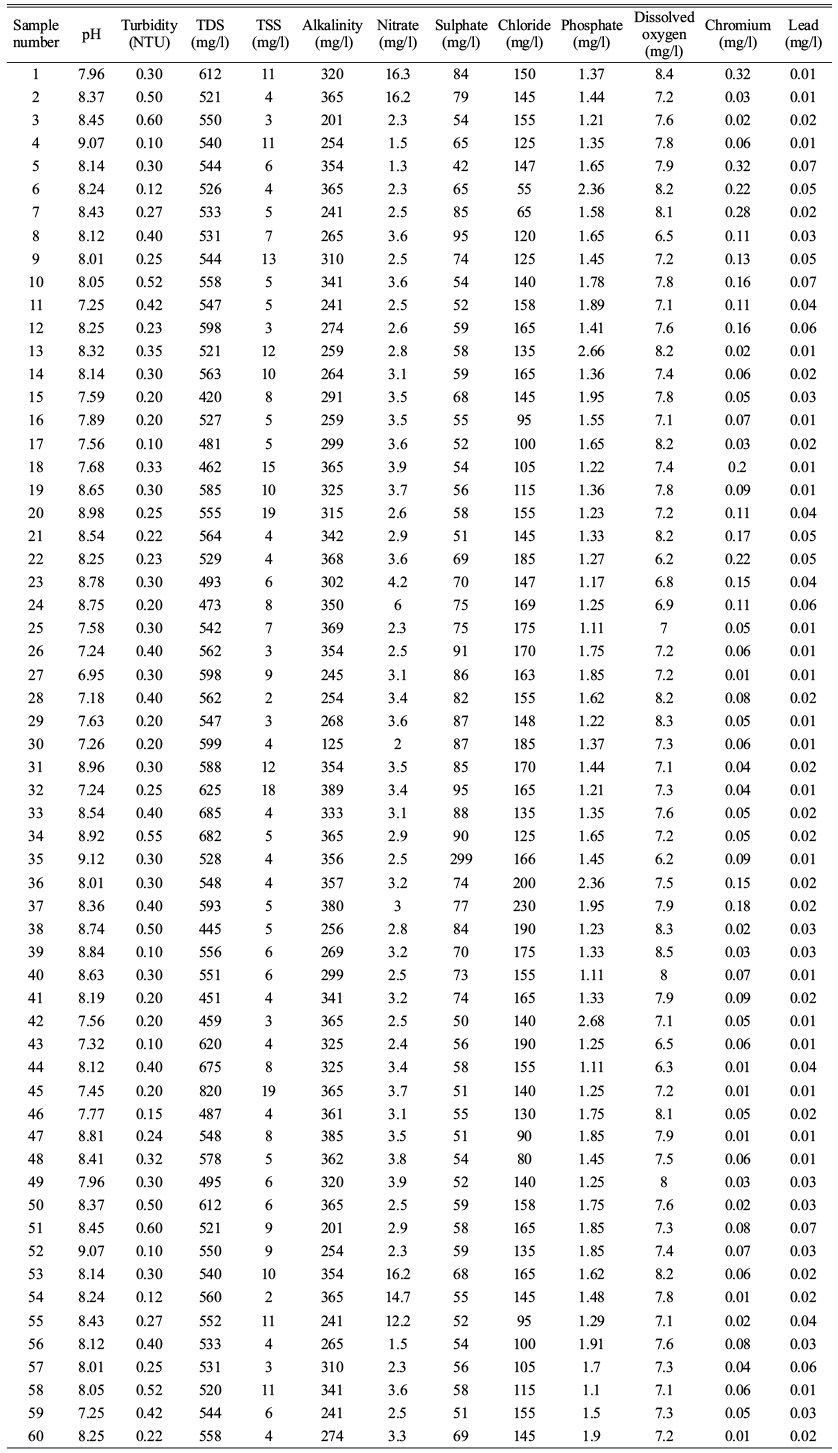
The water samples are collected from the underground water. Sixty water samples (60) are collected in Erode City. Each water sample is collected in each ward in Erode city. The sampling location are located in Fig. 2 and the location i.e., latitude and longitudinal values are mentioned in the Table 1.
It has a entire area of 109.5 sq.km. As per the 2021 census, the population of the corporation is 6,61,521 people. For a competing community like Erode, it is critical to analyse and update variations in land use patterns at different time intervals.
|
Fig. 1 Study Area (Erode City Corporation). |
|
Fig. 2 Study Area |
Water sampling
Water quality is a vital means of determining pollution levels and treatment possibilities. In truth, water quality varies by geography, weather, human activity, and site-specific factors. Non-point pollution sources, such as urban and agricultural pollutants, make discovering and executing quality improvement strategies more complex [10]. As a consequence, the geographical identification of the region in which the level of pollution will be measured is required for the spatialization of pollution risk [6].
The water samples are collected from 60 points by random sampling. Each sample has an equal chance of being selected as part of the sampling technique known as random sampling. A randomly chosen sample is intended to provide a fair representation of the entire population. The physio chemical parameters are tested and recorded and their respective spatial analysis are done. The clean bottles used to collect water samples are first properly rinsed with the water to be analysed and rinsed lasting 5 minutes before being filled with water. To determine unstable parameters including such pH, turbidity and TDS, portable instruments were used in situ. With the exception of pH and turbidity, all water quality parameters are recorded in mg/litre. Each parameter was compared to a desirable standard limit imposed for drinking water by BIS Standards (1991) and the World Health Organization (1983) for drinking and public health purposes.
Physio Chemical Parameters
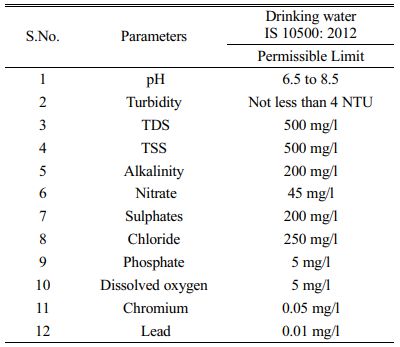
The physical and chemical parameter of water are tested with the samples that are collected as compared with the Permissible limits expressed in Table 2. The resulting values from the 60 samples collected are mentioned in Table 3.
pH, A measurement is made of the acidity or basicity of aqueous or other liquid solutions. The word converts hydrogen ion concentrations, which typically vary from 1 to 10-14 gram-equivalents per litre and are often employed in chemistry, biology, and agronomy, as values ranging from 0 and 14. Pure water has a hydrogen ion concentration of 10-7 gramme equivalents per litre and a pH of 7, making it neutral (neither acidic nor alkaline). While an alkaline or basic solution has a pH value more than 7, an acidic solution has a pH value lower than 7.
Turbidity, the cloudiness caused by very minute particles of silt, clay, and other substances suspended in water is known as turbidity. Most people are put off by even a small amount of turbidity in the drinking water. Turbidity can also make disinfection more challenging by providing a barrier for harmful organisms. Because of natural filtration as it percolates through the earth, groundwater generally has relatively low turbidity. However, turbidity levels in surface waters are typically high.
Total dissolved solids (TDS), which is described as the proportion of minerals, metals, organic material, and salts dissolved in a given water volume stated in milligrams per litre. It is closely linked to water quality and cleanliness, especially in water purification systems. Total dissolved solids levels affect everybody who lives in, consumes, or uses water. As a result, it must be monitored to ensure the purity of drinking water as well as the functioning of pipelines, valves, and other industrial equipment.
Total suspended solids (TSS) levels are commonly related to water turbidity (cloudiness). When TSS levels are too high and the water is murky, sunlight doesn't really penetrate well, making it difficult for plants and algae to develop. As a result, productivity (the quantity of plant and animal life that a river or lake can support) and oxygen creation may be reduced.
Nitrate interacts with oxygen or ozone to form nitrate, a naturally occurring chemical. Despite the fact that all living things require nitrogen, high levels of nitrate in drinking water can be hazardous to one's health, especially for newborns and pregnant women. Nitrate is naturally prevalent in surface and groundwater at amounts that are safe for people. The overuse of chemical fertilisers, as well as the improper disposal of human and animal waste, are all typical sources of excessive nitrate levels in water.
Sulphate, often known as SO4, is present in practically all natural water sources. Sulphate is primarily a pollutant that enters our water system through waste and industrial discharge, while it can occur naturally in some soils and rocks that contain sulphate minerals. Sulphate is generated in abundance from mines, smelters, paper mills, textile mills, and tanneries, which is left in industrial waste and enters streams and groundwater. Because sodium, potassium, and magnesium sulphates are all very soluble, they are the most common sulphates found in our water.
Chloride, Most natural fluids include the naturally occurring element chloride. It is most frequently discovered as a salt (sodium chloride) component or, in certain cases, in combination with potassium or calcium. Chloride in groundwater can come from a variety of sources, including weathering of soils, salt-bearing geological formations, spray deposition, salt used for de-icing roads, contributions from wastewater, and in coastal areas, intrusion of salty ocean water into fresh groundwater sources. Chloride levels in groundwater in PEI are typically low, although they can rise in regions near the ocean or in locations where roads are often salted.
Phosphates are phosphorus-containing chemical compounds. Phosphorus is a nonmetallic element that is needed for life and is found in the form of inorganic phosphates in rocks. Small amounts of minerals such as calcium, magnesium, and phosphates are carried away by water when it passes over and through rocks. Plants take in inorganic phosphates with water and combine them into organic phosphate compounds. Phosphates in water and plant material provide vital phosphorus to animals. Phosphorus content in natural waters is around 0.02 parts per million (ppm), which is a limiting factor for plant development. Large amounts of this nutrient, on the other hand, can accelerate plant development.
The presence of Dissolved oxygen (DO), It is desired in a public water supply because it improves the water's flavour. On the other side, high DO levels increase water pipe deterioration. Businesses utilise water that has the least quantity of dissolved oxygen possible as a result. The majority of boiler plant operators work to maintain oxygen levels at or below 0.007 parts per million, even though the water used in extremely low-pressure boilers has no more than 2.0 parts per million of DO. Whether caused by chemical reactions, microbial activity on raw sewage, or dead vegetation, organic matter and nutrients decomposition in water can significantly lower dissolved oxygen levels.
Heavy Metals
Chromium, the tanning industries are the main sources of chromium compounds in the environment. Chromium is found in two different forms: Cr(VI) and Cr(III) (III). Cr(III) has been shown to be physiologically important to mammals because it ensures proper glucose, lipid, and protein metabolism. Cr(VI), on the other hand, is extremely hazardous because it may permeate through cell membranes as CrO4 or HCrO4. Chronic ulcers, dermatitis, corrosive response in the nasal septum, and local effects in the lungs are all major toxic consequences of Cr(VI).
Lead, The main sources of lead in the environment are commercial releases from mining, smelting, recycling, and biomass burning. Inorganic lead is mostly ingested through food and water, although it is also found in significant amounts in soil, dust, air, and paint chips. For most part, eating or drinking result food or inhaling lead-contaminated air for a short period of time has no negative consequences. It can cause nausea, vomiting, diarrhea, and renal damage in rare situations. Long-term exposure can induce anemia, fatigue, and irritability, as well as headaches, muscle tremors, kidney or liver damage, nausea, vomiting, and high blood pressure. Because people who were exposed to lead at work acquired lung, bladder, and kidney cancer, the International Agency for Research on Cancer classified lead and its compounds as probably carcinogenic to humans.
Low-cost ceramic membranes:
Numerous substitutes for pricey raw materials, such as zirconia, titania, alumina, and silica, were produced. Ceramic membranes were produced using natural clays such kaolin clay, ball clay, bentonite clay, and dolomite, as well as various earth minerals include natural pozzolan, magnesite, phosphate, and perlite [2, 4, 12, 13]. Creating ceramic membranes from industrial wastes like fly ash and rice husk ash has not been explored by many researchers (RHA) [16, 18]. Membrane raw materials are typically chosen because they are abundant locally. Alternative raw material ceramic membranes provide equivalent thermal, chemical, and mechanical stability to commercially available ceramic membranes for a fraction of the cost, resulting in widespread application. Heavy metals and the removal of suspended particles from aqueous solutions are just a few of the microfiltration applications for these low-cost ceramic membranes. They were also used to support ultrafiltration and nanofiltration membranes as coarse mechanical porous supports [3, 14]. Since the most advantageous ceramic membranes may be made from inexpensive raw materials, the manufacture of low-cost ceramic membranes is becoming more and more alluring. With a sufficiently uniform pore shape, narrow pore size distribution, and high open porosity, a suitable ceramic membrane support should be defect-free and robust enough to support the membrane [7].
Water quality assessment using GIS
ESRI's ArcGIS application was utilized for data entry, processing, and mapping. The Erode city base map is accessible on the Bhuvan website under the Jal Sakthi Abhiyan scheme's blocks map. The sample points placements were determined using 'Google Earth' after the base map was transformed from raster to vector data. ArcCatalog was used to generate the database of water quality indicators in order to represent the process behind the mapping [9]. ArcGIS 10.3 extensions were used for the analysis, interpolations, and mapping.
Procedure for GIS mapping
For mapping, editing, analysis, and data management in ArcGIS for Desktop, ArcMap has been the main tool. The Inverse Distance Weighted (IDW) approach was carried out with ArcGIS 10.3 in the Spatial Analyst Extension. The experimental results from the laboratory study of water samples collected from 60 locations inside Erode municipal limits were combined into an excel file, then translated into a shapefile. The overage of the data obtained for each parameter from the measured sites was employed in the computation of each interpolated cell. On the output raster, the cells corresponding to the Erode City region got the values of the first input raster. Water quality ratings were based on pollutant geographic distribution with a map legend based on each parameter's data range.
Interpolation using GIS
The spatial interpolation was done with the ArcGIS. Interpolation using Inverse Distance Weighted (IDW) in the Geostatistical Analyst toolbar. A technique that is frequently used in variable mapping is IDW interpolation. It only fits a continuous model of spatial variation and is a convex, precise approximation approach. This method is based on locations that are only evaluated by proximity and was developed in mining and geological engineering. To estimate the value of a variable in some various destinations, information value collected from a known place is employed [11]. Fig. 3
Overlay Analysis of Water quality
With the results of Inverse Distance Weighted Interpolation, the outputs are overlayed with weighted overlay analysis is done [5]. One of the most common techniques for overlay analysis is applied by the Weighted Overlay tool to address multi-criteria issues including site selection and appropriateness models. The final results express the places where the water contamination is maximum, medium or low levels in the Erode city limit which is shown in Fig. 4.
Water treatment with low-cost ceramic membrane
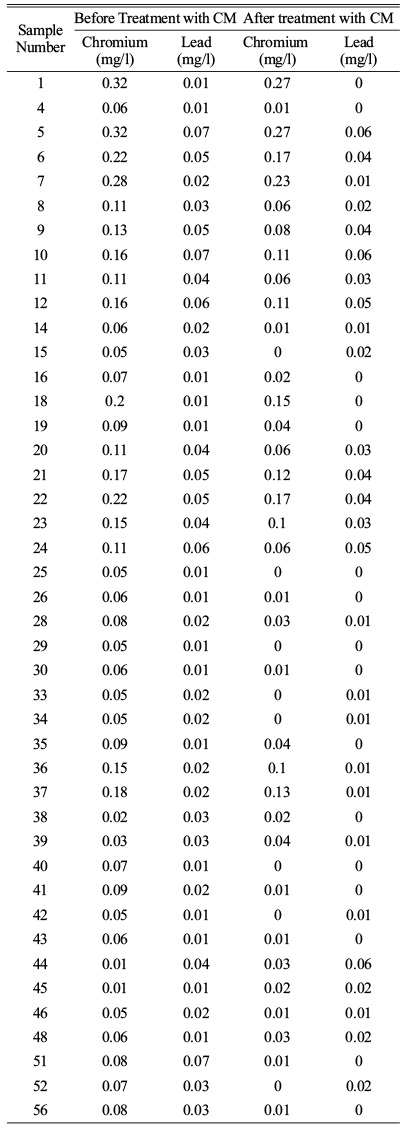
As the study area is within Erode city limit, the industries present within the area are tanneries and dyeing industries. The contamination present in ground water are chromium and lead are exceeding the permissible limit. The final contamination level is expressed with Weighted Overlay Analysis. The water is treated with low-cost ceramic membrane as the water has the high values in TDS, TSS, alkalinity and heavy metals like chromium and lead. The water is made ready to treat with the ceramic membrane. As they are treating the impurities in waste water so it is usual for the drinking water treatment [1]. Membranes made from natural clay and natural perlite performed well in tannery wastewater treatment, with a turbidity rejection of more than 95%. In the case of a few membranes, however, no substantial change in pH was seen following treatment. The heavy metals reduction rate after the treatment of water sample greater than permissible limit with low-cost ceramic membrane which are is expressed in Table 4 [8].
The reduction levels of heavy metal chromium and lead are done with CM. The Sample having greater than the permissible limits are chosen and their reduction is compared with the other through bar graph 1.
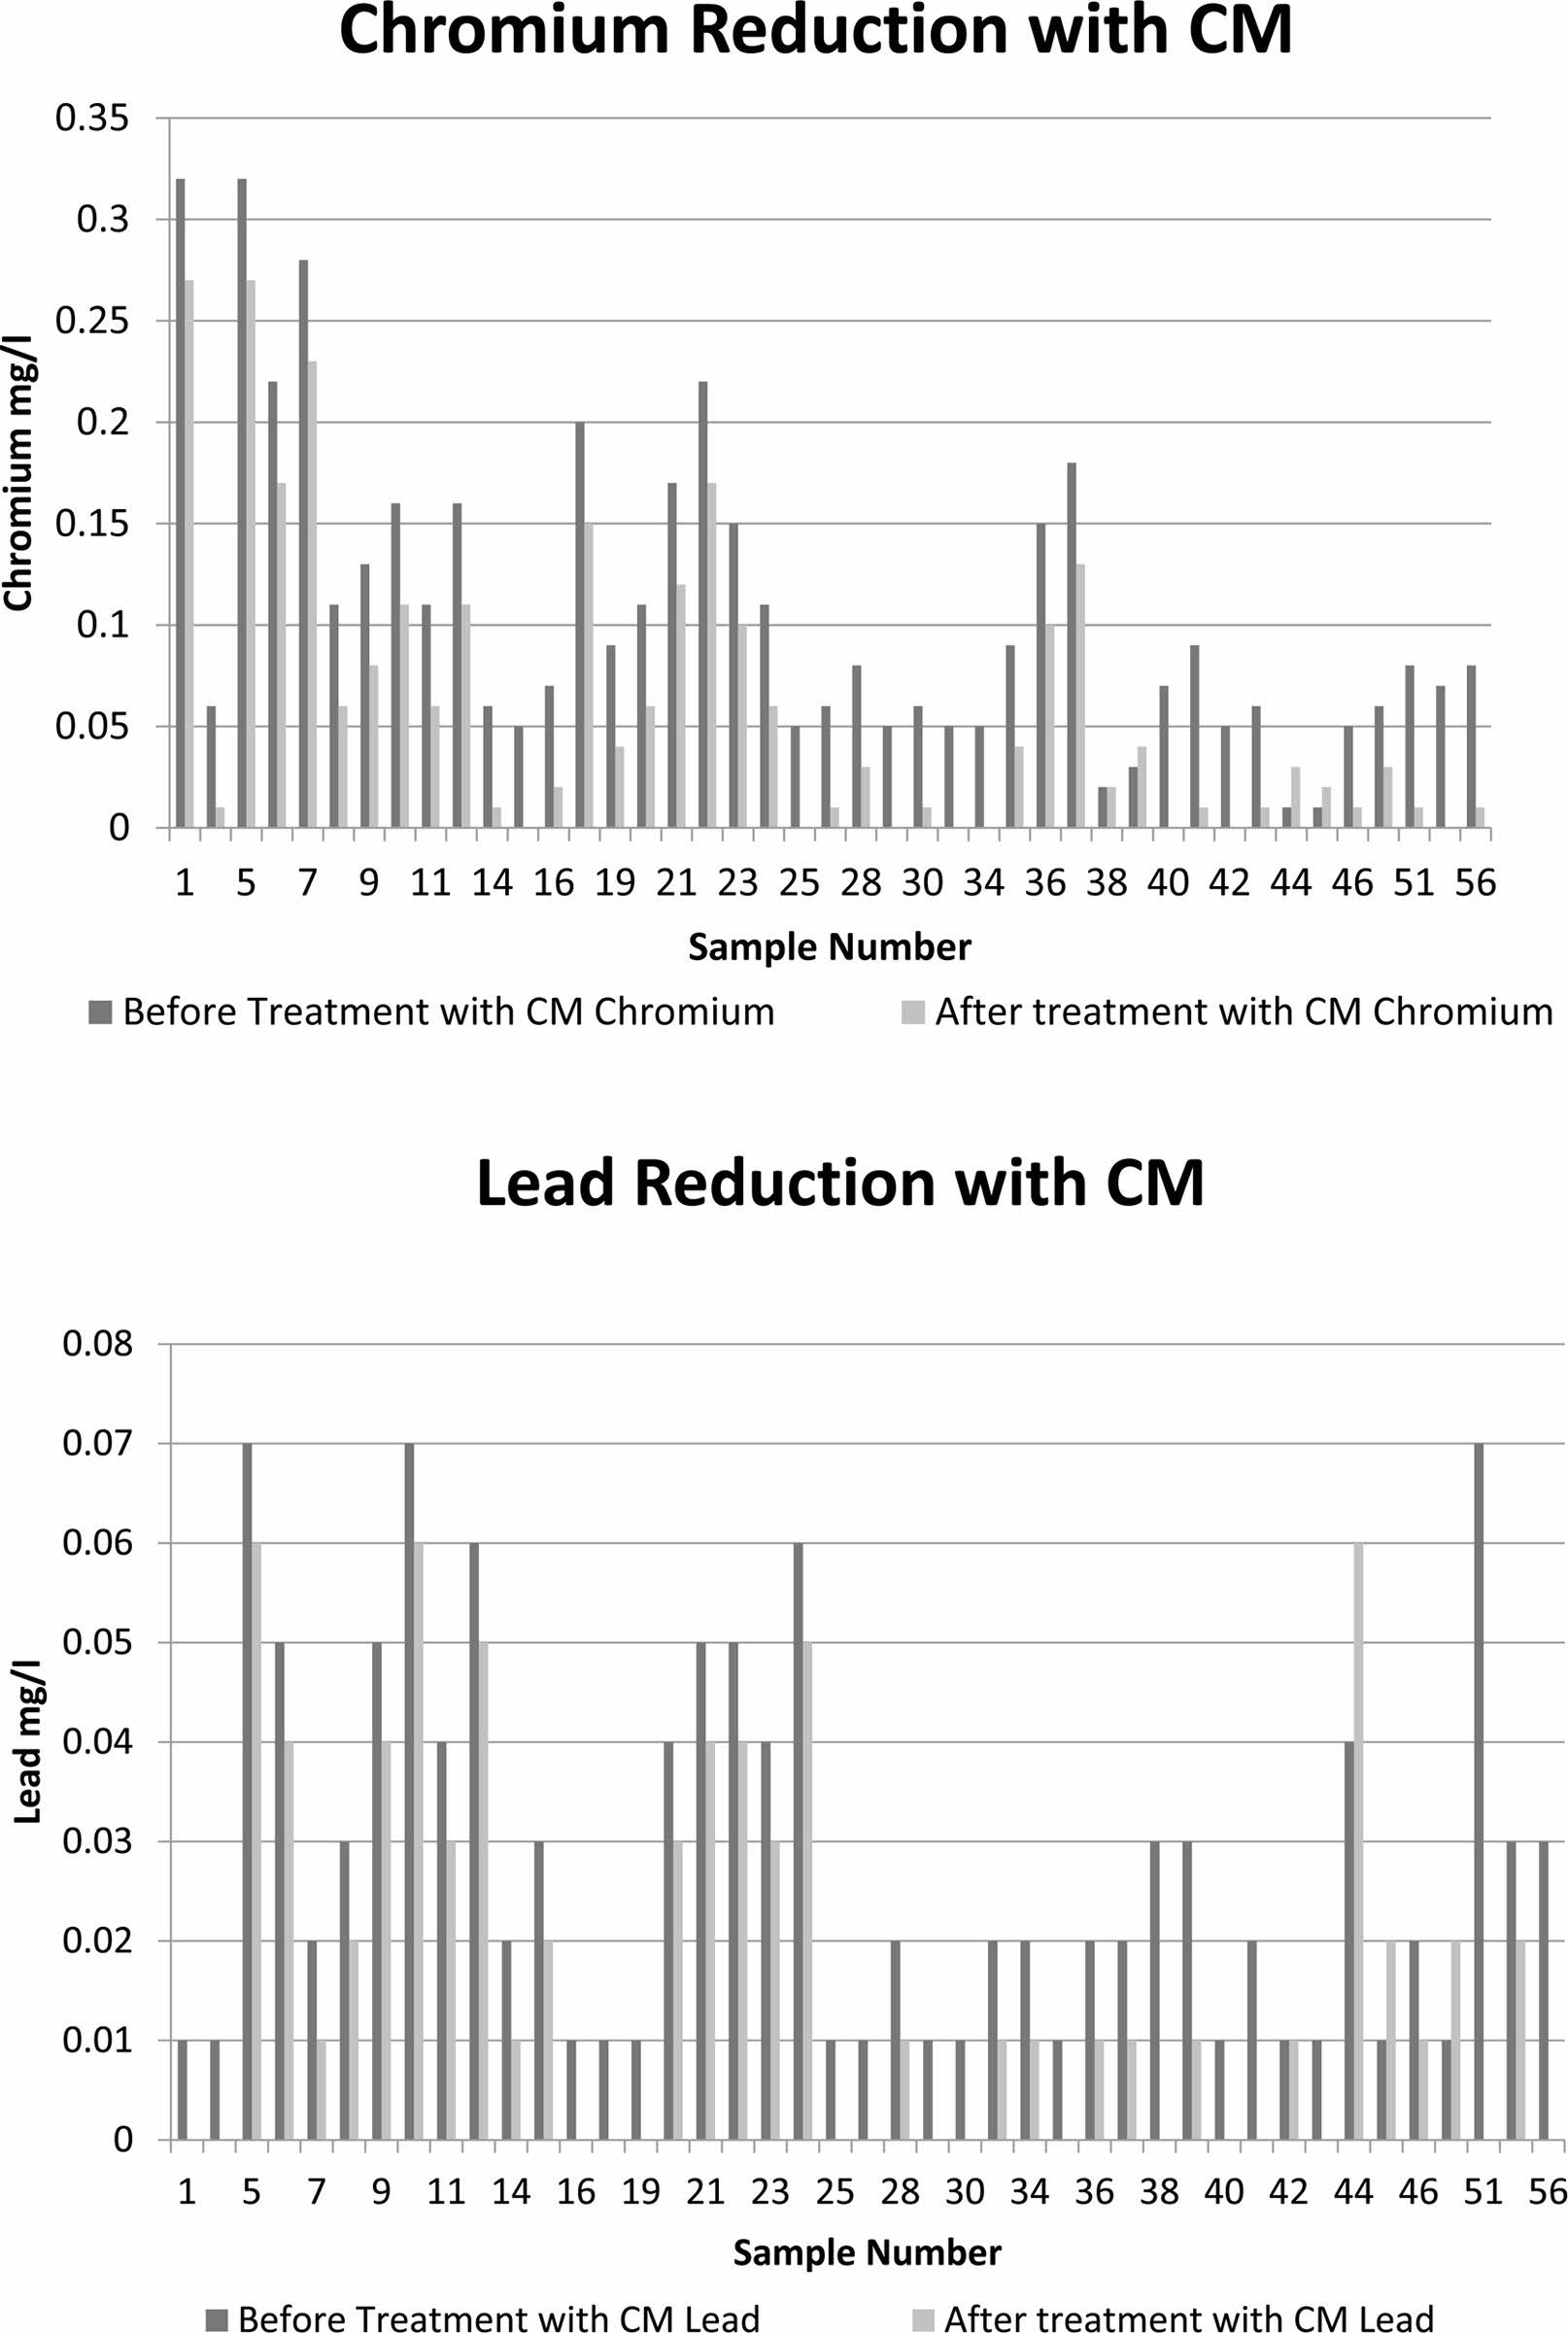
Graph 1. Heavy metal reduction with CM.
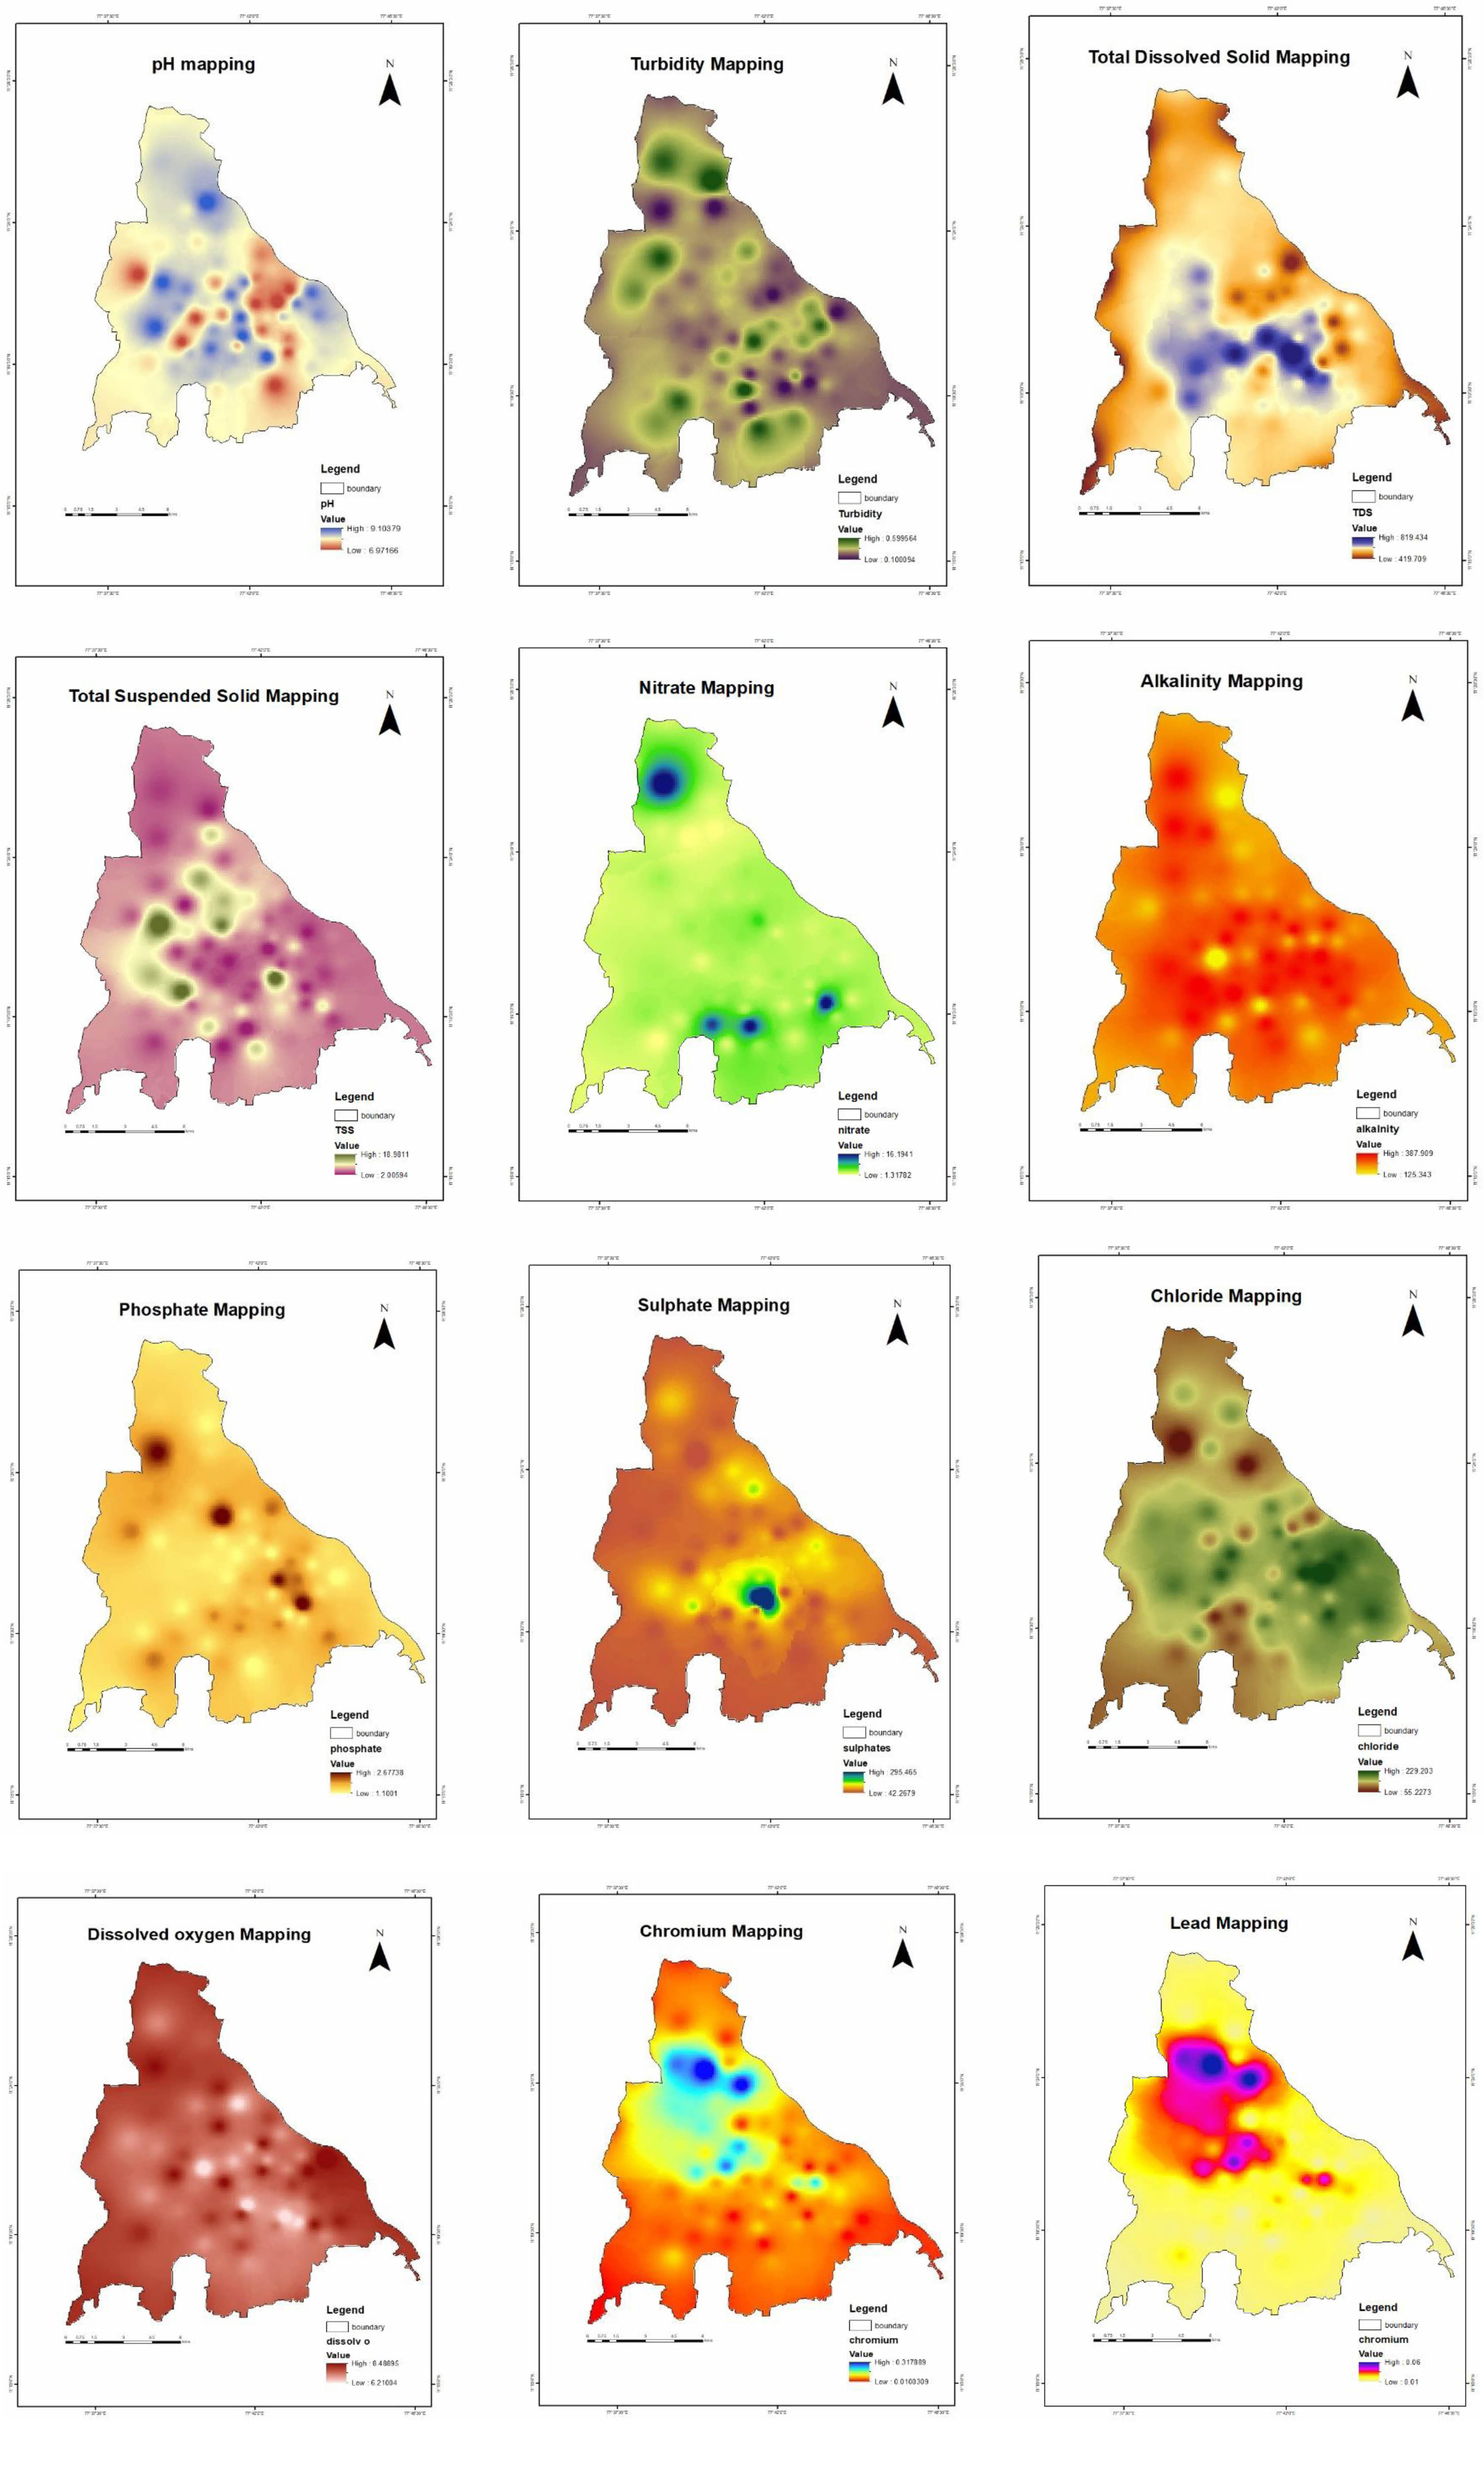
|
Fig. 3 Physio Chemical parameters of Water Samples |
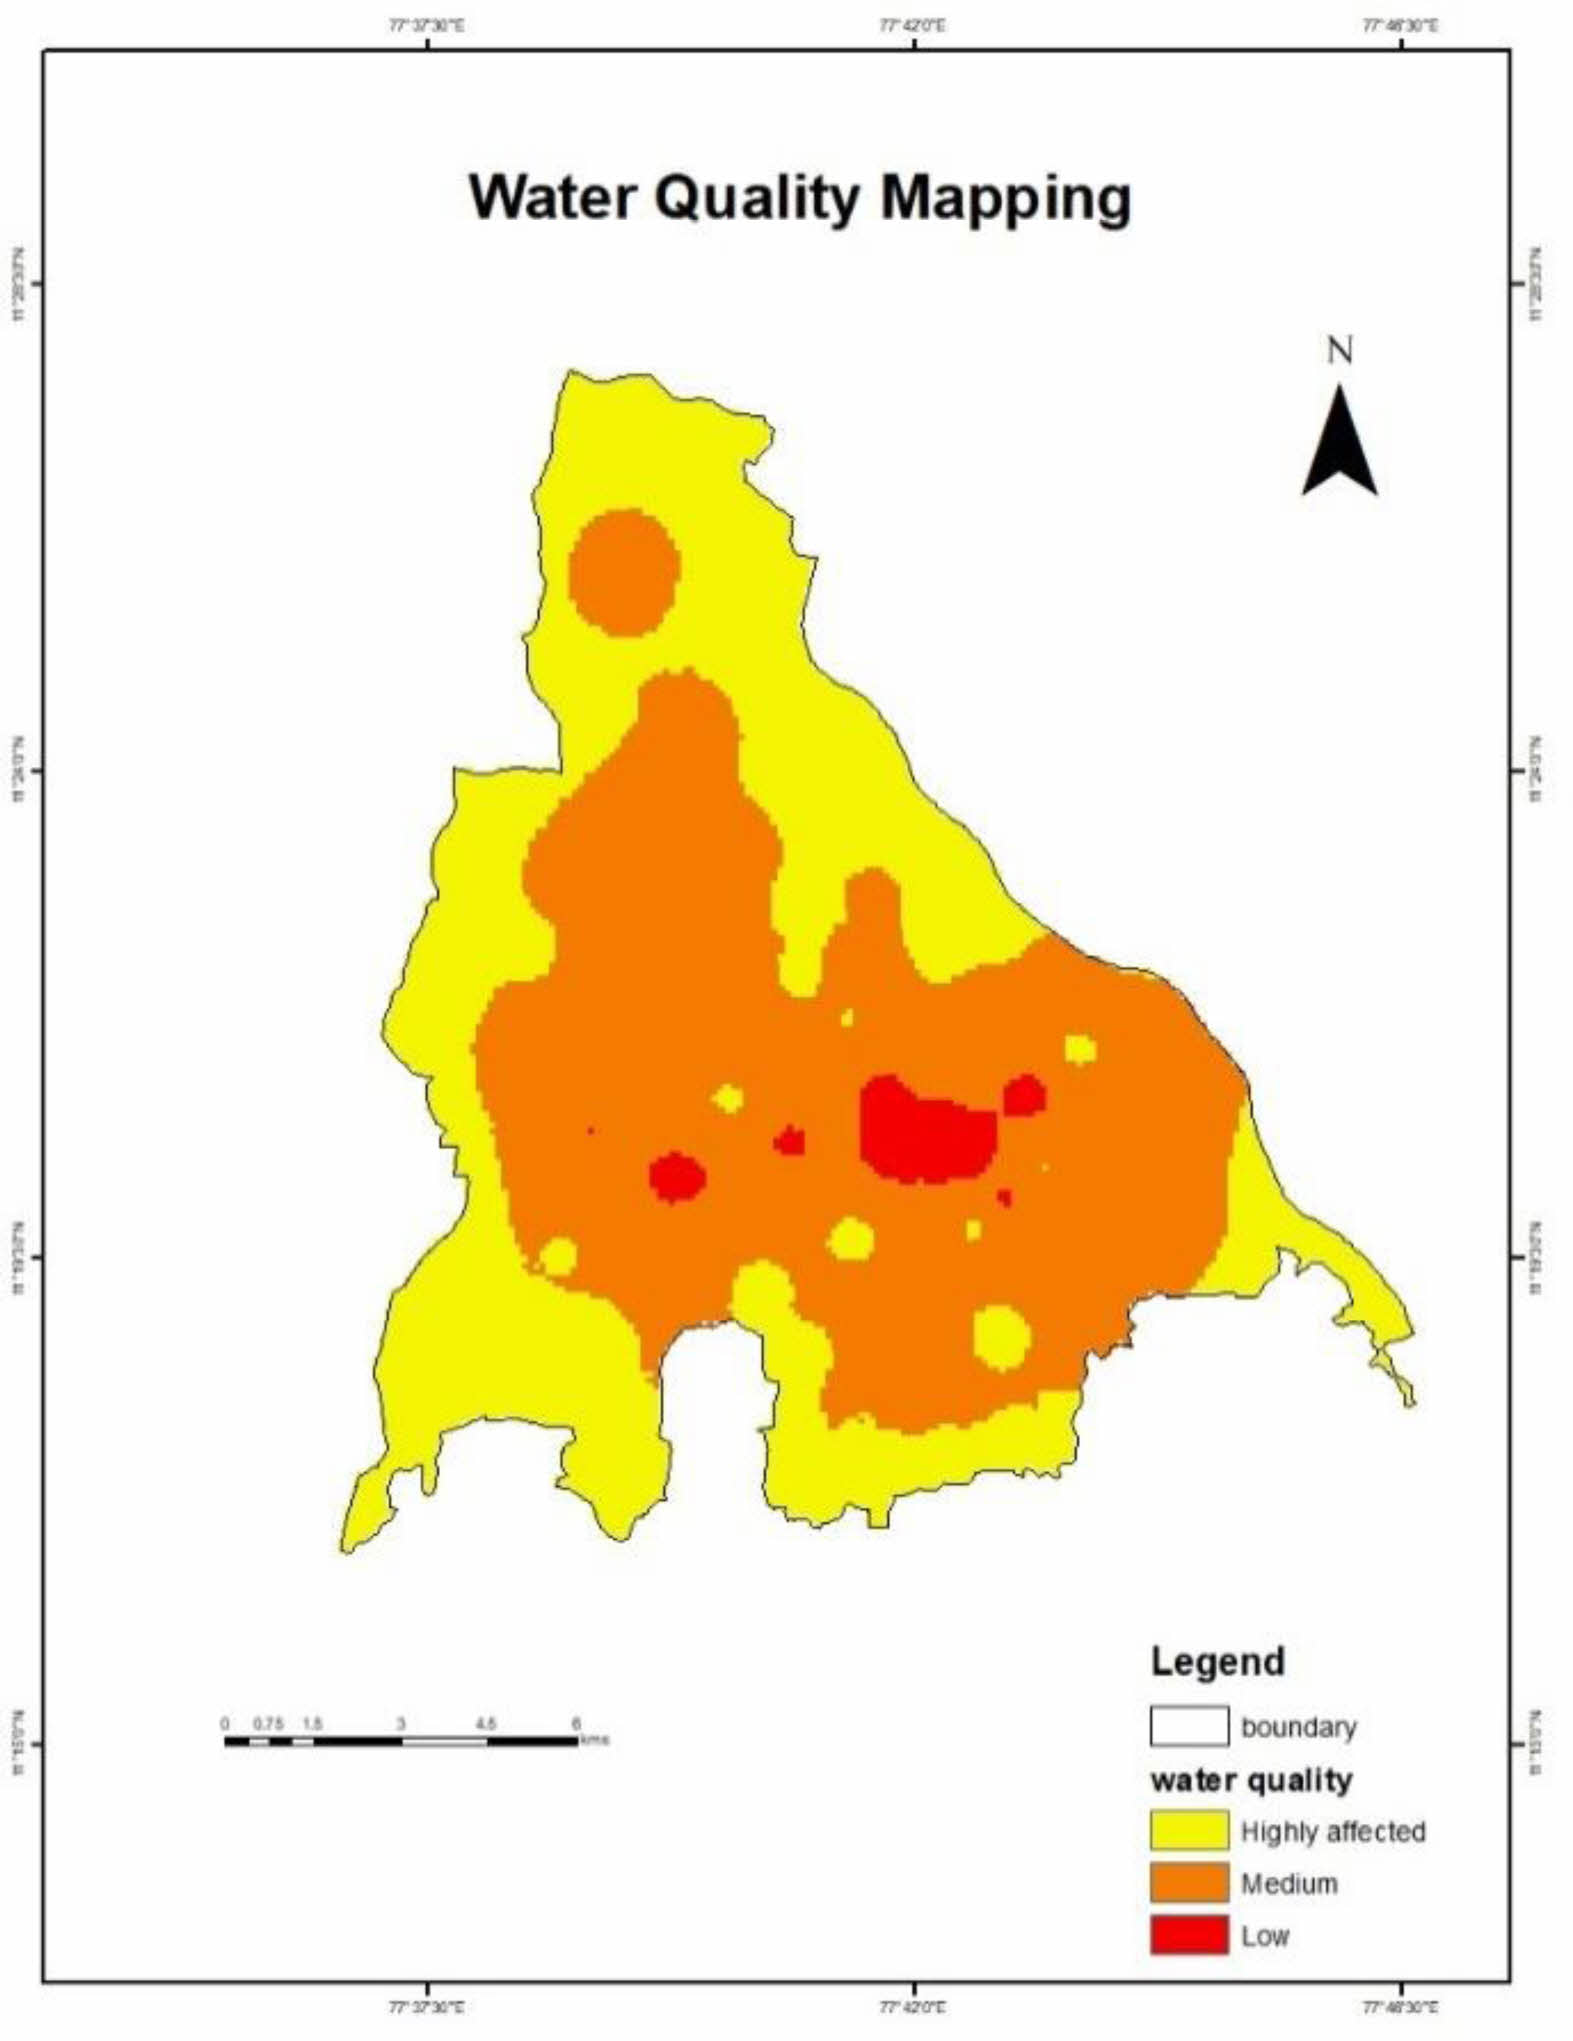
|
Fig. 4 Water Quality Mapping. |
Several low-cost raw materials, including as kaolin, dolomite, bentonite, fly-ash, RHA, and others, have been proposed by various researchers to reduce the cost of commercially available ceramic membranes. In addition to the initial ingredients, additives such as pore formers and binders have a significant impact on the membrane's characteristics. The raw material composition, sintering temperature, pore formers, and manufacturing technique also have an impact on the membrane's properties. Most inexpensive ceramic membranes have more than 30% porosity, which is comparable to traditional ceramic membranes. The majority of membranes with pores between 0.1 and 5 metres are considered suitable for microfiltration applications, according to studies in the literature. Membranes that can withstand harsh environments have been reported to have sufficient mechanical and chemical resistance. The commercialization of these procedures requires extensive study since ceramic membranes, which are inexpensive, have been used in many different water treatment applications. To achieve ideal circumstances with the least amount of work, the complete fabrication process and application procedure need to be modelled.
- 1. A. Bouazizi, Majda Breida, Abdelaali Karim, and Saad. Alami Younssi, Ceram. Int. 43[1] (2017) 1479-1487.
-

- 2. A. Majouli, S.A. Younssi, S. Tahiri, A. Albizane, H. Loukili, and M. Belhaj, Elsevier Science 277[1-3] (2011) 61-66.
-
- 3. A. Majouli, S. Tahiri, S. Alami Younssi, H. Loukili, and A. Albizane, Ceram. Int. 38[5] (2012) 4295-4303.
-
- 4. B.K. Nandi, R. Uppaluri, and M.K. Purkait, Flux decline mechanism and economic feasibility 44 (2009) 12.
-
- 5. C.A.Yan, W. Zhang, Z. Zhang, Y. Liu, C. Deng, and N. Nie, PLoS One 10, e0119130 (22015).
-
- 6. C. Ferronato, M. Modesto, I. Stefanini, G. Vianello, B. Biavati, and L.V. Antisari, J. Water Resour. Prot. 5 (2013) 458.
-
- 7. D. Vasanth, R. Uppaluri, and G. Pugazhenthi, Separ. Sci. Technol. 46[8] (2011) 1241-1249.
-
- 8. F. Bouzerara, A. Harabi, and S. Condom, Desalin. Water Treat. 12[1-3] (2009) 415-419.
-
- 9. G. Kanagaraj and L. Elango, Environmental Science and Pollution Research 23 (2016) 24364-24383.
-
- 10. K. Haldar, K. Kujawa-Roeleveld, P. Dey, S. Bosu, D.K. Datta, and H.H. Rijnaarts, Sci. Total Environ. 708 (2020) 134559.
-
- 11. N.L. Jones, R.J. Davis, and W. Sabbah, Groundwater 41 (2003) 411-419.
-
- 12. P. Monash and G. Pugazhenthi, Int. J. Appl. Ceram. Technol. 8[1] (2011) 227-238.
-
- 13. R. Vinoth Kumar, A. Kumar Ghoshal, and G. Pugazhenthi, J. Membr. Sci. 490 (2015) 92-102.
-
- 14. S. Jana, A. Saikia, M.K. Purkait, and K. Mohanty, Chem. Eng. J. 170[1] (2011) 209-219.
-
- 15. S. Mtetwa, S. Kusangaya, and C.F. Schutte, Water Sa 29 (2003) 189-194.
-
- 16. S.K. Hubadillah, M.H.D. Othman, Z. Harun, A.F. Ismail, M.A. Rahman, and J. Jaafar, Ceram. Int. 43[5] (2017) 4716-4720.
-
- 17. W. Ahmed, A. Vieritz, A. Goonetilleke, and T. Gardner, Appl. Environ. Microbiol. 76 (2010) 7382-7391.
-
- 18. Y. Dong, Stuart Hampshire, Jian-er Zhou, Bin Lin, Zhanlin Ji, Xiaozhen Zhang, and Guangyao Meng, J. Hazard Mater. 180[1-3] (2010) 173-180.
-
 This Article
-
2022; 23(6): 892-901
Published on Dec 31, 2022
- 10.36410/jcpr.2022.23.6.892
- Received on Jun 28, 2022
- Revised on Oct 1, 2022
- Accepted on Oct 26, 2022
Services
- Abstract
introduction
study area
data and methods
results and discussion
conclusion
- References
- Full Text PDF
Shared
Correspondence to
- K. Santhosh Kumaar
-
Assistant Professor, Department of Civil Engineering, Kongu Engineering College, Perundurai, Erode, Tamil Nadu, India
Tel : +918838874675 - E-mail: skumar.civil@kongu.edu
Clean-Energy Research Institute(CRI), Hanyang University, 222, Wangsimni-ro, Seongdong-gu, Seoul, 04763, Korea
E-mail: jcpr@hanyang.ac.kr