


- Power-to-gas systems with a focus on biological methanation
Seongcheol Kang#, Anil Kuruvilla Mathew#, Amith Abraham*, Okkyoung Choi and Byoung-In Sang*
Department of Chemical Engineering, Hanyang University, 222 Wangsimni-ro, Seongdong-gu, Seoul 04763, Republic of Korea
This article is an open access article distributed under the terms of the Creative Commons Attribution Non-Commercial License (http://creativecommons.org/licenses/by-nc/4.0) which permits unrestricted non-commercial use, distribution, and reproduction in any medium, provided the original work is properly cited.
Power to Gas (P2G) systems aim to store surplus renewable electricity generated in the form of gaseous fuels such as hydrogen or methane. The concept is ideal for storing the surplus energy for long periods in gaseous form and can be used in the future for desired end applications, i.e. either in gaseous form or electricity. In the P2G process, the surplus renewable energy converts into methane (gaseous form) in a two-step process: electrolysis followed by methanation. The electrolysis process is used as the source for hydrogen generation, which further reduces carbon dioxide to produce methane. In this review, different electrolyzers and methanation processes are compared for the P2G process. The major process parameters and hydrogen gas-liquid mass transfer are discussed by comparing different process conditions and reactor configurations used in biological methanation. An understanding of the techno-economic analysis indicates that cost of the hydrogen generation is the key factor that determines the overall economics of the P2G system. The cost of hydrogen generation is associated with the capital cost of the electrolyzer and the cost of the electricity. It is expected that once this technology becomes mature, the economics of P2G systems will improve in the future
Keywords: Power to gas, Renewable electricity, Renewable natural gas, Methanogens, Carbon dioxide
The global renewable electricity generation is forecast to increase by 60% between 2020 and 2026, reaching more than 4800 GW. The major contributions of renewable electricity generation were sourced from hydro, wind power, and solar PV [1]. From the recent figures of the International Energy Agency (IEA), the installation of renewable energy sources such as wind and solar power stations increases globally and thereby expected the generation of surplus electricity [1]. The electricity generation from these renewable sources can vary depending on the seasons or different time intervals of a day and cause fluctuations in the electricity generation, which can affect the continuous supply of renewable electricity to the grid [2]. To avoid those fluctuations, the surplus electricity produced needs to be stored efficiently and could be used when required. Therefore, the storage of surplus electricity is of current research attention for various end applications such as household, industrial, or transport applications [3].
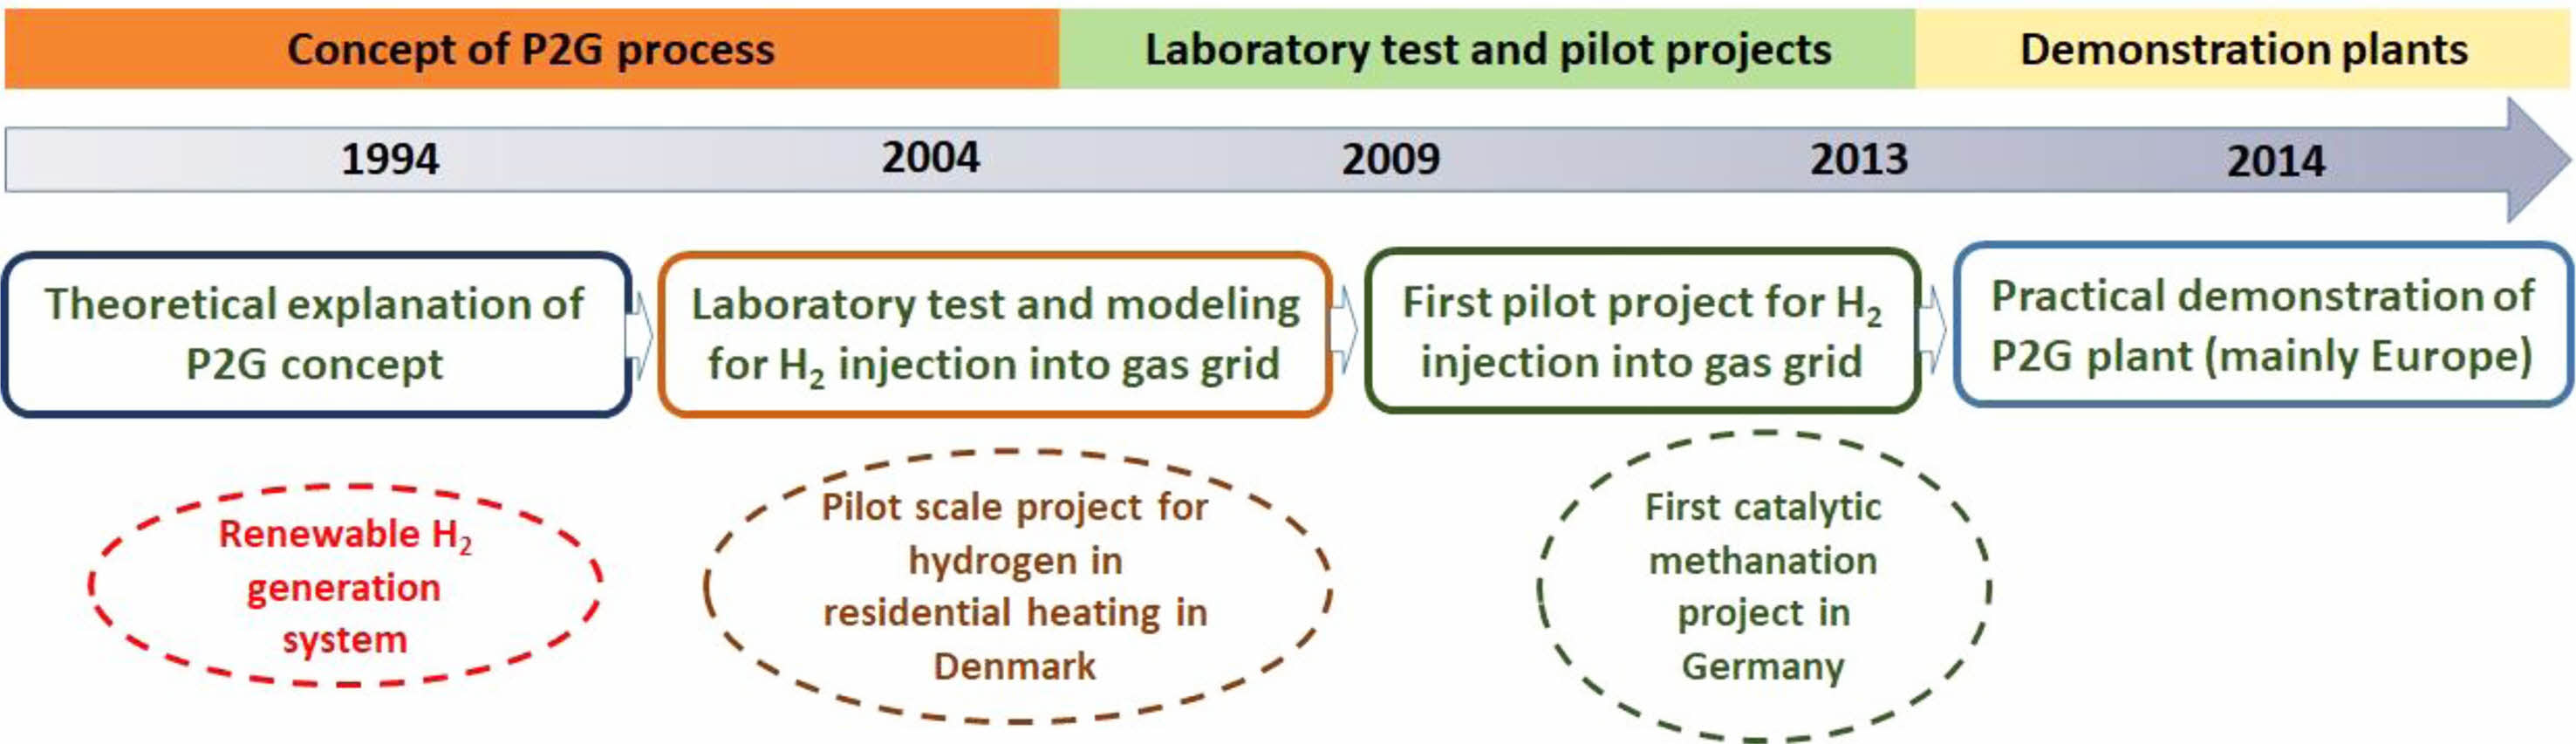
Power to Gas (P2G) is one such approach to store the surplus electricity produced from renewable sources in gaseous form, which enables their long-term storage. In the last few years, P2G has become a promising technology (Fig. 1) or process to enable long-term storage of surplus electricity generated using renewable technologies [4]. The storage of surplus electricity can either be in the form of hydrogen or methane and is known as Power to Hydrogen (P2H) or Power to Methane (P2M), respectively. Hydrogen was the primary product of the P2G process and many efforts were made for the development of a hydrogen-based economy [5]. However, the lack of infrastructure for distribution and the lack of a well-established market are the major hurdles to the P2H concept [6]. Due to this issue, the P2G process was centered on technologies that can produce gas like methane which can use existing infrastructure for distribution and have an already existing market [7]. The Power to Methane (P2M) process utilizes the hydrogen gas produced from water electrolysis using renewable electricity and carbon dioxide to form methane. The methane can be used for direct fuel applications, further steam reforming [8], and as precursors for carbon materials [9]. The advantage of the P2M approach is that it can use existing infrastructure for the distribution of methane and has a higher energy density of methane (36 MJ/m3) over hydrogen (10.88 MJ/m3) [10], which allows for storing more energy per unit area. The storage cost of methane is three times lower than that of hydrogen [11]. In addition, methane is considered a safer gas when compared to hydrogen. This review would be focused on general concepts on P2M, a detailed outlook on the biological methanation, and the techno-economic challenges of the process.
|
Fig. 1 Development of P2G process from lab to demonstration plants |
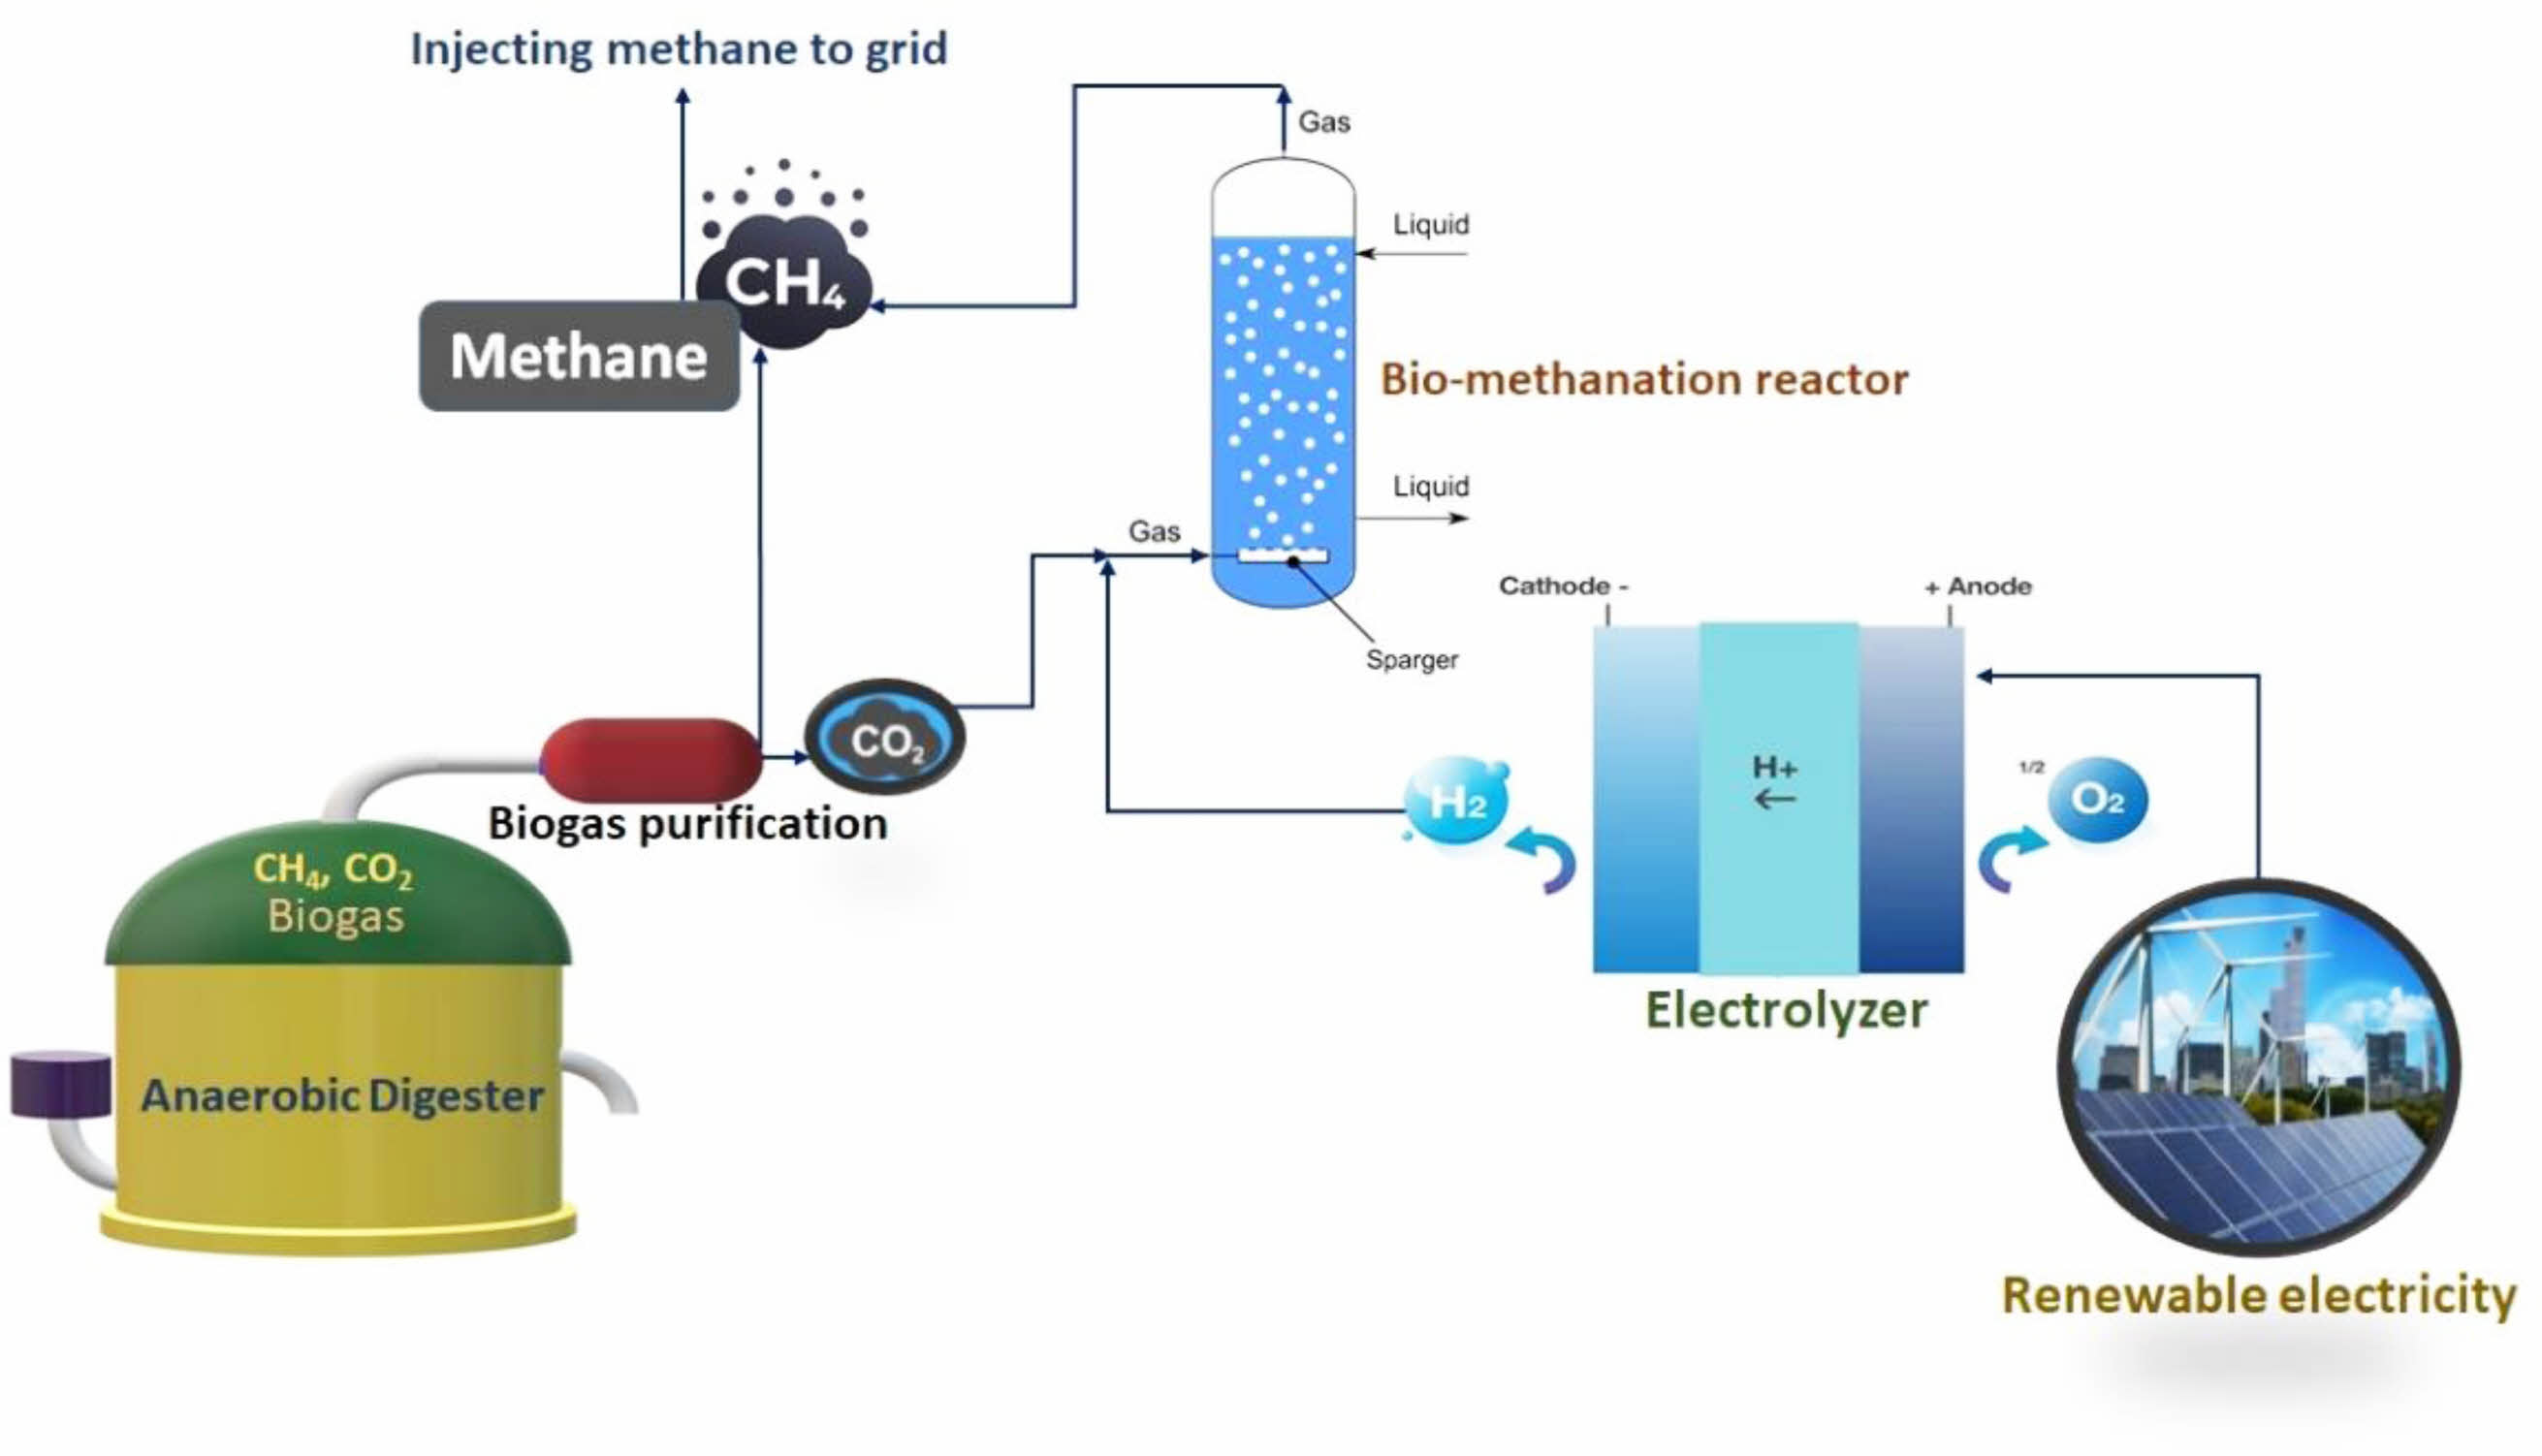
Hydrogen production is the first major step in the P2G process followed by the reduction of carbon dioxide to methane. The role of hydrogen in the process is to act as an electron donor for reducing carbon dioxide to methane [12]. Methane can be produced from CO2 using biological and chemical methods [13, 14]. The power to methane production process consists of two steps. Hydrogen generation is the first step in the process followed by identifying a suitable source for CO2 for methane production. Different scenarios were proposed by many research groups and have sourced hydrogen and CO2 from a wide range of sources for methanation. Hydrogen can be produced by using steam reforming of coal and natural gas or through electrolysis using an affordable electricity source [15]. The key driver for the development of P2G is the desire to decarbonize the energy system and, ultimately achieve carbon-neutrality. So, considering the environmental benefits of the P2G system, the electricity sourced from renewable sources is ideal for hydrogen generation in the P2G process (Fig. 2). The CO2 can be sourced from many different sources including biogas plants, waste incinerators, sewage plants, and various industries such as the cement and power industry [16]. The use of biogas produced in a typical anaerobic digester could also be used as a promising substrate for the P2M concept as it accounts for nearly 40% CO2. The methane content of the biogas could increase significantly above 95% if the biogas undergoes the P2M process [17]. Various microbial species were reported for carbon dioxide fixation under anaerobic conditions [18, 19]. The utilization of CO2 as a substrate for the P2M process enables to reduce the carbon emissions from an existing source [20].
There are a few pilot or demonstration P2G plants established globally, though these technologies are yet to reach a full-scale commercial-scale operation [21]. At this early stage of development, there is a wide range of system losses and overall conversion efficiencies. Broadly, the conversion efficiency of the production of hydrogen in the P2G process ranges from 60 to 70%, and the methanation step has an efficiency of 75-78% [22]. However, a significant amount of heat is lost from the methanation process, which brings down the overall efficiency of the P2G systems to around 55% in the currently installed demo or pilot plants [2]. Countries like Denmark and Germany top the list of demo or pilot scale projects in P2G processes. This review is focused on hydrogen production using an electrolyzer and methane production process based on biological methanation with a detailed outlook.
|
Fig. 2 Typical P2G process for biogas upgradation. |
Water electrolysis is commonly applied in the P2G process for hydrogen generation from renewable electricity [23]. An electrolyzer is a device that combines both oxidation and reduction reactions to produce hydrogen and oxygen [10, 24]. Different types of electrolyzers are being used for hydrogen generation from water, namely alkaline electrolyzer, proton exchange membrane electrolyzer, and solid oxide electrolyzer [2, 10].
Alkaline electrolysis is mature and developed technology, which is commonly used in pilot or demonstration projects, related to the power-to-gas process [10, 25]. An alkaline solution is generally used in this type of electrolyzer and it can be of any alkaline solution such as potassium hydroxide, sodium hydroxide, sodium chloride, etc. Most electrolyzers employ 20-40% potassium hydroxide solution as it provides higher electrical conductivity than NaOH under similar conditions [2, 26]. The water is reduced at the cathode to form hydrogen and hydroxide [27]. The hydroxide generated at the cathode moves into the anode through the diaphragm for oxygen generation. The anodic and cathodic reactions that occurred in an alkaline electrolyzer are given below [10, 28].

The major limitation of an alkaline electrolyzer is the application of highly corrosive alkaline solution as an electrolyte and its discharge. The stack lifetime of the alkaline electrolyzer is 60,000-90,000 hours [29]. Another problem with alkaline electrolyzer is intermittent and unbalanced operation conditions associated with electricity availability from renewable resources such as wind and solar power. These systems require 30-60 min startup time once it gets shut down [30].
Polymer electrolyte membrane (PEM) differs from alkaline electrolyzer in terms of the electrolyte being used. In PEM, the electrolyte used is polymer electrolyte. This concept was bought into reality by Grubb [31, 32] using a solid sulfonated polystyrene membrane as an electrolyte. This electrolyzer is more suitable to work with power fluctuations, as the fluctuations caused to the power supply can be quickly monitored and balanced by polymer membrane electrolytes [33]. In addition, its startup time is also much lower than that of an alkaline electrolyzer and has better performance with dynamic and intermittent systems. The hydrogen generated from the PEM electrolyzer is of high purity [5, 34]. However, this electrolyzer requires high purity deionized water for the electrolysis reaction and it adds to the capital cost of the P2G plant [35]. The anodic reaction of the PEM electrolyzer is the oxidation of water to produce oxygen, electrons, and protons. The cathodic reaction involves the reduction of protons to generate hydrogen. The protons will be moved from anode to cathode via a proton exchange membrane and electrons will be moved via an external circuit [36]. The reactions that occur at the anode and cathode of the PEM electrolyzer are given below

Solid oxide electrolyzeris the latest technology developed for water electrolysis and is currently demonstrated in the laboratory or developmental stage. The operation temperature is the major difference when compared to alkaline or PEM electrolysis. The alkaline and PEM electrolyzers are operated at temperatures below 100 oC, whereas the operational temperature of SOEs can go up to ten times (approximately 1000 oC) higher temperature than alkaline or PEM electrolyzers [13, 36]. At higher temperatures, approximately 20% less electrical energy is required for SOEs when compared to alkaline or PEM electrolyzers [21]. In addition, the drop in voltage such as ohmic voltage is decreased due to the higher temperature application of SOEs. Therefore, much higher efficiencies are being reported from SOEs when compared to PEM [13, 37]. Water or steam is reduced at the cathode for the production of hydrogen. The ions of oxide move the electrolyte to the anode and generate oxygen. Due to the application of high temperature, the degradation of materials and lack of long-term stability are the major drawbacks of these systems [2, 38]. Moreover, the product stream would be mixed the hydrogen and steam due to the high-temperature process, electrolyzer plant based on SOEs must have the facilities to separate steam from the mixture to obtain a pure H2 gas [2] and thereby increase the capital cost [36].
The hydrogen gas generated can either be used for methanation or in hydrogen refueling stations. Apart from the product hydrogen, other products can be generated from this unit operation are oxygen in gaseous form and the heat. The oxygen produced is of high quality and therefore it finds application in different sectors such as the metal industry and medical applications. Globally there are around 25 different demo or pilot-scale projects for hydrogen generation for injection or power production [39]. Europe’s first wind to hydrogen energy plant “Lolland Hydrogen Community”, Denmark came into the operation year of 2007 and the capacity of the plant was 104 kW. The electricity was sourced from a wind farm and the electrolysis was carried out using a PEM electrolyzer [39]. The largest power to hydrogen plant is “Energypark Mainz” Germany with an installed capacity of 3,750 kW using a PEM electrolyzer and electricity sourced from a wind farm. The other two major players in Germany are “Wind to Gas” Südermarsch and “WindGas” Falkenhagen. “Wind to Gas” Südermarsch [39, 40] uses a PEM electrolyzer and has a capacity of 2,400 kW and started its operation in 2018, whereas WindGas Falkenhagen [39, 40] uses an alkaline electrolyzer and its size is 2,000 kW, started operation in 2013. H2V project, a major hydrogen production facility in France is under construction and is planned to be operational by 2021. The initial installations are expected to produce 200,000 tons of hydrogen without any carbon release and the project is targeted to reach hydrogen production of 500,000 tons per year [41].
The major barrier to the deployment of low carbon technology is the higher capital cost associated with it [42]. In the case of hydrogen production, the maturity of the technology is a critical factor, which determines the capital expenditure (CAPEX). These processes or technologies are yet to become mature and according to the predictions of the expert community, these technologies become mature by 2030 [42, 43]. The current CAPEX of alkaline and PEM electrolyzer for hydrogen production is estimated to be 750-1,200 and 1,200-2,000 €/kWe including the deionized water system. This is expected to reduce once the technology is mature and the CAPEX is expected to be 400-600 and 400-1,700 €/kWe by 2030 [29, 43]. The source of electricity is a key variable and can be obtained from different sources including renewable plants such as solar PV or wind farms, the wholesale electricity market, or a mixture of these alternatives. Electricity sourced from renewable resources has advantageous as it is avoiding the necessity of using the electricity purchased, which is expensive for the whole process. Another advantage of renewable electricity is its lower environmental impact [43].
Methanation is the second major process step after the hydrogen production in the P2M process. CO2 is the substrate required for the P2M process along with hydrogen to produce methane. The CO2 can be sourced from different sources such as biomass processes [44], anaerobic digester [45], power generation plants (coal combustion, petroleum combustion, and biomass combustion), and finally from various industrial processes such as cement production, iron, steel production and from ethylene oxide production [13, 16, 46, 47]. Capturing CO2 from these different sources reduces onsite CO2 emissions and converts it into energy carriers such as methane. The CO2 sourced from the biomass process can be used directly without any further conditioning or purifications [16]. However, CO2 sourced from power generation plants and various industrial sources require purification or conditioning steps to remove unwanted compounds that can inhibit the methanation process, especially in the case of chemical conversion using catalysts. Though technically conditioning of exhaust gas is possible, the amount of CO2 present in the exhaust gas determines the economics of the CO2 purification processes. The higher the amount of CO2 present in the flue gas improves the economics of the CO2 purification process [47]. There are well-established processes or technologies for the purification of CO2 from the flue gas such as absorption, adsorption, membrane technology, and cryogenic distillation. A detailed review of the CO2 sources and their purification strategies can be found in the review published by Gahib and Ben-Fares [13].
In biological methanation microorganisms especially methanogenic archaea play a major role in methane production [10]. As they are highly substrate-specific, they can be classified into three types based on their capacity to utilize the substrates they are (i) hydro- genotrophic methanogens, who can produce methane using the substrate CO2 and H2 or formic acid (ii) acetoclastic methanogens which use acetic acid as the substrate and (iii) methylotrophic methanogens which use C1 and methylated compound as a substrate for methane production [48]. Temperature and pH are other important factors that determine the performance of methanogens [49]. Methanogens can be classified into two based on their optima temperatures, mesophilic (35 oC-45 oC) and thermophilic (55 oC to 65 oC) methanogens [2, 50]. The pH optima for methanogens depends on individual species though most of the methanogens’ favorable pH lies between 7.0 to 7.5 [10].
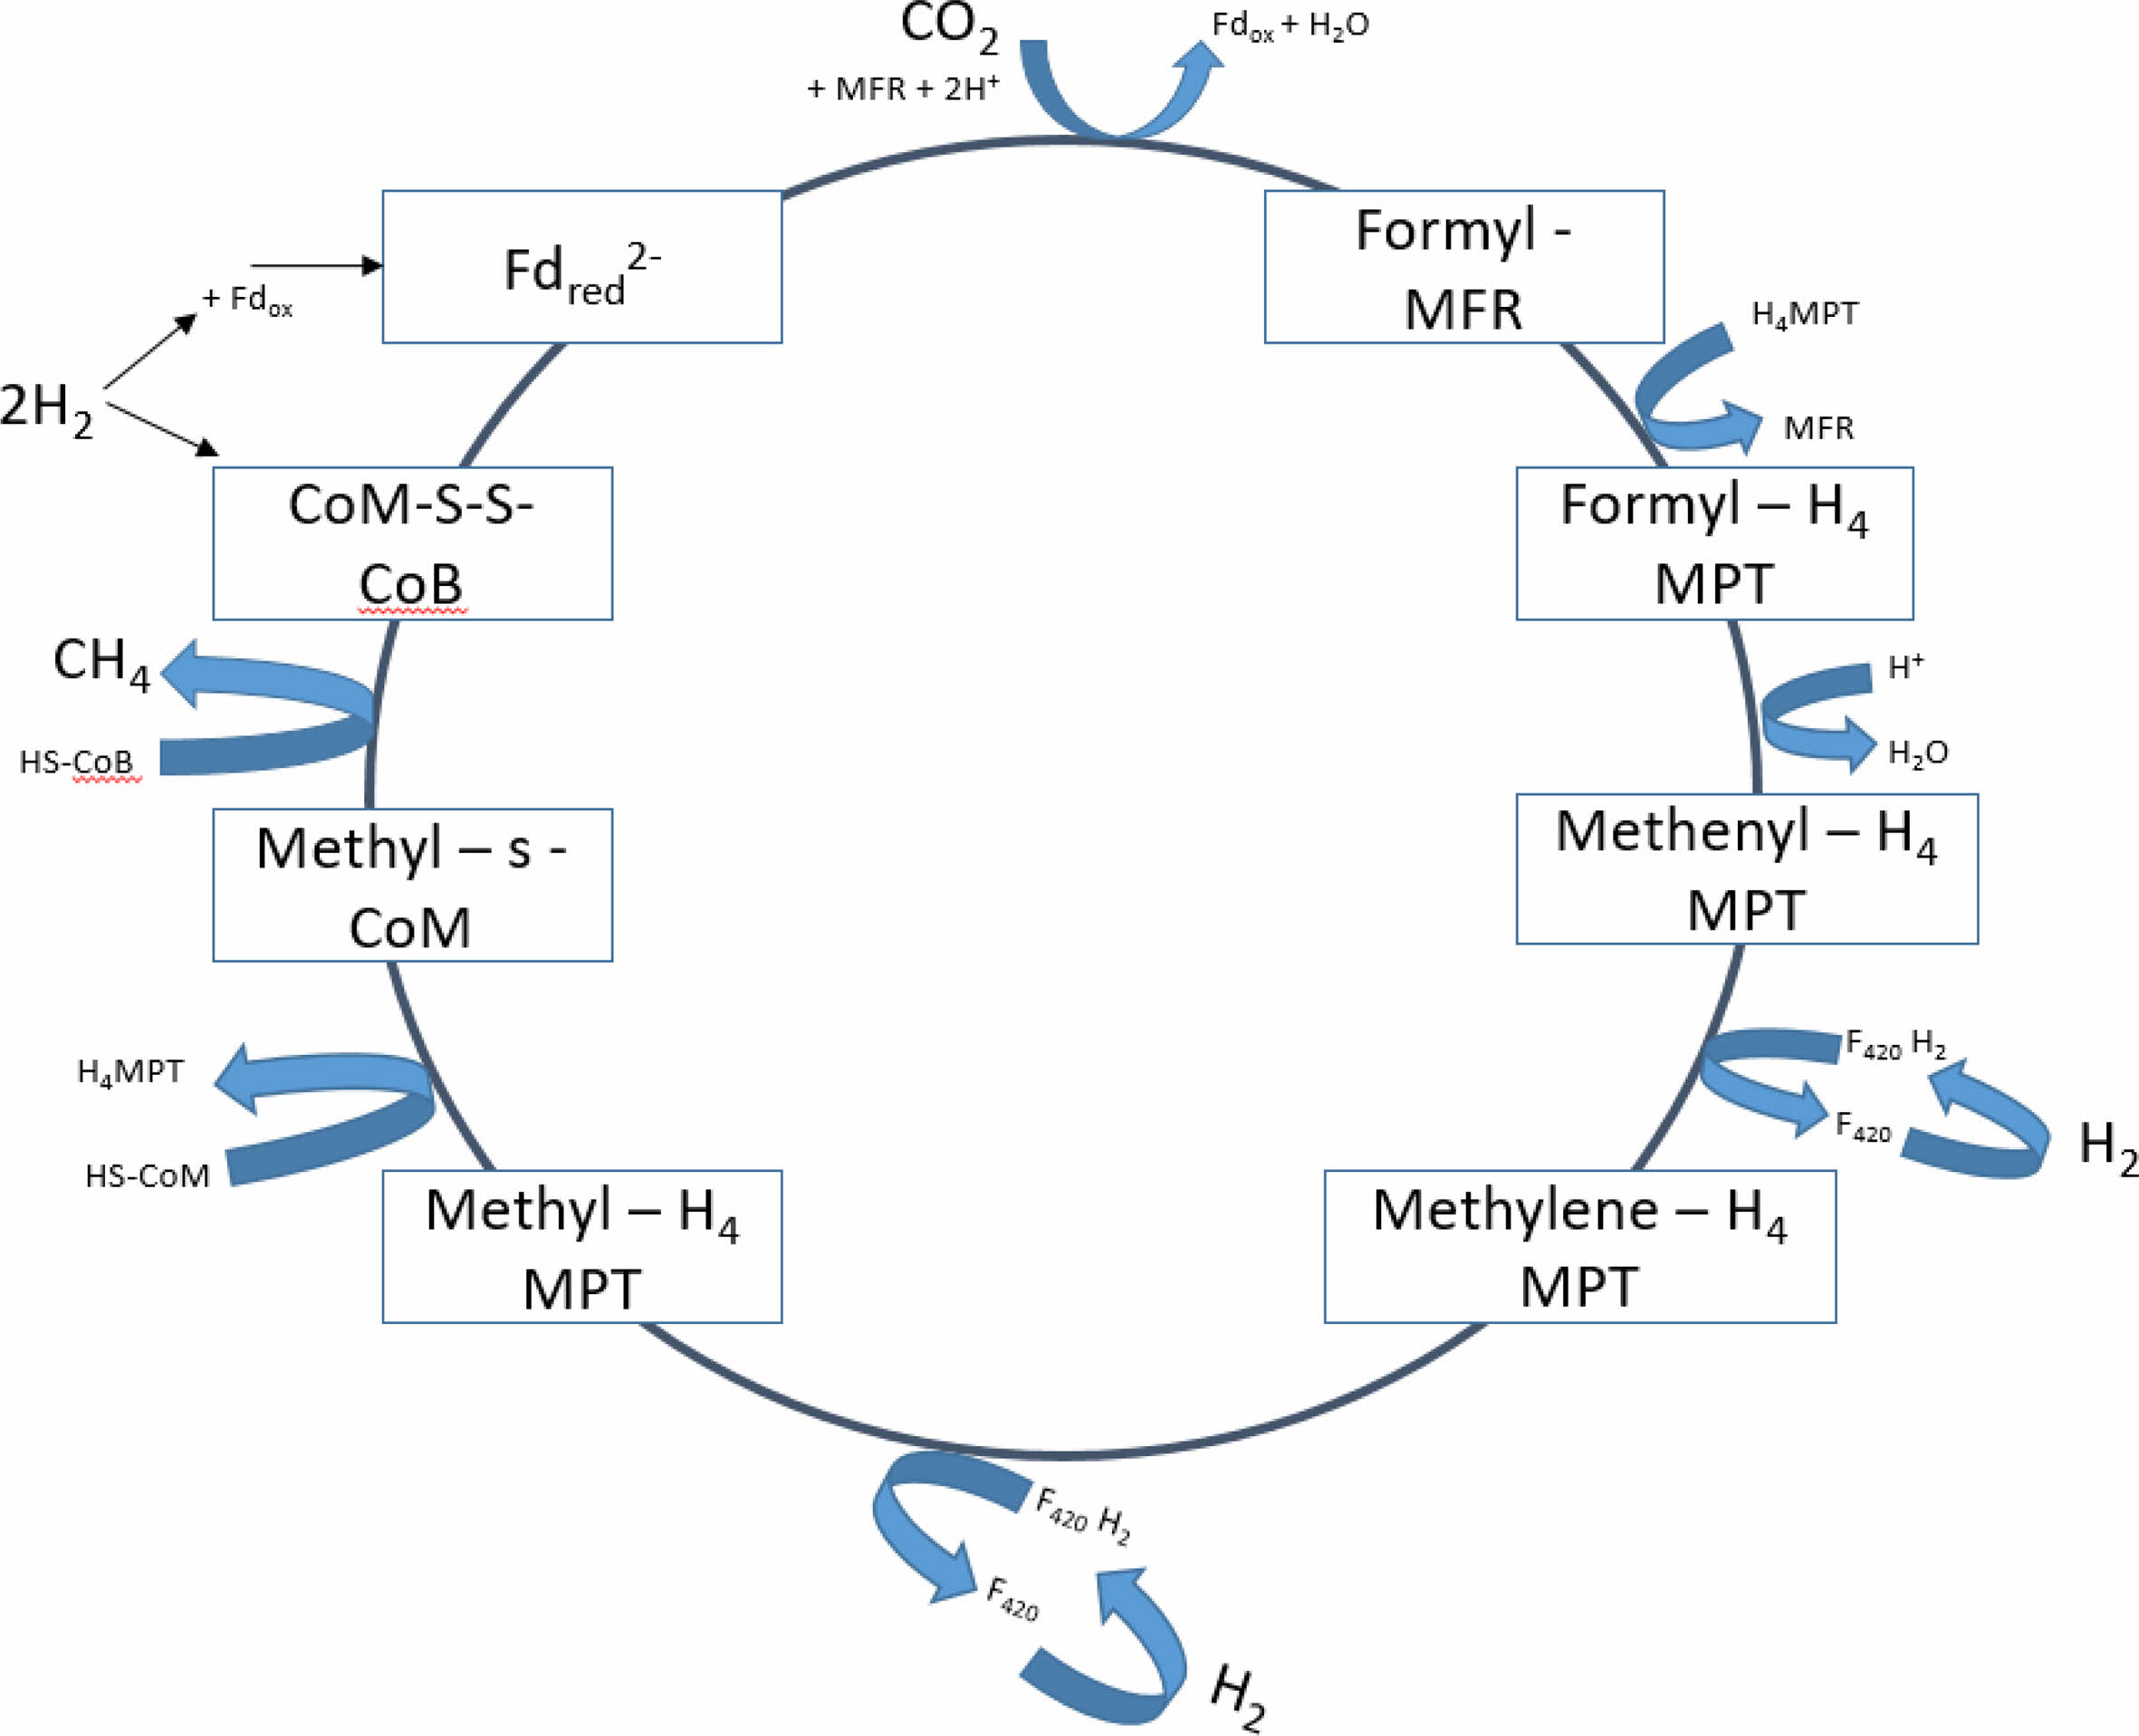
This process starts with the conversion of CO2 to methane with the reduction of CO2 to formyl- methanofuran with reduced ferredoxin which is regenerated by the reduction of oxidized ferredoxin by hydrogen [10, 12]. This reduction is endergonic and must be coupled to one of the three exergonic reactions involved in the pathway. Three different exergonic reactions involved in the process are, the first one is the transfer of the methyl group from methyl – H4MPT to CoM-SH with a ΔG of -30 kJ/mol. This process step is catalyzed by the enzyme complex MtrA-H, which is a membrane-associated and energy-conserving enzyme. This process step is depending on the buildup of an electrochemical sodium ion potential which drives ATP synthesis and ferredoxin reduction [10, 12]. The second exergonic reaction is catalyzed by a cytoplasmic methyl coenzyme M reductase which involves the reduction of methyl-coenzyme M with CoB-SH to methane and heterodisulphide CoM-S-S-CoB with a ΔG of -30 kJ/mol. This process step is not coupled with ferredoxin reduction or energy conservation. The third exergonic reaction is the reduction of CoM-S-S-CoB with H2 and is catalyzed by a cytoplasmic hydrogenase-hetrodisulhpide reductase complex. This is associated with the reduction of ferredoxin with H2 ΔG of +16 kJ/mol. CO2 reduction by hydrogenotrophic methanogens is given in Fig. 3 [10, 12].
|
Fig. 3 CO2 reduction pathway by hydrogenotrophic methanogens. |
The rate of hydrogen gas to liquid mass transfer is the major limiting factor in the hydrogenotrophic methanogenesis process (Table 1). The rate of gas to liquid mass transfer can be expressed using the equation

rt is the rate of hydrogen gas to liquid mass transfer (Lreactor·day-1), 22.4 is the volume of 1 mole of gas occupies at STP (L.mol-1), kLa is the gas transfer coefficient (day-1), H2g is the hydrogen concentration in the gas phase (mol·L-1) and H2l is the dissolved hydrogen in the liquid phase (mol·L-1) [10, 51]. From the above equation, it is clear that the rate of hydrogen mass transfer from the gas to the liquid phase is directly proportional to kLa. The gas transfer coefficient, kLa of the system depends upon different factors or operational parameters such as stirring, gas recirculation, type and pore size of the gas diffuser, and rate of gas recirculation. Since hydrogen mass transfer limit is one of the key parameters in the process, reactor design should be focused on the intensification of mass transfer. Different types of reactor configurations are studied by researchers on biogas upgrading to enrich the methane content by using pure hydrogenotrophic cultures or enriched hydrogenotrophic inoculum. Depending upon the type of reactor configuration, the final methane content can be varying from 75% to 98%. Though the temperature is a factor that affects the bio-methanation process, most of the studies are being focused on thermophilic conditions as they could yield more than 60% conversion compared to mesophilic conditions [52]. The commonly used bioreactors for methanation are batch reactor, trickle bed reactor, up-flow reactor, bubble column reactor, fixed bed reactor, and continuous stirred tank reactor (CSTR).
The study by Luo and Angelidaki [52] and Bassani et al. [53] also concluded that a higher mixing speed is essential when mixed cultures were used in thermophilic conditions for methane enrichment in biogas. Bassani et al. [53] studied the up-flow reactors for ex-situ biogas upgrading and concluded that gas diffusion device and gas recirculation rate are critical factors for ex-situ biogas upgrading in up-flow reactors. The methane content in the output gas was increased from 23% to 96% and a maximum theoretical methane yield was achieved in the study. Kougias et al. [54] studied the different reactor configurations namely up-flow series, continuously stirred tank, and bubble column reactor for the methanation process. The study concluded that both up-flow series and bubble column reactors resulted in methane content above 98%. Membrane bioreactors are another type of reactor used for bio-methanation using hydrogenotrophic methanogens. The gas dispersion through a polymeric membrane in a hollow fiber reactor was studied by Diaz et al. [55] for methane production using CO2 and H2. A maximum kLa value of 430 h-1 for H2 was obtained in the study. A biomethane yield of 0.22 m3 (m3 d)-1 was obtained and the maximum gas loading rate was 40 m3 H2 (m3 d)-1. Alfaro et al. [56] studied the 60L pilot scale ceramic membrane bioreactor for hydrogenotrophic methanogenesis at different loading rates of H2 varying from 10 to 30 m3 (m3 d)-1 and the reactor converted more than 95% of the input gas with a yield of 0.22 m3 (m3 d)-1. A maximum kLa value of 268 h-1 was obtained at a maximum loading of 30 m3 H2 (m3 d)-1. Wang et al. [57] attempted the bio-methanation of coke oven gas with in-situ biogas upgrading. The coke oven gas was passed through the hollow fiber membrane module fitted inside the digester and maximum methane content of 99% was achieved with in-situ biogas upgrading. Rachbauer et al. [58] studied the biogas up-gradation in an immobilized trickle bed reactor. The reactor was operated for 8 months and biogas produced from the 0.5 m3 plant was continuously fed into the trickle bed reactor. More than 96% of CO2 was efficiently converted into methane and the methane content in the outlet of the reactor was above 96% and hydrogen present was less than 1%.
A few approaches that are being practiced for better hydrogen gas to liquid mass transfer in hydrogen- otrophic methanogenesis are pressurizing the gas on headspace and reducing the diffuser pore size for gas sparging and gas recirculation. Ullrich et al. [59] studied the effect of operating pressure on biological methanation in a trickle bed reactor as the pressure increases the partial pressure of hydrogen which improves the mass transfer and solubility of H2. With increasing pressure from 1.5 bar to 9 bar, the methane content in the exit gas has significantly increased from 64% to 86%. Gas recirculation is an important factor to overcome the limitations associated with gas to liquid to a certain limit. Guiot et al. [60] studied the influence of CO utilization on the production of CH4 at different rates of gas recirculation. Only 4% of CO was utilized without gas recirculation. The CO utilization was improved to 70% when the gas recirculation to feeding ratio was increased to 18:1. The authors concluded that the process was mass transfer limited and the conversion efficiency could be improved by gas recirculation. Bassani et al. [61] studied the major parameters which hydrogen mass transfer rate depends upon in an in-situ biogas upgrading up-flow anaerobic sludge blanket reactor (UASB) reactor. Hydrogen distribution was improved through the application of porous inert devices such as alumina ceramic sponges or with the help of rushing rings. The authors have further studied the ex-situ biogas upgrading in up-flow reactors using different pore size diffusers and gas recirculation rates. The kLa was significantly improved by 36% when high gas recirculation rate was employed [62]. As an outcome of gas recirculation and diffuser pore size, nearly 100% hydrogen utilization was obtained when the hydrogen flow rate was set up to 3.6 L/(Lreactor·d). Liu et al. [63] studied the hydrogen mass transfer in a stirred tank reactor using a micro-nano sparger and a common micro sparger. Micro-nano sparger was found to be superior in terms of methane evolution rate and biomass growth rate when compared to the common micro sparger. A maximum hydrogen utilization of 95% was obtained after 20 days in a micro-nano sparger and that of 80% was obtained in a common micro sparger after 25 days.
|
Table 1 Comparison of kLa in different biological methanation reactors |
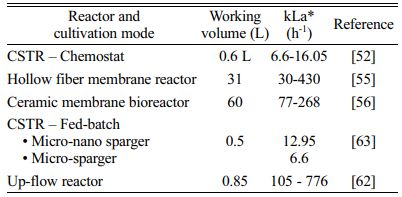
*kLa – volumetric mass transfer coefficient |
Biogas can be upgraded to increase its methane content in different ways including physical, chemical, and biological methods [64]. In biological methods, biogas up-gradation using hydrogen and carbon dioxide can be classified into in-situ and ex-situ approaches [54]. In the in-situ biogas upgrading process, the hydrogen is injected into the biogas digester, where it reacts with the carbon dioxide present in the biogas. The carbon dioxide is reduced by hydrogen to form methane and thereby enriching the percentage of methane content in biogas [18]. This process can enrich the methane content by up to 99%. However, strict monitoring of pH is crucial in this process. Once the pH of the system reaches above 8.5, the methanogenesis process gets inhibited. As CO2 is dissolved in the medium, it dissolved into H+ and HCO3-. Once the CO2 is utilized for methane production, the H+ will get reduce and increase pH due to bicarbonates [51].

Another problem associated with the direct injection of hydrogen into the anaerobic reactor is the increase in partial pressure of hydrogen, which affects the conversion of Volatile Fatty acids (VFAs) and alcohol to methane [65]. In the ex-situ biogas upgrading process, the biogas CO2 is obtained from biogas mixed with hydrogen in a separate reactor which is either enriched or pure culture of hydrogenotrophic methanogens for the formation of methane. The greatest advantage of this system is that it does not interrupt the anaerobic digestion process or VFA degradation. This process can avoid the issues related to the increase of pH and inhibition of VFA degradation. A major challenge in this process is the solubility of hydrogen in the liquid media, which is due to the low gas to the liquid mass transfer rate of hydrogen [51]. The solubility of hydrogen in the media depends upon many factors such as temperature, pressure, gas dispersion device and reactor configurations, etc. [64].
Luo and Angelidaki [64] attempted upgrading biogas using enriched hydrogenotrophic methanogens in a separate reactor using both thermophilic and mesophilic conditions. The methane gas enrichment was approximately 60% higher in thermophilic conditions when compared with mesophilic conditions. Continuous addition of hydrogen gas into biogas was studied and a maximum of 95% CH4 was obtained when the biogas and H2 were injected at the rate of 6 L (L·day)-1. The increased flow rate to 12 L (L·day)-1, decreased the methane content to 90% demonstrating that mass transfer is the rate-limiting step in this process. Further increasing the stirrer speed from 500 to 800 rpm, a 95% methane was obtained. In another study conducted by Luo and Angelidaki [64], a hollow fiber membrane was used instead of stirred tank reactor. The system achieved a CH4 content above 90% and CH4 content was found to be increasing further up to 96% with an increasing H2 flow rate. Rachbauer et al. [58] studied the biogas upgrading potential in a trickle bed reactor using immobilized hydrogenotrophic methanogens for a period of 8 months. The highest H2 loading rate applied in this study was 6.5 m3 hydrogen. m3 reactor-1 and the methane content in the exit gas was above 96%. This study demonstrates the operational stability of biological biogas upgrading systems for a period of 8 months of continuous operation.
Martin et al. [66] studied the pure culture of Methanothermobacter thermautotrophicus for the conversion of H2 and CO2 to methane or by upgrading the biogas to methane [66]. Their study observed a maximum volumetric methane production rate of 49.2 L (L·day)-1 which was further increased to 65.6 L (L·day)-1 under pressurization of the headspace gas from 101 kPa to 122 kPa. Chen et al. [67] compared the effects of pressure on the methane production reactor. A drop in pH value was observed from 7.2 to 6.5 when the pressure was increased from 1 bar to 9 bar. Though this pH drop did not cause a major issue to anaerobic digestion such as stopping the AD process, it slightly affected the methane enrichment in the biogas as the percentage of methane increased from 66% to 75% when the pressure was increased from 1 to 9 bar.
Power to Gas is one of the upcoming and promising alternatives to energy storage and provides flexibility to the renewable electricity system. The economic assessment of power to gas systems is very important for understanding and improvising the system more efficiently in the long run [55]. The policymakers should not be focused only on the economic profitability alone as the usage of conventional fuels may lead to affect the air quality which finally affects the ecosystem [39].
An integrated techno-economic and life cycle assessment of P2G systems was studied by Parra et al. [68] using a PEM electrolyzer and chemical methanation. The price of methane produced using a 1 MW P2M system is five times costlier than conventional natural gas. Other value addition opportunities such as waste heat and oxygen generated during the process need to be considered for improving the economic viability of the P2M system. Even after considering the value addition scenarios, the cost of methane produced by P2M technology is three times higher than conventional natural gas. The study assessed the possibility of atmospheric CO2 as a source for bio-methanation and concluded that this approach is economically not feasible due to the high capital cost required for purifying the CO2 obtained from the atmosphere and together with lower efficiency. The study also concluded that the source of electricity supply is the key factor that determines the impact of life cycle assessment. The environmental benefit of the P2M system was observed when electricity was sourced from a renewable process when compared to the conventional gas process.
Collet et al. [69] compared the economic and life cycle assessments of three different configurations of power to gas systems against natural gas. The three different configurations were (a) CH4 from CO2 obtained after biogas upgrading, (b) direct methanation of biogas, and (c) CH4 obtained from biogas without methanation. From the life cycle assessments, they concluded that continuous P2G systems have more greenhouse gas impacts than intermittent P2G systems. The sources of electricity are the key factor that determines the impact of life cycle assessment. The authors conclude that the economics of the P2G process could be improved by the development of low electricity-consuming electrolyzers and the incorporation of carbon credits from CO2 valorization (Table 2). Gotz et al. [2] compared the biological and chemical methanation in the P2G system and concluded that biological methanation is suitable for small-scale plant sizes, isothermal catalytic methanation concepts for medium-sized plants and fixed bed methanation is best suited to large-scale power plants. In addition, biological methanation has advantages over chemical methanation due to its lower temperature and high tolerance to impurities. However, the process requires much larger rector volumes and the gas hour space velocity (GHSV) obtained is much lower than the chemical methanation process.
The efficiency of converting methane to electricity is also a matter of concern especially if the end application of P2G is for electricity production. Ajanovic and Hass [70] looked into the potential of the P2G system for producing methane from wind power and the re-electrification of methane. The overall efficiency of those systems is only about 33% without accounting for the utilization of waste heat and oxygen generated during electrolysis. The authors conclude that P2G systems may have a promising future in the transportation sector due to the higher and increasing prices of transport fuels compared to decrease or stagnant electricity prices.
|
Table 2 Techno-economic comparison of alkaline and PEM electrolyzers |
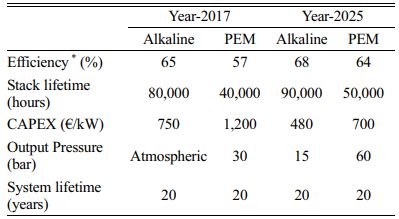
*Based on lower heating value Adapted from [Ref.71] |
P2G is emerged as an approach to store the excess power from renewable technologies such as wind and solar power in the form of either hydrogen or methane and can provide support to the fluctuations that occurred during the off-peak periods of the renewable electricity system. Though these technologies are crucial for the smooth running of the proposed systems, these technologies are at the early stages of demonstration or implementation. Currently, the overall efficiency of converting electricity to methane and re-electrification of methane to electricity is very low. The present high production cost of hydrogen through electrolysis and the low gas to liquid mass transfer efficiency of hydrogen gas is the key technical challenges of the P2M process. The commercial-scale viability depends on the efficiency of each stage in the P2M process. The emerging technologies that address these issues will improve the economic feasibility of the process.
This work was supported by the Korea Institute of Energy Technology Evaluation and Planning(KETEP) and the Ministry of Trade, Industry & Energy(MOTIE) of the Republic of Korea (No. 2019281010007B), and by the “Graduate School of Post Plastic Specialization” of Korea Environmental Industry & Technology Institute grant funded by the Ministry of Environment, Republic of Korea.
- 1. IEA, in “Renewables 2021: Analysis and forecasts to 2026” (International Energy Agency, 2021) p.14-15.
-

- 2. M. Götz, J. Lefebvre, F. Mors, A.M. Koch, F. Graf, S. Bajohr, R. Reimert, and T. Kolb, Renew. Energy. 85 (2016) 1371-1390.
-
- 3. A. Sternberg, and A. Bardow, Energy Environ. Sci. 8[2] (2015) 389-400.
-
- 4. A. Mazza, E. Bompard, and G. Chicco, Renew. Sust. Energ. Rev. 92 (2018) 794-806.
-
- 5. G. Gahleitner, Int. J. Hydrog. Energy. 38[5] (2013) 2039-2061.
-
- 6. S. Niaz, T. Manzoor, and A.H. Pandith, Renew. Sust. Energ. Rev. 50 (2015) 457-469.
-
- 7. M. Ball, and M. Weeda, Int. J. Hydrog. Energy. 40[25] (2015) 7903-7919.
-
- 8. S. Lia, Q. Shen, and B. Sunden, J. Ceram. Process. Res. 21[2] (2020) 263-268.
-
- 9. J. Kim, J. Seo, H.K. Jung, S H. Kim, and H.W. Lee, J. Ceram. Process. Res. 13[1] (2012) 42-46.
- 10. F. Zhang, P. Zhao, M. Niu, and J. Maddy, Int. J. Hydrog. Energy. 41[33] (2016) 14535-14552.
-
- 11. P.D. Lund, J. Lindgren, J. Mikkola, and J. Salpakari, Renew. Sust. Energ. Rev. 45 (2015) 785-807.
-
- 12. P.K. Thauer, Proc. Natl. Acad. Sci. U.S.A. 109[38] (2012) 15084-15085.
-
- 13. K. Ghaib, and F. Ben-Fares, Renew. Sus. Energ. Rev. 81 (2018) 433-446.
-
- 14. F.D. Meylan, F.P. Piguet, and S. Erkman, J. Energy Storage. 11 (2017) 16-24.
-
- 15. A. Al-sharafi, A.Z. Sahin, T. Ayar, and B.S. Yilbas, Renew. Sust. Energ. Rev. 69 (2017) 33-49.
-
- 16. R. O’shea, D.M. Wall, S. McDonagh, and J.D. Murphy, Renew. Energy. 114 (2017) 1090-1100.
-
- 17. L. Deng, and M.B. Hägg, Int. J. Greenh Gas Control. 4 [4] (2010) 638-646.
-
- 18. J. Lee, J. Chun, O. Choi, and B.-I. Sang, J. Ceram. Process. Res. 21[5] (2020) 602-608.
-
- 19. Y. Kim, and S. Lee, J. Ceram. Process. Res. 18[4] (2017) 285-290.
- 20. J. Vanderwalle, K. Bruninx, and W. D’haeseleer, Energy Convers. Manag. 94 (2015) 28-39.
-
- 21. A. Brisse, J. Schefold, and M. Zahid, Int. J. Hydrog. Energy. 33[20] (2008) 5375-5382.
-
- 22. M. Lehner, R. Tichler, H. Steinmüller, and M. Koppe, in “Power-to-Gas: Technology and Business Models” (Springer Briefs in Energy, 2014) p.7-17.
-
- 23. V.R. Jothi, K. Karuppasamy, T. Maiyalagan, H. Rajan, C.-Y Jung, and S.C. Yi, Adv. Energy Mater. 10 (2020) 1904020.
-
- 24. N.T.M. Nguyet, N.H.H. Phuc, V.-D. Vuong, T.V. Khai, M.T. Phong, and L.V. Thang, J. Ceram. Process. Res. 20[2] (2019) 148-151.
- 25. S. Anantharaj, S. Noda, V. R. Jothi, S.C. Yi, M. Driess, and P. W. Menezes, Angew. Chem. Int. Ed. 60 (2021) 18981-19006.
-
- 26. R.J. Gilliam, J.W. Graydon, D.W. Kirk, and S.J. Thorpe, Int. J. Hydrog. Energy. 32[3] (2007) 359-364.
-
- 27. A. Abraham, V.R. Jothi, J. Lee, S.C. Yi, and B.-I. Sang, Cellulose 27 (2020) 8135-8146.
-
- 28. V.R. Jothi, R. Bose, H. Rajan, C. Jung, and S.C. Yi, Adv. Energy Mater. 8 (2018) 1802615.
-
- 29. L. Bertuccioli, A. Chan, D. Hart, F. Lehner, B. Madden, and E. Standen, in “Study on development of water electrolysis in the EU, Final report” (E4tech element Energy, 2014) p.1-160.
- 30. O. Ulleberg, T. Nakken, and A. Ete, Int. J. Hydrog. Energy. 35[5] (2010) 1841-1852.
-
- 31. W.T. Grubb, J. Phys. Chem. 63 (1959) 55-67.
-
- 32. A. Hassan, M.K. Patel, and D. Parra, Int. J. Hydrog. Energy. 44[19] (2019) 9577-9593.
-
- 33. R. Bhandari, C.A. Trudewind, and P. Zapp, J. Clean. Prod. 85 (2014) 151-163.
-
- 34. F. Barbir, Sol. Energy. 78[5] (2005) 661-669.
-
- 35. J. Turner, G. Sverdrup, M.K. Mann, P.-C. Maness, B. Kroposki, and M. Ghirardi, Int. J. Energy Res. 32[5] (2008) 379-407.
-
- 36. M.J.S. Zuberi, F. Bless, J. Chambers, C. Arpagaus, S.S. Bertsch, and M.K. Patel, Appl. Energy. 228 (2018) 390-408.
-
- 37. M.A. Laguna-Bercero, J. Power Sources. 203 (2012) 4-16.
-
- 38. A. Ursua, L.M. Gandia, and P. Sanchis, Proc. IEEE. 100[2] (2012) 410-426.
-
- 39. C.J. Quarton, and S. Samsatli, Renew. Sust. Energ. Rev. 98 (2018) 302-316.
-
- 40. D. Garcia, F. Barbanera, F. Cumo, U.D. Matteo, and B. Nastasi, Energies. 9[11] (2016) 963.
-
- 41. H2V Product, in “website: H2V PRODUCT - Green Gas for Everyone” (http://www.h2vproduct.net).
-
- 42. P.E. Dodds, I. Staffel, A.D. Hawkes, F. Li, P. Grunewald, W. McDowall, and P. Ekins, Int. J. Hydrog. Energy. 40[5] (2015) 2065-2083.
- 43. D. Parra, L. Valverde, F.J. Pino, and M.K. Patel, Renew. Sust. Energ. Rev. 101 (2019) 279-294.
-
- 44. M. Balat, H. Balat, and C. Oz, Prog. Energy Combust. Sci. 34[5] (2008) 551-573.
-
- 45. R. Munoz, L. Meier, I. Diaz, and D. Jeison, Rev. Environ. Sci. Biotechnol. 14 (2015) 727-759.
-
- 46. J. Ling, P. Xiao, A. Ntiamoah, D. Xu, P. Webley, and Y. Zhai, Chin. J. Chem. Eng. 24[4] (2016) 460-467.
-
- 47. B. Metz, O. Davidson, H. de Coninck, M. Loos, and L. Meyer, In “Carbon dioxide capture and storage, IPCC Special Report” (Cambridge University Press, 2005) p.1.
- 48. B. Demirel, and P. Scherer, Rev. Environ. Sci. Biotechnol. 7 (2008) 173-190.
-
- 49. O. Choi, M. J. Kim, Y. Go, M.-G. Hong, B. Kim, Y. Shin, S. Lee, Y. G. Kim, J. S. Joo, B. S. Jeon, and B.-I Sang, Energies, 12 (2019) 4130.
-
- 50. B.K. Ahring, A.A. Ibrahim, and Z. Mladenovska, Water Res. 35[10] (2001) 2446-2452.
-
- 51. I. Angelidaki, L. Treu, P. Tsapekos, G. Luo, S. Campanaro, H. Wenzel, and P.G. Kougias, Biotechnol. Adv. 36[2] (2018) 452-466.
-
- 52. G. Luo, and I. Angelidaki, Biotechnol. Bioeng. 109[11] (2012) 2729-2736.
-
- 53. I. Bassani, P.G. Kougias, L.Treu, and I Angelidaki, Environ. Sci.Technol. 49[20] (2015) 12585-12593.
-
- 54. P.G. Kougias, L. Treu, D.P. Benavente, K. Boe, S. Campanaro, and I. Angelidaki, Bioresour. Technol. 225 (2017) 429-437.
-
- 55. I. Diaz, C. Perez, N. Alfaro, and F. Fdz-Polanco, Bioresour. Technol. 185 (2015) 246-253.
-
- 56. N. Alfaro, M. Fdz-Polanco, F. Fdz-Polanco, and I. Díaz, Bioresour. Technol. 258 (2018) 142-150.
-
- 57. W. Wang, L. Xie, G. Luo, Q. Zhou, and I. Angelidaki, Bioresour. Technol. 146 (2013) 234-239.
-
- 58. L. Rachbauer, G. Voitl, G. Bochmann, and W. Fuchs, Appl. Energy. 180 (2016) 483-490.
-
- 59. T. Ullrich, J. Lindner, K. Bär K, F. Mörs, F. Graf, and A. Lemmer, Bioresour. Technol. 247 (2018) 7-13.
-
- 60. S.R. Guiot, R. Cimpoia, and G. Carayon, Environ. Sci. Technol. 45[5] (2011) 2006-2012.
-
- 61. I. Bassani, P.G. Kougias, and I. Angelidaki, Bioresour. Technol. 221 (2016) 485-491.
-
- 62. I. Bassani, P.G. Kougias, L. Treu, H. Potre, S. Kampanaro, and I. Angelidaki, Bioresour. Technol. 234 (2017) 310-319.
-
- 63. Y. Liu, Y. Wang, X. Wen, K. Shimizu, Z. Lei, M. Kobayashi, Z. Zhang, I. Sumi, Y. Yao, and Y. Mogi, RSC Adv. 8 (2018) 26488-26496.
-
- 64. G. Luo, and I. Angelidaki, Biotechnol. Bioeng. 109[11] (2012) 2729-2736.
-
- 65. D.J. Batstone, J. Keller, I. Angelidaki, S.V. Kalyuzhnyi, S.G. Pavlostathis, A. Rozzi, W.T. Sanders, H. Siegrist, and V.A. Vavilin, Water Sci. Tech. 45[10] (2002) 65-73.
-
- 66. M.R. Martin, J.J. Fornero, R. Stark, L. Mets, and L.T. Angenent, Archaea. 2013; ID 157529.
-
- 67. Y. Chen, B. Robler, S. Zielonka, A. Lemmer, A. Wonneberger, and T. Jungbluth. Appl. Energy. 116 (2014) 409-415.
-
- 68. D. Parra, and M.K. Patel, Int. J. Hydrog. Energ. 41[18] (2016) 3748-3761.
-
- 69. P. Collet, E. Flottes, A. Favre, L. Raynal, H. Pierre, S. Capela, and C. Peregrina, Appl. Energy. 192 (2017) 282-295.
-
- 70. A. Ajanovic, and R. Haas, Wiley Interdiscip. Rev. Energy Environ. 8[1] (2019) e318.
-
- 71. IRENA. in “Hydrogen from Renewable Power: Technology outlook for the energy transition” (International Renewable Energy Agency, Abu Dhabi, 2018) p.1.
 This Article
-
2022; 23(6): 853-861
Published on Dec 31, 2022
- 10.36410/jcpr.2022.23.6.853
- Received on May 24, 2022
- Revised on Jul 12, 2022
- Accepted on Jul 21, 2022
Services
- Abstract
introduction
power to methane production process
hydrogen production in the p2g process using renewable electricity
biological methanation process in p2g systems
methane production using hydrogenotrophic methanogenesis
reactor configurations and operational parameters for biomethanation
upgrading biogas using biological methanation
systems analysis and economic assessments
conclusion
- Acknowledgements
- References
- Full Text PDF
Shared
Correspondence to
- Amith Abraham
-
Department of Chemical Engineering, Hanyang University, 222 Wangsimni-ro, Seongdong-gu, Seoul 04763, Republic of Korea
Tel : +82-2-2220-2328 Fax: +82-2-2220-4716 - E-mail: amithabraham@hanyang.ac.kr, biosang@hanyang.ac.kr
Clean-Energy Research Institute(CRI), Hanyang University, 222, Wangsimni-ro, Seongdong-gu, Seoul, 04763, Korea
E-mail: jcpr@hanyang.ac.kr